A modified Arcan test to analyze the behavior of composites and their assemblies under out-of
18
Please note that this is an author-produced PDF of an article accepted for publication following peer review. The definitive publisher-authenticated version is available on the publisher Web site 1 Composites Part A: Applied Science and Manufacturing January 2011, Volume 42, Issue 1, Pages 111-121 http://dx.doi.org/10.1016/j.compositesa.2010.10.012 © 2010 Elsevier Ltd All rights reserved. Archimer http://archimer.ifremer.fr A modified Arcan test to analyze the behavior of composites and their assemblies under out-of-plane loadings J.Y. Cognard a, * , L. Sohier b and P. Davies c a Brest Laboratory of Mechanics and Systems, ENSIETA, 29806 Brest Cedex 09, France b Brest Laboratory of Mechanics and Systems, UBO, 29285 Brest Cedex, France c IFREMER, Centre de Brest, Materials & Structures Group, 29280 Plouzané, France * Corresponding author : J.Y. Cognard, Tel.: +33 2 98 34 88 16; fax: +33 2 98 34 87 30, email address : jean- [email protected] Abstract: Composite materials are a key element in weight reduction strategies, so the analysis of the mechanical behavior of assemblies of composite modules is of great importance. Failure initiation in bonded assemblies involving composites is often associated with crack initiation in the adhesive or delamination of the composite plies close to the adhesive joint, caused by interlaminar or through- thickness stresses. Thus, the analysis of the behavior of composites and their assemblies under out- of-plane loadings is necessary in order to optimize such structures. However, few experimental devices are proposed in the literature and they often require thick composite specimens which are not representative of most industrial applications. This paper describes the use of a modified Arcan test to determine the behavior of composites and hybrid bonded assemblies over a wide range of tensile– shear out-of-plane loadings. The key advantages of this fixture are the testing of thin composite plates and the use of an adhesive to fix samples. Moreover, an optimization of the design of the proposed device, based on finite element simulations, significantly limits the influence of edge effects in order to obtain accurate experimental results. Some test results are presented which underline the potential of the proposed approach. Keywords: A. Laminates; B. Adhesion; B. Stress concentrations; D. Mechanical testing
Transcript of A modified Arcan test to analyze the behavior of composites and their assemblies under out-of

Ple
ase
note
that
this
is a
n au
thor
-pro
duce
d P
DF
of a
n ar
ticle
acc
ept
ed fo
r pu
blic
atio
n fo
llow
ing
peer
rev
iew
. The
def
initi
ve p
ub
lish
er-a
uthe
ntic
ated
ve
rsio
n is
ava
ilab
le o
n th
e pu
blis
her
Web
site
1
Composites Part A: Applied Science and Manufacturing January 2011, Volume 42, Issue 1, Pages 111-121 http://dx.doi.org/10.1016/j.compositesa.2010.10.012 © 2010 Elsevier Ltd All rights reserved.
Archimerhttp://archimer.ifremer.fr
A modified Arcan test to analyze the behavior of composites and their assemblies under out-of-plane loadings
J.Y. Cognarda, *, L. Sohierb and P. Daviesc
a Brest Laboratory of Mechanics and Systems, ENSIETA, 29806 Brest Cedex 09, France b Brest Laboratory of Mechanics and Systems, UBO, 29285 Brest Cedex, France c IFREMER, Centre de Brest, Materials & Structures Group, 29280 Plouzané, France * Corresponding author : J.Y. Cognard, Tel.: +33 2 98 34 88 16; fax: +33 2 98 34 87 30, email address : [email protected] Abstract:
Composite materials are a key element in weight reduction strategies, so the analysis of the mechanical behavior of assemblies of composite modules is of great importance. Failure initiation in bonded assemblies involving composites is often associated with crack initiation in the adhesive or delamination of the composite plies close to the adhesive joint, caused by interlaminar or through-thickness stresses. Thus, the analysis of the behavior of composites and their assemblies under out-of-plane loadings is necessary in order to optimize such structures. However, few experimental devices are proposed in the literature and they often require thick composite specimens which are not representative of most industrial applications. This paper describes the use of a modified Arcan test to determine the behavior of composites and hybrid bonded assemblies over a wide range of tensile–shear out-of-plane loadings. The key advantages of this fixture are the testing of thin composite plates and the use of an adhesive to fix samples. Moreover, an optimization of the design of the proposed device, based on finite element simulations, significantly limits the influence of edge effects in order to obtain accurate experimental results. Some test results are presented which underline the potential of the proposed approach.
Keywords: A. Laminates; B. Adhesion; B. Stress concentrations; D. Mechanical testing
Ple
ase
note
that
this
is a
n au
thor
-pro
duce
d P
DF
of a
n ar
ticle
acc
ept
ed fo
r pu
blic
atio
n fo
llow
ing
peer
rev
iew
. The
def
initi
ve p
ub
lish
er-a
uthe
ntic
ated
ve
rsio
n is
ava
ilab
le o
n th
e pu
blis
her
Web
site
2
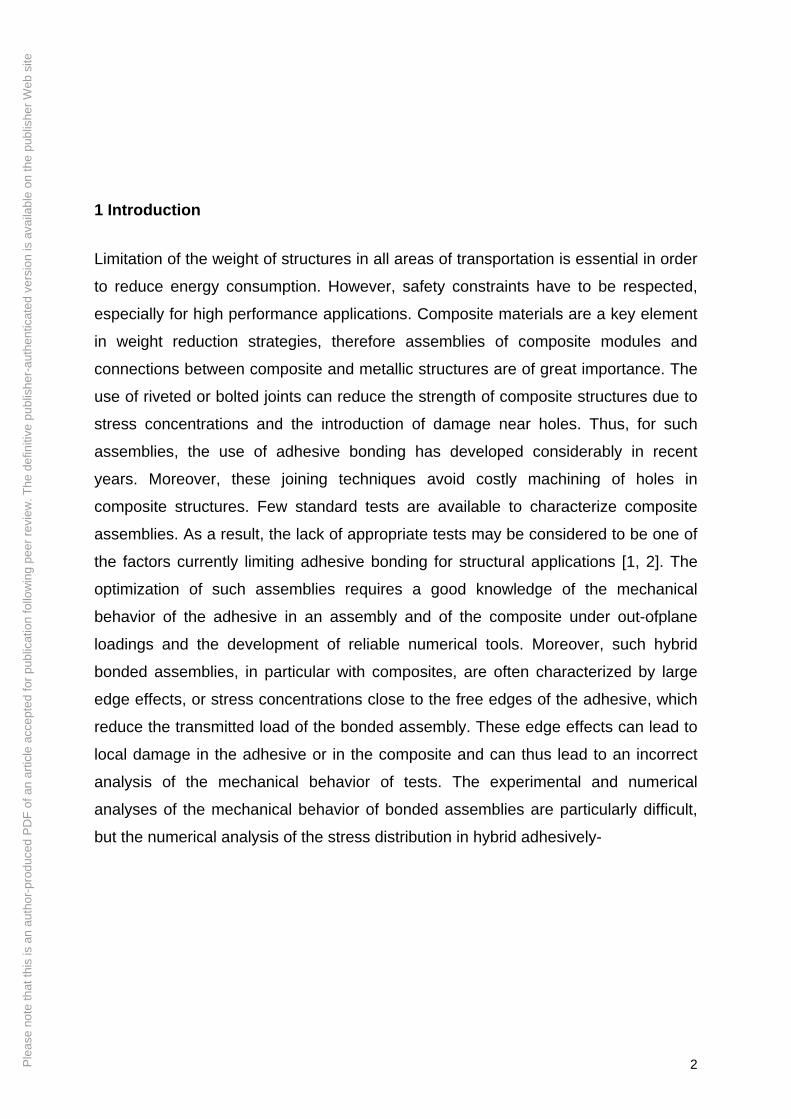
1 Introduction Limitation of the weight of structures in all areas of transportation is essential in order
to reduce energy consumption. However, safety constraints have to be respected,
especially for high performance applications. Composite materials are a key element
in weight reduction strategies, therefore assemblies of composite modules and
connections between composite and metallic structures are of great importance. The
use of riveted or bolted joints can reduce the strength of composite structures due to
stress concentrations and the introduction of damage near holes. Thus, for such
assemblies, the use of adhesive bonding has developed considerably in recent
years. Moreover, these joining techniques avoid costly machining of holes in
composite structures. Few standard tests are available to characterize composite
assemblies. As a result, the lack of appropriate tests may be considered to be one of
the factors currently limiting adhesive bonding for structural applications [1, 2]. The
optimization of such assemblies requires a good knowledge of the mechanical
behavior of the adhesive in an assembly and of the composite under out-ofplane
loadings and the development of reliable numerical tools. Moreover, such hybrid
bonded assemblies, in particular with composites, are often characterized by large
edge effects, or stress concentrations close to the free edges of the adhesive, which
reduce the transmitted load of the bonded assembly. These edge effects can lead to
local damage in the adhesive or in the composite and can thus lead to an incorrect
analysis of the mechanical behavior of tests. The experimental and numerical
analyses of the mechanical behavior of bonded assemblies are particularly difficult,
but the numerical analysis of the stress distribution in hybrid adhesively-

- 2 -
bonded assemblies (in the adhesive and in the composite) can lead to improvements in the transmitted load. Moreover, these analyses can assist in the design of experimental fixtures which limit the edge effects, in order to obtain more reliable data. Failure in bonded assemblies involving composites is often associated with crack initiation in the adhesive or delamination of the composite plies close to the adhesive joint caused by interlaminar or through-thickness stresses [2-4]. Unfortunately, few experimental devices are proposed in the literature to characterize the mechanical behavior of composites under out-of-plane loadings; and those which are available often use thick composite specimens, not representative of the application, or require special geometries [5-8]. Through thickness testing for compression-tensile loadings generally require parallelepiped or waisted specimens [5, 6, 9]. Ring or curved beam specimens are also available but their analysis is more difficult, and failure may result from a combination of interlaminar tensile and shear stresses [5, 10]. An apparent interlaminar shear strength is often obtained using short beam shear tests, but this is very controversial as indentation effects below the loading point can affect the stress field [11, 12]. Alternatives are V-notched beam (Iosipescu test), double-notched shear, and torsion specimens [6, 9]. Biaxial loadings can be applied using an Arcan type device with butterfly-shaped specimens [13, 14]. Moreover, for such thick composite specimens, the geometry of the specimen, the fixing system, and damage generated by machining can result in stress concentrations and subsequent large uncertainties (or scatter) in the experimental results. Ideally, to obtain experimental results representative of industrial applications, there is a need on one hand to use composite plates with quite low thicknesses [15], which are easy to manufacture, and on the other hand to apply a large range of tensile-shear loadings. In order to address those conditions, a modified Arcan type device, using adhesive as the fixing system is proposed here, to analyze the mechanical behavior of both bonded assemblies including composites and the behavior of the composites themselves under out-of-plane loadings. Different numerical studies have been developed in order to analyze and optimize the design of such a system (geometry of the composite plate, geometry of the substrates, fixing system, etc). In order to obtain reliable experimental results, it is essential to limit the influence of edge effects. Some test results are presented which underline the potential of the proposed approach.
2 Experimental analysis of hybrid bonded assemblies with composites In this section, some numerical results of the behavior of the classical single lap shear test with composite substrates and of the Iosipescu test with composite specimens are presented briefly, in order to underline the difficulties encountered in experimental analysis of the mechanical behavior of hybrid bonded assemblies with composites. 2.1 2D simplified material models An accurate analysis of the mechanical behavior of bonded assemblies, i.e. the analysis of the stress distribution through the thickness of the adhesive joint and through the composite thickness, requires refined meshes, especially for structures with edge effects. Here, for the adhesive and the composite, in the most highly stressed zones, 20 linear elements were used for a thickness of 0.1 mm. For the 2D plane stress studies presented, unidirectional carbon-epoxy composites (300g/m²T700 fibre layers in an epoxy resin, fibers in direction x) are used, as they allow the use of orthotropic models (Ex = 110 GPa, Ey = 6.5 GPa, Gxy = 6.5 GPa, νc = 0.32). The elastic limit, is defined with Rc (interlaminar tensile strength), Sc (interlaminar shear strength) and Tc (in-plane tensile strength), and it is chosen such that at the elastic limit [16]:
1TSR 2c
2xx
2c
2xy
2c
2yy =++ σσσ
or [ ] 12c_eq =σ (1)

- 3 -
with Rc = 20 MPa, Sc = 52 MPa and Tc = 1600 MPa. This expression provides the definition of an equivalent stress σeq_c for the composite. The behavior of the adhesive (epoxy resin Huntsman Araldite® 420 A/B) is assumed to be isotropic (Ea = 2.0 GPa, νa = 0.3) and the elastic limit was identified for 2D tensile-shear loadings [9, 10], and proposed in the following form [17]:
1SR 2a
2xy
2a
2yy =+
σσ or [ ] 12
a_eq =σ (2)
with Ra = 40 MPa and Sa = 25 MPa. Fig. 1 presents the so-called elastic domains for the adhesive and the composite in the tensile stress – shear stress diagram.
Ten
sile
str
ess
(MP
a)
Shear stress (MPa)
Fig. 1. Presentation of the so-called elastic domains for the adhesive and the composite in the tensile stress – shear stress diagram.
2.2 Properties of single lap shear specimens with composite substrates Two geometries of the free edges of the adhesive are modelled in order to emphasize the influence of this geometrical parameter (straight edges and cleaned edges, Fig. 2; the cleaned edge geometry is examined as it corresponds to the adhesive edge shape obtained when excess adhesive was removed from the specimens in the tests described below). Other geometries can be used to limit the edge effects [1, 18], but the two geometries examined here are associated with constant thickness of the adhesive joint (a modification of the adhesive thickness can change the mechanical behavior of the joint). Another important parameter is the overlap length, which influences the stress distribution in the adhesive. With the assumptions proposed above, the problem to be solved is linear; thus the stress state in the adhesive can be normalized. All stresses are simply divided by the average stress in the adhesive, so variations (from a value of 1 MPa) can be more easily detected.
Straight edges of the adhesive joint Cleaned edges of the adhesive joint
Fig. 2. Geometry of the single lap-shear specimen.
0
10
20
30
40
50
0 10 20 30 40 50
Adhesive
Composite

- 4 -
Adhesive Substrate C
ompo
nent
xy
(MP
a)
Com
pone
nt x
y (M
Pa)
x (mm) x (mm)
Com
pone
nt y
y (M
Pa)
Com
pone
nt y
y (M
Pa)
x (mm) x (mm)
Com
pone
nt x
x (M
Pa)
Com
pone
nt x
x (M
Pa)
x (mm) x (mm)
Fig. 3. Normalized stress distribution in the adhesive and the composite substrate with straight edges of the adhesive (ρ = ∞).
Computations were made in 2D (plane stress) on half of the specimen by applying adequate boundary conditions. Results are presented for an adhesive thickness of h2 = 0.4 mm, an overlap length of l2 = 20 mm, a length of the substrates of l1 = 80 mm and a substrate thickness of h1 = 6 mm. Fig. 3 presents the stress distribution in the adhesive and in a part of the composite substrate. The parameter h3 (defined in Fig. 2) is taken as h2 here in order to examine the stress gradient close to the interface adhesive-composite. Results are presented for different lines with respect to the position y in the adhesive (y = 0 is the mid-plane of the adhesive and y = h2/2 corresponds to a line close to the adhesive-substrate interface) and for different lines with respect to the position y in the composite (y = 0 corresponds to a line close to the adhesive-substrate interface and y = h3 is a line inside the substrate). It is important to note that, for the adhesive,
0.0
0.5
1.0
1.5
2.0
2.5
3.0
3.5
4.0
-15 -5 5 15
i: y=0
j: y=h2/4
k: y=h2/2
(i)
(j)
(k)
0.0
0.5
1.0
1.5
2.0
2.5
3.0
3.5
4.0
-15 -5 5 15
i: y=0
j: y=h3/2
k: y=h3
(i)
(j)
(k)
-2
0
2
4
6
8
10
12
-15 -5 5 15
i: y=0
j: y=h2/4
k: y=h2/2
(i)
(j)
(k)
-2
0
2
4
6
8
10
12
-15 -5 5 15
i: y=0
j: y=h3/2
k: y=h3
(i)
(j)
(k)
-0.5
0.0
0.5
1.0
1.5
2.0
2.5
3.0
3.5
-15 -5 5 15
i: y=0
j: y=h2/4
k: y=h2/2
(i)
(j)
(k)
0
10
20
30
40
50
-15 -5 5 15
i: y=0
j: y=h3/2
k: y=h3(i)
(j)
(k)

- 5 -
the edge effects are mainly associated with a strong evolution of the normal stress close to the free edges of the adhesive near the adhesive-substrate interface; this result can be explained by the boundary conditions. For the composite substrate, there are also large edge effects close to the substrate-adhesive interface; moreover for the substrate the stress component σxx is not equal to zero close to point D (Fig. 2) associated with the loading of the specimen, but this stress component has only a small influence on the equivalent stress as it acts in the fiber direction. Fig. 4a presents the value of the equivalent stress distribution in the adhesive joint, defined by equation (1) and in the composite substrate, defined by equation (2); the value of the equivalent stress in the middle of the adhesive has been normalized to 1 as noted above. Large edge effects, which can be noted close to point D (Fig. 2), can lead to crack initiation in the adhesive [20] and to delamination of the composite plies close to the adhesive joint [18] for a quite low transmitted load. Fig. 4(b) underlines that the use of so-called “cleaned edges” of the free edges of the adhesive, can reduce the influence of edge effects; the cleaned edges are defined by the following relationship: ρ = 1.5 x h2 (Fig. 2).
Adhesive Substrate
equi
vale
nt s
tres
s (M
Pa)
equi
vale
nt s
tres
s (M
Pa)
x (mm) x (mm)
(a) Straight edges of the adhesive (ρ = ∞)
equi
vale
nt s
tres
s (M
Pa)
equi
vale
nt s
tres
s (M
Pa)
x (mm) x (mm)
(b) Cleaned edges of the adhesive (ρ = 1.5 * h2) Fig. 4. Normalized equivalent stress distribution in the adhesive and the composite substrate for different values of geometrical parameters. With such single lap shear specimens the substrate thickness and the overlap length allow a little modification of the effect of edge effects, but it is very difficult to limit the influence of edge effects significantly [20]. Nevertheless, many studies have been performed to try to reduce these stress concentrations, examining effects such as spew and chamfer size [21], the influence of slots [22]. In order to limit the edge effects it seems necessary to modify the geometry of the substrate close to free edges of the adhesive [19].
0
2
4
6
8
10
12
-15 -10 -5 0 5 10 15
i: y=0
j: y=h2/4
k: y=h2/2
(i)
(j)
(k)
0
2
4
6
8
10
12
-15 -5 5 15
i: y=0
j: y=h3/2
k: y=h3
(i)
(j)
(k)
0
2
4
6
8
10
12
-15 -5 5 15
i: y=0
j: y=h2/4
k: y=h2/2
(i)
(j)
(k)
0
2
4
6
8
10
12
-15 -5 5 15
i: y=0
j: y=h3/2
k: y=h3
(j)
(i)
(k)

- 6 -
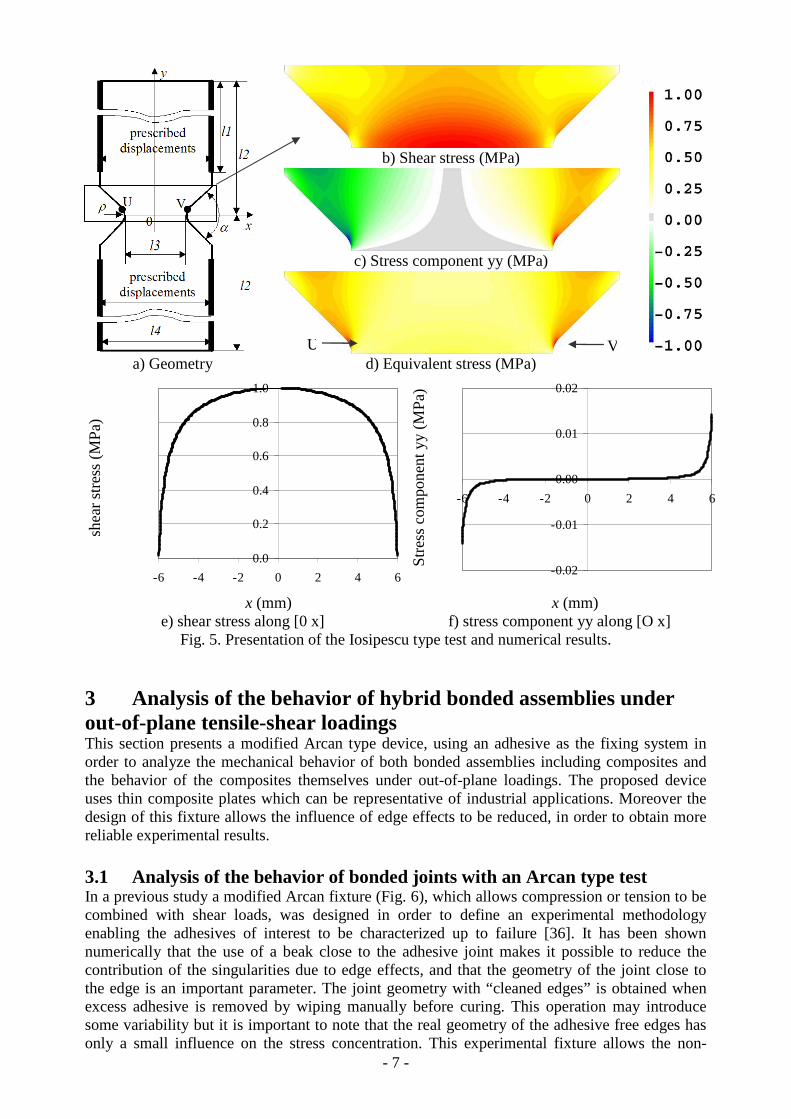
For single lap-shear specimens it is not easy to analyze the mechanical behavior of hybrid bonded-assemblies as degradation starts close to the most stressed point (point D, Fig. 2), for quite a low load, due to the large influence of edge effects (stress concentrations) [23]. Moreover the manufacturing process of single lap-shear specimens can lead to variations of the local geometry close to the most stressed areas (point D, Fig. 2) which can also have an influence on the mechanical response of the specimen (crack initiations). The crack can propagate either in the adhesive or in the composite. The numerical analysis of such problems requires the use of accurate non-linear models, for the adhesive and composite, with reliable failure criteria and reliable interlaminar strength data. 2.3 Properties of Iosipescu type tests with composite specimens The Iosipescu type device is a standardized experimental test (ASTM D5379) used to study the mechanical behavior of materials under shear loadings (shear strength, shear modulus, and strain-to-failure), both metallic materials and composites. This device uses parallelepiped specimens with two symmetrical V-shaped notches (Fig. 5(a)). Different geometries of the specimens exist and different devices have been developed to apply the loading. Numerical results are presented here for the case of unidirectional carbon-epoxy composites (fibers in direction x), using the material parameters presented in section 2.1. The geometrical parameters are as shown in Fig. 5(a) and are such that: l1 = 32 mm; l2 = 40 mm; l3 = 12 mm; l4 = 20 mm; α = 90°; ρ = 1.3 mm. 2D stress plane computations have been made using prescribed displacements in the x axis on different thick lines presented in Fig. 5(a); these displacements represent the fixing of the specimen and the mechanical loading. As the simulation is performed assuming elastic behavior, the stress can be normalized. Numerical results are presented only in the central part of the specimen (Fig. 5(a)). Fig. 5(b) presents the shear stress distribution in the middle part of the specimen. Here, the shear stress is maximal in the centre and quite low close to the notches; with an intermediate level of shear stress near points U and V, which are close to the ends of the circles which define the notches. Fig. 5(d) presents the normalized equivalent stress distribution in the central part of the specimen. It can be noted that the equivalent stress is maximal close to points U and V; in fact, in these two zones close to the notches, the stress component yy has a great influence on the equivalent stress (Fig. 5(c)). The value of the equivalent stress close to points U and V (notch roots) depends on the material properties and on the geometrical parameters of the specimen. Some previous numerical studies have also underlined this phenomenon [24-27]. Fig. 5e-f present the evolution of the shear and normal components of stresses along the line [O x]; these results underline that although a shear stress state is obtained in the mid plane of the specimen, the most highly stressed region is not within this zone. An optimization of the geometrical parameters (notch-opening [28], circular notches [29], two extra notches [30], …) can reduce the stress level close to these two zones. However, those results indicated that cracks can then appear outside the notched section. Different experimental studies have shown the influence of the type of composite on the failure of Iosipescu specimens [6, 24, 30-33]. Moreover, the machining of composite specimens can generate defects and thus increase the influence of edge effects [34]. The same type of specimens (so-called butterfly-shaped specimens) can be used for tensile shear loadings using an Arcan type device [1, 14], and some of the experimental results presented in the literature show that failure occurs in a similar way to that seen in the Iosipescu test. Some numerical analyses have also shown that stress concentrations exist near notch roots [29, 35]. Both those tests, Iosipescu and Arcan with butterfly-shaped specimens, require the use of thick composites whose machining is quite complex, and can cause stress concentrations. As a result those tests can lead to large scatter in the experimental results.
- 7 -
b) Shear stress (MPa)
c) Stress component yy (MPa)
a) Geometry d) Equivalent stress (MPa)
shea
r st
ress
(M
Pa)
Str
ess
com
pone
nt y
y (M
Pa)
x (mm) x (mm) e) shear stress along [0 x] f) stress component yy along [O x]
Fig. 5. Presentation of the Iosipescu type test and numerical results.
3 Analysis of the behavior of hybrid bonded assemblies under out-of-plane tensile-shear loadings This section presents a modified Arcan type device, using an adhesive as the fixing system in order to analyze the mechanical behavior of both bonded assemblies including composites and the behavior of the composites themselves under out-of-plane loadings. The proposed device uses thin composite plates which can be representative of industrial applications. Moreover the design of this fixture allows the influence of edge effects to be reduced, in order to obtain more reliable experimental results. 3.1 Analysis of the behavior of bonded joints with an Arcan type test In a previous study a modified Arcan fixture (Fig. 6), which allows compression or tension to be combined with shear loads, was designed in order to define an experimental methodology enabling the adhesives of interest to be characterized up to failure [36]. It has been shown numerically that the use of a beak close to the adhesive joint makes it possible to reduce the contribution of the singularities due to edge effects, and that the geometry of the joint close to the edge is an important parameter. The joint geometry with “cleaned edges” is obtained when excess adhesive is removed by wiping manually before curing. This operation may introduce some variability but it is important to note that the real geometry of the adhesive free edges has only a small influence on the stress concentration. This experimental fixture allows the non-
0.0
0.2
0.4
0.6
0.8
1.0
-6 -4 -2 0 2 4 6-0.02
-0.01
0.00
0.01
0.02
-6 -4 -2 0 2 4 6
U V

- 8 -
linear behavior of an adhesive joint to be analyzed for radial tensile-shear loadings [37] and thus precise numerical models to describe the behavior of an adhesive in an assembly can be developed [17].
1 - support of the Arcan fixture
2 - bonded specimen 3 - clamping system
4 - support of the clamping system (a) Modified Arcan fixture (shear loading) (b) Mounting of the specimen
(c) Geometry of the substrates (d) Geometry of the bonded assembly
Fig. 6. Arcan fixture and geometry of the substrates with beaks 3.2 Analysis of hybrid bonded assemblies with composites 3.2.1 Presentation of the experimental device The first tests performed using hybrid bonded assemblies (steel, aluminum and composites) have shown a similar behavior to that of the adhesive, using the proposed procedure [37]. Different studies have shown that large stress singularities, associated with edge effects, can exist for bi-material structures. For bonded assemblies involving composites those effects can limit the transmitted load considerably. The adhesive-composite interface influences the assembly strength, and makes it difficult to analyze the behavior of composites under out-of-plane loadings [37]. The fixture proposed for analyzing the behavior of hybrid bonded assemblies with composites is presented in Fig. 7. A composite plate is bonded between the two metallic substrates. The area of the bonded section is 65 mm x 10 mm and a special alignment fixture is used in order to obtain a good quality of the geometry of the bonded specimen (Fig. 7(a)). Fig. 7(b) defines the main parameters of the proposed hybrid bonded assembly. For the different tests, presented in the following, aluminum substrates were used; and for the different computations the elastic parameters used for aluminum are: Young modulus, Es = 75 GPa, Poisson's ratio, νs = 0.3).

- 9 -
(a) Bonding fixture for mixed assemblies
(b) Geometry of bonded metal/composite assemblies (c) Tensile-shear loading
Fig. 7. Experimental fixture with hybrid bonded assembly. 3.2.2 Optimization of the experimental device The experimental procedure based on the modified Arcan device can be used to analyze the behavior of a metal-adhesive-composite-adhesive-metal assembly.
Adhesive Composite
equi
vale
nt s
tres
s (M
Pa)
equi
vale
nt s
tres
s (M
Pa)
X (mm) x (mm)
(a) h = 0.2 mm and H = 4 mm
equi
vale
nt s
tres
s (M
Pa)
equi
vale
nt s
tres
s (M
Pa)
X (mm) x (mm)
(b) h = 0.2 mm and H = 1 mm Fig. 8. Normalized equivalent stress distribution in the adhesive and the composite under
tension-shear loadings, γ = 45° (substrates without beaks, d = 0 and D = 0, h = 0.2 mm, cleaned edges ρ = 1.5 * h).
0.0
0.5
1.0
1.5
2.0
2.5
-40 -20 0 20 40
minimum
maximum
0.0
0.5
1.0
1.5
2.0
2.5
-40 -20 0 20 40
minimum
maximum
0.0
0.5
1.0
1.5
2.0
2.5
-40 -20 0 20 40
minimum
maximum
0.0
0.5
1.0
1.5
2.0
2.5
-40 -20 0 20 40
minimum
maximum
y x
y x
v
u γγγγ

- 10 -
Adhesive Composite
equi
vale
nt s
tres
s (M
Pa)
equi
vale
nt s
tres
s (M
Pa)
x (mm) x (mm)
Fig. 9. Normalized equivalent stress distribution in the adhesive and the composite under traction-shear loadings, γ = 45° (substrates with beaks 45°, cleaned adhesive joint h = 0.2 mm, ρ
= 1.5 * h; composite plate with H = 4 mm, D = 5 mm).
Adhesive Composite
equi
vale
nt s
tres
s (M
Pa)
equi
vale
nt s
tres
s (M
Pa)
x (mm) x (mm) Fig. 10. Normalized equivalent stress distribution in the adhesive and the composite under tensile
(γ = 0°), tensile-shear (γ = 45°) and shear (γ = 90°) loadings (substrates with beaks, α = 30°; thin adhesive, h = 0.2 mm; thin composite, H = 1 mm, plate with D = 5 mm).
A precise analysis of the stress distribution through the thickness of both the adhesive bond-line and composite is necessary. Various 2D stress plane computations, assuming elastic behavior, have been performed using refined meshes, in order to obtain a precise estimation of the influence of the edge effects. Fig. 8 presents the evolution of the equivalent stress with respect to the x axis (x ∈[-32.5; 32.5 mm], Fig. 7) through the adhesive thickness and through the composite thickness for a tensile-shear loading (i.e. with tensile loading in the normal direction of the middle plane of the composite equal to shear loading, γ = 45°). To facilitate the analysis of the results, only the minimum and the maximum values are represented in Fig. 8. For those simulations, substrates without beaks (d = 0, Fig. 7) and composite plates with the same dimensions as the substrates (D = 0) were used. The free edges of the adhesive were assumed to be cleaned (ρ = 1.5 * h) as it has been shown that this geometry can reduce the influence of edge effects. As the simulations are performed assuming elastic behavior of the different parts, it is possible to normalize the results in order to simplify their analysis; thus the equivalent stress is normalized to 1 at the centre of the adhesive. These results (Fig. 8) illustrate the large stress gradients which exist close to the ends of the adhesive and the composite plate. The reduction of
0.0
0.5
1.0
1.5
2.0
-40 -20 0 20 40
minimum
maximum
0.0
0.5
1.0
1.5
2.0
-40 -20 0 20 40
minimum
maximum
0.0
0.5
1.0
1.5
2.0
-40 -20 0 20 40
tensile
shear
tensile-shear
0.0
0.5
1.0
1.5
2.0
-40 -20 0 20 40
tensile
shear
tensile-shear

- 11 -
the thickness of the composite results in a reduction of the influence of these edge effects but does not eliminate them. In order to limit the stress concentrations at the periphery of the useful part of the specimen more significantly, two modifications of the geometry of the bonded specimen have been proposed: the machining of beaks on the substrates (α = 45° or 30°, r = 0.8 mm and d = 0.5 mm, Fig. 7) [36] and the use of a composite plate larger than the substrates (D = 5 mm) in order to limit the adverse effects of machining [15]. Fig. 9 presents normalized equivalent stress distribution for the adhesive and the composite under traction-shear (γ = 45°) loading. The computation was made with substrates with beaks, α = 45°; thin adhesive, h = 0.2 mm and a composite plate with H = 4 mm and D = 5 mm. These results indicate that the beaks with this thickness of composite only allow a reduction of the edge effects. Fig. 10 presents results under traction (γ = 0°), traction-shear (γ = 45°) and shear (γ = 90°) loadings for substrates with beaks, α = 30°; thin adhesive, h = 0.2 mm; thin composite, H = 1 mm, plate with D = 5 mm. These results show that the use of thin adhesive joints and thin composite plates allows us to define a “reliable” experimental device. A system which ensures a maximal stress state in the centre of the useful part of the specimen also allows the influence of machining and positioning defects of specimens to be reduced. It is important to note that for a tensile-shear loading the elastic limit is reached first in the composite. Nevertheless, the choice of the adhesive has to be optimized, especially for shear loadings; in fact, the shear strength of the composite can be higher than the shear strength of the adhesive. The use of a very thin adhesive layer can increase the elastic limit of the adhesive joint. 3.2.3 Influence of some parameters The results presented in the previous section underline that the influence of the edge effects depends on the one hand on the geometrical parameters of the studied structure and, on the other, on the tensile-shear loading (angle γ). Thus, it is interesting to analyze, with respect to the angle γ, the possibilities of the proposed testing device. Fig. 11 presents, for four different values of the parameters, the evolution of the maximum values of the equivalent stress within the adhesive and the composite with respect to the tensile-shear loading type: γ ∈ [0°, 90]. The full lines represent the maximum values of the equivalent stress in the adhesive and the composite. The dashed lines represent the maximum values of the equivalent stress in the central part of the adhesive and the composite. For a given angle γ, if the two values are not identical, the maximum equivalent stress is obtained close to the free edges; thus stress concentrations exist. For these drawings, the equivalent stress in the central part of the composite is chosen equal to 1 for the different angles γ; thus, for this part, the elastic limit is reached. Thus, with these curves, one can directly obtain the tensile-shear loading types (i.e. the values of the angle γ) for which the elastic limit is first obtained in the composite plate. For the different computations the following values of the parameters have been chosen: D = 5 mm, h = 0.2 mm, ρ = 1.5 * h (cleaned edges). For straight substrates and composite plates of 1 mm thickness, Fig. 11(a) shows the large stress concentrations in both the adhesive and the composite for straight substrates and 1 mm thick composite plate. The use of substrates with thin beaks (α = 30°) associated with composite plates of 4 mm thickness generates quite a large stress concentration in the composite (Fig. 11(b)). Fig. 11(c) shows that the proposed test, using substrates with beaks, can be used to analyze the behavior of composite plates of 1 mm thickness under out-of-plane loading for γ ∈ [0°, 50°]. The use of an adhesive with a larger elastic domain (Ra’ = 50 MPa and Sa’ = 35 MPa) allows us to increase the useful tensile-shear loading type, i. e. γ ∈ [0°, 65°] (Fig. 11(d)). Above this critical angle the adhesive will fail before the composite.

- 12 -
equi
vale
nt s
tres
s (M
Pa)
equi
vale
nt s
tres
s (M
Pa)
γ (°) γ (°)
(a) α = 90° and H = 1 mm (b) α = 30° and H= 4 mm
equi
vale
nt s
tres
s (M
Pa)
equi
vale
nt s
tres
s (M
Pa)
γ (°) γ (°)
α = 30° and H= 1 mm Ra = 40 MPa and Sa = 25 MPa
α = 30° and H= 1 mm Ra’ = 50 MPa and Sa’ = 35 MPa
Fig. 11. Maximum values (full lines) and center-line values (dashed lines) of the normalized equivalent stresses in the adhesive and in the composite with respect to the tension-shear loading
type, γ ∈ [0°, 90] (D = 5 mm, h = 0.2 mm, cleaned edges ρ = 1.5 * h).
4 Behavior of composites under out of plane loadings 4.1 Unidirectional composites Unidirectional (UD) carbon/epoxy composites have been used to validate the proposed test. The adhesive joints were about 0.2 mm thick. We denote by DN and DT the relative displacements of the two substrates in the normal and tangential directions respectively in the mean plane of the composite plate. FN and FT are the components of the applied load in the normal and tangential directions in the mean plane of the composite plate. Fig. 12 presents experimental results for shear loading tests in the tangential direction (results from two specimens are presented: “Comp1” and “Comp2”). For those tests failure of the adhesive occurs close to the adhesive-substrate interface, as predicted by the numerical analyses. Fig. 12 also presents the experimental result for a test without the composite but with a joint thickness of 0.4 mm, denoted by “1 joint” (a bonded aluminum/aluminum joint). It can be noted that the global behavior of the two types of tests are quite similar, in fact the most loaded part of the assembly is the adhesive. But when the composite plate is included there are four interfaces compared to only two without the composite plate. Fig. 13 shows results for tensile tests in the normal direction, for which fracture occurs within the composite plate. Experiments in which the composite was replaced by an aluminum plate, denoted by “Alu” (of the same thickness) make it
0.0
0.5
1.0
1.5
2.0
2.5
3.0
0 15 30 45 60 75 90
i: Adhesivej: Compositek: Ad Centrel: Co Centre
(i)
(j)
(k)
(l)
0.0
0.5
1.0
1.5
2.0
2.5
3.0
0 15 30 45 60 75 90
i: Adhesivej: Compositek: Ad Centrel: Co Centre
(i)
(j)
(l)(k)
0.0
0.5
1.0
1.5
2.0
0 15 30 45 60 75 90
i: Adhesivej: Compositek: Ad Centrel: Co Centre
(i)
(j)
(k)
(l)
0.0
0.5
1.0
1.5
2.0
0 15 30 45 60 75 90
i: Adhesivej: Compositek: Ad Centrel: Co Centre (i)
(j)(k)
(l)

- 13 -
possible to estimate the deformation of the composite plate. Fig. 14 presents results for tensile-shear loading (γ = 45°) tests in the tangential direction which also result in failure within the composite. Once again tests in which the composite plate was replaced by an equivalent thickness aluminum plate were used to estimate the deformation of the composite plate. It is important to note that the deformation of the bonded assemblies is much higher in the tangential direction that in the normal direction.
FT
(kN
)
DT (mm) Fig. 12. Experimental results for shear loadings & section through the specimen, with failure at
the lower adhesive/aluminum interface (bottom of photo) (scale graduations 0.5 mm) [23].
FN
(kN
)
DN (mm) Fig. 13. Experimental results for tensile loadings and section through a specimen, failure within
the composite [23].
FT
(kN
)
DT (mm)
Fig. 14. Experimental results for tensile-shear loadings (γ = 45°) in the tangential direction [23].
02468
101214161820
0 0.1 0.2 0.3 0.4 0.5
i: Comp 1 (h = 0.2mm)
j: Comp 2 (h = 0.2 mm)
k: 1 joint (h = 0.4 mm)
(i)(j)
(k)
0
5
10
15
20
25
30
35
40
0 0.01 0.02 0.03 0.04
i: Comp (h = 0.2 mm)
j: 1 joint (h = 0.4 mm)
k: Alu (h = 0.2 mm)(i)
(k)
(j)
0
2
4
6
8
10
12
14
16
18
0 0.05 0.1 0.15 0.2 0.25
i: Comp 1 (h = 0.2 mm)
j: Comp 2 (h = 0.2 mm)
k: 1 joint (h = 0.4 mm)
l: Alu (h = 0.2 mm)
(i) (j)
(k)
(l)

- 14 -
4.2 Comparison of bonded assemblies of different composites Following the development of the modified Arcan test on unidirectional composites the test was applied to a number of more realistic stacking sequences used in industrial applications in a marine environment. Five different composite plates have been analyzed (Table 1). These were all manufactured at the same time from epoxy prepreg, in an autoclave with metal plates on both faces in order to obtain similar surfaces. These composites are stronger that those described in the previous section, so thinner adhesive joints have been used (0.1 mm). The relative normal displacement DN is measured with an extensometer in order to obtain accurate values. It is important to note that the maximum value of DN is quite low. DN includes the deformation of a part of the aluminum substrates, the deformation of the two adhesive joints and the deformation of the composite plate. The surface preparations were abrasion with 180 grade paper, removal of dust, then dried for the composites; degreasing with acetone, abrasion with 80 grade paper, second degreasing with acetone, then dried for the aluminum substrates.
Table 1. Properties of different composites tested G : Glass satin prepreg 1454/49%/300g/m²
C1 : Carbon 0/90° prepreg G0803/M10/42%/3K/285g/m² C2 : Carbon UD prepreg UD/M40J/R367-2/38%/300g/m²
Composite Ply sequence Thickness (mm) A [G +/-45°, 3 (C1 +/-45°), G +/-45°] 1.64 B [G +/-45°, C2 0°, C2 90°]s 1.96 C [G +/-45°, 2 (C2 0°)]s 1.94 D [5 (C1 +/-45°)] 1.64 E [6 (C2 0°)] 1.90
Fig. 15 presents some experimental results, for the five composites. It also presents some additional results from two tests, one without the composite but with an adhesive joint thickness equal to twice the thickness of a joint with hybrid assemblies (curve denoted by “Adhesive”), and one for which the composite plate was replaced by an aluminum plate (curve denoted by “Alu”) performed in order to estimate the deformation of the composite plate. The scatter in the experimental results is quite low for tests on mixed bonded assemblies with composites when experimental conditions are carefully controlled, as shown by the reproducibility of results from three tests on material D. Fig. 15 also shows the composites after failure, it is important to note that failure is observed within the composite, not in the adhesive nor at the composite surface, in all cases. These figures underline that there is an influence of the geometrical properties of the composite on the both damage development and failure behavior under out-of-plane loadings. For composite D, additional views of the Arcan bonded specimens are also presented. These results confirm that the modified Arcan test is able to analyze the behavior of hybrid bonded assemblies with composites under tensile-shear loadings. For materials A and D the reinforcement is woven and failure is due to delamination (Fig. 15). For materials B, C and E, manufactured using unidirectional plies, the failure is intralaminar, involving fibre-matrix debonding and matrix cracking. The experimental results also show that the fiber orientations and the characteristics of different plies all have an influence on the out-of-plane strength of the composite, but more work is needed to analyze these results in detail. Based on this approach it should be possible to optimize the surface preparation of the composite and the strength of hybrid bonded assemblies for a particular loading. More work is underway to clarify the role of composite damage mechanisms in mixed joint performance.

- 15 -
FN
(kN
)
FN
(kN
)
DN (mm) DN (mm)
Results for all materials Composite D, results for 3 specimens
Composite A (after failure) Composite B (after failure)
Composite C (after failure) Composite E (after failure)
Composite D (after failure) Composite D (section of the bonded assembly after failure) Fig. 15. Analysis of hybrid bonded assemblies with different composites under tension loadings.
5 Conclusions Numerical and experimental results indicate that the modified Arcan test fixture is suitable for evaluating the response of hybrid bonded assemblies (metal-adhesive-composite-adhesive-metal) provided certain conditions are respected to limit the influence of edge effects: i.e. thin composite plates, substrates with beaks, thin adhesive layers and cleaned free edges. This test allows the mechanical behavior of both composites and hybrid metal/composite bonded assemblies to be analyzed under a large range of tensile-shear out-of-plane loadings. This provides essential information on through-thickness properties which is very difficult to obtain using other tests. The key advantages of this fixture are the use of adhesive as the fixing system and the use of thin composite plates; such composite specimens are representative of industrial
0
5
10
15
20
25
30
35
40
45
0.00 0.01 0.02 0.03 0.04 0.05
A
B
CD
E
Alu
Adhesive
0
5
10
15
20
25
30
35
40
45
0 0.01 0.02 0.03 0.04 0.05
2
3
1

- 16 -
applications and their manufacturing is easy. For a given composite, an optimization of the adhesive properties must be performed, especially under shear loadings, as the shear strength of the composite can be higher than that of the adhesive. Experimental results show that the fiber orientations and the characteristics of different plies all have an influence on the out-of-plane strength of the composite. This experimental device makes it possible to optimize the surface preparation of the composite and the strength of hybrid bonded assemblies. More work is underway to clarify the role of composite damage mechanisms in mixed joints. In order to characterize the damage evolution in the composite under out-of-plane loadings, appropriate measurement techniques are being developed, as it is necessary to analyze very small displacements. Moreover inverse procedures must also be developed to take into account the non-linear behavior of the adhesive [17] and of the composite [38]. References [1] Voloshin A, Arcan M. Failure of unidirectional fiber-reinforced materials – New
methodology and results. Experimental Mechanics 1980; 20: 280-4. [2] Junhou P, Shenoi RA. Examination of key aspects defining the performance characteristics
of out-of–plane joints in FRP marine structures. Composites: Part A 1996; 27: 89-103. [3] Adams RD, Comyn J, Wake WC. Structural adhesives joints in engineering, Chapman &
Hall, 2nd edition, 1997. [4] Totry E, Gonza´lez C, LLorca J. Failure locus of fiber-reinforced composites under
transverse compression and out-of-plane shear. Composites Science and Technology 2008; 68: 829–39.
[5] ASTM International, The composite materials handbook MIL17, vol 1, 2004 [6] Lodeiro MJ, Broughton WR, Sims GD. Understanding the limitations of through thickness
test methods, Proc 4th European conf on Comp. Testing and Standardization, London, 80-90, 1998.
[7] Mespoulet S, Hodgkinson JM, Matthews FL. Design, development and implementation of test methods for determination of through thickness properties of laminated composites. Plast. Rubber Compos. 2000, 29, 9, 496-502.
[8] Chan A, Chiu WK, Liu XL. Determining the elastic interlaminar shear modulus of composite laminates. Composite Structures 2007; 80: 396–408.
[9] Lara-Curzio E, Bowers D, Ferber MK. The interlaminar tensile and shear behavior of a unidirectional C-C composite. Journal of Nuclear Materials 1996; 230: 226-32.
[10] Cui W, Liu T, Len J, Ruo R. Interlaminar tensile strength (ILTS) measurement of woven glass/polyester laminates specimen using four-point curved beam. Composites Part A 1996; 27: 1097-1105.
[11] Berg CA, Tirosh J, Israeli M. Analysis of short beam bending of fiber reinforced composites, Composite Materials: Testing and Design (Second Conference), ASTM STP 497, American Society for Testing and Materials, 1992, pp. 206-218.
[12] Chang FK, Tang JM, Peterson DG. The effect of testing methods on the shear strength distribution in laminated composites. Journal of Reinforced Plastic and Composites 1987; 6: 304-18.
[13] Arcan M, Hashin Z, Voloshin A. A method to produce uniform plane stress states with applications to fiber reinforced materials. Experimental Mechanics 1978; 18: 141-6.
[14] Voloshin A, Arcan M. Pure shear moduli of unidirectional fibre-reinforced materials (FRM). Fibre Science and Technology 1980; 13: 125-34.
[15] Weaver JH, Yang J, Evans AG, Zok FW. A modified test for measuring the interlaminar tensile strength of fiber-reinforced ceramic composites. Composites Science and Technology 2008; 68: 10–6.
[16] Davies P et al. Failure of bonded glass/epoxy composite joints: A benchmark study and correlation with test results, Proc SAEVI, Bristol, July 2001, 233-238.
[17] Créac’hcadec R, Cognard JY. 2D modeling of the behavior of an adhesive in an assembly using a non-associated elasto-visco-plastic model. Journal of Adhesion 2009; 85: 239-60.

- 17 -
[18] Da Silva LFM, Adams RD. Techniques to reduce the peel stresses in adhesive joints with composites, International Journal Adhesion & Adhesives 2007, 27: 227-235.
[19] Cognard JY, Créac’hcadec R, Sohier L, Davies P. Analysis of the non linear behaviour of adhesives in bonded assemblies. Comparison of TAST and ARCAN tests. International Journal of Adhesion & Adhesives 2008; 28: 393-404.
[20] Lang TP, Mallick PK. The effect of recessing on the stresses in adhesively bonded single-lap joints. International Journal of Adhesion & Adhesives 1999; 19: 257-71.
[21] Belingardi G, Goglio L, Tarditi A. Investigating the effect of spew and chamfer size on the stresses in metal/plastics adhesive joints. International Journal of Adhesion & Adhesives 2002; 22: 273-82.
[22] Yan ZM, You M, Yi XS, Zheng, XL, Li Z. A numerical study of parallel slot in adherend on the stress distribution in adhesively bonded aluminium single lap joint. International Journal of Adhesion & Adhesives 2007; 27: 687-95.
[23] Cognard JY, Davies P, Sohier L. Advances in Testing Adhesively Bonded Composites, in Advances in structural adhesive bonding, ed. D.A. Dillard, Woodhead Publishing Limited Abington Hall, Cambridge, ISBN: 978-1-84569-435-7, 2010, 437-465.
[24] Pierron F, Vautrin A. Measurement of the in-plane shear strengths of unidirectional composites with the Iosipescu test. Composites Science and Technology 1997; 57: 1653-60.
[25] Odegard G, Kumosa M. Determination of shear strength of unidirectional composite materials with the Iosipescu and 10°-axis shear tests. Composites Science and Technology 2000; 60: 2917-43.
[26] Chiang MYM, He J. An analytical assessment of using the losipescu shear test for hybrid composites, Composites: Part B 2002; 33: 461–70.
[27] Hawong JS, Shin DC, Baek UC. Validation of pure shear test device using finite element method and experimental methods. Engineering Fracture Mechanics 2004; 71: 233–43.
[28] Melin LN, Neumeister JM. Measuring constitutive shear behavior of orthotropic composites and evaluation of the modified Iosipescu test. Composite Structures 2006; 76: 106–15.
[29] Harman A, Risborg A, Wang CH. Experimental testing of BMI laminates with stress concentrations and the evaluation of SIFT to predict failure. Composite Structures 2008; 86: 85–95.
[30] Tarnopol'skii YM, Kulakov VL, Aranautov AK. Measurements of shear characteristics of textile composites. Computers and Structures 2000; 76: 115-23.
[31] Zhou G, Green ER, Morrison C. In-plane and interlaminar shear properties of carbon/epoxy laminates, composites science and technology 1995; 55: 187-93.
[32] Rupnowski P, Gentz M, Sutter JK, Kumosa M. Mechanical response of a woven graphite/polyimide composite to in-plane shear dominated loads at room and elevated temperatures. Acta Materialia 2004; 52: 5603–13.
[33] Bradley LR, Bowen CR, McEnaney B, Johnson DC. Shear properties of a carbon/carbon composite with non-woven felt and continuous fibre reinforcement layers. Carbon 2007; 45: 2178–87
[34] Ghidossi P., El Mansori M., Pierron F., Edge machining effects on the failure of polymermatrix composite coupons, Composites: Part A 35 (2004) 989–999
[35] Hung SC, Liechti KM. Finite element analysis of the Arcan specimen for fiber reinforced composites under pure shear and biaxial loading. J. Comp. Materials 1999; 33: 1288-317.
[36] Cognard JY, Davies P, Gineste B, Sohier L., Development of an improved adhesive test method for composite assembly design. Composite Science and Technology 2005; 65: 359-368.
[37] Cognard JY, Davies P, Sohier L, Créac’hcadec R. A study of the non-linear behaviour of adhesively-bonded composite assemblies. Composite Structures 2006; 76: 34-46.
[38] Laurin F, Carrere N, Maire JF. Laminated composite structures subjected to compressive loading: A material and structural buckling analysis. Composite Structures 2007 ; 80 : 172–182.