
A model for the performance of air-breathing pulse ...
43
A model for the performance of air-breathing pulse detonation engines E. Wintenberger * and J.E. Shepherd † Graduate Aeronautical Laboratories, California Institute of Technology, Pasadena, CA 91125 Revised August 17, 2005 Abstract We describe a simplified flow-path analysis of a single-tube air-breathing pulse detonation engine. Our configuration consists of a steady supersonic inlet, a large plenum, a valve, and a straight detonation tube (no exit nozzle). We study the interaction of the filling process with the detonation and show how the flow in the plenum is coupled with the flow in the detonation tube. This coupling results in total pressure losses and pressure oscillations in the plenum caused by the unsteadiness of the flow. Moreover, the filling process generates a moving flow into which the detonation has to initiate and propagate. We develop an analytical model for predicting the flow and estimating performance based on an open-system control volume analysis and gas dynamics. Our existing single-cycle impulse model is extended to include the effect of filling velocity on detonation tube impulse. Based on this, the engine thrust is found to be the sum of the contributions of detonation tube impulse, momentum, and pressure terms. Performance calculations for pulse detonation engines operating with stoichiometric hydrogen-air and JP10-air are presented and compared to the performance of the ideal ramjet over a range of Mach numbers. * now at GE Advanced Materials Quartz, Strongsville, OH 44149 † Professor, Aeronautics 1 of 43
Transcript of A model for the performance of air-breathing pulse ...
A model for the performance of
air-breathing pulse detonation engines
E. Wintenberger∗and J.E. Shepherd†
Graduate Aeronautical Laboratories,
California Institute of Technology, Pasadena, CA 91125
Revised August 17, 2005
Abstract
We describe a simplified flow-path analysis of a single-tube air-breathing pulse detonation
engine. Our configuration consists of a steady supersonic inlet, a large plenum, a valve, and a
straight detonation tube (no exit nozzle). We study the interaction of the filling process with
the detonation and show how the flow in the plenum is coupled with the flow in the detonation
tube. This coupling results in total pressure losses and pressure oscillations in the plenum
caused by the unsteadiness of the flow. Moreover, the filling process generates a moving
flow into which the detonation has to initiate and propagate. We develop an analytical
model for predicting the flow and estimating performance based on an open-system control
volume analysis and gas dynamics. Our existing single-cycle impulse model is extended to
include the effect of filling velocity on detonation tube impulse. Based on this, the engine
thrust is found to be the sum of the contributions of detonation tube impulse, momentum,
and pressure terms. Performance calculations for pulse detonation engines operating with
stoichiometric hydrogen-air and JP10-air are presented and compared to the performance of
the ideal ramjet over a range of Mach numbers.
∗now at GE Advanced Materials Quartz, Strongsville, OH 44149†Professor, Aeronautics
1 of 43
Joe Shepherd
Typewritten Text
E. Wintenberger and J. E. Shepherd. "A model for the performance of air-breathing pulse detonation engines". Journal of Propulsion and Power, 22(3):593-603, 2006.
Joe Shepherd
Typewritten Text
Joe Shepherd
Typewritten Text

NomenclatureA0 effective inlet capture area
A2 plenum cross-sectional area
AV valve and detonation tube cross-sectional area
c speed of sound
f fuel-air mass ratio
F thrust
g Earth’s gravitational acceleration
h enthalpy per unit mass
ht stagnation enthalpy per unit mass
Idt detonation tube impulse
ISPF fuel-based specific impulse
ISPFdt detonation tube fuel-based specific impulse
L detonation tube length
m mass flow rate
mF average fuel mass flow rate
M Mach number
Mfill filling Mach number
MS Mach number of the shock wave generated at valve opening in the burned gases
P static pressure
P3 pressure on the closed valve during detonation and blowdown processes
PR initial pressure ratio across valve in numerical simulations of filling process
q heat release per unit mass
R perfect gas constant
t time
tCJ time taken by the detonation to reach the open end of the tube in the static case
= L/UCJ
tclose valve close-up time
tfill filling time
topen valve open time
tpurge purging time
T static temperature
u flow velocity
UCJ detonation wave velocity
Ufill filling velocity
V detonation tube volume
2 of 43

VP plenum volume
α non-dimensional parameter corresponding to time taken by first reflected character-
istic to reach thrust surface
β non-dimensional parameter corresponding to pressure decay period
γ ratio of specific heats
Ω engine control volume
ρ density
Σ engine control surface
τ cycle time
Subscripts
0 free-stream conditions
2 state downstream of inlet
3 state behind Taylor wave during detonation process
b burned gas
a air
P plenum conditions
CJ Chapman-Jouguet state
dt detonation tube
f state of detonation products at the end of blowdown process
i state of reactants before detonation initiation at the end of filling process
V valve plane
Averages
X denotes the temporal average of quantity X over a cycle
Introduction
Pulse detonation engines (PDEs) are propulsion systems based on the intermittent use of
detonative combustion. A typical air-breathing PDE consists of an inlet, a series of valves,
one or multiple detonation tubes, and an exit nozzle. Because of the intrinsically unsteady
nature of the flow field associated with the detonation process, it is difficult to evaluate
the relative performance of air-breathing PDEs with respect to conventional steady-flow
propulsion systems. This paper presents a performance model for air-breathing PDEs based
on flow-path analysis.
PDE performance analysis has followed several different approaches, starting with at-
tempts to measure and model the static performance of single-cycle detonation tubes. Nicholls
3 of 43

et al.1 pioneered the use of unsteady detonations for propulsion and carried out direct
impulse measurements. More recently, several experimental,2–7 numerical,8–10 and model-
ing3,11–15 efforts have quantified the static single-cycle performance of a detonation tube.
Although early numerical studies gave disparate and often contradictory values for perfor-
mance parameters,16 there is now substantial agreement17,18 between numerical simulations
and experimental measurements for selected mixtures.
In parallel, researchers have also experimentally investigated the static multi-cycle perfor-
mance of single3,19–22 and multiple23,24 detonation tubes. Although there is good agreement
between some experimental multi-cycle data23,25 and single-cycle estimates,13 numerical sim-
ulations26 also showed that the multi-cycle performance can be substantially different from
the single-cycle performance. Fuel injection, ignition, and refilling strategies as well as the
assumptions made for detonation initiation17,22,26 play a crucial role in estimating the multi-
cycle performance.
Although PDE static performance has been studied extensively, few efforts have focused
on estimating the performance of an air-breathing PDE. The difficulties associated with
coupling the inlet flow to the unsteady flow inside the detonation tube(s) and the interac-
tion of the detonation wave and the subsequent unsteady flow with an exit nozzle are two
significant modeling challenges. Paxson27 has carried out unsteady, one-dimensional com-
putations and represented the results in terms of a performance map in total pressure–total
temperature coordinates. This methodology has been used to compute specific impulse and
make comparisons to idealized ramjet and turbojet performance over a range of flight Mach
numbers.
Bratkovich and Bussing28 presented a performance model for air-breathing PDEs, which
considers contributions from an inlet, a mixer, a combustor, and a nozzle. Kaemming29
conducted a mission analysis showing that an air-breathing PDE can present performance
advantages over the turbo-ramjet without providing any absolute performance values. Be-
cause of the proprietary nature of the work and the lack of details about these commercial
models,28,29 the accuracy of these performance predictions is difficult to assess.
Wu et al.30 have presented what is, so far, the most comprehensive system performance
analysis for an air-breathing PDE. Their work is based on a modular approach, including
supersonic inlet dynamics and detonation in single and multiple tubes. They carried out
detailed numerical simulations for a hydrogen-fueled air-breathing PDE flying at 9.3 km
altitude and a Mach number of 2.1. A series of parametric studies showed that the system
performance decreased with increasing ignition delay and increasing refilling period for a
fixed blowdown time. Investigations of nozzle design concluded that a limited performance
gain was obtained for non-choked nozzles, but that choked converging-diverging nozzles could
4 of 43

considerably improve performance. Maximum fuel-based specific impulses on the order of
3500 s were obtained for stoichiometric hydrogen-air. More recently, Ma et al.31,32 presented
numerical results showing the thrust chamber dynamics of single- and multiple-tube PDEs.
They showed that the multiple-tube design improves the performance by reducing the degree
of unsteadiness in the flow. Specific impulses as high as 3800 s at a flight Mach number of
2.1 were obtained with a single converging-diverging exit nozzle.
Other PDE performance estimates have been based on thermodynamic cycle analysis.
Heiser and Pratt33 proposed a thermodynamic cycle based on the ZND model of detonation
and used the entropy method34 to predict performance. The constant volume combustion
cycle has also been used as a surrogate for the detonation cycle.35,36 Performance models
based on gas dynamics have been proposed. Talley and Coy37 developed a blowdown model
assuming quasi-steady isentropic one-dimensional nozzle flow following constant volume com-
bustion. The performance results were compared to constant pressure propulsion devices.
Harris et al.38 evaluated the respective performance of zero-, one-, and two-dimensional
models for the PDE cycle and concluded that Talley and Coy’s model37 offers a good ap-
proximation of the time-averaged performance. Harris et al.39,40 have further developed
their models and done comparisons with two-dimensional numerical simulations.
Our goal is to develop a complete flow-path-based analysis of an air-breathing PDE that
can be used to carry out parametric studies of performance without elaborate computational
fluid dynamics simulations for each case. Building on our previous work13 with a single-cycle
detonation tube, we have developed an analytical model that takes into account all of the ma-
jor engine components (except an exhaust nozzle) and their coupling. Our model is based on
a fully unsteady one-dimensional control volume analysis of a single-tube air-breathing PDE.
The performance of the air-breathing PDE is calculated from the conservation equations av-
eraged over a cycle of operation. We compare the results with a conventional propulsion
system, the ideal ramjet, at various operating conditions.
Single-tube air-breathing PDE
We consider a supersonic single-tube air-breathing PDE that consists of an inlet, a
plenum, a valve, and a straight detonation tube. A schematic is given in Fig. 1. We assume
a steady inlet because of its well-known performance characteristics. Installing a steady inlet
in an unsteady air-breathing engine is possible as long as quasi-steady flow downstream of
the inlet is achieved by one of two ways. The first way is to use multiple detonation tubes
operating out of phase so that the flow upstream of the detonation tubes decouples from the
unsteady flow inside the tubes, becoming quasi-steady. The second way is to use a plenum
downstream of the inlet that is large enough to dampen pressure transients generated by the
5 of 43

valve operation.35 This second approach increases the engine total volume and may not be
practical, but we adopt it in our one-dimensional modeling due to its simplicity. Other types
of inlets for PDEs include unsteady valveless20,34,41 and valved34,35 inlets such as those used
in pulsejet applications.
The steady inlet is separated from the plenum by an isolator (a grid or screen similar
to what is used in ramjets). Flow perturbations generated by combustion or valve motion
are assumed to be isolated within the plenum, and the inlet flow is unaffected. The valve
is located at the upstream end of the detonation tube, separating it from the plenum. We
assume that the valve opens and closes instantaneously. Although there are transients as-
sociated with finite opening and closing times, they must be modeled by more complex
multi-dimensional numerical simulations and are outside the scope of this one-dimensional
model. The fuel injection system is located downstream of the valve. Fuel is injected only
during the filling process and is assumed to mix instantaneously with the flowing air. The
effect of exit nozzles on detonation tube performance is not considered in this study and the
detonation tube is assumed to be straight.
Control volume analysis
The performance is determined by performing an unsteady open-system control volume
analysis. The control volume Ω, Fig. 2, is stationary with respect to the engine. The engine
is attached to the vehicle through a structural support. The control surface Σ passes through
the engine valve plane and encompasses the detonation tube, extending far upstream of the
inlet plane. The side surfaces are parallel to the free-stream velocity. We consider the
equations for mass, momentum, and energy for this control volume; see Wintenberger42 for
details of the derivations.
Mass conservation
There is temporary mass storage through a cycle, but the average mass storage must
equal zero for cyclic operation. We integrate the mass conservation equation between the
inlet and the valve plane over a cycle to obtain∫ τ
0
mV (t)dt = τm0 . (1)
Momentum conservation
The forces to consider in the momentum equation are the pressure forces and the reaction
to the thrust carried through the structural support. If we assume that the top and bottom
sides of the control volume are sufficiently distant from the engine, then the flow crosses
them with an essentially undisturbed velocity component in the flight direction. Using the
6 of 43

continuity equation, we obtain an expression for the instantaneous thrust42
F (t) = mV (t)uV (t)− m0u0 + AV (PV (t)− P0) +d
dt
∫Ω
ρudV . (2)
The last term represents the unsteady variation of momentum inside the control volume.
Energy conservation
In the absence of body forces and heat release (which occurs inside the detonation tube lo-
cated outside our control volume), the energy equation can be simplified using the continuity
equation and integrated over a cycle to yield42
∫ τ
o
mV (t)htV (t)dt = τm0ht0 . (3)
Because there is no average energy storage in the control volume in steady flight, the energy
conservation equation requires the cycle average flux of stagnation enthalpy to be the same
at the inlet and the valve plane.
Thrust calculation
The average thrust is calculated by integrating Eq. 2 over a complete cycle. During
steady flight, the total momentum in the control volume has a periodic behavior so the
unsteady term vanishes when averaged over one period. The only situation in which the
mass, momentum, and energy storage terms lead to non-zero cycle-averaged contributions
are during unsteady flight conditions such as acceleration or deceleration. For this study, we
restrict ourselves to performance calculations during steady flight conditions.
During a cycle, the valve is closed from time 0 to tclose and open from tclose to τ . Intro-
ducing the detonation tube impulse Idt generated by the detonation and blowdown processes∫ tclose
0
AV (PV (t)− P0)dt = Idt , (4)
the average thrust is given by42
F =1
τIdt +
1
τ
∫ τ
tclose
mV (t)uV (t)dt +1
τ
∫ τ
tclose
AV (PV (t)− P0)dt− m0u0 . (5)
Note that the integration limits in Eqs. 4 and 5 are different. The average thrust is the
sum of contributions from the detonation tube impulse, the momentum and pressure at the
valve plane during the open part of the cycle, and the ram momentum. In order to evaluate
this thrust, we need an estimate of the detonation tube impulse and of the momentum and
7 of 43

pressure contributions at the valve plane during the part of the cycle when the valve is open.
These terms have to be estimated by modeling the gas dynamics of the filling and detonation
process.
Detonation tube dynamics
In order to estimate the different terms in the PDE thrust equation (Eq. 5), we consider
the dynamics of the detonation tube during one cycle. The parts of the cycle are shown
in Fig. 3: a) The detonation is initiated at the closed end of the tube. b) The detonation
propagates towards the open end. c) The detonation diffracts outside as a decaying shock
and a reflected expansion wave propagates to the closed end, starting the blowdown process.
d) At the end of the blowdown process, the tube contains burned products at rest. e)
The purging/filling process is triggered by the opening of the valve, sending a shock wave
in the burned gases, followed by the air-products contact surface. f) A volume of air is
injected before the reactants for purging. g) The purging air is pushed out of the tube by
the reactants. h) The reactants eventually fill the tube completely and the valve is closed.
The detonation/blowdown process occurs when the valve is closed (from 0 to tclose) and the
purging and filling processes occur when the valve is open (from tclose to τ). The cycle time
is the sum of the valve close and open times, the latter being the sum of the fill and purging
times.
τ = tclose + topen = tclose + tfill + tpurge (6)
Experiments have shown that purging the burned gases (usually with air) is necessary to
avoid pre-ignition of the fresh mixture before the detonation initiation. Because the air
entering the plenum is decelerated and compressed through the inlet due to the ram effect,
the plenum acts as a high-pressure air reservoir that periodically fills the detonation tube.
Although the unsteady flow in the detonation tube is complex and involves many wave
interactions, the main physical processes occurring during a cycle have been well documented
in previous studies.
Detonation/blowdown process
The specific gas dynamics during this process were studied in detail by Wintenberger
et al.13 for a static detonation tube. It was shown that as the detonation exits the tube,
a reflected wave, typically an expansion, propagates back towards the closed valve. After
interacting with the Taylor wave, this reflected expansion accelerates the fluid towards the
tube’s open end and decreases the pressure at the closed end of the tube. The pressure inside
the tube typically decreases below the ambient pressure3 at the end of the blowdown process
before returning to ambient pressure after about 20tCJ . This suggests that the valve for a
8 of 43
given tube must be closed for at least 10tCJ to maximize the impulse per cycle.
In an air-breathing PDE, the flow in the detonation tube differs from the static case
because of the interaction between the detonation and filling processes. Closing the valve
sends an expansion wave through the tube to decelerate the flow created by the filling process.
This expansion wave will be overtaken within the tube by a detonation that is initiated
immediately after valve closing. After this interaction, the detonation will propagate into
the uniform flow produced by the filling process. The thrust for this situation will be different
from the case of a detonation propagating into a stationary mixture but can be calculated
if we assume ideal valve closing and detonation initiation.
Purging/filling process
At the end of the detonation/blowdown process, the valve at the upstream end of the tube
opens instantaneously. This valve separates high-pressure air that was compressed through
the inlet and burned gases at ambient pressure and elevated temperature. Opening the valve
causes the high-pressure air to expand into the detonation tube. A shock wave is generated
and propagates into the detonation tube, followed by a contact surface between the fresh
air and the burned products. The fuel-air mixture is injected after a purging volume of air,
whose role is to prevent pre-ignition of the fresh mixture.
We analyzed the problem numerically with Amrita.43 The simulations used the non-
reactive Euler equations in an axisymmetric domain with a Kappa-MUSCL-HLLE solver.
The configuration tested, similar to that of Fig. 1, consists of a plenum connected by a
smooth area change to a straight tube open to a half-space. Two levels of adaptive mesh
refinement with a factor of 3 in each direction were used; the finest grid is equivalent to
a uniform mesh of about 140,000 points. The domain used to simulate the atmosphere
was large enough so that any disturbances reflected back from the extrapolation boundary
conditions did not influence the results. The simulations were started with high-pressure air
in the plenum at conditions given by PP /P0 = PR and TP /T0 = P(γ−1)/γR . The burned gases
in the tube were at pressure P0 and elevated temperature Tf = 7.69T0 representative of the
burned gas temperature at the end of the blowdown process. The air in the free-stream
region outside the detonation tube is at a static pressure P0 and temperature T0.
These numerical simulations, described in more detail by Wintenberger,42 lead to two
main conclusions. First, they show that the initial flow and subsequent wave interactions
inside the tube are essentially one-dimensional. Multi-dimensional effects are observed only
within one tube diameter of the tube exit, just after the exhaust of the incident shock.
Second, at valve opening, an unsteady expansion wave propagates upstream of the valve
inside the plenum, setting up a quasi-steady expansion of the plenum air into the detonation
9 of 43
tube. If the initial pressure difference across the valve is sufficiently large, an unsteady
expansion will be set up within the tube. These expansion waves are crucial to the filling
process and states created behind the subsequent detonation.
Modeling of the filling process
The filling process is critical because it determines the momentum and pressure contribu-
tions at the valve plane, which are necessary to compute the thrust (Eq. 5). Moreover, it also
determines the conditions in the tube prior to detonation initiation, necessary to accurately
predict the detonation tube impulse. Based on our numerical simulations, we model the
quantities at the valve plane with constant values during the filling process. This section
discusses our approach, explains how these values are calculated, and compares them with
the results of the numerical simulations.
Plenum/detonation tube coupling
The average plenum conditions can be estimated by analyzing the control volume shown
in Fig. 4. The cycle time is assumed to be much larger than the characteristic acoustic
transit time in the plenum so the plenum properties are assumed to be spatially uniform.
The plenum has a constant incoming mass flow rate and a non-zero outgoing mass flow
rate when the valve is open. The plenum cross section is much larger than the inlet and
the average flow velocity is very subsonic. We average the mass, momentum, and energy
conservation equations42 for the control volume VP defined in Fig. 4.
mV (t) = m0 (7)
mV (t)uV (t) = A2Pt2 − AV PV (t) + (AV − A2)PP (t) (8)
mV (t)htV (t) = m0ht2 (9)
where () indicates temporal averaging over a cycle.
The properties at the valve plane are modeled as piecewise-constant functions of time.
The velocity uV (t) and mass flow rate mV (t) are equal to zero when the valve is closed and
take on constant values when the valve is open. Assuming that the plenum volume is much
larger than the detonation tube volume, the plenum pressure will be approximately constant
throughout a cycle. The pressure at the valve plane equals the average plenum pressure
except when the valve is open, in which case, its value is determined from Eq. 8. Similarly,
the total enthalpy at the valve plane equals the average plenum total enthalpy htP when the
valve is closed, but according to Eq. 9, the total enthalpy has to be conserved between the
inlet and the valve plane so that htV = ht2 when the valve is open. The behavior of the
10 of 43

pressure and mass flow rate at the valve plane through a cycle is illustrated schematically in
Fig. 5.
The average conditions in the plenum are evaluated by considering the flow in the deto-
nation tube when the valve is open. Because the valve plane corresponds to a geometrical
throat, either sonic or subsonic flow at the valve plane may exist.
Sonic flow at the valve plane
When the valve opens, the unsteady expansion propagating upstream sets up a quasi-
steady expansion through the area change between the plenum and the detonation tube, and
decays when propagating through the area change. We assume that its propagation time
through the area change is much smaller than the time necessary to fill the detonation tube
and we neglect this initial transient.
The flow at the valve plane is sonic for sufficiently large values of the initial pressure
ratio across the valve plane. The flow configuration, shown in Fig. 6, consists of a left-
facing unsteady expansion in the plenum, a steady expansion through the area change,
and an unsteady expansion between the valve plane and the fresh air-burned gases contact
surface following a right-facing shock wave propagating in the tube. This flow configuration
is identical to that encountered in shock tubes with positive chambrage.44 The unsteady
expansion in the plenum is very weak after its propagation through the area change and we
neglect it based on the assumption of a large area ratio between the plenum and the valve.42
The unsteady expansion in the tube accelerates the flow from sonic at the valve plane to
supersonic behind the contact surface and decouples the plenum flow from the flow in the
detonation tube. The interactions of the shock wave with the open end and any subsequent
reflected waves are ignored. These assumptions are discussed further with respect to the
results of numerical simulations of the filling process.
The flow in the detonation tube is calculated by matching pressure and velocity across
the contact surface and solving for the shock Mach number.44
PP
P0
=1 + 2γb
γb+1(M2
S − 1)[√γa+1
2− γa−1
γb+1
cf
cP(MS − 1/MS)
] 2γaγa−1
(10)
Subsonic flow at the valve plane
For sufficiently small values of the initial pressure ratio across the valve plane (PP /PV <
((γa + 1)/2)γa
γa−1 ), the flow is subsonic at the valve plane without the unsteady expansion
in the detonation tube shown in Fig. 6. The velocity at the valve plane is equal to the
post-shock velocity in the burned gases. Because the filling process is modeled with a steady
11 of 43

expansion between the plenum and the valve plane, the average enthalpy in the plenum can
be estimated as the total enthalpy downstream of the inlet hP ≈ ht2. As in the sonic flow
case, the flow is solved by matching pressure and velocity across the contact surface.42
PP = P0
1 + 2γb
γb+1(M2
S − 1)[1− 2(γa−1)
(γb+1)2
(cf
cP
)2
(MS − 1/MS)2
] γbγb−1
(11)
Results and comparison with numerical simulations
The model predictions of the filling process are compared with the results of the numerical
simulations described previously. The valve plane velocity and pressure were calculated from
the two-dimensional simulations by spatially and temporally averaging these quantities along
the valve plane. The average filling velocity was calculated as the average velocity of the inlet
air-burned gas contact surface between the valve plane and the tube exit. These quantities,
along with the pressure at the valve plane, are shown in Fig. 7 as a function of the initial
pressure ratio PR for both model and simulations.
According to our one-dimensional model, the flow at the valve plane is expected to be
sonic above a critical pressure ratio equal to 3.19. For pressure ratios lower than this value,
the velocity at the valve plane is equal to the velocity of the contact surface: uV = Ufill.
For pressure ratios higher than this value, the flow configuration is that of Fig. 6; the flow
is sonic at the valve plane and an unsteady expansion accelerates the flow to supersonic
downstream of the valve plane. For this case, the values of the velocity at the valve plane
(equal to the speed of sound) and the filling velocity (equal to the post-shock velocity) are
different. The two curves in Fig. 7 correspond to these two cases.
The model predictions for the filling velocity and the pressure at the valve plane are
in reasonable agreement with the results of the numerical simulations, with a maximum
deviation of 11% and 20%, respectively. The model predictions for the velocity at the valve
plane are systematically higher than the numerical results by up to 40% near choking. These
discrepancies are attributed to two factors. First, the model neglects the transient before the
quasi-steady expansion is set up, which generates a lower flow velocity than the quasi-steady
expansion. Second, our one-dimensional model does not account for two-dimensional effects
such as oblique waves generated after valve opening.42
Although the two-dimensional numerical simulations show that the flow at the end of the
filling process is non-uniform in the downstream half of the tube,42 the spatial average of the
pressure and velocity in the tube are reasonably well predicted by our model. For values of
the pressure ratio between 2 and 10, the model predicts a pressure between 5.8% and 22.7%
higher than the numerical results, and a velocity between -11.3% and +23.5%.
12 of 43

Flow fluctuations in the plenum
The unsteady pressure waves generated by valve closing and opening strongly affect the
coupled flow in the plenum and the inlet. Since conventional steady inlets are sensitive to
downstream pressure fluctuations, it is critical to be able to model these flow fluctuations in
the engine.
In order to model the unsteady flow in the plenum, we solve the unsteady mass and energy
equations. Details and assumptions used in the derivation can be found in Wintenberger.42
The amplitudes of the fluctuations in density, temperature, and pressure in the plenum are:
∆ρP
ρP
=m0tclose
2VP ρP
(12)
∆TP
TP
=γ − 1
2· m0tclose
VP ρP
(13)
∆PP
PP
=m0tclose
VP ρP
(γ
2+
γ − 1
4· m0tclose
VP ρP
). (14)
These amplitudes are all controlled by the same non-dimensional parameter, which represents
the ratio of the amount of mass added to the system during the closed part of the cycle to
the average mass in the plenum. The response of the inlet shock wave to downstream
pressure fluctuations has been previously studied in the context of combustion instabilities
in ramjets. Culick and Rogers45 showed analytically and Oh et al.46 demonstrated through
numerical simulation that the shock response decreased with increasing frequency. Recent
experiments47 have confirmed this result for supersonic inlets specifically designed for PDEs.
PDE performance calculation
The model assumes that the flow in the detonation tube prior to detonation initiation
is uniform, moves at a velocity Ufill, and has a pressure equal to the post-shock pressure.
The conditions in the tube at the end of the filling process are modeled as uniform using the
average conditions derived from the numerical simulations. We now use the control volume
analysis of Fig. 2 to calculate the performance of our PDE.
PDE thrust equation
Consider computing the cycle average of the thrust equation, Eq. 5. The momentum and
pressure contributions of the detonation tube during the open part of the cycle (from tclose
to τ) are calculated using the model estimates for velocity and pressure at the valve plane
13 of 43

during the open part of the cycle. The cycle-averaged mass equation (Eq. 1) yields∫ τ
0
mV uV (t)dt = topenmV = τm0 . (15)
The contribution of the open part of the cycle is42
∫ τ
tclose
(mV (t)uV (t)dt + AV (PV (t)− P0)) dt = τm0uV + AV (PV − P0)topen . (16)
Substituting Eq. 16 into Eq. 5, the cycle-average thrust can be expressed as
F =1
τIdt + m0(uV − u0) +
topen
τAV (PV − P0) . (17)
The first term, the detonation tube impulse, is always positive. The second term, the ram
effect, is negative because of the flow losses associated with decelerating the flow through the
inlet and re-accelerating it unsteadily during the filling process. The third term, associated
with the pressure changes associated with valve operation, is positive because the air injected
during the filling process is at a higher pressure than the outside air. The sum of the last
two terms is always negative42 and represents an effective drag caused by flow losses and
unsteadiness through the inlet and the plenum.
Specific impulse and effect of purging time
The purging time has a strong influence on the specific performance. To see this, consider
the mass balance in the detonation tube when the valve is open. At the end of the purge
time, fuel is injected into the detonation tube just downstream of the valve. We assume that
the detonation tube volume equals the volume of injected detonable mixturea and suppose
ideal mixing at constant conditions to obtain
V =
(1 + f
1 + tpurge/tfill
)τm0
ρi
. (18)
It is critical here to make the distinction between the air mass flow rate m0 and the
average detonable mixture mass flow rate ρiV/τ . Using the mass balance in the detonation
tube, we calculate the average fuel mass flow rate
mF =ρiV f
(1 + f)τ=
m0f
1 + tpurge/tfill
. (19)
aThis means the length of the detonation tube is being varied with the operating conditions in this model.
14 of 43

The fuel-based specific impulse can now be found to be
ISPF =F
mF g
= ISPFdt −1 + tpurge/tfill
fg
[(u0 − uV )− AV (PV − P0)
mV
].
(20)
Because the term in brackets in Eq. 20 is positive, the specific impulse decreases linearly
with increasing purge time.42
Detonation tube impulse
The detonation tube impulse term in the thrust equation (Eq. 17) must be evaluated
for various operating conditions. The impulse due to the detonation process alone has
been measured1–5 for single-cycle operation and several models have been proposed.3,11,13
However, the flow downstream of the propagating detonation wave in a multi-cycle engine is
not at rest because of the filling process and must be accounted for. Experiments3,19,23 have
been carried out for multi-cycle operation, but in many cases, impulse can be predicted by
the single-cycle estimates13 because of the low filling velocity in these tests.
However, during supersonic flight, the average stagnation pressure in the plenum is much
higher than the pressure in the tube at the end of the blowdown process. This large pressure
ratio generates high filling velocities, which can significantly alter the flow field and the
detonation/blowdown process so we include this effect in our model. In this model, we
assume the detonation wave is immediately initiated after valve closing and catches up with
the expansion wave generated by the valve closing. The situation corresponds to a detonation
wave propagating in a flow moving in the same direction as the filling velocity and is observed
in the multi-cycle numerical simulations of an air-breathing PDE by Wu et al.30 and Ma et
al.31
Detonation tube impulse model
The moving flow ahead of the detonation is assumed to have a velocity Ufill. Following
the detonation is the Taylor wave,48,49 which brings the products back to rest near the closed
end of the tube. In the moving-flow case, the energy release across the wave is identical to the
no-flow case and the CJ pressure, temperature, density, and speed of sound are unchanged.
However, the wave is now moving at a velocity UCJ + Ufill with respect to the tube, which
results in a stronger flow expansion than in the no-flow case. A similarity solution can be
derived using the method of characteristics and is described in Wintenberger.42
The detonation tube impulse is calculated as the integral of the pressure trace at the
15 of 43

valve plane
Idt =
∫ tclose
0
AV (P3(t)− P0)dt . (21)
Using dimensional analysis, we idealize the pressure trace at the valve plane and model the
pressure trace integral in a similar fashion as described in Wintenberger et al.13 (Fig. 5).
The pressure history is modeled by a constant pressure region followed by a decay due to
gas expansion out of the tube. The pressure integral can be expressed as∫ τ
topen
(P3(t)− P0)dt = ∆P3
[L
UCJ + Ufill
+ (α + β)L
c3
](22)
where ∆P3 = P3 − P0, α is a non-dimensional parameter characterizing the time taken by
the first reflected characteristic at the open end to reach the closed end, and β is a non-
dimensional parameter characterizing the pressure decay period.13 The first term in the
square brackets in Eq. 22 is equal to the time taken by the detonation wave to propagate
to the open end. As in the no-flow case, it is possible to derive a similarity solution for the
reflection of the first characteristic at the open end and to analytically calculate α. The
reader is referred to Wintenberger et al.13 for the details of the derivation in the no-flow
case. For the moving-flow case, the value of α is
α =c3
UCJ + Ufill
[2
(γb − 1
γb + 1
(c3 − uCJ
cCJ
+2
γb − 1
))− γb+1
2(γb−1)
− 1
]. (23)
The value of β is assumed to be independent of the filling velocity and the same value as in
Wintenberger et al.13 is used: β = 0.53. It is expected and observed50 that β will also be a
function of the pressure ratio P3/P0 and in addition, the free stream Mach number-an effect
that no observations are available for at the present time. When improved correlations for
β are developed, the model can be revised to include these effects.
Comparison with numerical simulations of detonation process
In order to validate the model for the valve plane pressure integration (Eq. 22), the flow
was simulated numerically with Amrita.43 The axisymmetric computational domain consists
of a tube of length L closed at the left end and open to a half-space at the right end. The
moving flow was assumed to be uniform inside the tube, and outside was a rectangular profile
representing an idealized pressure-matched jet flow at constant velocity Ufill. A modified
Taylor wave similarity solution42 was used as an initial condition, assuming the detonation
has just reached the open end of the tube when the simulation is started. This solution
was calculated using a one-γ model for detonations51,52 for a non-dimensional energy release
16 of 43

q/RTi = 40 across the detonation and γ = 1.2 for reactants and products. The corresponding
CJ parameters are MCJ = 5.6 and PCJ/Pi = 17.5, values representative of stoichiometric
hydrocarbon-air mixtures. The pressure Pi ahead of the detonation wave was taken equal
to the pressure P0 outside the detonation tube.
The configuration we adopted for the moving flow is a very idealized representation of the
flow at the end of the filling process. This flow will, in reality, include vortices associated with
the unsteady flow and the unstable jet shear layers. However, the analysis of the numerical
simulations showed that the flow in the tube is one-dimensional except for within one to two
tube diameters from the open end, as observed in the no-flow case by Wintenberger et al.13
Since the exit flow is choked for most of the process, we expect that the influence of our
simplified jet profile on the valve plane pressure integration is minimal.
Figure 8 shows the comparison of the non-dimensionalized valve plane pressure integral
with the predictions of our model based on Eq. 22 as a function of the filling Mach number.
The numerical pressure integration was carried out for a time equal to 20tCJ , where tCJ =
L/UCJ . As the filling Mach number increases, the flow expansion through the Taylor wave
is more severe and the plateau pressure behind the Taylor wave P3 decreases. Even though
P3 is lower, the blowdown process is accelerated due to the presence of the initial moving
flow. The overall result is that the detonation tube impulse decreases with increasing filling
Mach number, as shown in Fig. 8. The model agrees reasonably well with the results of the
numerical simulations. It generally overpredicts the results of the numerical simulations by
as much as 25% at higher filling Mach numbers. The agreement is better at lower Mach
numbers (within 11% error for Mfill ≤ 2 and 4% for Mfill ≤ 1).
Application to hydrogen- and JP10-fueled PDEs
We have carried out performance calculations with hydrogen and JP10 fuels and com-
pared the results with ideal ramjet performance. The performance calculations are presented
for supersonic flight only because the assumptions made in the derivation of the model
become invalid for subsonic flight. The results presented here do not represent the ideal
performance from an optimized PDE. In particular, the influence of the addition of an exit
nozzle on the engine performance is expected to substantially improve the performance.
Input parameters
The input parameters for the performance model consist of the free-stream conditions
and flight Mach number, the fuel type and stoichiometry, the valve close time, and the
purge time. In the following performance calculations, the fuel-air mixture is assumed to be
stoichiometric.
The stagnation pressure loss across the inlet during supersonic flight is modeled using
17 of 43

the military specification MIL-E-5008B,53 which specifies the stagnation pressure ratio across
the inlet as a function of the flight Mach number, for M0 > 1.
Pt2
Pt0
= 1− 0.075(M0 − 1)1.35 (24)
In our calculations, we assumed fixed valve area AV and valve close time tclose. Other
parameters such as valve open time and detonation tube length are determined by the pe-
riodicity of the system. The calculation of the properties at the valve plane and the initial
conditions in the detonation tube require the knowledge of the specific heat ratio and the
speed of sound in the burned gases at the end of the blowdown process. These parame-
ters and the CJ detonation properties are obtained by carrying out detonation equilibrium
computations using realistic thermochemistry.54 The speed of sound in the burned gases
is calculated assuming that the flow is isentropically expanded from the CJ pressure to at-
mospheric pressure. The iterative method used to obtain the solution is described in detail
in Wintenberger.42
Hydrogen-fueled PDE
Conditions inside the engine
The calculation of performance parameters first requires solving for the conditions inside
the engine. Figure 9 shows the velocity and pressure at selected points for a PDE operating
with stoichiometric hydrogen-air at an altitude of 10 km, with parameters A0=0.004 m2,
A2=0.04 m2, and AV =0.006 m2. On the left is shown filling velocity and velocity at the valve
plane as a function of flight Mach number. On the right is shown inlet stagnation pressure,
plenum pressure, pressure at the valve plane, and filling pressure non-dimensionalized with
free-stream total pressure as a function of flight Mach number.
In this case, the flow at the valve plane during the filling process is predicted to remain
subsonic up to a flight Mach number of 1.36. Thus, the two velocity curves on Fig. 9 match
for M0 < 1.36 but diverge at higher values of M0 because Ufill > uV . The filling velocity
increases with increasing flight Mach number because of the increasing stagnation pressure
in the plenum, which generates a stronger shock wave at valve opening.
The model filling velocity was compared with the results of the numerical simulations of
Wu et al.30 for an air-breathing PDE with a straight detonation tube for a PDE flying at 9.3
km altitude and at Mach 2.1. The flow observed in these simulations is qualitatively similar
to the flow predicted by the model in the detonation tube and represented schematically
in Fig. 6. The numerical simulations yielded a filling velocity of about 500 m/s, while the
prediction of our model for this case is 539 m/s.
The ratio of inlet stagnation pressure to free-stream stagnation pressure in Fig. 9 de-
18 of 43

creases with increasing flight Mach number because of the increasing stagnation pressure
losses through the inlet (Eq. 24). Additional losses occur in the plenum due to flow un-
steadiness. The pressure at the valve plane equals the filling pressure until the flow at the
valve plane becomes sonic. At higher flight Mach numbers, the filling pressure is lower be-
cause of the additional unsteady expansion in the tube. The ratio of the filling pressure to
the free-stream stagnation pressure decreases sharply with increasing flight Mach number
because of the increasing filling velocity (Fig. 9).
Performance variation with flight Mach number
The specific impulse for a hydrogen-air PDE is shown in Fig. 10 as a function of the
flight Mach number for conditions at sea level and at 10 km altitude; other parameters
are A0=0.004 m2, A2=0.04 m2, and AV =0.006 m2. These results are for no purging, and
represent the maximum possible values for this configuration. Even though the model as-
sumptions do not apply for subsonic flight, linear extrapolation of the results to M0 = 0 are
close to the observed and computed static values. Our single-tube PDE generates thrust
up to a flight Mach number of 3.9 at sea level and 4.2 at an altitude of 10 km. Data from
multi-cycle numerical simulations by Wu et al.30 for M0=2.1 at 9,300 m altitude are shown.
Experimental data from Schauer et al.23 and impulse model predictions13 are also given as a
reference for the static (M0=0) case. The shaded area represents the possible range of values
due to the uncertainty in the input parameters and model assumptions.
The specific impulse decreases almost linearly with increasing flight Mach number from
a value at M0=1 of about 3530 s at 10 km and 3390 s at sea level. This behavior is mainly
due to the reduction in detonation tube impulse with increasing flight Mach number, which
is caused by the increase in filling velocity (Figs. 9 and 8). The variation with Mach number
of the sum of the momentum and pressure terms in Eq. 20 is much smaller than that of
the detonation tube impulse term.42 Figure 10 also shows a datum from the numerical
simulations by Wu et al.30 The baseline case value for the specific impulse for a straight
detonation tube is 2328 s.30 Our model prediction for the same configuration and flight
conditions is 2286 s.
Performance variation with altitude
The specific impulse at sea level is systematically lower than the specific impulse at 10 km
by 150-300 s, as shown in Fig. 10. The free-stream pressure and temperature both change
with altitude. However, the specific impulse is independent of the free-stream pressure since
the detonation tube specific impulse is essentially independent of the initial state in the static
case.13 This conclusion can be extended to the moving-flow case because the filling velocity
is independent of the free-stream static pressure. Since the momentum and pressure terms in
19 of 43

the specific impulse expression are also unaffected by pressure variations, the engine specific
impulse does not depend on the free-stream pressure.
Specific impulse decreases with increasing free-stream static temperature. Although the
magnitude of the drag terms in Eq. (20) increases with the free-stream temperature, it is
the change in detonation tube impulse which is primarily responsible for the reduction in
specific impulse. Increasing the free-stream temperature results in a stronger shock wave at
valve opening and, therefore, a higher filling velocity. The variation observed is attributed
to the effect of the filling velocity because the detonation tube specific impulse is essentially
independent of initial conditions.13 Indeed, increasing T0 from 223 K to 288 K causes an
increase in Ufill of about 10%, which translates to a detonation tube impulse decrease of
100-180 s.
JP10-fueled PDE
The specific impulse of a JP10-fueled PDE is shown in Fig. 11 for an altitude of 10
km; the other parameters are A0=0.004 m2, A2=0.04 m2, and AV =0.006 m2. Data from
multi-cycle numerical simulations by Wu et al.30 for M0=2.1 at 9,300 m altitude are shown.
Experimental data from Schauer et al.23 and Caltech55 and impulse model predictions13 are
also given as a reference for the static (M0=0) case. The specific impulse decreases almost
linearly with increasing M0 from a value of 1370 s at M0 = 1 and vanishes at M0 ≈ 4.
There are additional issues associated with the use of a liquid fuel such as JP10 that merit
discussion.
Pre-ignition of the JP10-air mixture is expected42 above Mach 3 if the fuel injection
system is located at the valve plane. Pre-ignition can result in a significant decrease in deto-
nation tube impulse due to potential expulsion of unburned reactants out of the detonation
tube5 and a reduced thrust surface effectiveness.56 The design of the fuel injection system
for high Mach numbers has to take into account this issue. An option is to move it down-
stream of the valve plane, where the temperature is lower due to the unsteady expansion
downstream of the valve.
Another issue with the use of liquid hydrocarbon fuels is related to potential condensation
of the fuel in the detonation tube due to the low filling temperature. For the case considered
here, the filling temperature remains under 300 K as long as M0 < 2.3. In order to vaporize
the fuel completely for a stoichiometric JP10-air mixture at 100 kPa, the temperature has to
be at least 330 K.57 Both pressure and temperature in the detonation tube vary with flight
Mach number, and whether all the liquid fuel injected will vaporize depends on its vapor
pressure under these conditions. It is substantially more difficult to establish self-sustaining
detonations in liquid fuel sprays than gases due to higher initiation energies58 and larger
20 of 43

reaction zones. It is possible that not all the fuel corresponding to stoichiometric quantity
will be able to vaporize and the engine may have to be run at a leaner composition depending
on the flight conditions.
Limitations of the present model and uncertainty analysis
Our model is based on one-dimensional flow. It also assumes a uniform flow in the
detonation tube prior to detonation initiation. Further, the state in the detonation tube prior
to valve opening is assumed to be a uniform, stationary flow of hot products expanded to the
free-stream pressure. The present model cannot account for two-dimensional effects resulting
from engine internal geometry, flow non-uniformities, and variations in valve open and close
times that affect the downstream boundary conditions. For this reason, it is important to
validate our approach against available computational and experimental results.
Unfortunately, at this time, there is no standard set of results to which our model can be
compared over the entire range of flight conditions. At present, only Wu et al.30 and Ma et
al.31 have published results for the configuration we are considering. Our work agrees within
2% with their results at a single flight condition and, by construction, agrees with existing
models and experiments at static conditions. Absent other validation points, we have tried to
develop more confidence in the results by estimating the effect of the uncertainty in modeling
parameters on the performance computations.
We know from our numerical simulations of the filling process the uncertainty of the
model predictions for some of the parameters, shown in Table 1. We estimated the model
uncertainty for a case corresponding to a stoichiometric hydrogen-air PDE flying at 10 km
with no purging. We evaluated how the specific impulse varies with each parameter with
calculations corresponding to extreme assumptions.42 The region of uncertainty is shown
in Fig. 10 as the grey shaded area around the predicted specific impulse curve at 10 km.
As expected, the uncertainty margin increases with increasing flight Mach number due to
the growing uncertainty on the detonation tube impulse. The uncertainty for the specific
impulse at M0 = 1 is ±9.9% and at M0 = 2, -36.5%/+12.7%.
Comparison with the ideal ramjet
The specific impulse of the model PDE is compared in Fig. 11 with that of the ideal
ramjet at flight conditions corresponding to 10 km altitude for stoichiometric hydrogen- and
JP10-air. The ideal ramjet performance was calculated following the ideal Brayton cycle,
taking into account the stagnation pressure loss across the inlet (Eq. 24). Combustion at
constant pressure was computed using realistic thermochemistry,54 and performance was
calculated assuming thermodynamic equilibrium at every point in the nozzle. According to
our performance predictions, the single-tube air-breathing PDE in the present configuration
21 of 43

(straight detonation tube) has a higher specific impulse than the ideal ramjet for M0 < 1.35
for both hydrogen and JP10 fuels.
The lack of performance of the PDE at higher flight Mach numbers is attributed to the
decreasing detonation tube impulse. The present configuration results in very high filling
velocities (higher than 500 m/s for M0 > 2), which has two main consequences. First, the
pressure and density of the reactants before detonation initiation are low compared to the
corresponding properties in the plenum (Fig. 9). The detonation tube impulse being propor-
tional to the initial mixture density,13 a low reactant density is detrimental to the specific
impulse. The straight-tube PDE exhibits the same problem as the standard pulsejet,34 which
is the inability of the engine to sustain ram pressure in the detonation tube during the filling
process. Indeed, our specific impulse predictions for the straight-tube PDE display the same
behavior as Foa’s predictions34 for the standard pulsejet, decreasing almost linearly with
increasing flight Mach number. Second, as shown in Fig. 8, the detonation tube impulse
decreases sharply with increasing filling velocity. For example, if the filling velocity were to
be reduced to half of its value at M0 = 2 for a hydrogen-air PDE flying at 10 km, our model
predicts that the detonation tube impulse would increase by as much as 36%.
The results of our performance calculations show that the unoptimized, straight-tube
PDE is not competitive with the ramjet at high supersonic flight Mach numbers. However,
this comparison of our unoptimized, straight-tube PDE with an optimized-nozzle ramjet
immediately brings up the issue of the need to consider further optimization of the PDE.
In particular, the addition of diverging and converging-diverging nozzles has been shown
to significantly improve the static impulse of detonation tubes, especially at high pressure
ratios.50,59,60 Adding a choked converging-diverging exit nozzle to an air-breathing PDE has
been proposed by several researchers30,61 as a means to increase the chamber pressure and
decrease the effective filling velocity. The strong sensitivity of the detonation tube impulse to
the filling velocity suggests a potential for improving performance, provided that the filling
velocity can be decreased without excessive internal flow losses. The numerical simulations
of Wu et al.30 and Ma et al.31 support this idea, showing an increase in specific impulse of up
to 45% with the addition of a converging-diverging nozzle. The idea of extending the present
model to include a nozzle is interesting, but the many additional wave interactions generated
by the area changes in the nozzle make it difficult to develop a model consistent with our
approach. The present calculations can be used as a baseline case for nozzle optimization
studies.
22 of 43
Conclusions
We have developed a simple model for predicting the performance of a single-tube, super-
sonic, air-breathing PDE based on gas dynamics and control volume methods. The model
takes into account the behavior of the flow in the various components of the engine and their
respective coupling. We have used our model and simulation of individual components to
draw the following conclusions:
1. The filling process is characterized by a shock wave generated at valve opening and
propagating in the detonation tube and a combination of unsteady and steady expan-
sions between the plenum and the detonation tube.
2. The unsteadiness of the flow in the plenum, which is coupled to the flow in the deto-
nation tube, causes average stagnation pressure losses.
3. The flow in the plenum is characterized by density, temperature, and pressure oscilla-
tions due to the opening and closing of the valve during a cycle.
4. The thrust of the engine was calculated using an unsteady open-system control volume
analysis. It was found to be the sum of three terms representing the detonation tube
impulse, the momentum, and the pressure at the valve plane.
5. The detonation tube impulse was calculated by modifying our single-cycle impulse
model13 to take into account the effect of detonation propagation into a moving flow
generated by the filling process. The detonation tube impulse is found to decrease
sharply with increasing filling velocity.
6. Performance calculations for hydrogen- and JP10-fueled PDEs showed that the specific
impulse decreases approximately linearly with increasing flight Mach number, and that
single-tube PDEs generate thrust up to a flight Mach number of about 4.
7. PDEs with a straight detonation tube have a higher specific impulse than the ramjet
below a minimum value of the flight Mach number, equal to 1.35 in the present case.
PDE performance was found to be very sensitive to the value of the filling velocity,
and substantial potential improvements may be possible with a converging-diverging
nozzle at the exit.
Although items 1–3 have long been recognized by PDE researchers, we have provided quan-
tification of these effects and show how they depend on the system parameters. Item 4
and the subsequent conclusions in item 6 and 7 provide quantitative predictions of how the
performance of a straight-tube pulse detonation engine will depend on flight Mach number.
23 of 43

The previous studies have computed performance at single flight Mach number only. Item 5
has not been recognized explicitly by the previous computation studies and we have shown
how to take this in account explicitly in the spirit of the gas dynamic model13 that has
been successful62 in predicting low-speed PDE performance. We recognize that significant
performance improvements may be obtained with the addition of an optimized nozzle and
the present results do not represent the best performance that can be obtained for PDEs.
Acknowledgments
This work was supported by Stanford University Contract PY-1905 under Dept. of
Navy Grant No. N00014-02-1-0589 “Pulse Detonation Engines: Initiation, Propagation, and
Performance”.
References1Nicholls, J. A., Wilkinson, H. R., and Morrison, R. B., “Intermittent Detonation as a
Thrust-Producing Mechanism,” Jet Propulsion, Vol. 27, No. 5, 1957, pp. 534–541.
2Zhdan, S. A., Mitrofanov, V. V., and Sychev, A. I., “Reactive Impulse from the Explo-
sion of a Gas Mixture in a Semi-infinite Space,” Combustion, Explosion and Shock Waves ,
Vol. 30, No. 5, 1994, pp. 657–663.
3Zitoun, R. and Desbordes, D., “Propulsive Performances of Pulsed Detonations,” Com-
bustion, Science and Technology , Vol. 144, 1999, pp. 93–114.
4Harris, P. G., Farinaccio, R., Stowe, R. A., Higgins, A. J., Thibault, P. A., and
Laviolette, J. P., “The Effect of DDT Distance on Impulse in a Detonation Tube,” 37th
AIAA/ASME/SAE/ASEE Joint Propulsion Conference and Exhibit, July 8–11, 2001, Salt
Lake City, UT, AIAA 2001-3467.
5Cooper, M., Jackson, S., Austin, J., Wintenberger, E., and Shepherd, J. E., “Direct Ex-
perimental Impulse Measurements for Deflagrations and Detonations,” Journal of Propulsion
and Power , Vol. 18, No. 5, 2002, pp. 1033–1041.
6Kiyanda, C. B., Tanguay, V., Higgins, A. J., and Lee, J. H. S., “Effect of Transient
Gasdynamic Processes on the Impulse of Pulse Detonation Engines,” Journal of Propulsion
and Power , Vol. 18, No. 5, 2002, pp. 1124–1126.
7Mattison, D., Oehischlaeger, M. A., Morris, C. I., Owens, Z. C., Barbour, E. A., Jeffries,
J. B., and Hanson, R. K., “Evaluation of pulse detonation engine modeling using laser-based
temperature and OH concentration measurements,” Proceedings of the Combustion Institute,
Vol. 30, No. 2, 2005, pp. 2799–2807.
24 of 43

8Kailasanath, K. and Patnaik, G., “Performance Estimates of Pulsed Detonation En-
gines,” Proceedings of the 28th International Symposium on Combustion, The Combustion
Institute, 2000, pp. 595–601.
9Kailasanath, K., Patnaik, G., and Li, C., “The Flowfield and Performance of Pulse
Detonation Engines,” Proceedings of the 29th International Symposium on Combustion, The
Combustion Institute, 2002, pp. 2855–2862.
10Morris, C., “Numerical modeling of single-pulse gasdynamics and performance of pulse
detonation rocket engines,” Journal of Propulsion and Power , Vol. 21, No. 3, 2005, pp. 527–
538.
11Endo, T. and Fujiwara, T., “A Simplified Analysis on a Pulse Detonation Engine,”
Trans. Japan Soc. Aero. Space Sci., Vol. 44, No. 146, 2002, pp. 217–222.
12Ebrahimi, H. B., Mohanraj, R., and Merkle, C. L., “Multilevel Analysis of Pulsed
Detonation Engines,” Journal of Propulsion and Power , Vol. 18, No. 2, 2002, pp. 225–232.
13Wintenberger, E., Austin, J. M., Cooper, M., Jackson, S., and Shepherd, J. E., “Ana-
lytical Model for the Impulse of Single-Cycle Pulse Detonation Tube,” Journal of Propulsion
and Power , Vol. 19, No. 1, 2003, pp. 22–38.
14Endo, T., Kasahara, J., Matsuo, A., Inaba, K., Sato, S., and Fujiwara, T., “Pressure
history at the thrust wall of a simplified pulse detonation engine,” AIAA Journal , Vol. 42,
No. 9, 2004, pp. 1921–1930.
15Radulescu, M. I. and Hanson, R. K., “Effect of heat loss on pulse-detonation-engine flow
fields and performance,” Journal of Propulsion and Power , Vol. 21, No. 2, 2005, pp. 274–285.
16Kailasanath, K., Patnaik, G., and Li, C., “Computational Studies of Pulse Detonation
Engine: A Status Report,” 35th AIAA/ASME/SAE/ASEE Joint Propulsion Conference and
Exhibit, June 20–24, 1999, Los Angeles, CA, AIAA 1999-2634.
17Kailasanath, K., “Recent Developments in the Research on Pulse Detonation Engines,”
AIAA Journal , Vol. 41, No. 2, 2003, pp. 145–159.
18Owens, Z. C., Mattison, D., Barbour, E. A., Morris, C. I., and Hanson, R. K., “Flowfield
characterization and simulation validation of multiple-geometry PDEs using cesium-based
velocimetry,” Proceedings of the Combustion Institute, Vol. 30, No. 2, 2005, pp. 2791–2798.
19Kasahara, J., Takazawa, K., Arai, T., and Matsuo, A., “Experimental Study of Impulse
and Heat Transfer on Pulse Detonation Engines,” 38th AIAA/ASME/SAE/ASEE Joint
Propulsion Conference and Exhibit, July 7–10, 2002, Indianapolis, IN, AIAA 2002-4071.
20Brophy, C. M., Werner, L. S., and Sinibaldi, J. O., “Performance Characterization of
a Valveless Pulse Detonation Engine,” 41st AIAA Aerospace Sciences Meeting and Exhibit,
January 6–9, 2003, Reno, NV, AIAA 2003-1344.
25 of 43
21Hoke, J. L., Bradley, R. P., and Schauer, F. R., “Impact of DDT Mechanism, Combus-
tion Wave Speed, Temperature, and Charge Quality on Pulsed-Detonation-Engine Perfor-
mance,” 43th AIAA Aerospace Sciences Meeting, January 10-13, 2005, AIAA 2005-1342.
22Tangirala, V., Dean, A. J., Pinard, P. F., and Varatharajan, B., “Investigations of cycle
processes in a pulsed detonation engine operating on fuel-air mixtures,” Proceedings of the
Combustion Institute, Vol. 30, No. 2, 2005, pp. 2817–2824.
23Schauer, F., Stutrud, J., and Bradley, R., “Detonation Initiation Studies and Perfor-
mance Results for Pulsed Detonation Engines,” 39th AIAA Aerospace Sciences Meeting and
Exhibit, January 8–11, 2001, Reno, NV, AIAA 2001-1129.
24Schauer, F. R., Miser, C. L., Tucker, K. C., Bradley, R. P., and Hoke, J. L., “Deto-
nation Initiation of Hydrocarbon-Air Mixtures in a Pulsed Detonation Engine,” 43th AIAA
Aerospace Sciences Meeting, January 10-13, 2005, AIAA 2005-1343.
25Schauer, F., Stutrud, J., Bradley, R., Katta, V., and Hoke, J., “Detonation Initia-
tion and Performance in Complex Hydrocarbon Fueled Pulsed Detonation Engines,” 50th
JANNAF Propulsion Meeting, Paper I-05, July 11–13, 2001, Salt Lake City, UT.
26Cambier, J. L. and Tegner, J. K., “Strategies for Pulsed Detonation Engine Performance
Optimization,” Journal of Propulsion and Power , Vol. 14, No. 4, 1998, pp. 489–498.
27Paxson, D. E., “Performance Evaluation Method for Ideal Airbreathing Pulse Detona-
tion Engines,” Journal of Propulsion and Power , Vol. 20, No. 5, 2004, pp. 945–950.
28Bratkovich, T. and Bussing, T., “A Pulse Detonation Engine Performance Model,” 31st
AIAA/ASME/SAE/ASEE Joint Propulsion Conference and Exhibit, July 10–12, 1995, San
Diego, CA, AIAA 95–3155.
29Kaemming, T., “Integrated Vehicle Comparison of Turbo-Ramjet Engine and Pulsed
Detonation Engine (PDE),” J. of Eng. for Gas Turbines and Power. Trans. ASME , Vol. 125,
No. 1, January 2003, pp. 257–262.
30Wu, Y., Ma, F., and Yang, V., “System Performance and Thermodynamic Cycle Analy-
sis of Airbreathing Pulse Detonation Engines,” Journal of Propulsion and Power , Vol. 19,
No. 4, 2003, pp. 556–567.
31Ma, F.-H., Choi, J.-Y., and Yang, V., “Thrust Chamber Dynamics and Propulsive
Performance of Single-Tube Pulse Detonation Engines,” Journal of Propulsion and Power ,
Vol. 21, No. 3, 2005, pp. 512–526.
32Ma, F.-H., Choi, J.-Y., and Yang, V., “Thrust Chamber Dynamics and Propulsive
Performance of Multitube Pulse Detonation Engines,” Journal of Propulsion and Power ,
Vol. 21, No. 4, 2005, pp. 681–691.
26 of 43

33Heiser, W. H. and Pratt, D. T., “Thermodynamic Cycle Analysis of Pulse Detonation
Engines,” Journal of Propulsion and Power , Vol. 18, 2002, pp. 68–76.
34Foa, J. V., Elements of Flight Propulsion, John Wiley & Sons, Inc, New York, 1960.
35Bussing, T. and Pappas, G., “Pulse Detonation Engine Theory and Concepts,” Progress
in Astronautics and Aeronautics , Vol. 165, 1996, pp. 421–472.
36Kentfield, J. A. C., “Fundamentals of Idealized Airbreathing Pulse-Detonation En-
gines,” Journal of Propulsion and Power , Vol. 18, No. 1, 2002, pp. 77–83.
37Talley, D. and Coy, E., “Constant Volume Limit of Pulsed Propulsion for a Constant
Gamma Ideal Gas,” Journal of Propulsion and Power , Vol. 18, No. 2, 2002, pp. 400–406.
38Harris, P. G., Guzik, S., Farinaccio, R., Stowe, R. A., Whitehouse, D., Josey, T.,
Hawkin, D., Ripley, R., Link, R., Higgins, A. J., and Thibault, P. A., “Comparative Evalua-
tion of Performance Models of Pulse Detonation Engines,” 38th AIAA/ASME/SAE/ASEE
Joint Propulsion Conference and Exhibit, July 7–10, 2002, Indianapolis, IN, AIAA 2002-
3912.
39Harris, P. G., Ripley, R. C., and Guzik, S. M., “Single-Tube Two-Dimensional Evalua-
tion of Pulse Detonation Engine as a Ramjet Replacement,” 40th AIAA/ASME/SAE/ASEE
Joint Propulsion Conference and Exhibit, July 11-14, 2004, Ft. Lauderdale, FL, AIAA 2004-
3744.
40Harris, P. G., Guzik, S. M., and Stowe, R. A., “Design Methodology for a Pulse Deto-
nation Engine as a Ramjet Replacement,” 40th AIAA/ASME/SAE/ASEE Joint Propulsion
Conference and Exhibit, July 11-14, 2004, Ft. Lauderdale, FL, AIAA 2004-3400.
41Lynch, E. D. and Edelman, R. B., “Analysis of the Pulse Detonation Wave Engine,”
Progress in Astronautics and Aeronautics , Vol. 165, 1996, pp. 473–516.
42Wintenberger, E., Application of Steady and Unsteady Detonation Waves to Propulsion,
Ph.D. thesis, California Institute of Technology, Pasadena, California, June 2004.
43Quirk, J. J., “AMRITA - A Computational Facility (for CFD Modelling),” VKI 29th
CFD Lecture Series, ISSN 0377-8312, 1998.
44Glass, I. I. and Sislian, J. P., Nonstationary Flows and Shock Waves , Clarendon Press,
Oxford, 1994.
45Culick, F. E. C. and Rogers, T., “The Response of Normal Shocks in Diffusers,” AIAA
Journal , Vol. 21, No. 10, 1983, pp. 1382–1390.
46Oh, J. Y., Ma, F., Hsieh, S.-Y., and Yang, V., “Interactions Between Shock and
Acoustic Waves in a Supersonic Inlet Diffuser,” Journal of Propulsion and Power , Vol. 21,
No. 3, 2005, pp. 486–495.
27 of 43

47Mullagiri, S., Segal, C., and Hubner, P. J., “Oscillating Flows in a Model Pulse Deto-
nation Engine,” AIAA Journal , Vol. 41, No. 2, 2003, pp. 324–326.
48Zel’dovich, Y. B., “On the Theory of the Propagation of Detonations in Gaseous
Systems,” Journal of Experimental and Theoretical Physics , Vol. 10, 1940, pp. 542–568,
Available in translation as NACA TM 1261 (1950).
49Taylor, G. I., “The Dynamics of the Combustion Products behind Plane and Spherical
Detonation Fronts in Explosives,” Proc. Roy. Soc., Vol. A200, 1950, pp. 235–247.
50Cooper, M. and Shepherd, J. E., “Effect of Transient Nozzle Flow on Detonation Tube
Impulse,” 40th AIAA/ASME/SAE/ASEE Joint Propulsion Conference and Exhibit, July
11-14, 2004, Ft. Lauderdale, FL, AIAA 2004-3914.
51Fickett, W. and Davis, W. C., Detonation Theory and Experiment , Dover Publications
Inc., 2001.
52Thompson, P. A., Compressible Fluid Dynamics , Advanced Engineering Series, Rens-
selaer Polytechnic Institute, pp. 347–359, 1988.
53Mattingly, J. D., Heiser, W. H., and Daley, D. H., Aircraft Engine Design, AIAA
Education Series, 1987.
54Reynolds, W., “The Element Potential Method for Chemical Equilibrium Analysis:
Implementation in the Interactive Program STANJAN,” Tech. rep., Mechanical Engineering
Department, Stanford University, 1986.
55Wintenberger, E., Austin, J. M., Cooper, M., Jackson, S., and Shepherd, J. E., “Im-
pulse of a Single-Pulse Detonation Tube,” Tech. rep., Graduate Aeronautical Laboratories,
California Institute of Technology, 2002, Report FM00-8.
56Cooper, M. and Shepherd, J. E., “Effect of a Porous Thrust Surface on Detonation
Transition and Detonation Tube Impulse,” Journal of Propulsion and Power , Vol. 20, No. 5,
2004, pp. 811–819.
57Austin, J. M. and Shepherd, J. E., “Detonations in Hydrocarbon Fuel Blends,” Com-
bustion and Flame, Vol. 132, 2003, pp. 73–90.
58Papavassiliou, J., Makris, A., Knystautas, R., Lee, J. H. S., Westbrook, C. K., and Pitz,
W. J., “Measurements of Cellular Structure in Spray Detonation,” Progress in Aeronautics
and Astronautics , Vol. 154, 1993, pp. 148–169.
59Cooper, M., Impulse Generation by Detonation Tubes , Ph.D. thesis, California Institute
of Technology, Pasadena, California, June 2004.
60Morris, C., “Axisymmetric Modeling of Pulse Detonation Rocket Engines,” 41st
AIAA/ASME/SAE/ASEE Joint Propulsion Conference and Exhibit, July 10-13, 2005, Tuc-
son, AZ, AIAA 2005-3508.
28 of 43

61Kailasanath, K., “A Review of Research on Pulse Detonation Engine Nozzles,” 37th
AIAA/ASME/SAE/ASEE Joint Propulsion Conference and Exhibit, July 8–11, 2001, Salt
Lake City, UT, AIAA 2001-3932.
62Cooper, M., Shepherd, J. E., and Schauer, F., “Impulse correlation for partially-filled
tubes,” Journal of Propulsion and Power , Vol. 20, No. 5, 2004, pp. 947–950.
29 of 43

List of Tables1 Uncertainty of some of the model parameters derived from the results of the
numerical simulations of the filling and detonation processes. . . . . . . . . . 31
30 of 43

Parameter Minimum (%) Maximum (%)Ufill -11.3 +23.5uV 0 +40PV -20.5 +13.4Pi +5.8 +22.7
ISPFdt 0 +25
Table 1: Uncertainty of some of the model parameters derived from the results ofthe numerical simulations of the filling and detonation processes.
31 of 43

List of Figures1 Schematic representation of a single-tube PDE. . . . . . . . . . . . . . . . . 332 Control volume used for analysis of single-tube PDE. . . . . . . . . . . . . . 343 PDE cycle schematic for a single detonation tube. . . . . . . . . . . . . . . . 354 Control volume VP used for analysis of flow in the plenum. . . . . . . . . . . 365 Assumed time dependence of pressure and flow velocity at the valve plane
during a cycle. . . . . . . . . . . . . . . . . . . . . . . . . . . . . . . . . . . . 376 Flow configuration used to model the filling process in the case of sonic flow
at the valve plane; (*) marks the valve plane. . . . . . . . . . . . . . . . . . 387 Comparison of model predictions and numerical simulations for the velocity
at the valve plane, the average filling velocity, and the pressure at the valveplane; Tf/T0=7.69 and γ=1.4. . . . . . . . . . . . . . . . . . . . . . . . . . . 39
8 Non-dimensional detonation tube impulse as a function of the filling Machnumber. Comparison of model predictions based on Eq. 22 and results ofnumerical simulations with Amrita;43 q/RTi=40 and γ=1.2. . . . . . . . . . 40
9 The velocity and pressure at selected points for a PDE operating with stoi-chiometric hydrogen-air at an altitude of 10 km. . . . . . . . . . . . . . . . . 41
10 Specific impulse of a single-tube PDE operating with stoichiometric hydrogen-air as a function of flight Mach number at sea level and at an altitude of 10km. . . . . . . . . . . . . . . . . . . . . . . . . . . . . . . . . . . . . . . . . 42
11 Specific impulse of a single-tube air-breathing PDE compared to an idealramjet operating with stoichiometric hydrogen-air and JP10-air at an altitudeof 10 km. . . . . . . . . . . . . . . . . . . . . . . . . . . . . . . . . . . . . . 43
32 of 43

inlet diffuser plenum detonation tube
isolator valve
shock wave
M0
> 1
Figure 1: Schematic representation of a single-tube PDE.
33 of 43
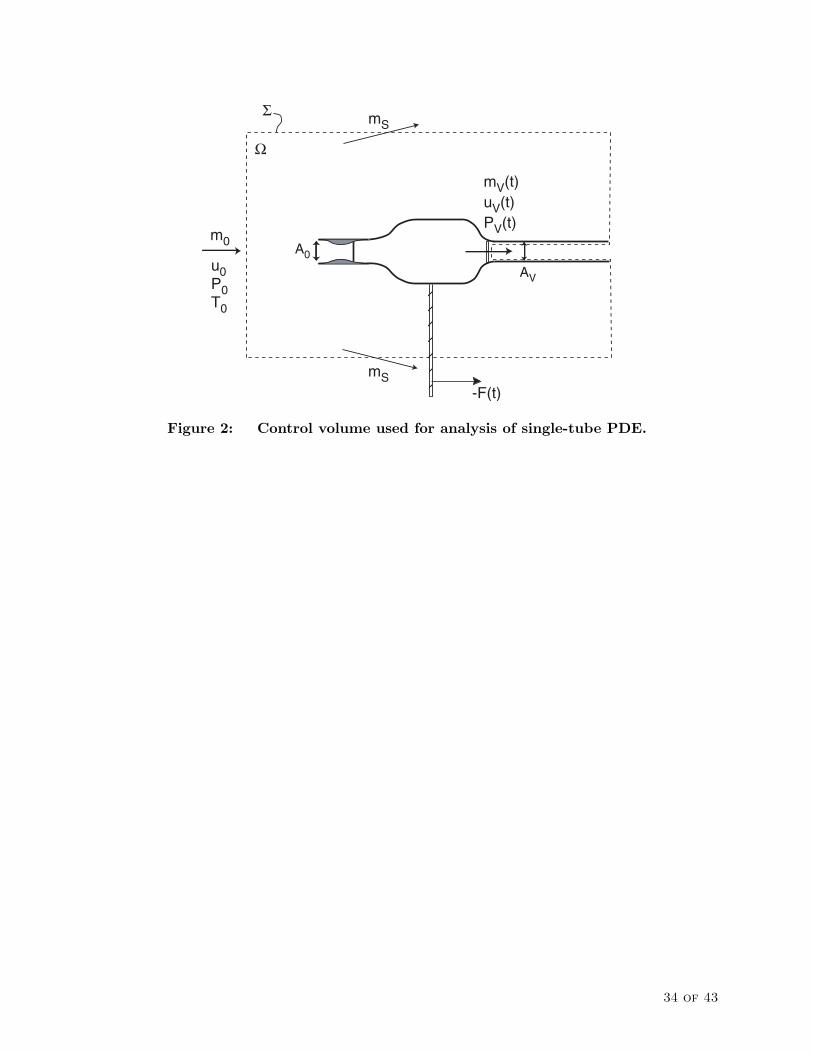
-F(t)
u0P0T0
m0A0
mV(t)uV(t)PV(t)
Ω
Σ
AV
mS
mS
Figure 2: Control volume used for analysis of single-tube PDE.
34 of 43

reactants
detonation front open end
a)
UCJproducts
detonation frontTaylor wave
b)
decaying shockc)
first reflected characteristic
non-simple regionproducts-air interface
d)
burned products
products
e)
air
shock waveair/products interface
open valve
closed valve
products
f)
air
shock waveproducts/air interface
air/products interface
reactants
reactants/air interface
g)
air
air/products interface
reactants
reactants/air interface
reactants
h)closed valve
reactants/air interface
Figure 3: PDE cycle schematic for a single detonation tube.
35 of 43

m0mV(t)
A2AVVP
M0 > 1
Figure 4: Control volume VP used for analysis of flow in the plenum.
36 of 43

mV
PV
t
t
tclose topen
Figure 5: Assumed time dependence of pressure and flow velocity at the valve planeduring a cycle.
37 of 43

fsi
steadyexpansion
contactsurface
shockwave
unsteadyexpansion
( )
P
Figure 6: Flow configuration used to model the filling process in the case of sonicflow at the valve plane; (*) marks the valve plane.
38 of 43
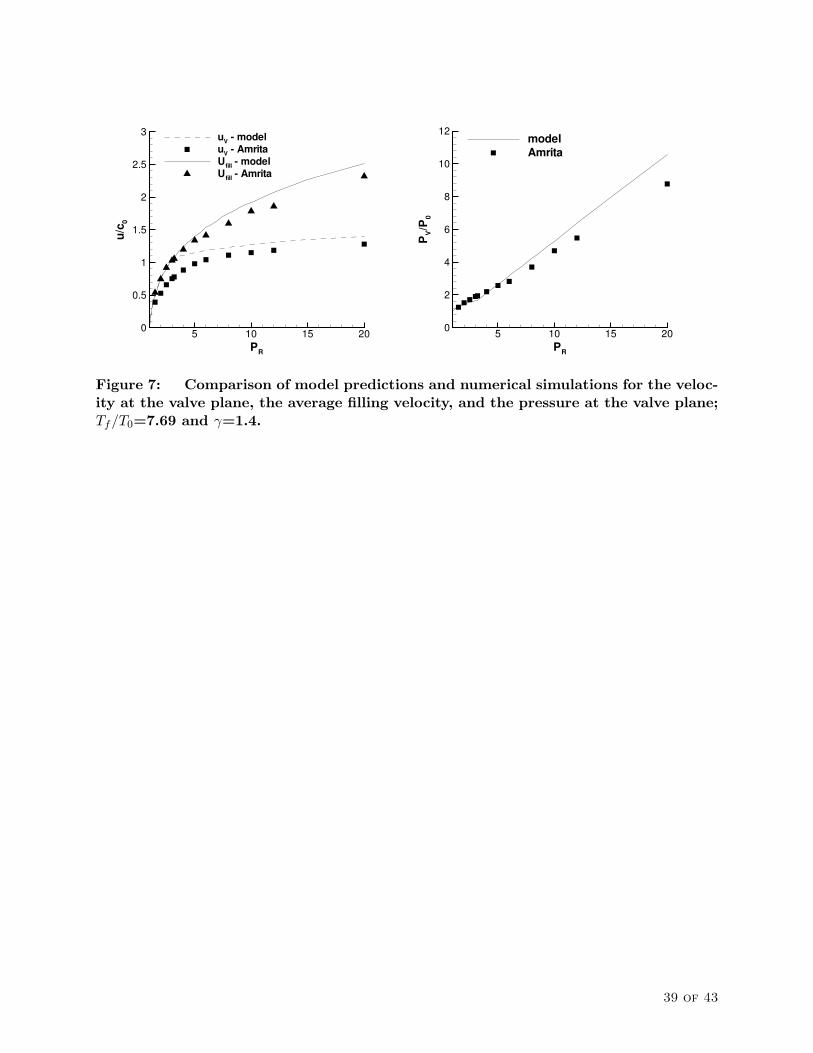
PR
u/c 0
5 10 15 200
0.5
1
1.5
2
2.5
3 uV - modeluV - AmritaUfill - modelUfill - Amrita
PR
PV/P
0
5 10 15 200
2
4
6
8
10
12modelAmrita
Figure 7: Comparison of model predictions and numerical simulations for the veloc-ity at the valve plane, the average filling velocity, and the pressure at the valve plane;Tf/T0=7.69 and γ=1.4.
39 of 43

Mfill
∫(P3-
P0)
dtc i/V
Pi
0 1 2 30
1
2
3
4
5model, Eq. 5.60Amrita
Figure 8: Non-dimensional detonation tube impulse as a function of the filling Machnumber. Comparison of model predictions based on Eq. 22 and results of numericalsimulations with Amrita;43 q/RTi=40 and γ=1.2.
40 of 43

M0
velo
city
(m/s
)
1 2 3 4 50
500
1000
1500 UfilluV
M0
Pre
ssur
era
tio
1 2 3 4 50
0.1
0.2
0.3
0.4
0.5
0.6
0.7
0.8
0.9
1 Pt2/Pt0PC/Pt0PV/Pt0Pi/Pt0
Figure 9: The velocity and pressure at selected points for a PDE operating withstoichiometric hydrogen-air at an altitude of 10 km.
41 of 43

M0
I SP
F(s
)
0 1 2 3 4 50
1000
2000
3000
4000
5000 Z=10,000 msea levelWu et al. 9,300 mSchauer et al.impulse model 10,000 mimpulse model sea level
Figure 10: Specific impulse of a single-tube PDE operating with stoichiometrichydrogen-air as a function of flight Mach number at sea level and at an altitude of 10km.
42 of 43

M0
Spe
cific
impu
lse
(s)
0 1 2 3 4 50
1000
2000
3000
4000
5000
PDE - H2ramjet - H2PDE - JP10ramjet - JP10Wu et al. - H2Schauer et al. - H2impulse model - H2CIT- JP10impulse model - JP10
Figure 11: Specific impulse of a single-tube air-breathing PDE compared to an idealramjet operating with stoichiometric hydrogen-air and JP10-air at an altitude of 10km.
43 of 43