A MEDIA AND ENTERTAINMENT COLOSSUS -THE ACQUISITION …
98
FUNDAÇÃO GETULIO VARGAS ESCOLA BRASILEIRA DE ADMINISTRAÇÃO PÚBLICA E DE EMPRESAS MESTRADO EXECUTIVO EM GESTÃO EMPRESARIAL A MEDIA AND ENTERTAINMENT COLOSSUS -THE ACQUISITION OF 21 ST CENTURY FOX BY THE WALT DISNEY COMPANY DISSERTAÇÃO APRESENTADA À ESCOLA BRASILEIRA DE ADMINISTRAÇÃO PÚBLICA E DE EMPRESAS PARA OBTENÇÃO DO GRAU DE MESTRE MARIUS PETER KRAFCZYK Rio de Janeiro - 2019
Transcript of A MEDIA AND ENTERTAINMENT COLOSSUS -THE ACQUISITION …
FUNDAÇÃO GETULIO VARGAS
ESCOLA BRASILEIRA DE ADMINISTRAÇÃO PÚBLICA E DE EMPRESAS
MESTRADO EXECUTIVO EM GESTÃO EMPRESARIAL
A MEDIA AND ENTERTAINMENT COLOSSUS
-THE ACQUISITION OF 21ST CENTURY FOX BY THE WALT DISNEY
COMPANY
DISSERTAÇÃO APRESENTADA À ESCOLA BRASILEIRA DE ADMINISTRAÇÃO PÚBLICA E DE
EMPRESAS PARA OBTENÇÃO DO GRAU DE MESTRE
MARIUS PETER KRAFCZYK
Rio de Janeiro - 2019

II
MARIUS PETER KRAFCZYK
DR. PATRICK GOTTFRIED BEHR
Rio de Janeiro
2019
Master’s thesis presented to Católica-Lisbon-FGV
EBAPE Double Degree Program, Escola Brasileira de
Administração Pública e de Empresea, Fundação Getulio
Vargas, as a requirement for obtaining the title of
Executive Master’s in Business Adminstration
A MEDIA AND ENTERTAINMENT COLOSSUS
-THE ACQUISITION OF 21ST CENTURY FOX BY THE
WALT DISNEY COMPANY


Dados Internacionais de Catalogação na Publicação (CIP) Ficha catalográfica elaborada pelo Sistema de Bibliotecas/FGV
Krafczyk, Marius Peter
A media and entertainment colossus : the acquisition of 21st Century Fox by
by The Walt Disney Company / Marius Peter Krafczyk. – 2019.
96 f.
Dissertação (mestrado) - Escola Brasileira de Administração Pública e de Empresas, Centro de Formação Acadêmica e Pesquisa. Orientador: Patrick Gottfried Behr. Inclui bibliografia. 1. Empresas – Fusão e incorporação – Estudo de casos. 2. Tecnologia Streaming (Telecomunicação). 3. Comportamento do consumidor. 4. Wall Disney Company. I. Behr, Patrick Gottfried. II. Escola Brasileira de Adminis- tração Pública e de Empresas. Centro de Formação Acadêmica e Pesquisa. III. Título. CDD – 658.16
Elaborada por Márcia Nunes Bacha – CRB-7/4403

III
Acknowledgement
I dedicate this work to my dear friend Tony for giving me strengths in all the stressful times and
reminding me that life is only a breath away.
Additional, to my former best friend JBT who taught me that self-reflection is a mental ability
towards reincarnation.

IV
Abstract
Purpose – The purpose of this thesis is to investigate the acquisition of 21st Century Fox by The
Walt Disney Company. The focus lies on the rationale behind Disney’s motivation to acquire its
competitor. In order to answer the question, the thesis aims to answer three preliminary questions:
(1) What are the strategic drivers behind the acquisition? (2) What are the financial drivers behind
the acquisition? (3) What are the impacts on the media & entertainment industry by the transaction?
Design/methodology – The design of the dissertation is a case study, as the paper aims to determine
the exploration and description of an event. The primary source of information is secondary and it
consists of qualitative and quantitative research. For the qualitative research an expert interview
was conducted and a content analysis of data, gathered from secondary research. For the
quantitative analysis, annual reports and database were examined in order to conduct a financial
valuation using the discounted cash flow method and the relative valuation method.
Findings – It was found that the rising strength of over-the-top content service providers like
Netflix are threatening the traditional business of media companies like Disney. Disney tries to
mitigate the threat of transforming streamers by entering the direct-to-consumer market with its
own service, Disney+. It then wants to leverage Fox’s brands to build brand affinity and cross-
monetize them. In addition, Disney’s market power in the traditional business enhances, due to the
consolidated market share and Disney was valuing Fox higher than the market. Therefore, the
transaction supports Disney’s entry into a new market and strengthens the current market position.
Practical implications – The dissertation closes a knowledge gap, since no study was released
regarding the selected topic. It now serves as a teaching material for lectures that cover mergers
and acquisitions, as well as identifies the lack of intellectual property valuation in financial
analyses. Lastly, it serves as an information paper for investors who consider to invest in Disney
shares.
Keywords: over-the-top, direct-to-consumer, monetization, market power, company valuation
Paper Category: Case study, Master’s thesis
V
Resumo
Objetivo - O objetivo desta tese é investigar a aquisição da 21st Century Fox pela The Walt Disney
Company. O foco está na lógica por trás da motivação da Disney para adquirir seu concorrente.
Para responder à pergunta, a tese visa responder a três questões preliminares: (1) Quais são os
fatores estratégicos por trás da aquisição? (2) Quais são os fatores financeiros por trás da aquisição?
(3) Quais são os impactos no setor de mídia e entretenimento pela transação?
Metodologia - O design da dissertação é um estudo de caso, pois o trabalho visa determinar a
exploração e descrição de um evento. A fonte primária de informação é secundária e consiste em
pesquisa qualitativa e quantitativa. Para a pesquisa qualitativa, foi realizada uma entrevista com
especialistas e uma análise de conteúdo dos dados, coletada em pesquisas secundárias. Para a
análise quantitativa, foram examinados relatórios anuais e banco de dados, a fim de realizar uma
avaliação financeira utilizando o método de fluxo de caixa descontado e o método de avaliação
relativa.
Resultados - Verificou-se que a crescente força de provedores de serviços de conteúdo exagerados,
como a Netflix, está ameaçando os negócios tradicionais de empresas de mídia como a Disney. A
Disney tenta mitigar a ameaça de transformar serpentinas entrando no mercado direto ao
consumidor com seu próprio serviço, Disney +. Em seguida, deseja aproveitar as marcas da Fox
para criar afinidade com a marca e gerar receita monetária cruzada. Além disso, o poder de mercado
da Disney nos negócios tradicionais aumenta, devido à participação consolidada no mercado e a
Disney estava avaliando a Fox mais alto que o mercado. Portanto, a transação suporta a entrada da
Disney em um novo mercado e fortalece a posição atual do mercado.
Contribuições práticas - A dissertação preenche uma lacuna de conhecimento, uma vez que não
foram divulgados estudos sobre o tema selecionado. Agora, serve como material de ensino para
palestras que cobrem fusões e aquisições, além de identificar a falta de avaliação da propriedade
intelectual nas análises financeiras. Por fim, serve como um documento informativo para
investidores que consideram investir em ações da Disney.
Palavras-chave: exagerada, direta ao consumidor, monetização, poder de mercado, avaliação de
empresas
Categoria do artigo: Estudo de caso, Dissertação de Mestrado
VI
List of Abbreviations
Disney The Walt Disney Company
21CF 21st Century Fox
FOX 21st Century Fox
AVOD Ad-based Video on Demand
AI Artificial Intelligence
AR Artificial Intelligence
CAPEX Capital Expenditures
CAPM Capital Asset Pricing Model
CEO Chief Executive Officer
COS Cost of Services
DCF Discounted Cash Flows
DTC Direct to consumer
EBIT Earnings before Interest and taxes
EBITDA Earnings before interest, tax, depreciation and amortization
EV Enterprise Value
FCF Free Cash Flow
FCFF Free Cash Flow to the Firm
GDP Gross Domestic Product
IP Intellectual Property
M&A Mergers and Acquisition
M&E Media and Entertainment
OTT Over the top
P/B Price-to-Book
P/E Price-to-Earnings
P/S Price-to-Sales
PP&E Property, Plant and Equipment

VII
SVOD Subscription Video on Demand
TV Terminal Value
TVOD Transactional Video on Demand
VOD Video on Demand
VR Virtual Reality
WACC Weighted Average Cost of Capital

VIII
Table of Content
1 Introduction ............................................................................................................................................ 1
1.1 Contextualization ........................................................................................................................... 1
1.2 Justification of the Theme Selection .............................................................................................. 3
1.3 Structure of the paper .................................................................................................................... 3
2 Problem to be discussed ......................................................................................................................... 4
2.1 Research Questions ........................................................................................................................ 4
2.2 Definition of the Problem’s Limits.................................................................................................. 4
3 Literature Review ................................................................................................................................... 5
3.1 Mergers and Acquisition ................................................................................................................ 5
3.1.1 Types of M&A ......................................................................................................................... 5
3.1.2 The Reasons for M&A: Synergies ........................................................................................... 6
3.2 Valuation Techniques ..................................................................................................................... 8
3.2.1 Discounted Cash Flow (DCF) Valuation .................................................................................. 9
3.2.1.1 Weighted Average Cost of Capital ...................................................................................10
3.2.1.2 Cost of Equity ...................................................................................................................10
3.2.1.3 Beta ..................................................................................................................................11
3.2.1.4 Cost of Debt ......................................................................................................................11
3.2.1.5 Terminal Value and Growth Rate .....................................................................................12
3.2.2 Relative Valuation ................................................................................................................12
4 Research Method ..................................................................................................................................13
4.1 Data Collection .............................................................................................................................13
4.2 Data Treatment ............................................................................................................................14
4.3 Method Limitation .......................................................................................................................15
5 Strategic Analysis .................................................................................................................................16
5.1 Analysis of the Media and Entertainment Industry .....................................................................16
5.1.1 Overview ..............................................................................................................................18
5.1.2 Current Performance ...........................................................................................................20
5.1.3 Future trends ........................................................................................................................21
5.1.4 Film Segment ........................................................................................................................22
5.1.5 TV Segment ..........................................................................................................................25
5.1.6 Over-The-Top Platform ........................................................................................................26

IX
5.1.7 Direct-to-Consumer ..............................................................................................................31
5.2 Company Profiles .........................................................................................................................32
5.2.1 21st Century Fox ...................................................................................................................32
5.2.2 The Walt Disney Company ...................................................................................................34
5.2.2.1 Disney+ .............................................................................................................................36
5.2.2.2 Disney’s Vertical Monetization Model .............................................................................37
5.3 Strategic Drivers ...........................................................................................................................38
6 Financial Analysis ................................................................................................................................40
6.1 Key Financial Analysis ...................................................................................................................40
6.1.1 Disney ...................................................................................................................................40
6.1.2 21st Century Fox ....................................................................................................................42
6.2 Valuation of 21st Century Fox .......................................................................................................44
6.2.1 DCF Valuation .......................................................................................................................44
6.2.2 Relative Valuation ................................................................................................................50
6.2.3 Summary of Valuation ..........................................................................................................52
7 Impact on the Media and Entertainment Industry ................................................................................53
7.1 Market Structure ..........................................................................................................................53
7.2 Work Force ...................................................................................................................................54
7.3 Distributors ...................................................................................................................................54
7.4 Content variety .............................................................................................................................55
7.5 OTT Market Fragmentation ..........................................................................................................56
7.6 Competition ..................................................................................................................................57
8 Conclusion ............................................................................................................................................59
8.1 Summary of results ......................................................................................................................59
8.2 Limitations ....................................................................................................................................61
8.3 Recommendation for Further Research .......................................................................................62
Appendix ......................................................................................................................................................64
Bibliography .................................................................................................................................................77

X
List of Tables
Table 1 Overview of the Valuation Methods .................................................................................. 9
Table 2 Historical Revenue of Fox (2014-2018) ........................................................................... 44
Table 3 Projected Revenue of Fox (2019-2023) ........................................................................... 46
Table 4 Projected Operating Expense (2019-2023) ...................................................................... 46
Table 5 Projected D&A and Capex of Fox (2019-2023)............................................................... 47
Table 6 Projected FCFF & Terminal Value of Fox (2019-2023) .................................................. 48
Table 7 Fox's Beta Calculation ...................................................................................................... 49
Table 8 Fox's WACC and Capital Structure .................................................................................. 49
Table 10 Fox's Discounted FCFF and Enterprise Value ............................................................... 50
Table 11 Sensitivity Analysis ........................................................................................................ 50
Table 12 Multiple Valuation of Fox .............................................................................................. 51
Table 13 Summary of Fox Valuation ............................................................................................ 52
List of Figures
Figure 1 Real GDP growth - Annual percent change .................................................................... 17
Figure 2 Consumer Confidence Index ........................................................................................... 18
Figure 3 Main competitors ranked by revenues in 2018 ............................................................... 21
Figure 4 Average cinema ticket price and numbers of tickets sold (1995-2018) .......................... 23
Figure 5 Total Box office & total inflation-adjusted box office (1995-2018)............................... 23
Figure 6 US film market share by Top 6 parenting company ....................................................... 24
Figure 7 Comparison of market share by OTT type in 2017 vs. 2023 (forecasted) ...................... 27
Figure 8 Global OTT revenue ....................................................................................................... 28
Figure 9 Number of global subscribers by major US SVOD platforms ........................................ 29
Figure 10 Content spending by major US SVOD platforms ......................................................... 30
Figure 12 Disney's Net Revenues by Segment (in billion) ............................................................ 42
Figure 13 Fox's Net Revenues by Segment (in billion) ................................................................. 43
1
1 Introduction
1.1 Contextualization
Digitization. A strong and broad word that is having a large influence on life and businesses.
Disruptive technologies have transformed entire industries in the past decade. Physical retail stores
became nearly obsolete once Amazon made its move into the industry, Airbnb is surely the most
envied company by Hotels and the videos of Uber drivers being attacked by taxi drivers went viral.
These disruptors have established their leading role through customer interaction, profiling the
consumers and offering the best user experience. The common factor that all of these companies
inhabit, is their business model. They all are platforms that allow high customer interaction. Once
companies established a large customer base and great brand awareness, they move into new
markets. Amazon moved into the cloud computing service and Uber into food delivery. However,
since some industries have high entry barriers, companies use a different tool – mergers and
acquisitions (M&A). However, entering an industry is not the only rationale for such transactions.
Corporations of diverse sizes and industries are also constantly attempting to maintain their
position in the industry. They intend to achieve an economic benefit through these deals. Meaning,
the goal of an M&A is to generate increased shareholder value by combining the two companies
into one larger firm. For the management, it is crucial to decide the amount they are willing to pay
for the acquired firm and when to announce it. Failing to identify the adequate price can cause a
loss of the deal or potential financial distress.
The same phenomena is occurring in the media and entertainment (M&E) industry. Currently, the
industry is experiencing a new convergence, which is the main driver for the large numbers of
global M&As (Baker & Barbaglia, 2018). The sector is riding on a wave of consolidation triggered
by disrupting technologies. In the past two years, three mega-mergers were announced and
completed, which will shake the foundations of the industry. The mighty telephone giant AT&T
won the fight with the U.S. government court regarding the acquisition of Time Warner’s content
bundle, consisting of HBO, Warner Bros, and Turner Broadcasting. The bidding war for 21st
Century Fox between the Walt Disney Company and Comcast ended in a $71.3 billion Disney-Fox
transaction and a $39 billion takeover of Sky by Comcast. However, these transactions were not
the only ones and are likely not to be the last. Nonetheless, what caused all the tumult and the urge

2
to react now? As similar to other industries, the M&E industry is threatened by the four horsemen
of the digital apocalypse: Apple, Google, Amazon, and Netflix. Especially the last two global
platforms became legitimate competitors that are now applying pressure on the traditional media
companies, driving the need for scale and differentiation. However, to understand the rationale
behind consolidation, one of the largest transactions in the past years will be analyzed. While the
AT&T-Time Warner was a vertical transaction, the horizontal Disney-Fox deal will provide better
details for the rationale and the impact on the industry.
On December 14, 2017, The Walt Disney Company announced to acquire 21st Century Fox for
$52.4 billion in stock (The Walt Disney Company, 2017b). It stated that it would buy 21st Century
Fox film and TV studios, cable networks including Fox Networks, Fox Sports Regional Networks,
and Fox’s international networks. Further, it would acquire Indian satellite TV group Star India, an
additional 30% stake in Hulu and other assets. However, 21st Century Fox would spin off Fox
Broadcasting network into the “Fox Corporation” company (The Walt Disney Company, 2017b).
The reason behind the spinoff is that Disney owns the American Broadcasting Company (ABC)
and the merger with the Fox Broadcasting Company would be illegal under the FCC’s rule, which
prohibits a merger of two major broadcast networks (Johnson, 2017). Fox Corporation will also
comprise of the following business units: Fox Television Stations, Fox News Channel, Fox
Business Network and Fox Sports Media Group (The Walt Disney Company, 2017b). On June 12,
2018, Comcast offered a counter-bid of $65 billion for 21st Century Fox assets (Welch, 2018).
However, eight days later Disney and Fox announced that they had improved their previous deal,
increasing Disney’s offer to $71.3 billion. It outbids the offer of Comcast with a 10% premium and
offers shareholders the option to receive cash instead of stock (The Walt Disney Company, 2018b).
At the end of June 2018, the US Department of Justice gave antitrust approval to the merger
agreement (Bartz & Shepardson, 2018). On July 19, 2018, Comcast announced that it would not
pursue further to acquire Fox assets but to focus on bidding for Sky (Comcast, 2018a). Shortly
after, the shareholders of both Disney and Fox approved the acquisition (The Walt Disney
Company, 2018c). The deal still needed to go through many commissions and regulators, while on
October 9, 2018, Comcast completed the acquisition of Sky for $39 billion (Comcast, 2018b). The
acquisition was finalized on March 20, 2019, in which 51.57% of the shareholders elected to
receive cash, 36.65% chose Disney shares and 11.79% failed to make an election (The Walt Disney
Company, 2019a).

3
1.2 Justification of the Theme Selection
The dissertation, with the chosen topic of the acquisition of 21st Century Fox by the Walt Disney
Company, is of relevance in three aspects, which can be grouped in two dimensions: academic and
practical relevance.
First, and most important, is the academic relevance, since the dissertation will create academic
value by generating new knowledge that will be available to the public. Currently, there are no
studies available regarding this topic since the deal only was completed in March 2019. Therefore,
a knowledge gap is existing that would be closed by the dissertation. The second aspect enacts as
a hybrid of the two dimensions. The dissertation could be used as teaching material for lectures at
universities that cover Mergers and Acquisitions. Hereby, it acts as a teaching note for the
professor. Therefore, the dissertation teaches students new academic knowledge by simultaneously
allowing them to put the knowledge in practice. Lastly, the dissertation will be from personal
relevance. I am highly interested in the topic M&A, as I am seeking a career inside this corporate
development/ management area. Thus, the topic will allow me to deepen my knowledge and to
gather first practical experiences that will be of high value for my future career.
1.3 Structure of the paper
Following this chapter, the main research question is stated with its three underlying sub-questions.
The sub-questions will act as guidance towards the main question. Once the main research question
is established, a theoretical framework is created to provide basic knowledge regarding the selected
theme. This is crucial since basic knowledge of the area is required in order to follow the logic of
the analysis and its reasoning. However, before the analysis is conducted, the research method is
presented. It shows on which scientific methodology the analysis is based. Further, the analysis
follows, which is divided into three sections. First, the two companies and the industry they inhabit
are analyzed. Based on this, strategic reasoning will be drawn. Second, the financial analysis of the
acquired firm is done in order to understand the rationale from a financial point of view. Lastly,
the impact of the transaction in the industry is mentioned. Consequently, these three sections will
provide the basis for concluding the research question before a few recommendations for further
research are given.

4
2 Problem to be discussed
2.1 Research Questions
The objective of this dissertation is to understand the decision of the Walt Disney Company to
acquire 21st Century Fox. The main research question is the following:
Why is the Walt Disney Company acquiring its competitor 21st Century Fox?
Therefore, the dissertation answers three preliminary questions that provide support to answer the
main research question:
What are the strategic drivers behind the acquisition?
What are the financial drivers behind the acquisition?
What are the impacts on the media & entertainment industry by the transaction?
First, the media and entertainment industry is analyzed to understand the current consumer trends
and possible disruptors that need to be anticipated by the companies to ensure their
competitiveness. Further, an overview of the two companies is provided including an analysis of
the key financial indicators. Moreover, The Walt Disney Company’s strategic aim to execute is
identified. Second, a valuation of 21st Century Fox is conducted by using the multiple and
discounted cash flow valuation technique. Third, the dissertation will identify and present the
effects the M&A deal might have on the industry.
2.2 Definition of the Problem’s Limits
The first limit of the problem is the scope of the research. Since the paper wants to identify the
reasons behind the M&A deal, it will only focus on the strategic and financial part of the rationale.
However, in such a transaction there are much more factors taking part which are not even known
to the public. Second, the third sub question will be answered by assumption, since no one knows
how this transaction will change the industry. It is possible that the assumptions made are not
becoming true or do not apply to this industry. However, since no one knows how the impact will

5
be, assumptions are allowed to make and are necessary to be made in order to anticipate possible
issues or opportunities. The US Department of Justice also had to make assumptions, in order to
give antitrust approval.
3 Literature Review
3.1 Mergers and Acquisition
There are only a few decisions for managers that carry as much risk to the shareholder as a large
acquisition. According to Sirower and Sahni (2006), M&A announcements have generally a
negative impact on the stock value of a company as the investors are skeptical that the transaction
will generate value for the acquiring company. More specifically, investors doubt that the synergies
implied in the premium paid will be achieved and that the value of each company will be sustained
or enlarged in the consolidated company. Furthermore, failed mergers are costly and difficult to
undo, meaning once the damage is done, the merger is irreversible.
Therefore, this chapter is explaining the rationale behind M&A, if and how these transactions can
increase the value for shareholders. Following, the transaction types involved in M&A deals are
explored.
3.1.1 Types of M&A
Ross et. al (2003) indicate two different classifications to identify types of M&A – legal procedures
and the typical financial analysts’ classification.
The legal procedures category is sub-divided into three different transactions:
Merger and Consolidation – In a merger, the buying company takes over the target
company, including all the assets and liabilities. In a consolidation, a new legal entity is
formed, combining both companies into one. Both transactions require the approval by the
shareholders of both companies involved, most commonly by the majority (2/3) of the
voting shares.

6
Acquisition of Stock – The buying company makes an offer for the acquiree’s stocks.
Commonly, this deal is conducted through a tender offer, in which the acquirer makes a
public offer to the shareholders of the target firm. The shareholders then have the right to
decide whether to sell the shares or not, making it difficult for the acquirer to buy the entire
company.
Acquisition of Assets – The company buys all the assets from the target company which
was involved in the offer. This deal needs the approval of the shareholders and the transfer
of ownership can be costly.
Damodaran (2002) adds a further classification to the above mentioned legal procedures type. The
classification refers to a deal when a company is not bought by another one, but rather, by its own
management team (Management Buyout) or by investors, on the basis of a high level of debt
(Leverage Buyout)
The typical financial analysts’ classification explains that the deals are sub-divided in the following
characteristics:
Horizontal Acquisition – Refers to a transaction in which both the acquirer and acquire are
settled in the same industry, competing with similar products.
Vertical Acquisition – The firms included in the deal are from a different stage in the value
chain. For example, a firm buys its supplier or distributor.
Conglomerate Acquisition – The companies included in the deal are not competing in the
same industry. Mostly used to diversify the risk.
3.1.2 The Reasons for M&A: Synergies
Synergies are seen as one of the main driving forces for M&A deals. It is the concept in which the
value of the two merged companies will be larger than the sum of the two individual companies
(Investopedia, 2018a). In fact, according to a survey, the most responsive strategic reason for an
M&A transaction was to increase the scale and market share (84%) of the company (EY, 2014).

7
Damodaran (2005) suggests that synergies can be grouped into two groups. Operating synergies
affect the corporate operation of the consolidated company and include operational benefits such
as economies of scale, improved pricing power, and higher growth potential. Contrariwise,
financial synergies are more specific. They include tax benefits, diversification and use for excess
cash.
Operating synergies
The aim of those synergies is to generate a higher operating income from existing assets or
increased growth. There are four synergies types:
Economies of scale – This refers to a cost advantage the combined firm obtains due to the
increased scale of the firm. This mostly occurs in horizontal mergers
Greater pricing power – Results from the diminished competition and increased market
share, which generally leads to an increased margin and operating income
Combination of different functional strengths – Represents the vertical acquisition in which
a firm acquires a firm that is specialized in a different stage of the value chain. This type of
synergy can be applied to multiple mergers, as the functional strength can be translated
across industries
Higher growth in new or existing markets – Mostly used to enter a new market by using the
established company as a stepping stone to increase sales of its own product
Financial Synergy
The result of those synergies is to increase the cash flows, reduce the discount rate (cost of capital)
or both in combination. The following are included in the financial synergies:
Win-Win combination – The combination of a firm that has cash available but no
investment opportunities and a firm with limited cash but high-return projects can generate
higher value. The value can be generated by using the stored cash to invest in projects. This
synergy is mostly seen if a large company acquires a small company (start-up).
Increased debt capacity – The consolidated firm may become more stable and therefore
cash flows could be more predictable. Resulting in banks that are more willing to fund the

8
company a larger credit than the two individual companies would have received. Money is
saved on taxes due to the lower cost of capital.
Tax benefits – Companies acquire other firms to take advantage of the tax laws that provide
them with money saving opportunities. A company can shelter its income by acquiring a
loss-making company to use its net operating losses to reduce the tax burden. On the other
hand, a company can increase its depreciation charges by writing up the target company’s
assets. Consequently, the company will save money on taxes and increase its value.
Diversification – It relates to the spread of the risk by operating in multiple segments. These
segments are mostly not related, meaning that different factors influence them
After understanding the types of synergies, it is crucial for the management to avoid common errors
in valuing synergies, i.e. using a wrong discount rate. The company needs to determine the value
of the target company and potential synergy and to decide how much they are willing to pay for it.
After the company understands which forms of synergies are expected, it needs to identify when
the synergies have a positive effect on cash flows (Damodaran, 2005). According to Ficery et. al
(2007), the most common error is that the synergy scope is wrongly understood and that the timing
for synergy opportunities are missed. Since synergies generate the most value during the first year
of the combined firm, companies need to pay special attention to capture the value during the first
year. Going back to understand the value of synergy, Damodaran (2005) suggests three steps to
estimate the value: conduct a standalone valuation of both companies, estimate the combined value
without synergy, and calculate the value of the combined firm with synergy. Lastly, the estimate
of the consolidated firm without synergies needs to be deducted from the estimate of the combined
firm with synergies, to understand if the merger is profitable. Nonetheless, estimating the synergies
is out of scope for this study, as it would require information unknown to the public.
3.2 Valuation Techniques
Several valuation techniques can be used to estimate the value of a company. Each approach has
different purposes and difficulties. According to Damodaran (2002), valuation is relevant in three
cases. First, valuation is a tool for investors that want to create an investment portfolio. Through

9
valuing companies, they are able to identify investment opportunities. Second, valuation can be
used from a business point of view in corporate finance. Since the goal of a firm is to maximize its
value, valuation can help to identify the right investments and on how to finance them. Third, it is
used in analyzing acquisition opportunities. Thus, valuing a company is crucial in an M&A
transaction, but there are different approaches.
Table 1 Overview of the Valuation Methods
Equity Values
Enterprise Values
(Equity and Debt)
Cash Flow
Approaches Dividend Discount Model Discounted Cash Flow
Return Based
Approaches Dynamic ROW Economic Value Added
Multiples
Dividend Yield
Price to Earnings ratio
Price to Book Value
Free Cash Flow Yield
Enterprise Value to EBIT
Enterprise Value to EBITDA
Enterprise Value to Capital
Source: Young, et al., 1999
Per Young, et al. (1999), the valuation can be divided into two sections, one focusing on equity
value and the other on enterprise value. In addition, it exists three approaches that focus either on
the value of the assets (cash flow), the capital stock (return based) or on a comparison with
competitors (multiples). However, Kaplan and Ruback (1996) found that the best results, regarding
valuing a company, were achieved by using the DCF based valuation and the multiple methods
together. Thus, these are the chosen techniques to value 21st Century Fox.
3.2.1 Discounted Cash Flow (DCF) Valuation
The DCF valuation can be split into two parts. The valuation starts with projecting the future cash
flow of a firm, based on assumptions that are related to a substantial industry analysis. Then the
projected cash flows are discounted at a risk-adjusted rate to compute the present value.
𝐸𝑛𝑡𝑒𝑟𝑝𝑟𝑖𝑠𝑒 𝑉𝑎𝑙𝑢𝑒 = ∑𝐹𝐶𝐹𝐹𝑡
(1 + 𝑊𝐴𝐶𝐶)+
𝑇𝑒𝑟𝑚𝑖𝑛𝑎𝑙 𝑉𝑎𝑙𝑢𝑒
(1 + 𝑊𝐴𝐶𝐶)𝑛
𝑛
𝑡=1
The Free Cash Flow to the Firm (FCFF) includes the funds that were generated by the company
after paying expenses, taxes and reinvestment needs, but post interest expenses and dividends. The

10
remaining funds will then be allocated to equity and debt-holders. According to Luehrman (1997),
FCFF is given by:
𝐹𝐶𝐹𝐹 = 𝐸𝐵𝐼𝑇 ∗ (1 − 𝑇𝑎𝑥) − 𝐶𝑎𝑝𝐸𝑥 − 𝐶ℎ𝑎𝑛𝑔𝑒𝑠 𝑖𝑛 𝑁𝑒𝑡 𝑊𝑜𝑟𝑘𝑖𝑛𝑔 𝐶𝑎𝑝𝑖𝑡𝑎𝑙
+ 𝐷𝑒𝑝𝑟𝑒𝑐𝑖𝑎𝑡𝑖𝑜𝑛 𝑎𝑛𝑑 𝐴𝑚𝑜𝑟𝑡𝑖𝑧𝑎𝑡𝑖𝑜𝑛
3.2.1.1 Weighted Average Cost of Capital
The WACC includes all the financial effects, explicitly any benefits or costs connected with the
firm’s leverage in terms of capital structure. Using WACC as a discount rate allows accounting for
the overheads of different financing sources, which are proportionally weighted to the contribution
to the company’s capital structure. Thus, the WACC represents the average rate of return required
by equity holders (𝑅𝐸) and debtholders (𝑅𝐷) (Koller et al., 2010).
𝑊𝐴𝐶𝐶 =𝐷
𝑉𝑅𝐷(1 − 𝑇𝐶) +
𝐸
𝑉𝑅𝐸
D = market value of debt
E = market value of equity
V = E+D
𝑅𝐷 = required rate of return on debt
𝑅𝐸 = required rate of return on equity
𝑇𝐶 = corporate tax rate
The WACC equation comprises of three parts: the cost of equity, the cost of debt and the capital
structure. The most popular method to calculate the cost of equity is the capital asset pricing model
(CAPM), which requires data on the company’s beta, the risk-free rate, and the market risk
premium. The cost of debt requires knowledge about the marginal tax rate and the default spread
of the company. Lastly, the capital structure is the proportion of finances to debt and equity.
3.2.1.2 Cost of Equity
Equity shareholders invest in a company with the expectation to receive a certain return on their
financial contributions. The cost of equity represents this required rate of return so that the investor
is willing to purchase the shares of the company. Per Koller et al. (2010), the previously introduced
CAPM is one of the best methods to calculate the cost of equity:

11
𝑅𝐸 = 𝑟𝑓 + 𝛽(𝑟𝑚 − 𝑟𝑓)
Where the 𝑅𝐸 is the required rate of return on equity, 𝑟𝑓 the risk-free rate, 𝛽 is the systematic risk
of the company and 𝑟𝑚 the expected market return.
3.2.1.3 Beta
The beta (𝛽) assesses the systematic risk of an investment in comparison to the market. In short, it
estimates how volatile a stock is compared to the general market. Damodaran (2002) suggests to
calculate beta with the bottom-up method. The method starts with identifying the business
segments and industries in which the company operates and then choose comparable publicly
traded companies. Then the beta of each firm is obtained and the average beta of the firms is
unlevered by the mean debt to equity ratio.
𝛽𝑈 =𝛽𝐿
1 + (1 − 𝑇𝐶) ∗ 𝐷𝐸
Once the unlevered beta (𝛽𝑈) is obtained, the beta needs to be re-levered by using the target debt
to equity ratio and the targeted tax rate. Resulting in the levered beta (𝛽𝐿) of the firm.
𝛽𝐿 = 𝛽𝑈 ∗ [1 + (1 − 𝑇𝐶) ∗𝐷
𝐸]
3.2.1.4 Cost of Debt
The cost of debt is the essential rate required from debtholders in order for them to provide the
funding. Thus, the cost of debt assesses the cost rate the corporation needs to pay on its current
liabilities to its debtholders (Damodaran, 2002). It includes three elements: the risk-free rate, the
default risk, and the tax rate. If companies do not trade regularly their credit ratings and linked
default spread can be utilized to calculate the cost of debt.
𝑅𝐷 = (𝑟𝑓 + 𝐷𝑒𝑓𝑎𝑢𝑙𝑡 𝑠𝑝𝑟𝑒𝑎𝑑) ∗ (1 − 𝑇𝐶)
12
3.2.1.5 Terminal Value and Growth Rate
The last required piece is the terminal value and the expected growth rate. Since it is difficult to
forecast the cash flows over a larger period, a terminal value is used (Copeland, Koller, & Murrin,
2000). The terminal value is the final cash flow calculated under the assumption that it grows at a
steady nominal rate at perpetuity (Kaplan & Ruback, 1996). According to Damodaran (2002),
considering a stable growth model, the terminal value can be computed as follow:
𝑇𝑒𝑟𝑚𝑖𝑛𝑎𝑙 𝑉𝑎𝑙𝑢𝑒 =𝐹𝐶𝐹𝐹𝑡+1
𝑊𝐴𝐶𝐶 − 𝑔
Either the stable growth rate (g) can be equal or less than the growth rate of the economy in which
the company operates (Damodaran, 2002). Therefore, a common practice is to use the expected
real or nominal GDP growth rate of the economy. Moreover, in stable growth, it is suggested to
hold capital expenditures equal to depreciation (Kaplan & Ruback, 1996).
3.2.2 Relative Valuation
In this method, a company’s value is derived from the comparison of similar companies in the
market by using typical variables such as sales, profits, or cash flows (Damodaran, 2002). These
multiples can be grouped into two groups. First, the market multiples that use relative valuation
metrics of similar firms. Second, transaction multiples that use recent deals of the peer group to
reach the valuation. However, the latter will not be used as no information is available on past
transactions.
Thus, several multiples can be computed as for instance price-to-earnings ratio, price-to-book
value, and enterprise-value-to-EBITDA ratio. If price multiples are used, one estimates the market
value of the company. On the other hand, if one uses the enterprise value multiples, the enterprise
value is estimated.
According to Damodaran (2002), some of the more frequent multiples are the following:
Enterprise-value-to-sales ratio
Enterprise-value-to-EBITDA

13
Price-earnings ratio
Price-to-book ratio
Price-to-sales ration
Calculating the multiples is simple and therefore the valuation of the firm can be easily concluded.
However, the largest challenge is to define the peer group. Meaning, which firms in the market
should be used, to compare with the one which is being valued. Kaplan and Ruback (1996) indicate
one determinant for the peer group: comparable company, in which trading values of companies
in the same ecosystem are used to calculate the multiple.
4 Research Method
The following chapter defines the method of research used to collect information related to the
research topic. Furthermore, this chapter also describes the basis of the research and details how
several research tools are used. The methodology of research portrays a well-defined structure and
contributes to gathering the information for the following research. The period in which the thesis
will be written is from February to May 2019.
4.1 Data Collection
The most appropriate form of research for this topic is to conduct a case study research since the
study does not aim to determine the cause and effect but rather the exploration and description of
an event. The main characteristics of a case study research are that it is specially focused, offers a
high-level of detail, and is able to consolidate both objective and subjective data to accomplish a
deeper understanding. This case study will follow the characteristics of an illustrative study, as it
describes an event so that people not specialized in the topic can use this study to become familiar
with the terminology related to the topic (GCU, 2018).
Most researches are divided into two categories namely qualitative and quantitative. Qualitative
research is used to gather information which is rich in information and easily understandable. It
also provides an understanding of the problem and supports the developing of hypotheses for

14
further quantitative research. On the other hand, quantitative research is used to gather information
in the form of numerical data, which then can be summarized into statistics. Generally, quantitative
research results from a large sample population. This study will be a mixture of both. The
qualitative research will explain the concepts, compare several valuation methods and examine the
valuation process. Furthermore, it is needed to conduct an industry analysis. The quantitative
research is applied by forecasting financial performance and convert these financial performances
into value.
Therefore, the primary source of information is secondary. Information related to qualitative
research is gathered by previous researches and available reports to conduct the industry analysis.
The financial data, needed for the quantitative research, is extracted from the annual reports of both
companies and will be the foundation for the analysis. In addition, market data and further financial
data are collected from websites such as Damodaran Online and Thomson Reuters Eikon. It is
important to mention that data, which is used, is dated to September 2018 in order to avoid biases
from the transaction. In order to gain primary research, the researcher tried to contact both
companies in order to gain first-hand insights but was not able to secure an interview. In addition,
employees of companies were contacted since an existing network exist. However, none was
willing to give an interview even with the possibility to stay anonymous. The next steps were to
contact financial advisors and analysts. However, due to company policies, they were not allowed
to conduct interviews regarding clients of them. Thus, an independent journalist and film critic was
interviewed, as he is an expert in the industry and shows great knowledge based on his profession.
4.2 Data Treatment
For the qualitative part of the dissertation, which relates to sub-question 1 and 2, the data will be
analyzed by using content analysis. First, the data is organized and collected. Then a possible
framework is identified and the data is sort into the framework. Lastly, the result can be analyzed.
As mentioned earlier, the method for the quantitative part of the dissertation is the discounted cash
flow (DCF) method and the relative valuation method. To use these techniques, one needs the
forecasted free cash flow to the firm (FCFF) and the weighted average cost of capital (WACC). To
derive to the FCFF the research will use a financial model which is built on the basis of the data

15
provided in the companies’ financial statements. This model will be divided into three parts: input,
breakdown, and forecast. Inside the input section, the financials are simply being replicated. The
breakdown section is concerned with the most important elements of the financial statements, such
as revenue, depreciation, etc., and investigates how these might change in the future. Lastly, the
forecast section will present the financials of the company in the upcoming years. The forecast
period will be five years from 2019 to 2023. In order to build this model, Microsoft Excel is used.
To determine the WACC, the capital asset pricing model (CAPM) needs to be calculated first.
However, the media and entertainment industry needs to be analyzed first by using relevant
information from past research. With the help of financial and statistical mathematics, the value of
the company is calculated. Once the value is calculated it will be compared to the relative valuation
and the real market value, to identify the reasoning of the transaction.
4.3 Method Limitation
One of the largest limitations of this study is the access to the enterprises and people involved in
the acquisition deal. It is unlikely that the research will be able to obtain primary data of the
companies and people involved in the deal. Therefore, the research might miss crucial information
that could explain the rationale of The Walt Disney Company. The reason for the denied access
lies in the nature of the study. Since the study is not an official authorized study by a reputable
magazine, the importance of this study is diminished and is unlikely to open doors to employees
of the two companies. Additionally, the author of the case study has only limited access to the
customers and their preferences. Meaning that insights are missing on upcoming consumer trends
and their impact on the industry. This could mean, that future cash flows might be forecasted
differently to the ones conducted inside the companies and therefore, the calculated equity value
of the research can differ to the one calculated by Disney. In fact, it is quite likely that the estimated
value will differ, since due diligence is not known to the public and in such a transaction there are
multiple investment banks analyzing the company. Thus, it is not possible for the author to replicate
the same input. Nevertheless, the limited access does not prevent to follow through on the study,
as it can serve as an indicator that will support to answer the main research question.
16
5 Strategic Analysis
The following chapter focuses on the strategic analysis of the transaction. Therefore, the chapter
begin with an analysis of the Media and Entertainment Industry. The industry analysis presents a
general economic overview and then dives into the industry itself. It presents the components of
the industry, the current performance and major trends that are shaping the future of the industry.
The industry analysis is finalized by conducting a deep analysis of the most important segments in
which the two companies compete. After the industry analysis, the two companies are presented.
Lastly, the information from the industry analysis and the company overviews are taken into
consideration in order to understand the strategic rationale of the transaction.
5.1 Analysis of the Media and Entertainment Industry
Analyzing if an industry performance is caused by the industry itself or by the general economic
situation is crucial. Thus, it can add value to have a quick glimpse into the current situation of the
world economy and the main underlying economy of the specific industry, which is, in this case,
the United States. Figure 1 outlines the growth of the gross domestic product (GDP), which is the
most common indicator for a country’s overall economic activity. In the past two years, the world
economy growth decreased and is forecasted to keep decreasing in 2019 (3.3%). However, post-
2019, the GDP growth is predicted to increase again, which is caused mainly by emerging
countries. The United States, on the other hand, will experience a decrease in its GDP growth.
While the 2018 GDP growth was 2.9% it is expected to decrease until 2024 (1.6%). This is similar
to other advanced economies, which all underperform compared to the world average.

17
Figure 1 Real GDP growth - Annual percent change
Source: IMF (2019)
Nevertheless, the decrease in GDP growth will not have an effect on the unemployment rate in the
U.S. The rate continuously decreased from a five-year high in 2014 (above 6.5%) to a rate of 3.9%
in January 2019 (Trading Economics, 2019). Furthermore, it is expected that unemployment is
further decreasing. Therefore, labor security exists in the United States due to the high employment
rate.
Another important indicator, especially for the M&E industry, is to measure the consumers’
optimism regarding the overall economy and their personal financial situation. It is called the
Consumer Confidence Index and it indicates consumer spending behavior. It has a nominal value
of 100. If the index is above the nominal value, consumers are more prone to spend, while
consumers tend to save more and spend less if the index is below 100. Figure 2 shows that the
consumers of the U.S. and the OECD countries shifted their behavior in October 2014 and
December 2014, respectively. Before this, the index was recovering from an all-time low in 2009,
due to the 2008 financial crisis. However, in the past four years, the consumers tend to spend more
again reaching 101.5 for the U.S. and 100.9 for the OECD states in March 2018. The past year, on
the other hand, is showing a decreasing trend. Since the indexes indicated high consumer
confidence in 2014, the U.S. consumers have signaled to be more confident towards the future
economic situation, compared to the average consumers of the OECD countries.
1
1.5
2
2.5
3
3.5
4
4.5
5
2015 2016 2017 2018 2019 2020 2021 2022 2023 2024
in %
United States
Advanced
economies
Emerging market
and developing
economies
World

18
Figure 2 Consumer Confidence Index
Source: OECD (2019a)
In fact, the per-head consumption expenditure in the U.S. is one of the highest. According to the
Digital Media report 2019 (Statista, 2018), the 2018 consumer spending per capita totaled $40,279,
which is nearly triple the European average ($15,601) and five times higher than the global average
($8,087). Moreover, U.S. spending is 13 times higher than in China ($2,995), which is one of the
most important emerging countries. China’s population of 1,388 million makes it potentially the
biggest media and entertainment market worldwide compared to the “small” population of the USA
(328 million) (Statista, 2018).
5.1.1 Overview
The global media and entertainment industry (M&E) is a large and diversified industry. Big
conglomerates compete in various segments that consist of film, TV, music, video games and
publishing. These segments function on a horizontal line aside each other while there are two
additional vertical segments: internet and advertising. Combining all segments creates one vertical
market. Furthermore, customer preferences and industry drivers differ for each segment. Therefore,
the uniqueness of the vertical is obvious, since the different segments compete, or complement
each other to address the industry needs.
99.2
99.4
99.6
99.8
100
100.2
100.4
100.6
100.8
101
101.2
101.4
2014 2015 2016 2017 2018 2019
OECD USA

19
A few decades ago, the industry has been viewed as a creative content generator that followed
consumer and technology trends and decided what to supply. Therefore, the industry highly
depended on cultures, languages and ultimately, specific markets. Nevertheless, the segments
internationalized by overpassing the language barrier, due to its changing customers. In addition,
the new generation became more demanding about what they like, where and how to watch it.
Consequently, the industry transformed from a push to a pull market. The companies within the
industry need to adapt to the consumer-driven trends since the industry appeals to the emotions and
psychology of the customer, who subjectively decide what to accept and to value.
The M&E industry also highly relies on external factors but most importantly on technology
developments. Throughout its existence, the industry has experienced major disruptive forces.
Starting in the 1990s, the digitization of content significantly affected the creation and distribution
of music while the internet in the 2000s shattered the industry’s fundamentals. The most recent
game-changer was social media, while it certainly will not be the last one that shapes the future of
the M&E industry.
Concurrently, these disruptive forces provoked waves of convergence. The first wave occurred
between 1993 and 2003 in which companies hoped to accelerate growth by combining their
businesses. Mergers, such as the CBS-Viacom ($35.6 billion) in 1999 (Goldman & Johnson, 1999)
and acquisitions, like Comcast-AT&T Broadband (€44.5 billion) in the year 2001 (AT&T, 2001)
and News Corporation-DirectTV ($6.6 billion) in year 20003 (Sorkin, 2003), occurred. However,
the most important deal, which is also the biggest deal of all time in the M&E industry, was the
AOL-Time Warner merger. In 2000, America Online Inc. (AOL) purchased Time Warner for
$164.7 billion (IMAA, 2019) which gave them 55% ownership of the new company AOL Timer
Warner Inc. Nevertheless, most of these transactions were not successful, due to differences in
corporate culture and wrong market timing.
Therefore, in the second wave, the companies focused more on vertical and horizontal acquisitions.
In 2008, CBS bought CNET for $1.8 billion to strengthen its online content (CBS Corporation,
2008). Similar approaches were the Disney-Marvel Entertainment (2009) and Disney-Lucasfilm
(2012) transactions. Disney wanted to gain the content of both companies. Lastly, Comcast
acquired NBCUniversal in 2011 to gain the assets and the subscribers (Adegoke & Levine, 2011).
20
5.1.2 Current Performance
In 2017, the global M&E revenue reached $1.9 trillion and will reach $2.4 trillion in 2022, which
displays a compound annual growth rate (CAGR) of 4.4% (PwC Belgium, 2018). This means that
the industry is likely to outperform the global economy (recall Figure 1). However, this is not set
in stone, since new technologies, that will be discussed later, will have a significant impact on the
industry. One of the winners will be the video game segments, due to the rise of e-sports. It will be
the second fastest-growing segment with a CAGR of 20.6% resulting in total revenue of $1.6
billion by 2022. In comparison, the 2017 total revenue counted $620 million (PwC, 2018). The
losing segment is going to be in the publishing sector. The segment’s revenues continue to
deteriorate as publishers encounter difficulties to monetize their digital content. Consequently, the
revenues of magazines and newspapers will experience declines throughout the next years. The
magazine market will shrink by US$3.8 billion to global revenue of $88.1 billion by 2022 (PwC,
2018). The largest M&E market in the world by far is the United States. It alone represents a third
of the global M&E industry with $735 billion in total revenue and is expected to produce more
than $830 billion by 2022 (International Trade Administration, 2018). China, the second largest
market, “only” generates $190 billion and Japan came in third, at $157 billion (International Trade
Administration, 2017).
Even though the industry is highly diversified, the competitive environment is not. The industry is
considered highly concentrated. A few large firms shape the direction and its evolution. However,
it is difficult to determine the main competitors, since most companies do not compete in all
segments. For example, three big record companies dominate the music segment. However, these
companies might not be in direct competition to companies that dominate the film segment.
Therefore, the main competitors, which are relevant for the Disney-Fox transaction, are subtracted
from the 2018 annual reports of The Walt Disney Company and 21st Century Fox. The main
competitors are displayed below.
21
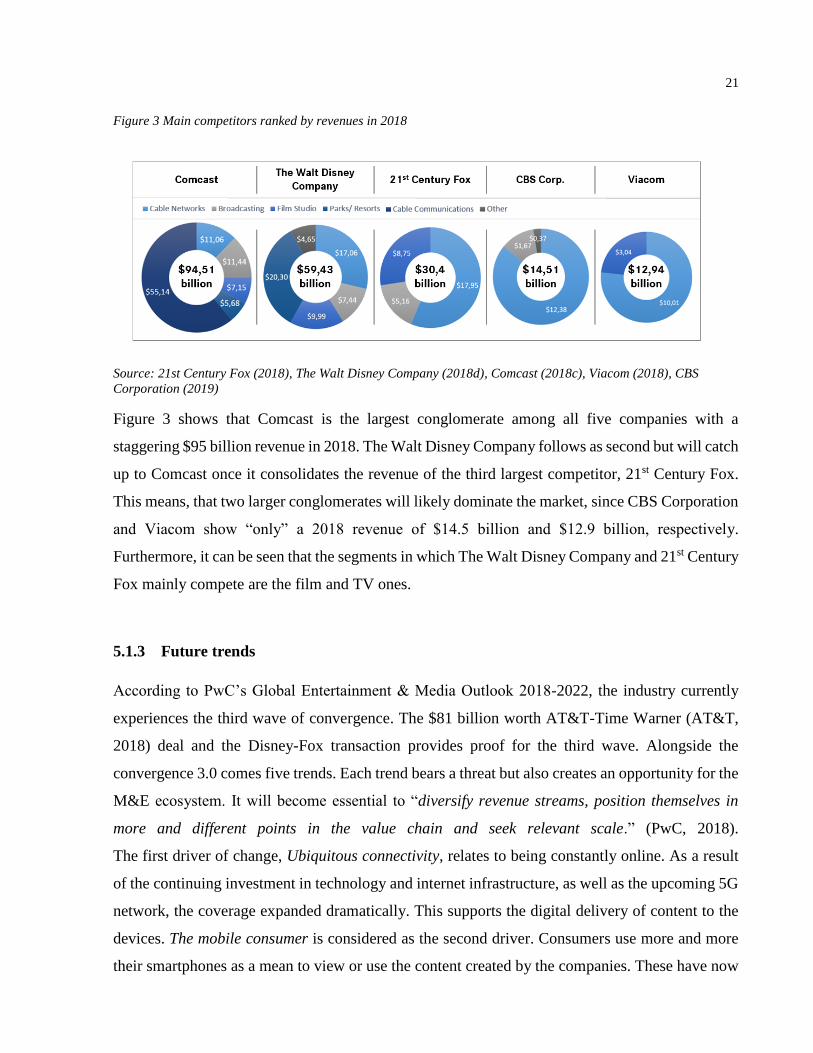
Figure 3 Main competitors ranked by revenues in 2018
Source: 21st Century Fox (2018), The Walt Disney Company (2018d), Comcast (2018c), Viacom (2018), CBS
Corporation (2019)
Figure 3 shows that Comcast is the largest conglomerate among all five companies with a
staggering $95 billion revenue in 2018. The Walt Disney Company follows as second but will catch
up to Comcast once it consolidates the revenue of the third largest competitor, 21st Century Fox.
This means, that two larger conglomerates will likely dominate the market, since CBS Corporation
and Viacom show “only” a 2018 revenue of $14.5 billion and $12.9 billion, respectively.
Furthermore, it can be seen that the segments in which The Walt Disney Company and 21st Century
Fox mainly compete are the film and TV ones.
5.1.3 Future trends
According to PwC’s Global Entertainment & Media Outlook 2018-2022, the industry currently
experiences the third wave of convergence. The $81 billion worth AT&T-Time Warner (AT&T,
2018) deal and the Disney-Fox transaction provides proof for the third wave. Alongside the
convergence 3.0 comes five trends. Each trend bears a threat but also creates an opportunity for the
M&E ecosystem. It will become essential to “diversify revenue streams, position themselves in
more and different points in the value chain and seek relevant scale.” (PwC, 2018).
The first driver of change, Ubiquitous connectivity, relates to being constantly online. As a result
of the continuing investment in technology and internet infrastructure, as well as the upcoming 5G
network, the coverage expanded dramatically. This supports the digital delivery of content to the
devices. The mobile consumer is considered as the second driver. Consumers use more and more
their smartphones as a mean to view or use the content created by the companies. These have now

22
the challenge to grasp and monetize the mobile consumer through customer experience. The third
driver is the need for new sources of revenue growth. The traditional revenue streams of enterprises
are deteriorating. If it is the home entertainment in the United States or the print newspaper in the
UK, both show that the conventional mean of generating revenue does not fit in modern times.
Business models need to be adapted or extended to seize the new revenue streams offered by digital
technology. In 2018, digital revenue accounted for more than 50% of the industry’s income (PwC,
2018). One of these technologies is the fourth driver that emphasizes the value shift to platforms.
Throughout the digitization of the industry, platforms have been the major recipients due to their
effectivity to generate money through advertising, subscription, and transactions. Lastly,
personalization is gaining in importance. Data analytics, technology enhanced content decision-
making and user experience, are all crucial for succeeding in the M&E industry. Nonetheless, it is
important to gain a deep insight regarding trends for the segments in which Disney and 21CF
mainly compete – film and TV.
5.1.4 Film Segment
The global film segment was worth $96.8 billion in 2018, which includes box offices and home
entertainment. This represents a nine percent growth from 2017 and a 25 percent growth from 2014
(Appendix 1).
Considering only the global box office revenue, the segment produced $41.1 billion (Appendix 1)
and is projected to continue to grow (PwC, 2018). The growth is led by the Asia Pacific market
($16.7 billion) with China being the main driver (MPAA, 2019). By 2020, it is expected that the
Chinese box-office revenue will exceed the one of the U.S., which is the largest market in terms of
box-office revenue (PwC, 2018). However, it is not in terms of quantity. Hereby, India, with its
famous Bollywood, is considered as the largest film market in the world in terms of produced
movies and tickets sold. Nevertheless, in 2018, the total film industry increased by 10 percent in
comparison to 2017 and generated $35.2 billion, while domestic box offices accounted for $11.9
billion (Appendix 2). This means that nearly 30% of global box office revenue was generated in
the U.S. Therefore, it is no wonder that the last year was a record-breaking year for the film
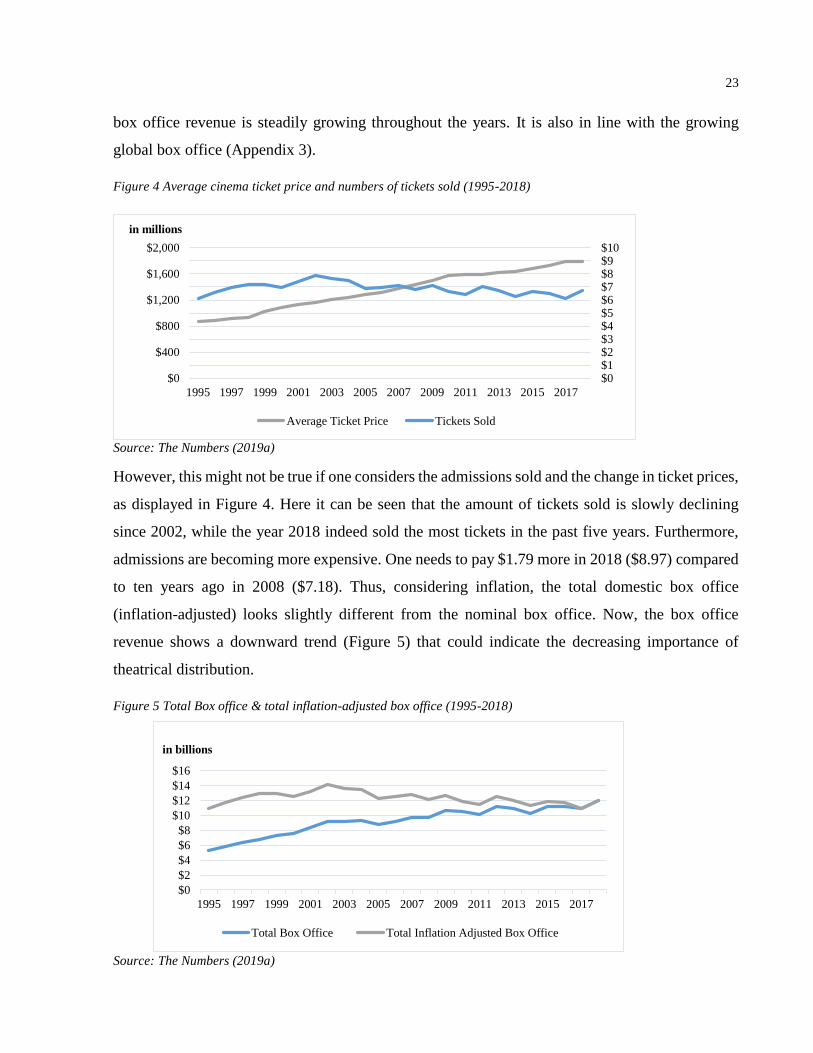
industry. Thus, it seems that the U.S. film industry is flourishing since Figure 4 shows that domestic
23
box office revenue is steadily growing throughout the years. It is also in line with the growing
global box office (Appendix 3).
Figure 4 Average cinema ticket price and numbers of tickets sold (1995-2018)
Source: The Numbers (2019a)
However, this might not be true if one considers the admissions sold and the change in ticket prices,
as displayed in Figure 4. Here it can be seen that the amount of tickets sold is slowly declining
since 2002, while the year 2018 indeed sold the most tickets in the past five years. Furthermore,
admissions are becoming more expensive. One needs to pay $1.79 more in 2018 ($8.97) compared
to ten years ago in 2008 ($7.18). Thus, considering inflation, the total domestic box office
(inflation-adjusted) looks slightly different from the nominal box office. Now, the box office
revenue shows a downward trend (Figure 5) that could indicate the decreasing importance of
theatrical distribution.
Figure 5 Total Box office & total inflation-adjusted box office (1995-2018)
Source: The Numbers (2019a)
$0
$2
$4
$6
$8
$10
$12
$14
$16
1995 1997 1999 2001 2003 2005 2007 2009 2011 2013 2015 2017
in billions
Total Box Office Total Inflation Adjusted Box Office
$0
$400
$800
$1,200
$1,600
$2,000
1995 1997 1999 2001 2003 2005 2007 2009 2011 2013 2015 2017
$0$1$2$3$4$5$6$7$8$9$10
in millions
Average Ticket Price Tickets Sold

24
Previously, it was mentioned that a few large companies control the film industry. They are
commonly known as the “Big Six”, which are major film studios that have been active since
Hollywood’s Golden Age. They include the following studios: Paramount Pictures (Viacom);
Columbia Pictures (Sony); Warner Bros. Pictures (Time Warner); Universal Pictures (Comcast);
20th Century Fox and Walt Disney Studios. It needs to be noted that there are only five major
studios left since Disney swallowed 20th Century Fox in 2019. Figure 6 shows the development of
the US market share in the film industry by the parenting company of the film studios. Eye-catching
is that the six companies collectively generate approximately 85% of all US box office grossing.
Out of these, Disney dominates with a 26% market share in 2018n which equals a total gross of
$3.135 billons (Box Office Mojo, 2019b). Second, are Comcast and Time Warner with each 16%.
This has not always been like this. Until 2014, Time Warner held the most market share with its
two studios Warner Bros Pictures and New Line Cinema. However, starting from 2011, Disney
gained momentum and increased its market share slowly year by year, except in 2017.
Figure 6 US film market share by Top 6 parenting company
Source: Box Office Mojo (2019b)
Disney’s growth can be attributed to the acquisitions of Marvel (2009) and Lucasfilm (2012).
Nevertheless, Disney also benefited from a consumer taste shift. According to Hüttmann (2019),
the cinema experienced a fantasy trend after the turn of the millennium. He argues that the cinema
16% 17% 15% 16% 19%8% 8% 10% 6% 8% 5 6%
13% 14%14% 13%
13%
17%11% 12%
9% 8% 10%11%
13% 13%10% 9%
12%
13%
13% 11% 22%14% 15%
16%
21% 20%20% 19%
18%
18%21% 19%
17%
17% 18%16%
12% 13%16% 15%
11%
10% 10% 18% 12%
13% 13% 10%
15% 11% 12% 14% 12%
14% 15%
15% 20%26% 22% 26%
0%
10%
20%
30%
40%
50%
60%
70%
80%
90%
100%
2007 2008 2009 2010 2011 2012 2013 2014 2015 2016 2017 2018
Viacom (Paramount) Sony (Columbia Pic.) Comcast (Universal)
Time Warner (WB/New Line) News Corporation (Fox) Disney

25
in the 90s was dominated by action movies with classical action heroes, like Bruce Willis in Die
Hard. Alongside movies of the genre Thriller and Drama, these movies had a budget of $40 million
to $60 million. However, on account of The Lord of the Rings and Harry Potter in 2001, the fantasy
genre gained new respectability. Shortly after, many more fantasy movies like The Chronicles of
Narnia followed. Today, it is challenging to find a low budget movie in the cinema, since big-
budget blockbusters dominate them. These movies have a much higher budget, which can range
from $200 million to $400 million (Hüttmann, 2019). He states further, that today’s cinema can be
called an event cinema since it inhabits movies that are purely for entertainment with a larger
budget and great special effects. Simultaneously, the major film studios flooded the cinemas with
franchises. James Bond, Fast and the Furious and Jurassic Park are examples. Once the first film
was a success, the company uses the built-in awareness of the first movie to market the second
movie, since familiarity breeds success (Garrahan, 2014). If the audience is familiar with a title,
they are more prone to look forward to it, meaning that sequels and franchises become cash
machines for the studios. In economic terms, franchises are cash cows for film studios.
Returning to Disney it becomes clear that they understood these trends and made acquisitions
accordingly. Therefore, it is hardly surprising why Disney acquired the fantasy-based studios
Marvel Entertainment and Lucasfilm and turned them into the largest existing movie franchises
(Lynch, 2018).
5.1.5 TV Segment
The film market is small compared to the TV market. In 2017, the number of TV households
worldwide was 1.63 billion (Statista, 2019a). The global pay TV revenue totaled around $200
billion in the same year. Most of the revenue is generated by advertising and program revenue,
which means licensing the content to broadcast programs. In the coming years, there will be a
strong growing market in the Asia-Pacific region with an estimated 666 million pay TV subscribers
by 2022 (Statista, 2019b). Alone in the U.S., there are 119.9 million TV homes, which means that
94% of American households own a TV (Nielsen, 2018). Thus, TV is one of the most penetrated
media channels. Nearly 187 million adults watched cable or satellite TV in the United States last
year (eMarketer, 2019). As mentioned earlier, Comcast Corporation is one of the largest cable
providers in the United States. According to Richter (2018), Comcast has 22.1 million pay TV

26
subscribers, with DirectTV (20 million) and Charter (16.7 million) being second and third,
respectively.
However, the TV market experiences the same trend as the film industry. The number of
subscribers is deteriorating and consequently the revenue as well. The global pay TV revenue is
predicted to decline to $183 billion by 2023 (Statista, 2019b). The deterioration is mostly driven
by the United States since more and more people are cutting their cords. In 2018, the traditional
pay TV services lost 3.5 million subscribers (Leichtman Research Group, 2019). By 2018, a total
of 33 million people already cut their cords in the United States and the number is expected to
increase rapidly. It is forecasted that there will be 55 million cord-cutters in the U.S. by 2022
(eMarketer, 2019). This declining trend is not a regional occurrence but a global trend. The third
quarter in 2018 was the first time that the global pay TV subscribers’ number of the top 100 pay
TV companies declined. The quarter showed a loss of 0.11 million subscribers, even though the
Asia Pacific region showed strong growth (Informitv, 2019).
The vital question now is, why are people visiting cinemas less and cut their cords. It is not that the
people are becoming less interested in media but that they are switching the channel. Due to the
digitization, the consumers are starting to watch content more frequently online on over-the-top
(OTT) platforms.
5.1.6 Over-The-Top Platform
OTT platforms are content providers that distribute media through the internet and therefore
bypassing the TV broadcaster. The platforms either offer access to film and TV content on demand,
which they acquired from other companies (licensing) or produced their own original content
specifically for the platform. There are three different types of OTT platforms. The first and most
commonly known is the subscription VOD (SVOD), that uses a subscription business model.
Subscribers pay a monthly or annual fee for unlimited access to all programs provided by the
service. The most famous SVOD platforms are Netflix and Prime Video. Hulu is also a big player
in the United States. The second model is a transactional VOD (TVOD) in which customers pay
for each content individual. Large players are iTunes or Google Play Movies. The third is an
advertising VOD (AVOD). The consumers do not pay a fee for watching content but ads are
present. The most famous are YouTube and Crackle.

27
The online video streaming market is one of the fastest growing segments in the media ecosystem.
In 2014, the global OTT revenue totaled $21 billion. In 2017, it recorded a global revenue of $53
and is about to reach $69 billion in 2018. It is expected that the growth continues and the revenue
will reach $129 billion in 2023. This would be a 240% increase from 2017 (Appendix 4). The
vigorous growth is steered by two determinants: SVOD, and the two regions China and the USA.
SVOD platforms show great growths in the past years since more people are joining and subscribe
to these disruptive platforms. At the end of 2017, the global subscription number counted 366
million people. The expected number will be up by 411 million in 2023 and equal 777 (Digital TV
Research, 2018b). Consequently, the revenue generated through SVOD service providers increases
as well. While in 2015 the global SVOD market was worth $11.2 billion, it already doubled its
revenue by 2017. The growth will continue and the market is expected to reach $69 billion by 2023
(Appendix 5). If this growth sustains, the SVOD market will have nearly tripled its revenue. Figure
7 displays the importance of SVOD for the overall over-the-top market.
Figure 7 Comparison of market share by OTT type in 2017 vs. 2023 (forecasted)
Source: Digital TV Research (2018a) & Digital TV Research (2018b)
SVOD platforms account for 47% of the total global OTT revenue and are forecasted to gain five
more percent in the next five years. Simultaneously, 2019 will be the year in which global
subscription OTT revenue will outgrow cinema. The forecasted $46 billion in 2019 (Appendix 5)
will be certainly higher than the 2019 global box office since the box offices will need to grow by
twelve percent, which did not occur in the past five years (Appendix 1).
The second determinant is the driving force of China and the USA. The U.S. is the largest OTT
market and continues to dominate, while China is the fastest-growing market. In 2017, the USA
SVoD
47%
AVoD
38%
TVoD
15%
2017
SVoD
53%AVoD
36%
TVoD
11%
2023 (forecasted)

28
alone accounted for 41% of the global OTT revenue (Figure 8) with a strong subscriber base of
132 million. However, the U.S. will lose some of its share to China, which will add 138 million
subscribers by 2023 (Digital TV Research, 2018b). Therefore, both countries will account for more
than half of the global OTT revenue by 2023 (Figure 8).
Figure 8 Global OTT revenue
Source: Digital TV Research (2018a)
Nonetheless, the reason for leaving the traditional pay TV and cinema ecosystem is still not clear.
Admittedly, the answer to this question is as simple as two words, costs, and convenience. Many
satellite and cable TV providers charge around $50 and higher for their service. According to
Pressman (2018), the average pay TV subscription costs $107 a month. This is eight times higher
than one need to pay for using Netflix’s or Amazon’s service, which both cost $12.99. In fact, 85%
of people who cut pay TV services chose “Price/ Too expensive” as a factor that influenced their
decisions (TiVo, 2017). At the same time, in many countries, like the USA, UK, Japan, and
German, the price of a cinema admission is higher than a month’s subscription to an SVOD
platform (Broadband TV News, 2018). Most of these countries also show lower cinema attendance
than the average country. Moreover, convenience also plays a role in why customers move away
from traditional video consumption. TV lost time-sensitivity, since consumers appreciate to choose
freely when they want to watch and on which device (Statista, 2018). In addition, they have the
possibility to catch up on trending programs and avoid spoilers.
$22.9 $28.8$47.8$8.8
$12.2
$25.8
$21.6
$27.7
$55.6
$53.3
$68.7
$129.1
$0
$20
$40
$60
$80
$100
$120
$140
2017 2018 2023
in billion
USA China Other

29
Establishing an SVOD market structure is difficult since some companies do not report how many
subscribers they have. For example, Amazon does not release any numbers regarding Prime
subscribers but in 2018, Jeff Bezos announced that the company has over 100 million Prime
subscribers (Bezos, 2018). However, this number does not indicate how many Prime subscribers
use Prime Video. Nevertheless, in order to gain an overview, Figure 9 presents the subscriber’s
number per major US SVOD platform. It shows that Netflix has the most international subscribers
with Amazon Prime Video second and Hulu third. Netflix nearly tripled its subscriber base in the
past five years while Amazon was able to quadruple its global subscription numbers. At the end of
2018, Netflix had nearly 140 million subscribers; Amazon had 100 million and Hulu had 25
million. Since Hulu only operates in the United States and Japan, the smaller subscriber base is
logical due to the smaller market. These numbers will increase in the coming years, as the trends
of the film and TV segment showed.
Figure 9 Number of global subscribers by major US SVOD platforms
Source: Parrot Analytics (2019)
However, the subscription numbers do not indicate the market share, since one single person could
subscribe to multiple SVOD services at the same time. Appendix 6 shows that 75% of the
consumers purchased Netflix and 56% of the consumers purchased Amazon Prime Video in the
past twelve months. Thus, the numbers only show that Netflix has the most subscribers and it can
49.258.1
74.8
93.8
117.6
139.3
25
40
5465
90100
4.5 6 9 1217
25
0
20
40
60
80
100
120
140
160
2013 2014 2015 2016 2017 2018
in million
Netflix Amazon Prime Video Hulu
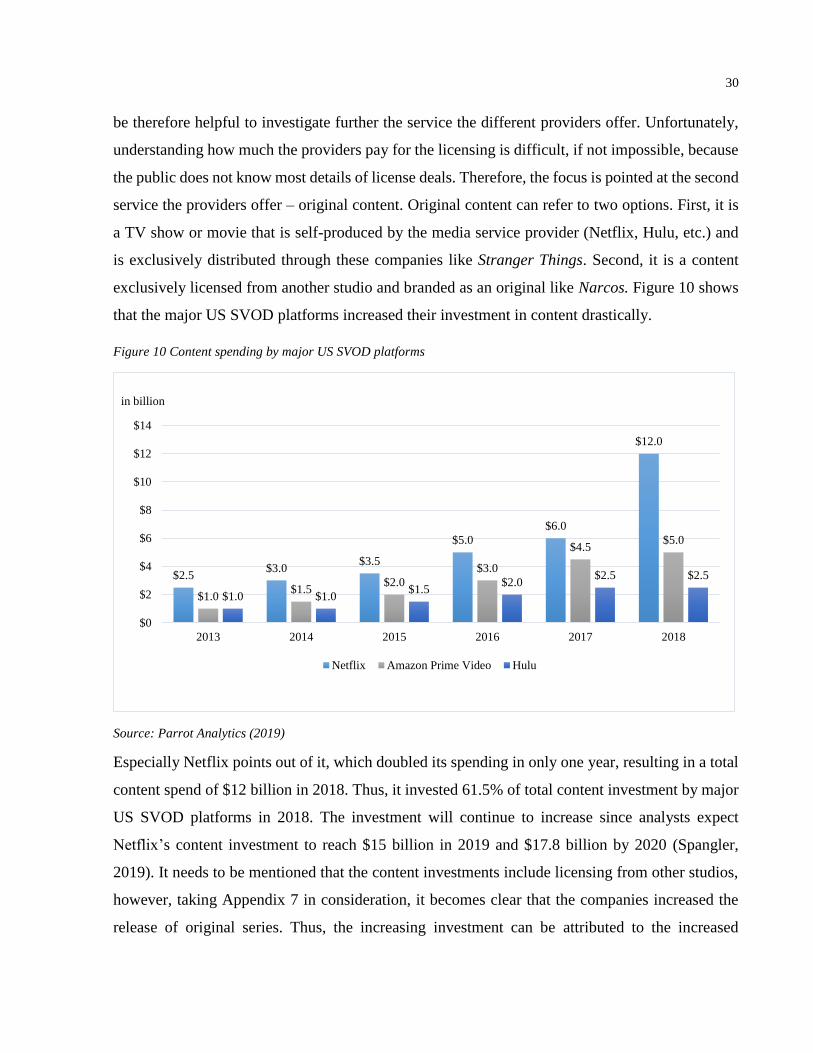
30
be therefore helpful to investigate further the service the different providers offer. Unfortunately,
understanding how much the providers pay for the licensing is difficult, if not impossible, because
the public does not know most details of license deals. Therefore, the focus is pointed at the second
service the providers offer – original content. Original content can refer to two options. First, it is
a TV show or movie that is self-produced by the media service provider (Netflix, Hulu, etc.) and
is exclusively distributed through these companies like Stranger Things. Second, it is a content
exclusively licensed from another studio and branded as an original like Narcos. Figure 10 shows
that the major US SVOD platforms increased their investment in content drastically.
Figure 10 Content spending by major US SVOD platforms
Source: Parrot Analytics (2019)
Especially Netflix points out of it, which doubled its spending in only one year, resulting in a total
content spend of $12 billion in 2018. Thus, it invested 61.5% of total content investment by major
US SVOD platforms in 2018. The investment will continue to increase since analysts expect
Netflix’s content investment to reach $15 billion in 2019 and $17.8 billion by 2020 (Spangler,
2019). It needs to be mentioned that the content investments include licensing from other studios,
however, taking Appendix 7 in consideration, it becomes clear that the companies increased the
release of original series. Thus, the increasing investment can be attributed to the increased
$2.5$3.0
$3.5
$5.0
$6.0
$12.0
$1.0$1.5
$2.0
$3.0
$4.5$5.0
$1.0 $1.0$1.5
$2.0$2.5 $2.5
$0
$2
$4
$6
$8
$10
$12
$14
2013 2014 2015 2016 2017 2018
in billion
Netflix Amazon Prime Video Hulu
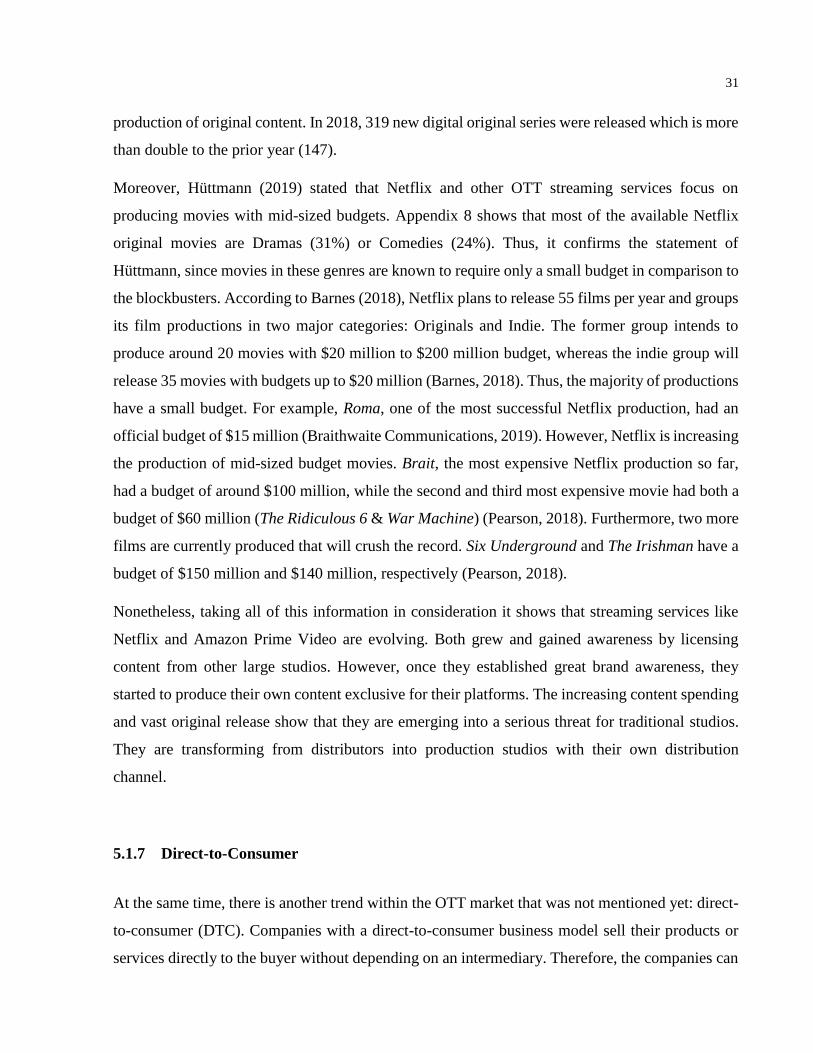
31
production of original content. In 2018, 319 new digital original series were released which is more
than double to the prior year (147).
Moreover, Hüttmann (2019) stated that Netflix and other OTT streaming services focus on
producing movies with mid-sized budgets. Appendix 8 shows that most of the available Netflix
original movies are Dramas (31%) or Comedies (24%). Thus, it confirms the statement of
Hüttmann, since movies in these genres are known to require only a small budget in comparison to
the blockbusters. According to Barnes (2018), Netflix plans to release 55 films per year and groups
its film productions in two major categories: Originals and Indie. The former group intends to
produce around 20 movies with $20 million to $200 million budget, whereas the indie group will
release 35 movies with budgets up to $20 million (Barnes, 2018). Thus, the majority of productions
have a small budget. For example, Roma, one of the most successful Netflix production, had an
official budget of $15 million (Braithwaite Communications, 2019). However, Netflix is increasing
the production of mid-sized budget movies. Brait, the most expensive Netflix production so far,
had a budget of around $100 million, while the second and third most expensive movie had both a
budget of $60 million (The Ridiculous 6 & War Machine) (Pearson, 2018). Furthermore, two more
films are currently produced that will crush the record. Six Underground and The Irishman have a
budget of $150 million and $140 million, respectively (Pearson, 2018).
Nonetheless, taking all of this information in consideration it shows that streaming services like
Netflix and Amazon Prime Video are evolving. Both grew and gained awareness by licensing
content from other large studios. However, once they established great brand awareness, they
started to produce their own content exclusive for their platforms. The increasing content spending
and vast original release show that they are emerging into a serious threat for traditional studios.
They are transforming from distributors into production studios with their own distribution
channel.
5.1.7 Direct-to-Consumer
At the same time, there is another trend within the OTT market that was not mentioned yet: direct-
to-consumer (DTC). Companies with a direct-to-consumer business model sell their products or
services directly to the buyer without depending on an intermediary. Therefore, the companies can

32
sell their products or services at lower costs and have end-to-end control from production to
distribution. The DTC model is not new within the business world but it did not necessarily exist
in the OTT market. Film studios used to license their content to OTT providers, but once Netflix
and Amazon started to produce their own content it gained popularity. Thus, 2019 will see a wave
of new OTT platforms launches. In March 2019, Apple announced the launch of its own video
subscription service Apple TV Plus for fall 2019 (Apple, 2019). Analysts expect that Apple will
spend $2 billion on producing original content (Rubin, 2019) but will not offer licensed shows or
movies. Therefore, it might not be a true competitor for Netflix and Amazon Prime Video.
Likewise, WarnerMedia, the subsidiary of AT&T, announced to launch its own streaming service
(unnamed) in late 2019 (Granados, 2018). Different to Apple, WarnerMedia owns a variety of top
franchises like The Lord of the Rings, Harry Potter, and the DC Extended Universe. In addition, it
has plenty of TV programs like Friends. Therefore, it has an already established library of IP.
Moreover, the company already has experience in streaming service with its 2015-launched service
HBO Now.
Other companies like Comcast-owned NBCUniversal and CBS Corporation also announced their
own streaming video service. Thus, more and more companies are trying to gain a share of the
OTT market and to rattle at Netflix’s and Amazon’s supremacy.
5.2 Company Profiles
5.2.1 21st Century Fox
Twenty-First Century Fox, Inc., commonly known as 21st Century Fox (21FC), is a multinational
mass media conglomerate. The company was formed in 2013 as one of the two spin-offs from the
News Corporation assets. News Corporation was founded by Rupert Murdoch in 1980 but was
pressured to spin off its business following a series of scandals in 2011 and 2012. Two new
companies were formed. Along 21st Century Fox, which retained most of the media businesses, a
new News Corporation was spun out. The company conducts business in the following segments:
Cable Network Programming; Television; Filmed Entertainment; and Other, Corporate and
Eliminations. The headquarter is based in Manhattan, USA, and employees approximately 22,400
33
people as of June 30, 2018. The current CEO is Rupert Murdoch, whose family holds 17% Equity
and 39% voting rights (21st Century Fox, 2018).
In the Cable Network Programming segment, 21st Century Fox produces and licenses a vast variety
of media and entertainment content (e.g. news, sport, and documentaries) for all kinds of
distribution channels, such as cable television systems and online video. The primary unit for 21st
Century Fox’s television distribution is the Fox Networks Group. However, the included units are
split among this segment and the TV segment. The Cable Network Programming comprises of
National Geographic, the FX Networks, and Fox News Group. National Geographic produces
documentaries about nature, science, and history. FX Networks is the premium entertainment
channel of the company that features hit and critically acclaimed series, including The Americans,
Fargo, and Two and a Half Men. Fox News Group includes the Fox News Channel, an American
news channel, and Fox Business Network, which focuses on delivering real-time financial
information. In addition, the company operates FOX Sports Media Group, which broadcasts a
variety of major sporting events, including NFL, MLB, NASCAR, international soccer and UFC.
It also has a Spanish-language sports channel to address the U.S. Hispanics. Lastly, the company
operates STAR India, which is one of India’s leading media conglomerates.
Regarding the Television unit, 21CF owns and operates 28 television stations in 17 markets that
broadcast the network’s programming. These include all of the above-mentioned media content
(e.g. news, sports, and movies). The company covers approximately 99% of U.S television homes.
It is one of the five big television networks in the U.S.
In the Filmed Entertainment area, the company produces and acquires movies for distribution and
licensing. It mainly operates as the Fox Entertainment Group that focuses on filmed entertainment
and cable network programming. The motion picture section includes 20th Century Fox, one of the
“Big Six” film studios in Hollywood, Fox Studios in Australia and India, and the Home
Entertainment division of 20th Century Fox. 20th Century Fox released 1,136 titles, including 23
in-house movies, to the domestic home entertainment market in 2018. This is due to several home
video distribution arrangements with other film studies (e.g. Metro-Goldwyn-Mayer and
Lionsgate). The television section includes the television unit of 20th Century Fox that produced
inter alia: The Simpsons and X-Files (21st Century Fox, 2018).
34
The Other, Corporate and Eliminations segment is comprised of ownership stakes in several
companies. 21CF holds around 39% equity interest in Sky, which is Europe’s leading pay television
service. It operates in the UK, Ireland, Germany, Austria, Italy, Spain, and Switzerland.
Furthermore, the company holds 30 % equity interest in Hulu, as The Walt Disney Company and
NBCUniversal do. In addition, it holds interest in the Endemol Shine Group, a global multi-
platform content provider. It was created as a joint venture of 21st Century Fox and Apollo Global
Management. Both companies have an equal ownership interest. Furthermore, 21CF has a 20%
interest in Tata Sky, a direct broadcast satellite television provider in India. Lastly, the company
has a minority equity interest in Vice and DraftKings, an online fantasy game operator.
5.2.2 The Walt Disney Company
The Walt Disney Company, commonly known as Disney, is one of the largest mass media and
entertainment conglomerate in the world. The brothers Walt and Roy O. Disney founded it in 1923.
The company operates in four different industry segments: media networks; parks, experiences and
products; studio entertainment; direct-to-consumer and international. Disney’s headquarter is
located in Burbank, USA, and employees approximately 201,000 people as of September 29, 2018.
The company’s current CEO is Robert Iger (The Walt Disney Company, 2018d).
It is important to note that the company conducted a strategic reorganization in March 2018 (The
Walt Disney Company, 2018a). The company reorganized the above mentioned business segments.
Previously, the business segments were Media Networks, Parks and Resorts, Studio Entertainment,
and Consumer Products & Interactive Media. The following company description will follow the
new strategic organization since it is crucial in order to understand the strategic reasons. However,
in the upcoming financial analysis, the old structure is followed, since the most recent annual report
follows this as well (The Walt Disney Company, 2018d).
The Media Networks business segment includes an extensive amount of cable and broadcast
networks, radio networks and stations, as well as television production and distribution. In addition,
the company has equity investments in programming services. The company is conducting business
as the Disney-ABC Television Group. The group includes the American Broadcasting Company
(ABC), which is one of the five American commercial broadcast television networks, and the

35
Disney Channel US. The latter includes the following channels: Disney Channel, Disney XD, and
Disney Junior. Among other small domestic channels, the group also holds 80% ownership in
ESPN Inc. and 50% in A&E Networks (The Walt Disney Company, 2018d). The former company
is an American sports media conglomerate that broadcasts various sports. The latter is an American
broadcasting company that focuses on reality and history series, lifestyle, and entertainment
programming. A&E owns 20% of Vice Group Holding, Inc. (Vice), which offers documentaries
aimed towards millennials. Additionally, Disney owns 11% of Vice (The Walt Disney Company,
2018d).
The Parks, Experiences and Consumer Products unit fulfills the function to bring Disney’s stories
and characters to life and is by far the largest business segment. The segment counts approximately
150,000 people (Disney Parks, Experiences and Products, 2019). In 1952, Disney formed the
division Walt Disney Imagineering. Its task was to design the first Disneyland, which opened doors
in 1955. Since then, Disney has grown into a leading provider of family travel and leisure
experiences. Today, the company owns and operates four resorts destinations: Disneyland Resort
in California, Walt Disney World Resort in Florida, Tokyo Disney Resort, and Disneyland Paris.
In addition, the company owns 47% of the Hong Kong Disneyland Resort, and 43% of the Shanghai
Disney Resort (The Walt Disney Company, 2018d). Besides the parks, Disney holds non-themed
park travel units, which includes Disney Cruise Line (fleet of four ships), Disney Vacation Club
(14 themed hotels-resorts), and Adventures by Disney (group guided tours). Furthermore, Disney
offers consumer products across a wide range of toys, apparel, home goods, and digital games and
applications. Lastly, it owns 200 physical Disney stores around the world, the e-commerce platform
shopDisney, as well as Disney Publishing Worldwide, the world’s largest publisher of children’s
books and magazines (Disney Parks, Experiences and Products, 2019).
The Studio Entertainment sector has been the foundation for The Walt Disney Company. Over 90
years ago, the company released its first short film entitled ‘Alice’s Wonderland’. Shortly after, the
in-house film studio ‘The Walt Disney Studios’ released a sound film with its most iconic character
‘Mickey Mouse’. Today, the studio is one of the major film studios in Hollywood. The following
units complete the segment: the Walt Disney Animation Studios, Disney Live Action, Disney
Theatrical Group and Disney Music Group (The Walt Disney Company, 2018a). Furthermore, the
company made major acquisitions throughout the years, which expanded its studio entertainment

36
empire. In 2006, Disney purchased Pixar Animation Studios for $7.4 billion (The Walt Disney
Company, 2006), in 2009, it acquired Marvel Entertainment for $4.2 billion (The Walt Disney
Company, 2009), and in 2012, it bought Lucasfilm for $4.06 billion (The Walt Disney Company,
2012).
This newly created Direct-To-Consumer and International business field was initiated after the
acquisition of BAMTech in 2017 (The Walt Disney Company, 2017a). It serves as a global,
multiplatform media organization for the content created by Disney. The segment will include the
international media business of Disney, BAMTech and Disney’s ownership stake in Hulu (30%).
The first mentioned business unit will be responsible for the international channels operated by
Disney that are divided into the following areas: South Asia, North Asia, EMEA, and Latin
America. In the 2017 announcement of the BAMTech acquisition, it was stated that it would
develop two streaming platforms for Disney. ESPN+ and the Disney-branded direct-to-consumer
streaming service (Disney+). ESPN+ is a multi-sport video streaming service that launched in April
2018. Disney+ will be an SVOD platform for exclusive Disney content (The Walt Disney
Company, 2018a).
5.2.2.1 Disney+
On Investor Day 2019, the company provided detailed information regarding the capabilities and
launch date of Disney+. It is set to launch in the U.S. on November 12, 2019, and will operate
based on subscription with a monthly price of $6.99 or an annual plan for $69.99 (The Walt Disney
Company, 2019b). According to Kevin Mayer, Disney’s direct-to-consumer chairman, there is a
high likelihood that Disney offers a discounted bundle for Hulu, ESPN+, and Disney+ one day
(The Walt Disney Company, 2019b). Moreover, the service will be available on many devices. It
will be available on the web, game consoles (PlayStation 4), smart TVs and connected streaming
devices, like Roku. Since Disney only produces family-friendly movies, its service will follow the
same path and will not show content that carries R (Restricted) or TV-MA rating. In total, the
service will have approximately 7,500 TV episodes and 500 movies, based on content from the
Disney-owned brands (Disney, Marvel, Pixar and Star Wars) and the newly acquired businesses
20th Century Fox and National Geographic. R-rated content from 20th Century Fox, such as

37
Deadpool will only be available on Hulu, which will complement the Disney-branded streaming
service. Disney+ will roll out worldwide over the next two years. Western Europe and Asia-Pacific
are targeted for late 2019 and early 2020, while Eastern Europe and Latin America will be able to
use the service starting late 2020. The rollout is staged in phases due to the return of rights from
licensees. In 2012, Disney and Netflix agreed to a deal, in which Netflix has exclusive rights to
stream all theatrical Disney films released after 2016 (Netflix , 2012). However, in the same
announcement in which Disney+ was first announced, Disney also mentioned that it would end its
distribution deal with Netflix (The Walt Disney Company, 2017a). This came in effect in 2019. All
Disney movies released in 2019 (Captain Marvel, Avengers: Endgame) will not be available on
Netflix but exclusively on Disney+. Once the year hits 2020, all Disney movies will be gone from
Netflix. Films from 20th Century Fox will join Disney+ by 2022, as HBO and Fox have a licensing
contract until then. In addition, The Walt Disney Company (2019b) announced it would have 25
original series and 10 original movies in year one exclusively for the streaming service. By year
five, the annual original series production should hit 50. Disney expects to have 60 million to 90
million global subscribers by the end of fiscal 2024, of which two-thirds will be outside the U.S.
The company stated further that it plans to invest over $1 billion annually in original content by
fiscal 2020 and increase the annually spending on originals to approximately $2.5 billion by 2024.
These numbers do not include theatrical releases. The company already forecasted that the peak of
operating losses would occur between fiscal 2020 and 2022, while profitability should be achieved
in fiscal 2024 (The Walt Disney Company, 2019b).
5.2.2.2 Disney’s Vertical Monetization Model
The new direct-to-consumer service will extend Disney’s monetization model. In the past, Disney
has generated money mostly through the same technique. It all starts with the creation of a
compelling story. The Lion King will serve as an example. The Walt Disney Studio produced the
movie in 1994 and it was a huge success at the box office. The company then used its consumer
product segment to sell toys and merchandise of The Lion King. In the same year, Lion King Shows
were performed in the parks and resorts and the company created a Lion King themed parade. A
few years later, the company produced a new TV show and lately it produced the 2019 live action
movie. Thus, Disney is using all of its business segments to generate money through its created

38
content. Disney+ will add an extra layer to the model, as it offers Disney a new customer interaction
channel. The fans can now use the online streaming platform to stay connected with movies like
The Lion King and Disney can use it to provide more Lion King-themed content for their customers.
In short, it is a new layer to generate money.
5.3 Strategic Drivers
The previous chapter has shown that that the opportunity to acquire 21st Century emerged after the
board approved the purchase of BAMTech. Thus, Disney already set stones in place to build up a
direct-to-consumer business before the acquisition opportunity. It now becomes clear that Disney
evaluated the opportunity not with a traditional perspective as suggested in the literature review.
The acquisition of TV channels or competencies for making movies to achieve economies of scale,
but through a different perspective.
The TV and film segments depend on disrupting technologies and new business models, but it is
not an essential asset in the segment. The core product is content. Without the intellectual property
(IP), companies cannot provide media and entertainment service. Preferably, the content carries a
large brand on its shoulders. This has also been a major influence in Disney’s past three major film
acquisitions (Hüttmann, 2019). Pixar (Toy Story, Finding Nemo, The Incredibles), Marvel (Blade,
X-Men, Spider-Man) and Lucasfilm (Star Wars) all created content that turned into large brands,
even before Disney acquired them. Therefore, Disney was buying the intellectual property but it
was also buying the brands connected to it. Utilizing the brands and creating new content is likely
to result in success. In economic terms, it is called brand equity. The official definition states: “a
value premium that a company generated from a product with a recognizable name when compared
to a generic equivalent.” (Investopedia, 2019). The clearest example of this effect provides Disney
itself. Back in 2012, when Disney announced to acquire Lucasfilm and to produce three more Star
Wars movies, news media and Star Wars enthusiasts generated a great hype about the new trilogy.
Ten years after the last Star Wars movie, the seventh (Star Wars: The Force Awakens) was released
and became Disney’s highest grossing and the world’s third-highest grossing movie ever (Box
Office Mojo, 2019c). The movie was also fortunate to target two generations, due to the first trilogy
in the 1970s and 1980s, and thus, doubling the target audience. This will be no different from the

39
content of 21CF, which owns some of the biggest names in pop culture: Alien, Predator, Die Hard
and Avatar. Avatar, the highest-grossing movie ever, announced four prequels in the next years
that are likely to be successful due to the brand name alone.
Thus, the management understood that it is buying brands like Avatar and a vast library that can
be monetized through the new direct-to-consumer business, rather through traditional means (Iger,
2019). Meaning, Fox content library increases the number of quality titles available on Disney+.
Thus, the library of Disney+ becomes broader and attracts a larger consumer pool, because the
number of target groups increased. It now does not only target Disney, Marvel, and Star Wars fans
but also enthusiasts of This is Us and Modern Family. This is an important factor, as it was
previously stated that brands and franchises are the IPs with the potential biggest cash flows. In the
end, consumers choose a service based on the content it provides not on the underlying platform.
Therefore, Disney can leverage the intellectual property of Fox to increase the competitiveness of
Disney+. With a larger exclusive content library, chances are increasing that consumers will
subscribe. In addition, the own platform gives Disney control over consumer interaction. The
company can now interact with the customer and boost the brand affinity of Fox’s content.
Once it is established, the company can cross-monetize the brand affinity through its vertical model
by cross-selling consumer products or upselling experiences and events. It now also can sell Fox-
branded merchandise (The Simpsons) or create Titanic-themed attractions in its resorts. However,
Disney is likely to do what Disney does best: Franchises. The company will produce new content
based on Fox’s IP and monetize it through its vertical layer. After the acquisition, Disney will have
an unprecedentedly content generating power (Hüttmann, 2019). In fact, Disney, with Fox
included, will now account for nearly a quarter of all content spend in the U.S. and eleven percent
of global content spend. The spending will reach $22 billion per year (Gadher, 2018). Therefore,
the acquisition of 21CF can also be seen as the reaction to the growing power of streaming services,
since Netflix and Co. continue to invest in content. Furthermore, the company indicated, that it
continues to increase content spending. However, to compete with the new entity, Netflix will need
to spend close to double than its current content spending.
Lastly, the transaction also decreases the competition for Disney+. After the transaction, Disney
owns the majority in the streaming service Hulu, due to the 30% ownership included in the Fox
deal. The company will make sure that the two streaming services will not fight but complement

40
each other. The previously mentioned bundle is an indication for it. Thus, with the transaction
Disney increases the competitiveness of its own streaming service, as it increases the offered
content library and decreases the possible competitors. All with the single goal to leverage
synergies and grow Disney.
6 Financial Analysis
The following chapter focuses on the financial analysis of the transaction. Therefore, the chapter
begin with an analysis of the key financial factor of both companies. It is followed by the valuation
of the 21st Century Fox. The valuation techniques used are the discounted cash flow analysis and
the relative valuation. At the end, a small conclusion is drawn.
6.1 Key Financial Analysis
6.1.1 Disney
Previously, it was mentioned that Disney conducted a strategic reorganization during fiscal 2018.
However, since the 2018 Annual Report still includes the old structure, the financial analysis will
consider the following four business segments: Media Networks, Parks and Resorts, Studio
Entertainment, and Consumer Products & Interactive Media.
The company shows total revenue of $59.4 billion, which is an 8% increase, or $4.3 billion, to the
previous year. The growth in box office sales (recall Figure 6) and increased visitors in the parks
and resorts mainly contribute to the increase. Furthermore, increased affiliate fees and the
expansion of TV/SVOD subscribers also affected the growth. The Media Networks segment was
the greatest source of revenue for Disney with a proportion of 41% (The Walt Disney Company,
2018d). The following paragraphs will give an overview of each segment’s contribution to the
revenue.
The Media Networks sector mainly generates revenue from affiliation fees, advertisement sales,
and subscription fees. The revenue experienced a small increase of 4% ($990 million) throughout

41
the last fiscal year. The main driver was the previously mentioned increase in program sales. The
company also generated more revenue from licensing to Hulu as well as increased sales of Grey’s
Anatomy and Black-ish. (The Walt Disney Company, 2018d)
The Parks and Resorts sector generates revenue through the sale of admission tickets, the sale of
victuals and merchandise, as well as charges for overnight stays and tour packages. The segment
grew by 10% and earned $1.88 billion more compared to 2017. The growth is reflected by higher
average guest spending (6%) and ticket sale (2%) in the domestic operations. The revenue of
international operations increased by 15%, which mirrors $532 million of the $1.88 billion. (The
Walt Disney Company, 2018d)
The Studio Entertainment sector primarily generates revenue from distributing films in the cinema,
home entertainment, and TV/SVOD markets. The sector increased its revenue by 19%, or $1.61
billion, compared to the prior year. Therefore, it was the highest growing business sector of Disney
during fiscal 2018. The main driver was the release of major motion pictures, including four Marvel
titles: Avengers: Infinity War, Black Panther, Thor: Ragnarok and Ant-Man and the Wasp. (The
Walt Disney Company, 2018d) The first two mentioned were also two highest-grossing movies in
2018 with revenues of $2 billion and $1.35 billion, respectively (Box Office Mojo, 2019a).
The Consumer Products & Interactive Media sector generates revenue through licensing characters
and content to other companies and from Disney stores and the e-commerce platform. This sector
is the only one, which showed negative growth for the last year. The revenue decreased by 4% and
produced $182 million less than in 2017. The lower revenue was primarily due to lower sales of
licensed merchandise from the Frozen, Cars and Princess universe. (The Walt Disney Company,
2018d)

42
Figure 11 Disney's Net Revenues by Segment (in billion)
Source: The Walt Disney Company (2018d) & The Walt Disney Company (2016b)
6.1.2 21st Century Fox
21st Century Fox’s total revenue for fiscal 2018 was $30.4 billion, which represents a 7% increase,
or $1.9 billion, as compared to fiscal 2017. The main drivers for the growth were the contractual
rate increase in the Cable Network Programming and TV segments, and the increased content
revenues. The growth of the latter was induced by increased SVOD revenue and box office sales.
The greatest revenue-contributing segment was the Cable Network Programming (59%) with
Filmed Entertainment (29%) second (21st Century Fox, 2018).
The Cable Network Programming sector continued to carry 21CF’s financial performance. The
segment generates revenue through affiliate fees, advertising and content licensing. The business
sector increased its revenue by $1.8 billion, or 11%, in fiscal 2018, while it differentiates between
domestic and international channels. The domestic channels increased their contractual rate for
multiple channels and increased content revenue by sublicensing the Big Ten programming to a
third party. The international channels gained higher rates and subscribers that increased the
affiliate fee revenue. In 2018, STAR India added the Indian Premier League (IPL) for Cricket and
$21.2 $23.3 $23.7 $23.5 $24.5
$15.1$16.2 $17.0 $18.4
$20.3
$7.3$7.4
$9.4 $8.4$10.0
$5.3$5.7
$5.5 $4.8
$4.7
$0
$10
$20
$30
$40
$50
$60
$70
2014 2015 2016 2017 2018
Media Networks Parks and Resorts Studio Entertainment Consumer Products & Interactive Media

43
promptly increased the advertising revenue. Lastly, sublicensing the rights of soccer programming
in Latin America raised content revenue. (21st Century Fox, 2018)
The Television segment generates revenue through identical streams as the previous sector. The
segment experienced a 9% decrease, or $532 million, in comparison to fiscal 2017. Even though
the affiliate fee revenue showed an increase of 12%, the segment was offset by lower revenue
generated through advertising and content. The company produces 15% less advertising revenue
compared to 2017, mainly due to the lower revenue of Super Bowl LII. Approximately $425 million
less revenue was produced in comparison to Super Bowl LI. Content and other revenues produced
15% less, compared to fiscal 2017, due to the absence of permission licenses in the television
stations. (21st Century Fox, 2018)
The Filmed Entertainment segment generally produces revenue by distributing movies and TV
shows in theaters, home entertainment, and TV markets. In fiscal 2018, the Filmed Entertainment
segment’s revenue increased by $512 million, or 6%, in comparison to the prior fiscal year. The
licensing of Bob’s Burgers and This is Us to SVOD markets and the worldwide theatrical
performance of Deadpool 2, led the revenue growth. Deadpool 2 was the ninth highest-grossing
movie in 2018 with $779 million worldwide box office sales (Box Office Mojo, 2019a).
Figure 12 Fox's Net Revenues by Segment (in billion)
Source: 21st Century Fox (2018)
$12.3 $13.8 $15.0 $16.1$17.9
$5.3$4.9
$5.1$5.6
$5.2$9.7
$9.5$8.5
$8.2$8.7
$6.0$2.1
-$1.3 -$1.5 -$1.5
-$5
$0
$5
$10
$15
$20
$25
$30
$35
2014 2015 2016 2017 2018
Cable Network Programming Television Filmed Entertainment Other, Corporate and Eliminations

44
6.2 Valuation of 21st Century Fox
The discounted cash flow analysis and the market multiples are based on financial data from
September 30, 2018. The latest available figures are for December 31, 2018. However, Fox shows
a plus of $10 billion cash in Q2 2019, which was likely generated by selling a business or it might
even be related to the sale of Sky. Since the sale most likely occurred due to the transaction, the
last available numbers are biased through the transaction. Thus, the valuation used financial data
from September 30, 2018.
6.2.1 DCF Valuation
The discounted cash flow valuation is based on annual reports and other third-party sources. The
income statement was forecasted for a five-year period (2019 – 2023) which is based on three
sources of information. First, the operating and financial historic development of the past five years
were considered. Second, the best estimates of Analysts retrieved from Thomson Reuter Eikon
were considered. Lastly, specific economic and market-related evolutions were taken into
consideration during the forecasting. These trends were mentioned in the previous chapters.
The revenues were divided into the business segments to better understand the past trends as well
as making specific assumptions for each segment.
Table 2 Historical Revenue of Fox (2014-2018)
$ million 2014 2015 2016 2017 2018 Ø
Growth
Cable Network Programming 12,273 13,773 15,029 16,130 17,946 -
growth (%) 12.8% 12.2% 9.1% 7.3% 11.3% 10.5%
Television 5,296 4,895 5,105 5,649 5,162 -
growth (%) 9.0% -7.6% 4.3% 10.7% -8.6% 1.5%
Filmed Entertainment 9,679 9,525 8,505 8,235 8,747 -
growth (%) 12.0% -1.6% -10.7% -3.2% 6.2% 0.5%
Direct Broadcast Satellite Television 6,030 2,112 - - - -
growth (%) 35.8% -65.0% - - - -
Other, Corporate and Eliminations (1,411) (1,318) (1,313) (1,514) (1,455) -
growth (%) 23.0% -6.6% -0.4% 15.3% -3.9% 5.5%
Total Revenue 31,867 28,987 27,326 28,500 30,400
growth (%) 15.1% -9.0% -5.7% 4.3% 6.7% 2.3%
Source: 21st Century Fox (2018) & 21st Century Fox (2015)
45
Recalling the GDP projection from Figure 1, it can be seen that the GDPs from the United States
and advanced economies are expected to decrease from 2019 to 2021 and then remain constant for
the following years.
Thus, Cable Network Programming is expected to decrease from its five-year average in the first
year with 1% and in 2020 with 2%. In the third projected year, the revenue is decreasing again by
1% and then remains constant. The decrease follows the same trend as the GDP and is mainly
driven by cord cutting and the rise of SVODs. Especially the latter influences this segment essential
and is also responsible for the 2% drop in 2020. Since many competitors are introducing their own
DTC OTT in late 2019/ begin 2020, the fiscal year 2020 is influenced. The rising spending on
original content equals increased competition and therefore less licensing fee, as more alternatives
are available.
The television segment shows a similar trend to the previous segment. Cord cutting and market
saturation are a key factor. The segment is expected to decrease from its 1.5% five-year average
by 1% each in the first three years and then remain constant. The constant decrease of the segment
is aligned to the increasing competition of streaming content providers. Since the subscriber base
is decreasing, the cost of acquiring and maintaining subscribers has increased.
The filmed entertainment will follow the same decreasing trend, as the market share decreased in
the past years and is likely to follow the trend, but also due to the decreasing ticket sale. Therefore,
the segment is decreasing by 1% in the first projected year and 2% in 2020. 2019 only decreases
by one percent, as major movies like X-Men: Dark Phoenix are scheduled to be released. 2020 does
not have any major release, thus the 2% decrease. However, on December 17, 2020, Avatar 2 is
scheduled to be released. It is the sequel of the highest-grossing movie ever (@02.05.2019).
Therefore, the segment is significantly increasing by 5% in 2021, as the effects of the movie are
likely to be experienced in 2021, due to the December release. Avatar 3 follows one year later,
which will not be able to show the same success as its predecessor, but due to the aftermarket of
Avatar 2, the growth remains at 5%. In 2023, only the aftermarket of Avatar 3 keeps the growth at
1%.
Other, Corporate and Eliminations is assumed to remain constant.

46
Table 3 Projected Revenue of Fox (2019-2023)
$ million 2019E 2020E 2021E 2022E 2023E
Cable Network Programming 19,651 21,125 22,498 23,960 25,518
growth (%) 9.50% 7.50% 6.50% 6.50% 6.50%
Television 5,188 5,162 5,084 5,008 4,933
growth (%) 0.50% -0.50% -1.50% -1.50% -1.50%
Filmed Entertainment 8,703 8,486 8,910 9,355 9,449
growth (%) -0.50% -2.50% 5.00% 5.00% 1.00%
Other, Corporate and Eliminations (1,455) (1,455) (1,455) (1,455) (1,455)
growth (%) 0.00% 0.00% 0.00% 0.00% 0.00%
Total Revenue 32,087 33,317 35,037 36,869 38,445
growth (%) 5.55% 3.83% 5.16% 5.23% 4.27%
The operating expenses of Fox are forecasted as a percentage of Fox’s revenue. The average weight
in the five historical years was 76.91% and it is assumed that the costs will remain at this level
constant for the projected period.
Table 4 Projected Operating Expense (2019-2023)
$ million 2018 Ø 2019E 2020E 2021E 2022E 2023E
Total Revenue 30,400 32,087 33,317 35,037 36,869 38,445
Operating cost (23,437) (24,679) (25,626) (26,948) (28,357) (29,569)
% revenue 77.10% 76.91% 76.91% 76.91% 76.91% 76.91% 76.91%
Furthermore, the same principle of the forecasted operating costs was used for conducting the
forecast of the depreciation and amortization. The five-year average of depreciation and
amortization was 1.93% of the total revenue, which was applied for the projected period. It is
assumed that it will remain constant throughout the period. Going forward, with the forecasted
depreciation and amortization, the capital expenditure can be calculated. The capital expenditure
was derived by using the following formula:
𝐶𝑎𝑝𝐸𝑥 = 𝑃𝑃&𝐸 (𝑐𝑢𝑟𝑟𝑒𝑛𝑡 𝑝𝑒𝑟𝑖𝑜𝑑) − 𝑃𝑃&𝐸 (𝑝𝑟𝑖𝑜𝑟 𝑝𝑒𝑟𝑖𝑜𝑑) + 𝐷𝑒𝑝𝑟𝑒𝑐𝑖𝑎𝑡𝑖𝑜𝑛 (𝑐𝑢𝑟𝑟𝑒𝑛𝑡 𝑝𝑒𝑟𝑖𝑜𝑑)
However, before this formula can be used, the net fixed assets (PP&E) need to be calculated as
well. Similar to the operating costs, the net fixed assets of the past five years were collected from
the balance and each year was divided by the total revenue of the same year. Thus, the weight of
the net fixed assets to the total revenue was calculated. The average of the five historical years was

47
6.29%, which was used for the forecasted period. Therefore, the capital expenditures were able to
be estimated, as shown by Table 5.
Table 5 Projected D&A and Capex of Fox (2019-2023)
$ million 2018 CAGR 2019E 2020E 2021E 2022E 2023E
Revenues 30,400 32,087 33,317 35,037 36,869 38,445
Depreciation 584 620 644 677 713 743
& revenue 1.92% 1.93% 1.93% 1.93% 1.93% 1.93% 1.93%
Net Fixed Assets 1,956 2,019 2,096 2,204 2,320 2,419
& revenue 6.43% 6.29% 6.29% 6.29% 6.29% 6.29% 6.29%
CAPEX 551 683 722 786 828 843
% revenue 1.81% 1.54% 1.54% 1.54% 1.54% 1.54% 1.54%
Lastly, the working capital used the same procedure as the capital expenditure and operational
costs. However, each years’ working capital was estimated by subtracting the current liabilities
from the current assets. In order to arrive at the change in working capital, the working capital of
the prior year was subtracted from the working capital of the current year. Next, the weight of the
change in working capital to the total revenue was computed. The average of the weight was
applied for the forecasting period to determine the forecasted change in working capital (Appendix
12).
The marginal US corporate tax rate in 2018 and 2019 is 21%. It was reduced from 35% to 21% in
2018 (OECD, 2019b). However, Fox’s average effective tax rate in the past five years was 17%.
Hereby, it needs to be noted that the tax rate was negative in 2018. Thus, without considering the
tax rate in 2018, the average effective tax rate (2014-2017) was 23.65%. Therefore, an effective
tax rate of 24% is considered, which is in line with the rate used in an equity research of Fox (Credit
Suisse, 2018).
Furthermore, taken all information from the above into consideration, including the forecasted
EBIT from Appendix 10, the free cash flow can be computed as seen below. In addition to the
specific forecasted period, a perpetuity cash flow was estimated. The perpetuity cash flow used the
following assumptions:
Growth rate: The rate is assumed to be 1.6%, which is equal to the GDP growth rate of the
United States and advanced economics from 2024 onwards (IMF, 2019)

48
EBIT: Is equal to the last projected EBIT (2023) plus 1.6% growth
Tax rate: Similar tax rate (24%) as used in the previous years
Depreciation amortization: remains equal to the last projected year
Change in WC: Is equal to the last projected estimate (2023) plus 1.6% growth
Capex: Equal to D&A as suggested in the literature review
Table 6 Projected FCFF & Terminal Value of Fox (2019-2023)
Cash Flow ($ million) 2019E 2020E 2021E 2022E 2023E Terminal Value
EBIT 6,787 7,047 7,411 7,799 8,132 8,262
(-) Tax on EBIT (1,629) (1,691) (1,779) (1,872) (1,952) (1,983)
(+) D&A 620 644 677 713 743 743
(-) Changes in WC (1,049) 133 186 198 171 173
(-) Capex 683 722 786 828 843 743
FCFF 6,144 5,146 5,338 5,614 5,911 6,106
Based on the literature review, in order to calculate the weighted average cost of capital, all required
variables have to be set up first. Thus, the capital structure of 21CF is defined first, followed by the
estimation of the cost of equity and the calculation of the cost of debt.
For the calculation of the capital structure, the book value of the debt was used. Furthermore, the
net debt is the more appropriate book value, according to Investopedia (2018b).
In regards to the cost of equity ( 𝑅𝐸 ), a risk-free rate of 3% was assumed. The 3% was derived
from the US 10 year Treasury bond1, as of September 2018 (Datahub, 2019), whereas a market risk
premium of 5.96% for the United States was assumed. This value is based on the current risk
premium for mature equity markets, according to Damodaran Online (2019). The systematic risk
of 21st Century Fox was computed by estimating the asset beta from peers and then use the average
unlevered beta to re-lever the beta for Fox, as stated in the literature review. The peer group consists
of five companies including The Walt Disney Company. Three of the remaining four are taken
from Fox’s annual report, which are CBS Corporation, Comcast Corporation, and Viacom Inc. The
last company is Discovery Inc., which is based on suggestions by multiple analysts and Credit
Suisse (2018). All of these companies operate in the media and entertainment industry and have
1 Copeland, et al. (2000) suggest a 10-year Treasury bond as the appropriate rate for risk-free rate

49
2018 revenues, ranging from $9.6 billion (Discovery Inc.) to $88.6 billion (Comcast). In addition,
other companies were considered but were omitted. AT&T’s revenues are too large ($164 billion)
and Netflix’s price does not reflect its earnings (ratio of 129) (Thomson Reuters Eikon, 2019). The
table below shows that Fox’s beta is 1.12, which means that the cost of equity is equal to 9.69%.
Table 7 Fox's Beta Calculation
Company Levered
Beta2
Market
Value of
Debt
Market
Value of
Equity
Debt/
Equity Tax rate
Unlevered
Beta
Walt Disney Co 1.29 16,724 175,410 9.53% 22.70% 1.20
CBS Corp 1.36 9,297 21,543 43.16% 24.45% 1.03
Comcast Corp 1.19 61,734 161,097 38.32% 24.83% 0.92
Discovery Inc. 1.47 16,951 22,080 76.77% 24.16% 0.93
Viacom 1.27 8,525 12,157 70.12% 23.71% 0.83
Mean 1.28 40.28% 23.9% 0.98
21st Century Fox 1.12 19.21% 24% 0.98
Source: Thomson Reuters Eikon (2019)
The cost of debt (𝑅𝐷) is estimated to be 3.8%, which was calculated by using the previously
mentioned tax rate and by assuming a credit rating of BBB+ (CBonds, 2018) that inhabits a default
spread of 2%, per scale rating of Damodaran (Appendix 13). After considering all information, the
WACC is assumed 8.59%.
Table 8 Fox's WACC and Capital Structure
WACC 8.59% Capital Structure @ 30/9/18
Market Cap 63,340
Risk-free rate 3%
Beta 1.12 ST Debt 872
Market Risk Premium 5.96% LT Debt 18,379
Cost of Equity 9.69% Cash (7,083)
Net Debt 12,168
Credit rating BBB+ Value 75,508
Credit spread 2%
Tax rate 24% D/(D+E) 16.11%
Cost of Debt 3.80% E/D+E) 83.89%
2 Retrieved from Wharton Research Data Service (2019)
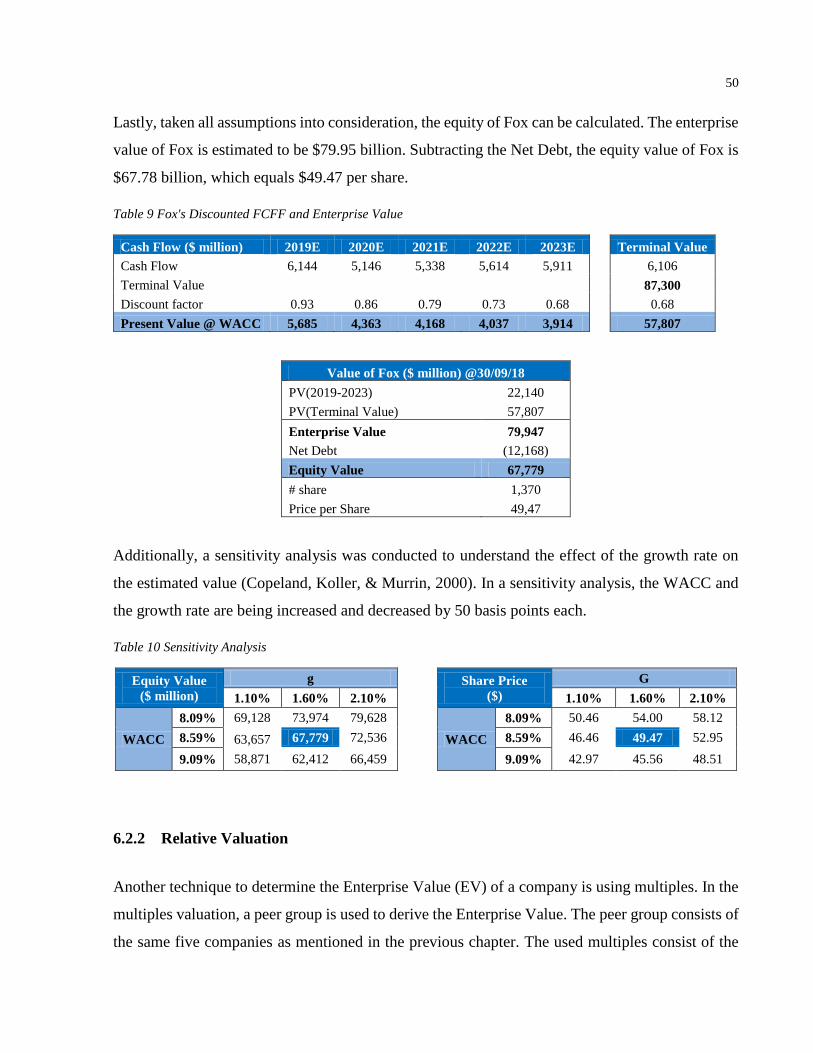
50
Lastly, taken all assumptions into consideration, the equity of Fox can be calculated. The enterprise
value of Fox is estimated to be $79.95 billion. Subtracting the Net Debt, the equity value of Fox is
$67.78 billion, which equals $49.47 per share.
Table 9 Fox's Discounted FCFF and Enterprise Value
Cash Flow ($ million) 2019E 2020E 2021E 2022E 2023E Terminal Value
Cash Flow 6,144 5,146 5,338 5,614 5,911 6,106
Terminal Value 87,300
Discount factor 0.93 0.86 0.79 0.73 0.68 0.68
Present Value @ WACC 5,685 4,363 4,168 4,037 3,914 57,807
Value of Fox ($ million) @30/09/18
PV(2019-2023) 22,140
PV(Terminal Value) 57,807
Enterprise Value 79,947
Net Debt (12,168)
Equity Value 67,779
# share 1,370
Price per Share 49,47
Additionally, a sensitivity analysis was conducted to understand the effect of the growth rate on
the estimated value (Copeland, Koller, & Murrin, 2000). In a sensitivity analysis, the WACC and
the growth rate are being increased and decreased by 50 basis points each.
Table 10 Sensitivity Analysis
Equity Value
($ million)
g Share Price
($)
G
1.10% 1.60% 2.10% 1.10% 1.60% 2.10%
WACC
8.09% 69,128 73,974 79,628
WACC
8.09% 50.46 54.00 58.12
8.59% 63,657 67,779 72,536 8.59% 46.46 49.47 52.95
9.09% 58,871 62,412 66,459 9.09% 42.97 45.56 48.51
6.2.2 Relative Valuation
Another technique to determine the Enterprise Value (EV) of a company is using multiples. In the
multiples valuation, a peer group is used to derive the Enterprise Value. The peer group consists of
the same five companies as mentioned in the previous chapter. The used multiples consist of the

51
Enterprise Value divided by Revenues (EV/Revenues) and the ratio between the Enterprise Value
and EBITDA (EV/EBITDA). These ratios reflect the value of a company in relation to a financial
figure that is linked to the whole company. In addition, the price-earnings ratio (P/E), the price-to-
sales (P/S) and the price-to-book (P/B) multiple were used. These multiples represent the claim the
shareholders have on the assets and cash flows.
Once these multiples were estimated for each company, an average was calculated to be used to
value Fox, by multiplying the peer multiple with the underlying financial figure of 21st Century
Fox. The last three mentioned multiples will directly result in the equity value, while the other two
result in the enterprise value of 21CF. Therefore, in order to reach the equity value, the net debt
needs to be subtracted. Once the equity value is estimated, the number of outstanding shares then
divides it in order to arrive at the share price.
Table 11 Multiple Valuation of Fox
Comparables EV/Revenue EV/EBITDA P/E P/S P/B
Walt Disney Co 3.32 11.06 16.17 2.95 3.6
CBS Corp 2.17 9.71 14.53 1.51 8.57
Comcast Corp 2.53 7.85 14.31 1.84 2.25
Discovery Inc. 4.28 6.45 - 2.37 2.72
Viacom 1.73 7.46 8.82 1.05 1.74
Average 2.81 8.51 13.46 1.94 3.78
Median 2.53 7.85 14.42 1.84 2.72
21st Century Fox Revenue EBITDA Earnings Revenue Assets
30,575 6,867 4,894 30,575 21,924
Enterprise Value 85,793 58,411
Net Debt 12,168 12,168
Equity Value 73,625 46,243 65,861 59,438 82,785
#Share 1,370 1,370 1,370 1,370 1,370
Price per Share 53.74 33.75 48.07 43.39 60.43
Source: Thomson Reuters Eikon (2019)
The real equity value of Fox is $63.34 billion as of September 30, 2018. Implementing the multiples
valuation, the market value of 21st Century Fox ranges between $46.23billion and $82.79 billion.
Thus, the EV/Revenue, P/E and P/B market multiples seem to overestimate Fox’s company value
while the others underestimate the company value regarding the market value in relation to the real
market value.

52
6.2.3 Summary of Valuation
The graph below is providing a summary of the valuation chapter. It can be seen that both
approaches contain the real value (30/09/18) of Fox. Furthermore, both approaches also include
the $71.3 billion price for which Disney bought Fox. Nevertheless, the $71.3 billion are not related
to the entire company, as Disney had to divest several businesses. Thus, it does not represent 100%
of Fox’s value. This means that the value calculated by Disney is likely to be higher than the one
calculated above. Therefore, it can be assumed that Disney had a more optimistic projection
regarding revenue growth and the long-term growth rate. In addition, Disney could have calculated
a lower cost of debt and cost of equity or simply assumed a different capital structure.
Table 12 Summary of Fox Valuation
Arriving at the precise value is difficult and there is a possibility that the estimate is not precise.
However, the valuation still provides valuable information regarding the rationale of the
transaction. Disney could have assumed that Fox will outperform the US economy but could also
have weighed the value of its intellectual property more heavily. The latter is more likely, given
the strategic reason for the transaction. This is supported by the terminated licensing contract with
Netflix. Disney loses now over $300 million in affiliate fees annually, but it bet on high-profit
forecasts for its DTC service. Hence, it becomes clear that the transaction was valued with a long-
58,871
46,243
79,62882,785
$30,000
$40,000
$50,000
$60,000
$70,000
$80,000
$90,000
$100,000
DCF Market Multiples

53
term perspective. A few years might pass until significant revenue is generated with the Fox’s IP,
but eventually, it will be profitable.
7 Impact on the Media and Entertainment Industry
There is no doubt that the mega-merger of The Walt Disney Company and 21st Century Fox will
have a large impact on the industry. Not only will this merger alone radically change the structure
of the industry, but also other mega-mergers like the AT&T-Time Warner and Comcast-Sky
transaction. Due to the changing industry landscape, the rationale for the deals has one common
theme: enhancing the competition against the four digital horsemen in the battle for viewers. Thus,
arising from these deals are media colossuses that will dominate the market. It is known that
monopolies can have disadvantages for a market, such as restricting choice or higher prices.
Consequently, it is likely that supercompetitors create ripple effects that influence the entire
ecosystem they inhabit. The following paragraphs will further explore these potential impacts.
7.1 Market Structure
Disney is the closest to build a dynasty. Consolidating both companies, Disney will hold 40% of
the North American box office market share. Moreover, it also adds several TV channels and
intellectual property to its portfolio, which threatens smaller companies in the industry. These
companies could be forced to merge in order to take on the fight with The Walt Disney Company.
Resulting is a concentrated market dominated by a handful of large companies. Smaller studios
like Lionsgate, are already struggling to maintain their market share (Faughnder, 2019), since the
major studios control the release schedule. With the combined entity, Disney will ensure that major
movies will not interfere each other’s release, as it allows generating the most money. Thus, small
studios will struggle to find a free slot that is not in between movies of the merged powerhouse.
Nonetheless, while smaller companies are pressured with the need to add scale in order to compete,
the industry is likely to experience a decrease in large-scale M&A activities for the next two years.
The industry first needs to digest the three mega-mergers of the past and at the same time, the
companies need to integrate the businesses. Thus, the companies will need to execute their
strategies in 2019. These integrations and executions take time and there is no certainty that the

54
deals will have a positive effect, as the success depends on the ability to adapt to the evolving
media ecosystem (Standard & Poor's, 2018). If Disney fails to do so, other large companies might
be anxious about conducting large-scale transactions. Moreover, after the Disney-Fox
consolidation, there is no more M&A option available, except for the CBS and Viacom merger,
which could occur in the next year. However, there is a possibility that the industry could
experience a new shift in consolidation. Large technology companies might acquire media
companies to establish their business in the market.
7.2 Work Force
Nevertheless, the employees are the first to be affected by the deal. Recalling the literature review,
an advantage of M&A is synergies, especially cost synergies through economies of scale. This
applies to this transaction, as both companies operate in the same segment, making it a horizontal
merger. Thus, there are many duplicated positions, including administration and sales. Fox’s
animation studio, Blue Sky Studios, serves as an example. The studio that produced Ice Age, is
now the third animation studios under Disney’s umbrella. Therefore, it is not certain if Disney will
keep, sell or dissolve the studio. The Walt Disney Company (2019a), did not disclose any number
for layoffs, however, it expects to have $2 billion in cost synergies by 2021. Increased efficiency
through the consolidation of businesses will achieve savings. Consequently, analysts expect more
than 3,000 pink slips (James, 2019). This business decision has a human cost, as thousand
employees are about to be unemployed. It is intensified by the fact that there is now one less studio
available to work at. Moreover, a monopoly can also have an impact on wages and labor rights.
Disney was already involved in a wage-fixing scheme to keep wages for animators low (KCC,
2018). With less competition, Disney and other companies could exploit employees.
7.3 Distributors
Another party, which the deal can affect, are the distributors of Disney’s content – the theaters. In
comparison to most studios, Disney demands a larger cut of ticket sales and has stricter rules for
theaters. According to Schwartzel (2017), the company demanded to receive 65% of Star Wars:

55
The Last Jedi’s domestic sale, which normally varies between 50% and 60%. He mentions further,
that Disney also demanded to show the film for at least five weeks and on the biggest screen
available. The ones who did not comply with Disney’s demand would receive a 5% penalty and
risk to lose the access to the movie (Schwartzel, 2017). For smaller studios, it is an unsustainable
model, as they only have a few screens. As a result, many theaters did not show the movie (Young
A. , 2017). Another example is the Pixar movie Coco. Many Brazilian theaters boycotted the movie
after Disney demanded a high revenue cut, similar to Star Wars: The Last Jedi case (Sabbaga,
2017). Due to the merger, Disney now owns a larger portion of the market, which threatens theaters.
If there are no alternatives available, then they do not have any possibility except for complying
with Disney’s demands. Thus, smaller theaters might need to adapt to the strategy of larger theater
chains, which understood to make money off concessions (food and high-end cinemas) (Udland,
2015). In a podcast, Bhargava (2018) said that Disney could even consider showing the movies in
their own theaters, an option that Netflix is also considering. Even though the law currently
prevents it, it is an area to track, according to him.
7.4 Content variety
In addition, consumers will also be affected. Increased prices, due to Disney’s demands for theaters,
and limited content variety are two possible effects. Some see the latter negative, whereas others
will be excited. Most enthusiastic reporting of the Disney-Fox deal has been focused on the reunion
of Marvel properties. However, the market is threatened with oversaturation, since the studio is
already releasing three Marvel movies and other sequels per year. Furthermore, Disney is also not
known for their content variety, especially when it built a large brand awareness without releasing
R-rated movies. Mentioned in an earlier chapter (recall Chapter 5.1.4), the company produces
rather big-budget movies based on franchises. This will not change in the short-term since Disney
now acquired more franchises (Alien, Avatar). Furthermore, creators might feel the impact as well.
Creative freedom could be limited, as the storytelling needs to fit with Disney’s brand.
Additionally, there is now one less studio to make movies at or work for, but also one less studio
where independent films could be produced. Nonetheless, this fact could be an opportunity for
other studios like Paramount and Colombia Pictures. Even though these companies have their own
big-budget franchises, a smart move could be to re-focus on mid-sized projects as Netflix does.

56
There is much to gain from these productions, especially when Disney dominates the big-budget
market. It could create possibilities for new talents and maybe even open a new customer trend.
7.5 OTT Market Fragmentation
The Disney-Fox deal and other mega-mergers have a further impact on the consumer. Due to the
fact, that these companies now control a great portion of the market, potential changes arise in
where and how the consumers watch their content. Traditionally, the creators and distributors co-
existed in equilibrium. The TV and film studios produced the content and received licensing fee
by distributors like ABC, or nowadays Netflix, in return for the right to broadcast the content.
However, this relationship is collapsing. The mega-mergers like AT&T-Time Warner and other
content creators start to offer their own direct-to-consumer streaming platform. Thus, in
comparison to the film and TV market, that becomes more concentrated, the OTT market, and
especially the VOD market, becomes more fragmented. The content creators want to directly
interact with customers and receive a cut of the increasing market. According to Hovenkamp
(2018), companies that produce original content will corner their content and will be unwilling to
share it with competitors. This strategy might be because one of the consumers’ prime reason for
choosing a streaming provider is access: to see the content they are unable elsewhere. In a study
by Deloitte (2019), 57 percent of paid streaming video users picked “access to original content” as
subscription reason. Millennials scored even higher with 71 percent, per the study. Thus, to attract
customers the companies keep the content exclusive. However, as soon as the content creators also
own distribution platforms, consumers may need to subscribe with several platforms just to receive
the content they want. If a consumer wants to see Game of Thrones, he needs an HBO subscription.
One is a Stranger Things fan? One needs Netflix. You want to see Marvel? You have to go to
Disney+. Overall, it means that consumers need to establish numerous accounts and payment
methods, which is an attribute of fragmentation. However, as customers become more experienced
with SVOD, they realize that the solution is to create their own content bundle. In the United States,
an average consumer subscribes to three SVOD platforms (Deloitte, 2019). This phenomenon is
not only a US specific one, as Appendix 6 shows. In Germany, 66% of the people who purchased
VOD service, subscribed to Amazon, while 47% to Netflix. These numbers are similar to Spain,
except that Netflix was preferred over Amazon.

57
Nevertheless, the growing fragmentation of the market causes lethargy. Per Deloitte (2019), 47%
of the consumers in the U.S. are frustrated by the increasing amount of VOD platforms they are
required to subscribe in order to watch what they want. This is a crucial information. It shows that
consumers are unhappy about the development as it is exactly the opposite of what they were
promised. They cut the cords for a single-streaming platform (Netflix, Amazon) but are now
required to use multiple. Having multiple services opens up another problem that intensifies
consumer frustrations. Discovering content and navigating on the website becomes increasingly
inconvenient for consumers. Forty-eight percent of the consumers surveyed by Deloitte (2019) find
it difficult to find the desired content across multiple services. One might not remember on which
platform his favorite show is available. Moreover, choice overload is another problem. The study
shows that nearly half (49%) of the consumers have trouble to choose what to watch since the
immense quantity of content makes it difficult to identify which content is good. Thus, the choice
overload overwhelms the consumer, which causes 43% of the consumers to stop the search if they
did not find something satisfying, according to the study. However, luckily there is a solution for
consumers. Comcast and Apple are entering the market, not as a purely content creator but as
aggregators, namely one-stop-shop. These platforms allow users to add on SVOD services to one
platform. Making all content from different services searchable and reducing the friction of
multiple-platform-subscriptions. Strangely, this feels a lot like a déjà vu. Aggregating different
content providers in one platform and the proposed Disney bundle (Disney+, ESPN+, Hulu) seems
similar to the satellite and cable packages from fifteen years ago. Thus, one might say that the OTT
fragmentation, caused by the entrance of media mega-mergers, transforms the streaming world into
an advanced TV, namely “TV 2.0”.
7.6 Competition
After understanding the impacts of the merger on the industry, a quick look will be taken at the
impacts on major competitors. Since Disney admittedly purchased 21CF in order to strengthen
their entrance in the video streaming market, the impacts on the market leader – Netflix – will be
analyzed.
Netflix rise to the top of the SVOD landscape was quick and supported by content-generating
companies like Disney and Fox. The company augmented its growth by licensing older content

58
from these companies. Today, Netflix has nearly 150 million subscribers worldwide and continues
to grow (Netflix, 2019a). It added 28.6 million subscribers in 2018 and in the first quarter of 2019
it reached a new quarterly record with 9.6 million paid net additions (Netflix, 2019a). However,
Netflix thrived so much that it started to challenges the ones, which supported its growth. Thus, the
new entrants want to gain some share of the pie that could affect Netflix’s business. Disney’s
content retrieval is already the first sign and is likely to create a snowball effect. WarnerMedia and
NBCUniversal are likely to retrieve their content as well. This could have stern consequences for
Netflix, considering a study by 7Park Data (2018), which showed that nearly two-thirds (63%) of
Netflix’s US stream were related to licensed content. Imagining that most of this content will be
gone, consumers will question their Netflix subscription. According to Deloitte (2019), few topics
frustrate consumers more than their favorite TV shows disappearing from the library. This could
explain why Netflix was motivated to pay $100 million to keep Friends for another year (Lee,
2018). Previously, it was mentioned that the company spent $12 billion on original content in 2018,
which resulted in 139 original TV shows. This sheer investment is not a reaction to the revealed
streaming overture of the new entrants, but more of an anticipation. Ted Sarandos, Netflix’s Chief
Content Officer, said that “there would come a day when the studios and networks may opt not to
license us content in favor of maybe creating their own services.” (Sarandos, 2019). Nonetheless,
investing such a large amount creates two problems. First, it could increase the licensed content
problem as content choice overload turn consumers back to the works they are most familiar with
(Schwartzel, 2019). Second, costs are increasing. Netflix intends to keep increasing its content
expenditures at the same pace (Netflix, 2019a). However, considering the revenue growth, costs
grow faster than revenues. Concurrently, the subscriber growth is stagnating. While Q1 2019 was
a record-breaking quarter, the company expects to add only 5 million subscribers in Q2 (Netflix,
2019a). Conceivably, the US market is the reason, not because people do not want to use Netflix,
but because they already have a Netflix subscription. In Q1 2019, 60 million had a paid membership
in the United States, making the market saturated (Netflix, 2019a). Therefore, in order to
compensate for the increasing costs and fewer subscriber additions, Netflix is increasing prices. It
increased the price in the United States by $1 to $2 depending on the subscription option. Other
countries, like Germany, experienced the same. The price increase opens a door for the new
entrants, not only because Netflix charges more for less content but also because the new entrants
charge less (Disney+ with 6.99/month). However, Netflix is not concerned about new

59
competitions. In fact, they embrace it and believe that it will have no impact on their business, due
to the different content offerings (Netflix, 2019a).
8 Conclusion
8.1 Summary of results
Identifying the rationale of The Walt Disney Company to acquire 21st Century Fox is a difficult
procedure because an M&A depends on many different factors. Thus, it is difficult to assess all.
The following section shortly summarizes the findings in regard of the developed sub and main
research question.
SQ1: What are the strategic drivers behind the acquisition?
Disney already setup its market entry in the online streaming market with its own direct-to-
consumer streaming service, Disney+. Once the acquisition opportunity came up, Disney identified
the opportunity to leverage Fox’s content library in order to increase the competitiveness of
Disney+. Concurrently, the company can build brand affinity through its new platform and cross-
monetize the Fox’s intellectual property. In addition, Disney is gaining the majority stake of Hulu,
the third largest streaming platform, thus controlling a part of the competition. Hulu is set to
complement Disney+ and therefore, reach Disney’s goal of higher revenues.
The reason provides arguments for an operational synergy factor, as presented in the literature
review. The transaction is used to support the entry into a new market. While in most cases an
established company is acquired to function as a stepping-stone, in the case of Disney, Fox is
acquired as additional support to increase the sale of the new product (Disney+). The content library
of Fox will be an extra incentive for consumers to subscribe to Disney+. Lastly, the cross-vertical
monetization of Fox can be attributed to higher growth in the existing market, since it will provide
additional revenue in all verticals of Disney. Interestingly, the most common factor for horizontal
M&A, economies of scale, does not play a major role in this transaction, since additional movie
making capabilities were not pivotal for the management (Iger, 2019).
SQ2: What are the financial drivers behind the acquisition?

60
The valuation showed that Disney predicts a favorable forecast for Fox and assumes that the
company will perform better than expected by the market. Another explanation for the willingness
to buy the company is the underlying value of the intellectual property. The company might have
valued the opportunity the IP provides higher than competitors might.
The second reason provides evidence for the necessity of valuation in an acquisition process as
stated by Damodaran (2002). Precise projections are important to estimate the company’s value
and to decide whether to proceed with the transaction and if so, at what costs. Failure to make a
correct estimate can lead to a defeat in the bidding war or to an overpriced premium. Moreover, it
shows the linkage of all areas (finance, strategy, culture, etc.) in such a transaction and the
importance to consider all.
SQ3: What are the impacts on the media & entertainment industry by the transaction?
Lastly, the transaction provides Disney with an increased market share in the traditional market. It
now owns a vast amount of TV channels and 40% of the North American box office. The increased
market share gives Disney greater bargaining power against players in the value chain. It can now
set terms, to which other companies need to comply if they want to maintain in business. Resulting
are higher revenues and a nearly unstoppable growing media powerhouse.
This reason relates to the greater pricing power mentioned in the literature review. 21st Century
Fox was a direct competitor to Disney, thus, the competition diminished and Disney gained the
market share of the acquired company. This makes Disney a strong competitor in the industry and
can now utilize its market power to increase its margin by raising prices. Ultimately, the company
will earn more income. In addition, the market power provides the company with a financial
synergy, since it increased in size and assets. The main assets will be the intellectual property that
gives the company more predictability for future cash flows. Thus, the risk is becoming less and
banks, but also investors might be willing to fund the company with more money.
MQ: Why is the Walt Disney Company acquiring its competitor 21st Century Fox?
The acquisition supports the Walt Disney Company to have a successful digital transformation.
The brands of Fox strengthen the competitiveness of Disney+ and thus, increasing the likelihood
that the company can have a significant footprint in the OTT market. Consequently, it increases
the dominance within the industry and ensures a long-term success.
61
8.2 Limitations
The study appears to have a few limitations worth to be mentioned. The analysis of the industry
was based on secondary sources that are not able to cover all aspects of the industry. Hence, the
insight is limited and valuable data might be omitted. Some data might only companies within the
industry know while the company itself might only know a few data. For example, the number of
subscribers to Amazon Prime Video is likely to be known only by Amazon itself. Thus, covering
all aspects of the industry might not even be possible to a large conglomerate with millions of
employees. Furthermore, the actual strategy of Disney is only known partially. The study only
covers the strategy that is known to the public, but other strategic factors might be the driving force
for the acquisition. This information is likely to be confidential to preserve a possible competitive
advantage. For example, the new Marvel phases four and five are not known yet but could have
been a driving force for the acquisition. Moreover, the features of the new Disney-branded
streaming platform are only communicated moderately, making it difficult to conduct assumptions.
Thus, arriving at the next point, the study shows the most limitations in its valuation of 21st Century
Fox. The study used only two methods of many to value the company, due to limited time.
Additionally, it had to make assumptions based on incomplete data. As mentioned, strategic insight
but also financial insight like due diligence are missing. However, in the real world, a large and
diverse team with decades of experience conduct valuations. Lawyers, investment bankers, and
researchers are involved to estimate the value. Therefore, it is difficult to replicate the valuation by
a single person with limited information available. Nevertheless, performing the valuation still
provides insight into the transaction as it indicates which factors Disney altered to derive to their
estimate.
Reflecting on the outcomes and the limitations, the author would have used two more valuation
techniques to broaden the spectrum of valuation. In addition, the value of the intellectual property
should have been emphasized, since it plays a large factor in the transaction. Therefore, an
estimation of its value would have been beneficial.
62
8.3 Recommendation for Further Research
The study opened the door for the scientific community and practitioners to investigate new
thematic areas of research. Based on the development in the media and entertainment industry, it
can be interesting to investigate the impact of direct-to-consumer business models on other
industries. It seems that utilizing this model will be the future for most industries and therefore
vital information to know. The car manufacturer, the hospitality and the wholesale industry all are
transforming or already transformed into a direct-to-consumer model. Thus, future scientists and
practitioners need to be taught on how to leverage the model to monetize products and services.
Furthermore, since the M&E industry is already transforming, it can be insightful to research the
transformation and its impact on the industry. Due to the entrance of many new direct-to-consumer
services, the OTT market becomes more fragmented, meaning that competition is increasing but
also more choices are generated for the consumer. However, as stated, this creates a problem for
consumers as they need to subscribe to multiple services. Therefore, it needs to be investigated on
how to mitigate the fragmentation for consumers. Bundling several services might be a solution
but it is not certain that it is the best solution for the consumer. Moreover, Disney+ provides a
further investigation opportunity. Disney made a large bet on its new service, as it drops millions
of licensing revenue by launching its own product. Therefore, the company expects that it will
generate enough revenue to compensate for the terminated contract with Netflix. Hence, it needs
to be analyzed if it was the right decision for the company and its shareholders since it is required
to succeed. In addition, the effects on Netflix are worth looking into it. Netflix is likely to be
affected by the entrance of the new competitors the most, as it has one fundamental revenue stream:
subscription. Other competitors like Apple and Amazon have a more diversified portfolio, thus,
they are able to compensate a loss in one business segment. However, Netflix solely relies on its
subscription, which is a dangerous gamble. Another suggestion is to research the value of
intellectual property in the industry. Two of the industry’s most valuable assets are trademarks and
film rights. However, their value does not seem to represent the money they generate. Disney
bought Lucasfilm for around $4 billion that included movie making capabilities and tangible assets.
However, after only four movies, Disney already earned more money than they spent on the
acquisition. Surely, costs need to be deducted, but it shows that the IP is not a vital factor when it
comes to valuing a company. Therefore, it can also be interesting to investigate the weight of an IP

63
in company valuations. Going forward, since IPs lead quite likely to franchises, the future
consumer preferences in the entertainment industry can offer another research opportunity. Will
consumers be satisfied with franchises and sequels or will the time come when the market is
saturated and demand increases for new stories?

64
Appendix
Appendix 1
Appendix 1 Global Theatrical & Home Entertainment Consumer Spending (in Billion)
Source: MPAA, 2019
Appendix 2 U.S. Theatrical & Home Entertainment Revenue (in Billion)
Source: MPAA, 2019
$25.1 $20.4 $17.9 $15.3 $13.1
$15.8$18.7 $25.1 $32.9
$42.6
$36.4 $38.4$38.8
$40.5
$41.1
$0
$10
$20
$30
$40
$50
$60
$70
$80
$90
$100
2014 2015 2016 2017 2018
Physical Home Entertainment Digital Home Entertainment Theatrical
$10.3 $9.1 $8.0 $6.8 $5.8
$7.9 $9.0 $11.4 $14.1 $17.5
$10.4 $11.1$11.4
$11.1
$11.9$28.6 $29.2
$30.8$32.0
$35.2
$0
$5
$10
$15
$20
$25
$30
$35
$40
2014 2015 2016 2017 2018
Physical Home Entertainment Digital Home Entertainment Theatrical

65
Appendix 3 Global Box Office in Billions (2014-2018)
Source: MPAA, 2019
Appendix 4 Global OTT TV & video revenue (in billion)
Source: Year 2014: Digital TV Research (2015)
Year 2015: Digital TV Research (2016) Year
2016: Digital TV Research (2017)
Year 2017-2023: Digital TV Research (2018a)
10.4 11.1 11.4 11.1 11.9
26
(72%)
27.3
(71%)
27.4
(71%)
29.4
(73%)
29.2
(71%)
$36.4$38.4 $38.8
$40.5 $41.1
$0
$5
$10
$15
$20
$25
$30
$35
$40
$45
2014 2015 2016 2017 2018
U.S./Canada International
$21.0
$29.4$37.0
$53.3
$68.7
$129.3
$0
$20
$40
$60
$80
$100
$120
$140
2014 2015 2016 2017 2018 2023
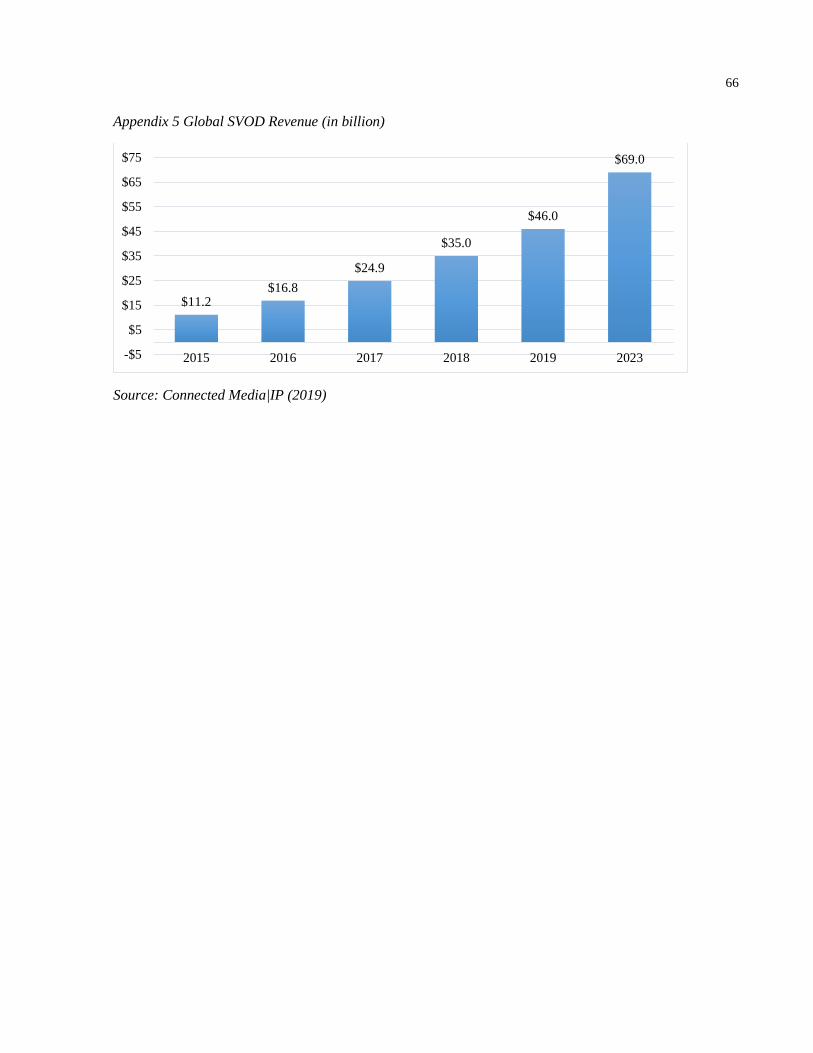
66
Appendix 5 Global SVOD Revenue (in billion)
Source: Connected Media|IP (2019)
$11.2$16.8
$24.9
$35.0
$46.0
$69.0
-$5
$5
$15
$25
$35
$45
$55
$65
$75
2015 2016 2017 2018 2019 2023

67
Appendix 6 Online purchase of Video-on-Demand by provider in the past 12 months
Source: Statista (2018)
30%
31%
35%
56%
75%
Google Play
HBO GO
Hulu
Amazon
Netflix
USA
16%
22%
34%
51%
65%
Baofeng
Mago TV
Youku
QQ Video
Iqiyi
China
9%
12%
15%
47%
66%
Google Play
Maxdome
Sky Go
Netflix
Amazon
Germany
22%
22%
23%
23%
55%
Google Play
other
iTunes
Sky Go
Amazon
United Kingdom
14%
23%
23%
24%
51%
Orange
Google Play
Canal Play
Amazon
Netflix
France
21%
23%
30%
40%
64%
Google Play
Moviestar+
HBO España
Amazon
Netflix
Spain

68
Appendix 7 Number of new digital original series released by year
Source: Parrot Analytics (2019)

69
Appendix 8 Percentage of Netflix Originals per genre
Source: (Netflix, 2019b)
Action
11%
Children
11%
Comedy
24%
Documentary
7%
Drama
31%
Horror
7% Other
9%

70
Appendix 9 Historical Income Statement of Fox
Historical (Actual)
$ million 2014 2015 2016 2017 2018
Total Revenue 31,867 28,987 27,326 28,500 30,400
growth (%) 15.15% -9.04% -5.73% 4.30% 6.67%
Cable Network Programming 12,273 13,773 15,029 16,130 17,946
growth (%) 12.79% 12.22% 9.12% 7.33% 11.26%
Television 5,296 4,895 5,105 5,649 5,162
growth (%) 8.97% -7.57% 4.29% 10.66% -8.62%
Filmed Entertainment 9,679 9,525 8,505 8,235 8,747
growth (%) 12.00% -1.59% -10.71% -3.17% 6.22%
Direct Broadcast Satellite Television 6,030 2,112 - - -
growth (%) 0 (1) - - -
Other, Corporate and Eliminations (1,411) (1,318) (1,313) (1,514) (1,455)
growth (%) 23.02% -6.59% -0.38% 15.31% -3.90%
Operating cost (25,237) (22,345) (20,804) (21,392) (23,437)
% revenue 79.19% 77.09% 76.13% 75.06% 77.10%
Cost of goods sold (21,108) (18,561) (17,419) (18,094) (19,769)
% revenue 66.24% 64.03% 63.75% 63.49% 65.03%
Selling, general and administrative (4,129) (3,784) (3,385) (3,298) (3,668)
% revenue 12.96% 13.05% 12.39% 11.57% 12.07%
EBITDA 6,630 6,642 6,522 7,108 6,963
Depreciation & Amortization (1,142) (736) (530) (553) (584)
% revenue 3.58% 2.54% 1.94% 1.94% 1.92%
EBIT 5,488 5,906 5,992 6,555 6,379
% change 2.10% 7.62% 1.46% 9.40% -2.68%
Interest Income 26 39 38 36 39
% change -54.39% 50.00% -2.56% -5.26% 8.33%
Interest Expense (1,121) (1,198) (1,184) (1,219) (1,248)
% change 0 0 (0) 0 0
Other 796 5,100 (369) (368) (688)
EBT excluding Unusual Items 5,189 9,847 4,477 5,004 4,482
Impairment and restructuring 0 0 (323) (315) (72)
EBT 5,189 9,847 4,154 4,689 4,410
Tax Provision (1,272) (1,243) (1,130) (1,419) 364
Tax rate & 24.51% 12.62% 27.20% 30.26% -8.25%
Net income continuing operations 3,917 8,604 3,024 3,270 4,774
Extraordinary Items 729 (67) (8) (44) (12)
Minority Interest in Earnings (132) (231) (261) (274) (298)
Net income 4,514 8,306 2,755 2,952 4,464
% change -36.40% 84.01% -66.83% 7.15% 51.22%
Source: The Walt Disney Company (2018d) & The Walt Disney Company (2015)
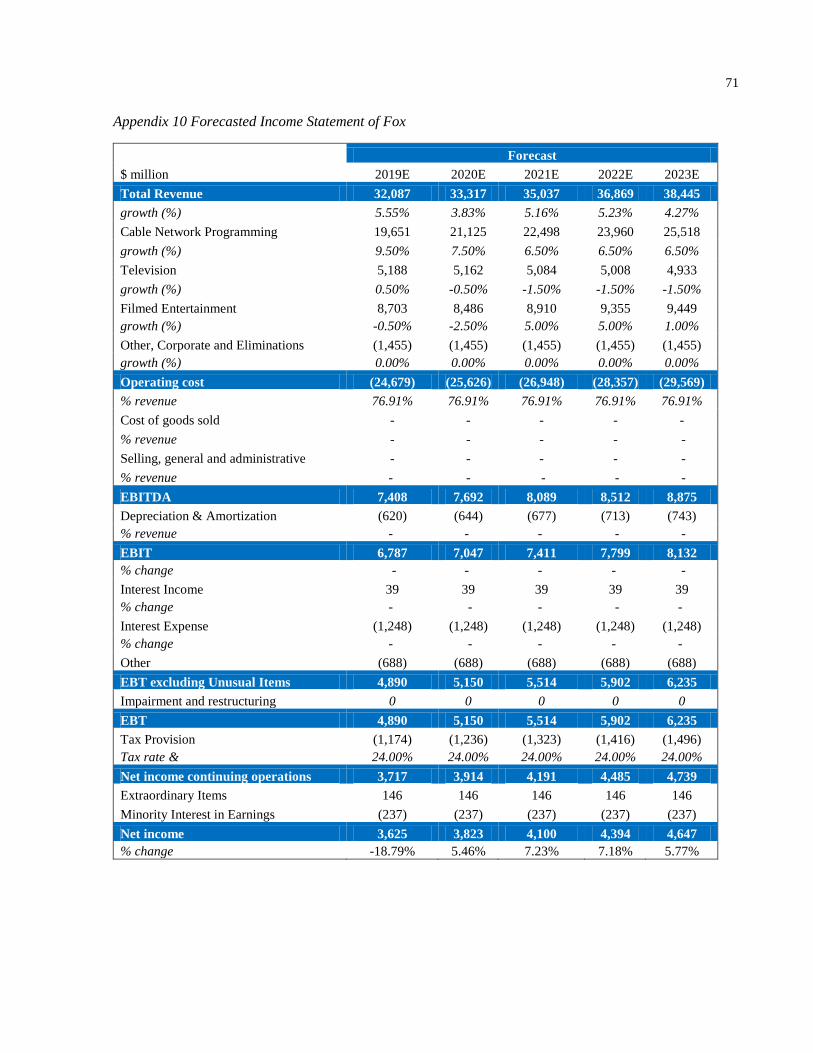
71
Appendix 10 Forecasted Income Statement of Fox
Forecast
$ million 2019E 2020E 2021E 2022E 2023E
Total Revenue 32,087 33,317 35,037 36,869 38,445
growth (%) 5.55% 3.83% 5.16% 5.23% 4.27%
Cable Network Programming 19,651 21,125 22,498 23,960 25,518
growth (%) 9.50% 7.50% 6.50% 6.50% 6.50%
Television 5,188 5,162 5,084 5,008 4,933
growth (%) 0.50% -0.50% -1.50% -1.50% -1.50%
Filmed Entertainment 8,703 8,486 8,910 9,355 9,449
growth (%) -0.50% -2.50% 5.00% 5.00% 1.00%
Other, Corporate and Eliminations (1,455) (1,455) (1,455) (1,455) (1,455)
growth (%) 0.00% 0.00% 0.00% 0.00% 0.00%
Operating cost (24,679) (25,626) (26,948) (28,357) (29,569)
% revenue 76.91% 76.91% 76.91% 76.91% 76.91%
Cost of goods sold - - - - -
% revenue - - - - -
Selling, general and administrative - - - - -
% revenue - - - - -
EBITDA 7,408 7,692 8,089 8,512 8,875
Depreciation & Amortization (620) (644) (677) (713) (743)
% revenue - - - - -
EBIT 6,787 7,047 7,411 7,799 8,132
% change - - - - -
Interest Income 39 39 39 39 39
% change - - - - -
Interest Expense (1,248) (1,248) (1,248) (1,248) (1,248)
% change - - - - -
Other (688) (688) (688) (688) (688)
EBT excluding Unusual Items 4,890 5,150 5,514 5,902 6,235
Impairment and restructuring 0 0 0 0 0
EBT 4,890 5,150 5,514 5,902 6,235
Tax Provision (1,174) (1,236) (1,323) (1,416) (1,496)
Tax rate & 24.00% 24.00% 24.00% 24.00% 24.00%
Net income continuing operations 3,717 3,914 4,191 4,485 4,739
Extraordinary Items 146 146 146 146 146
Minority Interest in Earnings (237) (237) (237) (237) (237)
Net income 3,625 3,823 4,100 4,394 4,647
% change -18.79% 5.46% 7.23% 7.18% 5.77%

72
Appendix 11 Historical Balance Sheet of Fox
Balance Sheet (in millions) 2014 2015 2016 2017 2018
ASSETS
Cash and Cash Equivalents 5,415 8,428 4,424 6,163 7,622
Receivables 6,468 5,912 6,258 6,625 7,120
Inventories 3,092 2,749 3,291 3,101 3,669
Other 401 259 976 545 922
CURRENT ASSETS 15,376 17,348 14,949 16,434 19,333
Receivables 454 394 389 543 724
Investments 2,859 4,529 3,863 3,902 4,112
Inventories 6,442 6,411 7,041 7,452 7,518
Property, Plant and Equipment 2,931 1,722 1,692 1,781 1,956
Intangible Assets 8,072 6,320 6,777 6,574 6,101
Goodwill 18,052 12,513 12,733 12,792 12,768
Other Non-Current Assets 607 802 921 1,394 1,319
NON-CURRENT ASSETS 39,417 32,691 33,416 34,438 34,498
TOTAL ASSETS 54,793 50,039 48,365 50,872 53,831
LIABILITIES AND EQUITY
Short-Term Borrowings 799 244 427 457 1,054
Accounts Payable 4,183 3,717 3,181 3,451 3,248
Deferred Revenue 690 448 505 728 826
Other Current Liabilities 3,184 2,633 2,955 2,750 3,116
CURRENT LIABILITIES 8,856 7,042 7,068 7,386 8,244
Long-Term Debt 18,259 18,795 19,298 19,456 18,469
Deferred Tax 2,729 2,290 2,888 2,782 1,892
Other Non-Current Liabilities 4,048 3,726 4,230 4,310 4,428
TOTAL LIABILITIES 33,892 31,853 33,484 33,934 33,033
Common Stock 22 20 19 19 19
Retained Earnings 2,389 5,343 3,575 5,315 8,934
Accumulated Other Comprehensive
Loss -34 -1,570 -2,144 -2,018 -2,001
Additional Paid-In Capital 15,041 13,427 12,211 12,406 12,612
TOTAL STOCKHOLDERS
EQUITY 17,418 17,220 13,661 15,722 19,564
Minority Interest 3,483 966 1,220 1,216 1,234
TOTAL EQUITY 20,901 18,186 14,881 16,938 20,798
TOAL LIABILITIES AND
EQUITY 54,793 50,039 48,365 50,872 53,831
Source: The Walt Disney Company (2018d) & The Walt Disney Company (2015)

73
Appendix 12 Forecasted Change in Working Capital of Fox (2019-2023)
$ million 2018 AVG % 2019E 2020E 2021E 2022E 2023E
Revenue 30,400 32,087 33,317 35,037 36,869 38,445
Accounts Receivable 7,120
Inventory 3,669
Other 922
Total Current Assets 11,711 11,237 11,668 12,271 12,912 13,464
% revenue 38.5% 35.02% 35.02% 35.02% 35.02% 35.02% 35.02%
Accounts Payable 3,248
Deferred Revenue 826
Other Current Liabilities 3,116
Total Current Liabilities 7,190 7,765 8,063 8,479 8,922 9,304
% revenue 23.65% 24.20% 24.20% 24.20% 24.20% 24.20% 24.20%
Non-cash Working Capital 4,521 3,472 3,605 3,792 3,990 4,160
%revenue 14.87% 10.82% 10.82% 10.82% 10.82% 10.82% 10.82%
Change in WC 1,179 -1,049 133 186 198 171
Appendix 13 Ratings, Interest Coverage Ratios and Default Spread
For developed market firms with market cap > $5 billion
If interest coverage ratio is
> ≤ to Rating is Spread is
-100000 0.199999 D2/D 19.38%
0.2 0.649999 C2/C 14.54%
0.65 0.799999 Ca2/CC 11.08%
0.8 1.249999 Caa/CCC 9.00%
1.25 1.499999 B3/B- 6.60%
1.5 1.749999 B2/B 5.40%
1.75 1.999999 B1/B+ 4.50%
2 2.2499999 Ba2/BB 3.60%
2.25 2.49999 Ba1/BB+ 3.00%
2.5 2.999999 Baa2/BBB 2.00%
3 4.249999 A3/A- 1.56%
4.25 5.499999 A2/A 1.38%
5.5 6.499999 A1/A+ 1.25%
6.5 8.499999 Aa2/AA 1.00%
8.50 100000 Aaa/AAA 0.75%
Source: Damodaran (2019)

74
Appendix 14 Interview with Oliver Hüttmann – April 4 2019
What is your profession?
I am an independent journalist and film critic.
What do you think are the strategic reasons for Disney to buy Fox?
Well, Fox was offered for sell. Rupert Murdoch wanted to sell the company and only keep the TV
and News division in the new company which is called “New Fox”. We also need to consider the
recent trends. Currently, the number of people who go to the cinema is decreasing drastically. This
is caused by two factors. First, the better and greater service of streaming portals and by the
increasing prices of cinema tickets. We see the highest decrease in the United States which is not
the most important country for cinemas anymore. Nowadays, many movies generated more money
in box offices abroad than in comparison to the US. China is a country which gains more
importance in box office sales and will soon overtake US as number one. At the same time, the
physical sale, such as DVD and BlueRay is decreasing, but also TV. It is much easier to reach the
customers with streaming. You only need an App or website to reach them. You don’t need a local
pay TV channel anymore. Therefore, the distribution became much easier today.
Another reason is that Disney is buying brands. If you look in the past, they bought Marvel
Entertainment, Lucasfilm and now Fox. These are big brands that guarantee success with names
like The Simpsons and X-Men. With these brands, Disney continues to produce Blockbuster
movies, like Avengers, for the Event Cinema. These are movies that have a budget of 200 – 400
million and are made for today’s cinema. This deal also includes major franchises like Avatar
which announced four more movies in the near future. Avatar 2 is going to be a success and maybe
even break the record for most sold tickets, due to the brand name alone.
A few years in the 90s, the cinema was dominated by “arthouse movies” that had a budget of 40-
60 million and were mostly dramas and thrillers. However, these movies do not exist in the cinema
anymore and that is where Netflix picks up. Netflix is hiring all the old stars, such as Sandra
Bullock, and make movies like Birdbox and Triple Frontier. Triple Frontier was probably a movie
that would have been in the cinema in 2000, but not anymore. The names of the actors alone create
the success of the movies, but the movies of Netflix are also becoming better. You just need to look
at Roma this year which one many Oscars. Netflix also invested a lot in Roma’s marketing to
promote it as best picture but it did not help.
In the future, Netflix will invest more in Originals, meaning movies produced by them, since all
major studios are taking there movies and TV shows from Netflix. You can see the vast amount
Netflix is producing nowadays. It feels like Netflix is releasing every week a new TV shows, which
makes it difficult to keep up. It’s even impossible to watch all of them. Also the Marvel TV shows,
like Daredevil, Jessica Jones and Luke Cage are being extracted from Netflix or not continued to
be produced.

75
Why is Disney having so much success at the moment, while other studios don’t? Or why is
Marvel so successful and DC not?
You have to consider the past. Looking back we know that Disney was struggling as well and was
about the be overtaken by Apple. In 2003 the company was even close to bankruptcy. Mainly
because of Pixar. Even though Disney was profiting from Pixar, Pixar caused Diseny more harm,
since it destroyed the success of cartoons. Animated movies became more popular, so that it
disrupted the industry, exactly the same what Netflix did. Disney also survived because of the
changing consumer trend which was in faith for Marvel movies. In the 90s, the movies that
dominated the cinemas were all about action heroes, like Bruce Willis in Die Hard. However, these
types of movies are not released to cinema anymore. The new trend focuses on Fantasy genre,
which started with The Lord of the Rings and Harry Potter. I also have to say that I personally like
the Marvel movies, since they have a great story and perfect cast. At the moment, it is the best what
you can find in the cinema. It all started in 2008 with Iron Man. Even though, back then, no one
knew Iron Man. Everyone only knew Spider-Man, Batman and Superman. Because they have been
cited multiple times throughout time and also movies were made. A few Superman movies were
filmed in the 70s, Batman in the 80s and Spider-Man in 2003. These characters were an important
part of the pop culture. Therefore, it doesn’t matter if you are 30, 40, or 50, everyone knows them.
That’s why they are so popular at the moment.
But why are Marvel movies successful and DC’s not?
DC is just not as smart as Marvel. Most of the movies are bad, dark and serious. It does not mean
that all the movies need to be funny, but the movies directed by Zack Snyder were just bad. Batman
vs. Superman for example, was really bad story and the special effects did not look nice. Only the
Batman triology of Christopher Nolan were amazing. What he created there was something special.
But, they do not count to the new DC Universe. However, I have to admit that also the for the DC
Universe are getting better. Wonder Woman had a huge success and Aquaman was a big success
at the box offices. The new movie Shazam, is probably going to be something for families with
teenage drama.
So, what do you think the future will look like?
The future clearly lies in streaming. Every major film studio is building its own streaming service
now. Warner Bros, Apple and of course Disney. It is a response to the changing customer trend.
Many customers do not want to wait 4 years for a movie until it is finally shown in Pay TV or Free
TV. In comparison, a movie might be available after 6 to 9 months on a streaming platform. The
streaming market is also a large and growing market which shows high potential. Every company
wants to have share of this market. That’s why in the future a normal customer probably will have
a subscription at every streaming service. Netflix, Amazon, Disney, Apple, etc. This will also be
much cheaper than buying tickets for the cinema or pay for TV. Another trend will be TV shows.

76
It is likely that more and more TV shows will be produced that are based on an already established
brand. So maybe, there will be a TV shows about Die Hard one day. However, Apple and Disney
are already late in building their streaming platform. It is already 2019 and Netflix started in 2013.
Therefore, they clearly have an advantage. However, I have to be honest, at the beginning everyone
laughed at Netflix because they thought it won’t work. Even my colleagues and I were laughing
but I also realized from my own personal life that I changed my movie habit. I barely watch TV
anymore and mostly watch Netflix. All the studios and cinema owners say that Netflix is destroying
the cinema, but it’s not true. In fact, Netflix actually is helping the cinema, since they take away
the low budget movies and drives up the quality of content of the major film studios, since they
need to step up their game to compete. So, Netflix helps to make the movies better and therefore
attract more viewers. As I just mentioned, Apple announced its own streaming service a few weeks
ago. Apple TV+ it is called. They already announced eleven production of which five are movies
and six are TV shows. We do not know yet how much it will cost but maybe it is even free for
customers that own an Apple product. This will provide the customers with an additional value.
Do you think Disney+ will be a success?
With high probability, it’s going to be a success, since they have great content and the brand names
alone attract the customers. What exactly they will create, I don’t know yet. They only announced
one TV shows yet, which is going to be STAR WARS Andalorien. They probably going to release
the streaming service first in US and then internationalize is slowly as Netflix did it. They already
started to take out their content from Netflix and movies, which were released in 2019, like Captain
Marvel and Avengers: Endgame will be exclusive products for Disney+.
What will be the impact on the industry?
I only say to this: Size matters. It similar to the political situation. A small country like Italy can
not stand on its own anymore in the world. It is not a great nation anymore and it needs the EU the
matter something in the world. Also, it does not have the financial power anymore to do everything.
This is the same as in the industry. Not every studio can release or produce a movie that costs
between 200 and 400 million plus additional 200 million for marketing. That is 600 million. A
huge investment for a company that releases 5-10 movies like this per year. If the movie is going
to be flop, there is a high chance that the company could become bankrupt. Therefore, it is
important that the company, which produces the movie, is large with a large financial budget, so
that a failure will not run them into bankruptcy. For example, Solo a STAR WARS story was a
great failure in terms of earnings. It only generated 420 million. If Disney would not have been that
big, it would have had a large impact on the business. Therefore, acquiring Fox was a logical
consequence for Disney to drive their expansion and market leadership.

77
Bibliography
21st Century Fox. (2015). Annual Report 2015.
21st Century Fox. (2018). Annual Report 2018. Retrieved from https://www.21cf.com/wp-
content/uploads/2018/10/Final-21CF-Annual-Report-2018_Web-1.pdf
7Park Data. (2018, December 10). Netflix Original Series Viewing Climbs, but Licensed Content Remains
Majority of Total U.S. Streams. Retrieved April 24, 2019, from Variety:
https://variety.com/2018/digital/news/netflix-original-series-licensed-viewing-friends-the-office-
1203085230/
Adegoke, Y., & Levine, D. (2011, January 29). Comcast completes NBC Universal merger. Retrieved March
23, 2019, from Reuters: https://www.reuters.com/article/us-comcast-nbc/comcast-completes-
nbc-universal-merger-idUSTRE70S2WZ20110129
Apple. (2019, March 25). Apple unveils Apple TV+, the new home for the world’s most creative
storytellers. Retrieved April 19, 2019, from https://www.apple.com/newsroom/2019/03/apple-
unveils-apple-tv-plus-the-new-home-for-the-worlds-most-creative-storytellers/
AT&T. (2001). Form 8-K. U.S. Securities and Exchange Commission. Retrieved March 23, 2019, from
http://edgar.secdatabase.com/86/89882201501011/filing-main.htm
AT&T. (2018, June 15). AT&T Completes Acquisition of Time Warner Inc. Retrieved from
https://about.att.com/story/att_completes_acquisition_of_time_warner_inc.html
Baker, L., & Barbaglia, P. (2018, Junne 29). Global M&A hits historic high with media deal wave. Retrieved
April 27, 2019, from Reuters: https://uk.reuters.com/article/us-global-m-a-q2/global-ma-hits-
historic-high-with-media-deal-wave-idUKKBN1JO3CY
Barnes, B. (2018, December 16). Netflix’s Movie Blitz Takes Aim at Hollywood’s Heart. Retrieved May 3,
2019, from The New York Times:
https://www.nytimes.com/2018/12/16/business/media/netflix-movies-hollywood.html
Bartz, D., & Shepardson, D. (2018, June 27). U.S. gives Disney approval to buy Fox amid bidding war with
Comcast. Retrieved from Reuters: https://ca.reuters.com/article/idCAKBN1JN2C2-OCABS
Bezos, J. (2018, April 18). Shareholder Letter. Retrieved from
https://www.sec.gov/Archives/edgar/data/1018724/000119312518121161/d456916dex991.ht
m
Bhargava, H. (2018, July 10). The Disney-Fox Deal: Why It’s About Going Directly to the Consumer [Audio
podcast]. Retrieved April 22, 2019, from https://knowledge.wharton.upenn.edu/article/the-
impact-of-disney-fox/
Bowman, J. (2019, January 14). Why Twenty-First Century Fox Stock Jumped 39% Last Year. Retrieved
from NASDAY: https://www.nasdaq.com/article/why-twenty-first-century-fox-stock-jumped-39-
last-year-cm1081696

78
Box Office Mojo. (2019a). 2018 Worldwide Grosses. Retrieved March 7, 2019, from Box Office Mojo:
https://www.boxofficemojo.com/yearly/chart/?view2=worldwide&yr=2018&p=.htm
Box Office Mojo. (2019b). Box Office by Studio. Retrieved March 24, 2019, from Box Office Mojo:
https://www.boxofficemojo.com/studio/?view=parent&view2=yearly&yr=2018&debug=0&p=.ht
m
Box Office Mojo. (2019c). All Time Box Office. Retrieved April 19, 2019, from
https://www.boxofficemojo.com/alltime/world/
Braithwaite Communications. (2019, February 25). Why Netflix Spent $25 million on its Roma Oscars
Campaign. Retrieved May 3, 2019, from https://gobraithwaite.com/why-netflix-spent-25-
million-on-its-roma-oscars-campaign/
Broadband TV News. (2018, December 17). Global OTT revenue to overtake cinema in 2019. Retrieved
March 28, 2019, from Broadband TV News:
https://www.broadbandtvnews.com/2018/12/17/global-ott-revenue-to-overtake-cinema-in-
2019/
CBonds. (2018, September 26). S&P Global Ratings affirms 21st Century Fox America at "BBB+" (Local
Currency LT credit rating). Retrieved May 10, 2019, from http://cbonds.com/news/item/1043133
CBS Corporation. (2008, May 15). CBS Corporation to Acquire CNET Networks, Inc. Retrieved March 23,
2019, from
https://web.archive.org/web/20080518032023/http://www.cbscorporation.com/news/prdetails
.php?id=3263
CBS Corporation. (2019). CBS Corporation Reports 2018 Fourth Quarter And Full Year Results. Retrieved
May 4, 2019, from https://investors.cbscorporation.com/news-releases/news-release-
details/cbs-corporation-reports-2018-fourth-quarter-and-full-year
Comcast. (2018a, July 19). Comcast Corporation Statement on Twenty-First Century Fox [Press Release].
Philadelphia. Retrieved April 27, 2019, from https://www.cmcsa.com/static-files/1c3ad80a-
d137-4e81-ad33-34fc2229ebec
Comcast. (2018b, October 9). Unconditional as to Acceptances and Wholly Unconditional [Press Release].
Retrieved April 27, 2019, from https://www.cmcsa.com/static-files/9f10976f-3cc8-4166-8e18-
f89e5d506d80
Comcast. (2018c). Annual Report 2018. Retrieved May 4, 2019, from https://www.cmcsa.com/static-
files/54b28afa-2286-46bc-bca0-e35c9a4be739
Connected Media|IP. (2019, Januray 7). Global Subscription OTT Revenue Will Overtake Cinema 2019
Report. Retrieved March 7, 2019, from https://connectedmedia-ip.com/connected-media-
news/content/global-subscription-ott-revenue-will-overtake-cinema-2019-report
Copeland, T., Koller, T., & Murrin, J. (2000). Valuation: Measuring and Managing theValue of (3rd ed.).
New York: John Wiley & Sons .

79
Credit Suisse. (2018, July 10). 21st Century Fox (FOXA). Retrieved May 11, 2019, from
https://www.google.com/url?sa=t&rct=j&q=&esrc=s&source=web&cd=1&cad=rja&uact=8&ved=
2ahUKEwjWpJ3LjZLiAhVHJ1AKHUvjBLYQFjAAegQIBBAB&url=https%3A%2F%2Fresearch-
doc.credit-
suisse.com%2FdocView%3Flanguage%3DENG%26format%3DPDF%26sourceid%3Dem%26docum
ent_id%3D108
Damodaran Online. (2019, January 1). Equity Risk Premiums by Country. Retrieved May 5, 2019, from
https://www.google.com/url?sa=t&rct=j&q=&esrc=s&source=web&cd=6&cad=rja&uact=8&ved=
2ahUKEwiAycT38pHiAhUpNOwKHbwPBH8QFjAFegQIABAC&url=http%3A%2F%2Fpeople.stern.ny
u.edu%2Fadamodar%2Fpc%2Fdatasets%2Fctryprem.xls&usg=AOvVaw0cNOgtAEA0DuV6G_udp-
aT
Damodaran, A. (2002). Investment Valuation: Tools and Techniques for Determining the Value of Any
Asset (3rd ed.). John Wiley & Sons.
Damodaran, A. (2005). The Value of Synergy. Stern School of Business.
Damodaran, A. (2008). What is the riskfree rate? A Search for the Basic Building Block. Stern School of
Business,. Retrieved from
https://www.google.com/url?sa=t&rct=j&q=&esrc=s&source=web&cd=1&cad=rja&uact=8&ved=
2ahUKEwjsp4Sf3JTiAhUawAIHHe1fDe4QFjAAegQIAxAC&url=http%3A%2F%2Fpeople.stern.nyu.e
du%2Fadamodar%2Fpdfiles%2Fpapers%2Friskfreerate.pdf&usg=AOvVaw2x-KCyNVK0jANnyeK0-
Djv
Damodaran, A. (2011). Equity Risk Premiums (ERP): Determinants, Estimation and Implications – The
2011 Edition. Stern School of Business.
Damodaran, A. (2019, January). Ratings, Interest Coverage Ratios and Default Spread. Retrieved May 13,
2019, from NYU Stern:
http://pages.stern.nyu.edu/~adamodar/New_Home_Page/datafile/ratings.htm
Datahub. (2019, April). 10 year US Government Bond Yields (long-term interest rate). Retrieved from
https://datahub.io/core/bond-yields-us-10y
Deloitte. (2019). Digital media trends survey, 13th edition. Retrieved from
https://www2.deloitte.com/insights/us/en/industry/technology/digital-media-trends-
consumption-habits-
survey/summary.html?utm_source=Triggermail&utm_medium=email&utm_campaign=Post%20
Blast%20%28bii-digital-media%29:%20Sub%20fatigue%20presents%20hurdles%20fo
Digital TV Research. (2015, June 15). Netflix to help OTT revenues almost double in next five years.
Retrieved from https://www.digitaltveurope.com/2015/06/15/netflix-to-help-ott-revenues-
almost-double-in-next-five-years/
Digital TV Research. (2016, July 19). Global OTT revenues to reach US$64.8bn. Retrieved from
https://www.digitaltveurope.com/2016/07/19/global-ott-revenues-to-reach-us64-8bn/

80
Digital TV Research. (2017, October 2). Global OTT revenues to double between 2016 and 2022. Retrieved
from https://www.digitaltveurope.com/2017/10/02/global-ott-revenues-to-double-between-
2016-and-2022/
Digital TV Research. (2018a). Global OTT revenues to climb to $129 billion. Retrieved March 28, 2019,
from https://www.digitaltvresearch.com/ugc/press/246.pdf
Digital TV Research. (2018b). Global subscriptions to grow by 505 million. Retrieved March 28, 2019,
from https://www.digitaltvresearch.com/ugc/press/248.pdf
Disney Parks, Experiences and Products. (2019). About Us: Disney Parks, Experiences and Products.
Retrieved March 6, 2019, from Disney Parks, Experiences and Products:
https://dpep.disney.com/about-us/
eMarketer. (2019, July 24). Exodus from Pay TV Accelerates Despite OTT Partnerships. Retrieved March
26, 2019, from eMarketer: https://www.emarketer.com/content/exodus-from-pay-tv-
accelerates-despite-ott-partnerships
EY. (2014). The right combination: Managing integration for deal success. Ernst & Young Global Limited.
Faughnder, R. (2019, April 19). Lionsgate, the studio behind ‘Hunger Games’ movies, struggles in shifting
Hollywood currents. Retrieved April 22, 2019, from Los Angeles Times:
https://www.latimes.com/business/hollywood/la-fi-ct-lionsgate-struggles-20190419-story.html
Ficery, K., Herd, T., & Pursche, B. (2007). Where has all the synergy gone? The M&A puzzle. Journal of
Business Strategy, 28(5), 29-35.
Gadher, D. (2018, October 12). Two companies soon to control one fifth of global content spend.
Retrieved April 19, 2019, from Ampere Analysis:
https://www.ampereanalysis.com/blog/40493941-7f03-467d-9b90-723752e04499
Garrahan, M. (2014, December 12). The rise and rise of the Hollywood film franchise. Retrieved April 22,
2019, from Financial Times: https://www.ft.com/content/192f583e-7fa7-11e4-adff-
00144feabdc0
GCU. (2018). Case Study Method. Retrieved from Center for Innovation in Research and Teaching:
https://cirt.gcu.edu/research/developmentresources/research_ready/descriptive/case_study
Goldman, M., & Johnson, T. (1999, September 7). Viacom tunes in to CBS. Retrieved March 23, 2019,
from CNNMoney: https://money.cnn.com/1999/09/07/deals/cbs/
Granados, N. (2018, November 30). AT&T's Warner Media Streaming Service To Launch In 2019: Will It
Succeed? Retrieved April 19, 2019, from
https://www.forbes.com/sites/nelsongranados/2018/11/30/atts-warner-media-streaming-
service-to-launch-in-2019-will-it-succeed/#560ba55e4c49
Hitchner, J. R. (2003). Financial Valuation - Applications and Models. John Wiley & Sons.
Hovenkamp, H. (2018, July 10). The Disney-Fox Deal: Why It’s About Going Directly to the Consumer
[Audio podcast]. Retrieved April 22, 2019, from
https://knowledge.wharton.upenn.edu/article/the-impact-of-disney-fox/
81
Hüttmann, O. (2019, April 4). Reasons for Disney-Fox deal. (M. Krafczyk, Interviewer)
Iger, R. (2019, April 12). Disney CEO Bob Iger on Netflix and the Fox deal. (D. Faber, Interviewer)
Retrieved April 20, 2019, from https://www.cnbc.com/video/2019/04/12/disney-ceo-bob-iger-
on-netflix-and-the-fox-deal.html
IMAA. (2019). M&A Statistics. Retrieved April 25, 2019, from Institute of Mergers, Acquisitions and
Alliances: https://imaa-institute.org/mergers-and-acquisitions-
statistics/#TopMergersAcquisitions_Worldwide
IMF. (2019). Real GDP growth. Retrieved April 21, 2019, from
https://www.imf.org/external/datamapper/NGDP_RPCH@WEO/ADVEC/WEOWORLD/USA/OEM
DC
Informitv. (2019). Multiscreen Index 2019. Retrieved March 27, 2019
International Trade Administration. (2017). 2017 Top Markets Report Media and Entertainment. U.S.
Department of Commerce. Retrieved from
https://www.google.com/url?sa=t&rct=j&q=&esrc=s&source=web&cd=1&cad=rja&uact=8&ved=
2ahUKEwjrtIjJ65jhAhWS-6QKHRc-
ARMQFjAAegQIAhAC&url=https%3A%2F%2Fwww.trade.gov%2Ftopmarkets%2Fpdf%2FTop%252
0Markets%2520Media%2520and%2520Entertinment%25202017.pdf&usg=AOvVa
International Trade Administration. (2018). Media and Entertainment Spotlight. Retrieved March 23,
2019, from SelectUSA: https://www.selectusa.gov/media-entertainment-industry-united-states
Investopedia. (2018a). Synergy. Retrieved from Investopedia:
https://www.investopedia.com/terms/s/synergy.asp
Investopedia. (2018b, November 18). Should You Look at Net Debt or Gross Debt? Retrieved May 12,
2018, from https://www.investopedia.com/ask/answers/042415/why-would-you-look-
companys-net-debt-rather-its-gross-debt.asp
Investopedia. (2019, March 31). Brand Equity. Retrieved April 19, 2019, from
https://www.investopedia.com/terms/b/brandequity.asp
James, M. (2019, March 20). Disney-Fox deal fallout: Hollywood braces for big changes. Retrieved April
22, 2019, from Los Angeles Times: https://www.latimes.com/business/hollywood/la-fi-ct-disney-
fox-react-20190320-story.html
Johnson, T. (2017, December 5). A Disney-Fox Deal Would Land at an Uncertain Moment for DOJ Review
of Big Media. Retrieved from Variety.com: https://variety.com/2017/politics/news/disney-fox-
antitrust-1202631193/
Kaplan, S. N., & Ruback, R. S. (1996). The market pricing of cash flow forecasts: Discounted cash flow vs.
The method of comparables. Journal of Applied Corporate Finance, 8(4).
KCC. (2018, September 20). Animation Workers Antitrust Litigation. Retrieved April 22, 2019, from
http://www.animationlawsuit.com/

82
Kerber, R. (2017, November 15). Shareholders take aim at Murdochs with Fox voting rights push.
Retrieved from Reuters: https://www.reuters.com/article/fox-agm/shareholders-take-aim-at-
murdochs-with-fox-voting-rights-push-idUSL1N1NJ1RE
Koller, T., Goedhart, M., & Wessels, D. (2010). Valuation: Measuring and Managing the Value of
Companies (5th ed.). Hoboken, New Jersey.: John Wiley & Sons.
Lee, E. (2018, December 4). Netflix Will Keep 'Friends' Through Next Year in a $100 Million Agreement.
Retrieved April 24, 2019, from The New York Times:
https://www.nytimes.com/2018/12/04/business/media/netflix-friends.html
Leichtman Research Group. (2019, March 6). Major Pay-TV Providers Lost About 2,875,000 Subscribers in
2018. Retrieved march 27, 2019, from https://www.leichtmanresearch.com/major-pay-tv-
providers-lost-about-2875000-subscribers-in-2018/
Luehrman, T. A. (1997). Using APV: A better tool for valuing Operations. Harvard Business Review.
Lynch, J. (2018, march 20). The 23 most successful movie franchises of all time, which have made billions
of dollars at the box office. Retrieved April 22, 2019, from Business Insider Nederland:
https://www.businessinsider.nl/most-successful-movie-franchises-of-all-time-at-box-office-
2018-3/?international=true&r=US
MPAA. (2019). 2018 THEME Report. Motion Picture Association of America. Retrieved March 24, 2019,
from
https://www.google.com/url?sa=t&rct=j&q=&esrc=s&source=web&cd=3&cad=rja&uact=8&ved=
2ahUKEwj33uaW65vhAhUvsaQKHXjVC4IQFjACegQIAxAC&url=https%3A%2F%2Fwww.mpaa.org
%2Fwp-content%2Fuploads%2F2019%2F03%2FMPAA-THEME-Report-
2018.pdf&usg=AOvVaw07brpZf0pQgGYkdl4g4Br
Netflix . (2012, December 4). Netflix and The Walt Disney Studios Announce Multi-Year Premium Pay TV
Window Agreement in the United States . Retrieved from PR Newswire:
https://www.prnewswire.com/news-releases/netflix-and-the-walt-disney-studios-announce-
multi-year-premium-pay-tv-window-agreement-in-the-united-states-182053971.html
Netflix. (2019a). Shareholder Letter Q1 2019. Retrieved April 24, 2019, from
https://s22.q4cdn.com/959853165/files/doc_financials/quarterly_reports/2019/q1/FINAL-Q119-
Shareholder-Letter.pdf
Netflix. (2019b). Netflix Originale. Retrieved from https://www.netflix.com/de/browse/genre/839338
Nielsen. (2018, September 7). Nielsen Estimates 119.9 Million TV Homes in the U.S. for the 2018-2019 TV
Season. Retrieved March 26, 2019, from Nielsen.com:
https://www.nielsen.com/us/en/insights/news/2018/nielsen-estimates-119-9-million-tv-homes-
in-the-us-for-the-2018-19-season.html
OECD. (2019a, March). Consumer confidence index (CCI). Retrieved April 21, 2019, from
https://data.oecd.org/leadind/consumer-confidence-index-cci.htm
OECD. (2019b). Taxation of Corporate and Capital Income. Retrieved May 10, 2019, from
https://www.google.com/url?sa=t&rct=j&q=&esrc=s&source=web&cd=18&cad=rja&uact=8&ved

83
=2ahUKEwiKvqK7kZLiAhVRZFAKHU4CASIQFjARegQICBAC&url=https%3A%2F%2Fwww.oecd.org%
2Ftax%2Ftax-policy%2Fcorporate-and-capital-income-tax-explanatory-
annex.pdf&usg=AOvVaw3Ep4xR9G
Parrot Analytics. (2019). The Global Television Demand Report. Retrieved May 1, 2019
Pearson, B. (2018, May 24). Michael Bay’s ‘Six Underground’ Will Be Netflix’s Most Expensive Original
Film Yet. Retrieved May 3, 2019, from https://www.slashfilm.com/netflixs-most-expensive-
movie/
Pressman, A. (2018, November 15). Why the Price of Cable TV Stopped Going Up So Fast This Year.
Retrieved March 28, 2019, from fortune.com: http://fortune.com/2018/11/15/average-cable-tv-
bill-cord-cutting/
PwC. (2018). Global Entertainment & Media Outlook 2018-2022. PwC.
PwC Belgium. (2018, June 6). Trending now in entertainment & media: convergence, connections and
trust. Retrieved from PwC Belgium: https://press.pwc.be/trending-now-in-entertainment--
media-convergence-connections-and-trust#
Richter, F. (2018, September 10). The State of the U.S. Pay-TV Landscape . Retrieved from Statista:
https://www.statista.com/chart/6994/pay-tv-providers-in-the-us/
Ross, S., Westerfield, R., & Jaffe, J. (2006). Mergers and Acquisitions. In Corporate Finance (6th ed.).
McGraw-Hill/Irwin.
Rubin, P. (2019, March 25). Apple TV+ Is Here—But It Has a Long Way to Go. Retrieved April 19, 2019,
from https://www.wired.com/story/apple-tv-plus-unveiled/
Sabbaga, J. (2017, December 30). Viva - A Vida é uma Festa pode sofrer boicote em cinemas brasileiros;
entenda. Retrieved April 22, 2019, from omelete: https://www.omelete.com.br/filmes/viva-a-
vida-e-uma-festa-pode-sofrer-boicote-em-cinemas-brasileiros-entenda
Sarandos, T. (2019, January 17). Netflix, Inc. Q4 2018 Earnings Conference Call. Retrieved April 25, 2019,
from https://seekingalpha.com/article/4234177-netflixs-nflx-ceo-reed-hastings-q4-2018-results-
earnings-call-transcript?part=single
Schwartzel, E. (2017, November 1). Disney Lays Down the Law for Theaters on ‘Star Wars: The Last Jedi’.
Retrieved April 22, 2019, from The Wall Street Journal: https://www.wsj.com/articles/disney-
lays-down-the-law-for-theaters-on-star-wars-the-last-jedi-1509528603
Schwartzel, E. (2019, February 25). Oscar in the Age of Entertainment Overload. Retrieved April 25, 2019,
from The Wall Street Journal: https://www.wsj.com/articles/oscar-in-the-age-of-entertainment-
overload-11550898051
Sirower, M. L., & Sahni, S. (2006). Avoiding the Synergy Trap: Practical Guidance on M&A Decisions for
CEOs and Boards. Journal of Applied Corporate Finance,, 18, 83-95.
Sorkin, A. (2003, April 10). A Satellite Empire: The Deal; News Corp. Adds to Empire With Control of
DirecTV. Retrieved March 23, 2019, from New York Times:
84
https://www.nytimes.com/2003/04/10/business/a-satellite-empire-the-deal-news-corp-adds-to-
empire-with-control-of-directv.html
Spangler, T. (2019, January 18). Netflix Spent $12 Billion on Content in 2018. Analysts Expect That to
Grow to $15 Billion This Year. Retrieved May 1, 2019, from
https://variety.com/2019/digital/news/netflix-content-spending-2019-15-billion-1203112090/
Standard & Poor's. (2018). Industry Top Trends 2019 - Media and Entertainment. Retrieved April 28,
2019, from https://www.spratings.com/documents/20184/5670590/Industry+Top+Trends+-
+Media+and+Entertainment/af19aac0-5158-2fa6-cc13-d625e7a4a2e9
Statista. (2018). Digital Media Report 2019. Retrieved April 22, 2019
Statista. (2019a). Number of TV households worldwide from 2010 to 2023 (in billions). Retrieved March
26, 2019, from Statista: https://www.statista.com/statistics/268695/number-of-tv-households-
worldwide/
Statista. (2019b). Global Pay TV Industry - Statistics & Facts. Retrieved March 26, 2019, from Statista:
https://www.statista.com/topics/4985/pay-tv-worldwide/
The Numbers. (2019a). Domestic Movie Theatrical Market Summary 1995 to 2019. Retrieved March 24,
2019, from TheNumbers: https://www.the-numbers.com/market/
The Numbers. (2019b). Movie Budgets. Retrieved April 19, 2019, from https://www.the-
numbers.com/movie/budgets/all
The Walt Disney Company. (2006, January 24). Disney To Acquire Pixar. Retrieved May 4, 2019, from
https://www.thewaltdisneycompany.com/disney-to-acquire-pixar/
The Walt Disney Company. (2009, August 31). Disney To Acquire Marvel Entertainment. Retrieved May 4,
2019, from https://www.thewaltdisneycompany.com/disney-to-acquire-marvel-entertainment/
The Walt Disney Company. (2012, December 21). The Walt Disney Company Completes Lucasfilm
Acquisition. Retrieved May 4, 2019, from https://www.thewaltdisneycompany.com/the-walt-
disney-company-completes-lucasfilm-acquisition/
The Walt Disney Company. (2016a, August 9). The Walt Disney Company Acquires Minority Stake in
BAMTech. Retrieved May 4, 2019, from https://www.thewaltdisneycompany.com/the-walt-
disney-company-acquires-minority-stake-in-bamtech/
The Walt Disney Company. (2016b). Annual Report 2016. Retrieved from
https://www.google.com/url?sa=t&rct=j&q=&esrc=s&source=web&cd=13&ved=2ahUKEwiuwLu
T36XiAhXoN-wKHQv3B14QFjAMegQIAxAC&url=https%3A%2F%2Fditm-twdc-
us.storage.googleapis.com%2F2016-Annual-
Report.pdf&usg=AOvVaw3XRAweluyUMXWavHKEgAEd
The Walt Disney Company. (2017a, August 8). The Walt Disney Company To Acquire Majority Ownership
Of BAMTech. Retrieved from https://www.thewaltdisneycompany.com/walt-disney-company-
acquire-majority-ownership-bamtech-2/
85
The Walt Disney Company. (2017b, December 14). The Walt Disney Company To Acquire Twenty-First
Century Fox, Inc., After Spinoff Of Certain Businesses, For $52.4 Billion In Stock. Retrieved from
The Walt Dsiney Company: https://www.thewaltdisneycompany.com/walt-disney-company-
acquire-twenty-first-century-fox-inc-spinoff-certain-businesses-52-4-billion-stock-2/
The Walt Disney Company. (2018a, March 14). The Walt Disney Company Announces Strategic
Reorganization. Retrieved March 6, 2019, from The Walt Disney Company:
https://www.thewaltdisneycompany.com/walt-disney-company-announces-strategic-
reorganization/
The Walt Disney Company. (2018b, June 20). The Walt Disney Company Signs Amended Acquisition
Agreement To Acquire Twenty-First Century Fox, Inc., For $71.3 Billion In Cash And Stock.
Retrieved from The Walt Disney Company: https://www.thewaltdisneycompany.com/the-walt-
disney-company-signs-amended-acquisition-agreement-to-acquire-twenty-first-century-fox-inc-
for-71-3-billion-in-cash-and-stock/
The Walt Disney Company. (2018c, July 27). 21st Century Fox And Disney Stockholders Approve
Acquisition By Disney. Retrieved from The Walt Disney Company:
https://www.thewaltdisneycompany.com/21st-century-fox-and-disney-stockholders-approve-
acquisition-by-disney/
The Walt Disney Company. (2018d). Annual Report. Retrieved March 6, 2019, from
https://www.google.com/url?sa=t&rct=j&q=&esrc=s&source=web&cd=1&ved=2ahUKEwjKnIam-
u3gAhVGyqQKHSybAyYQFjAAegQIBRAC&url=https%3A%2F%2Fwww.thewaltdisneycompany.co
m%2Fwp-content%2Fuploads%2F2019%2F01%2F2018-Annual-
Report.pdf&usg=AOvVaw0XLpyVasT1dGaAGrFguNoi
The Walt Disney Company. (2019a, March 15). Disney and 21st Century Fox Announce Preliminary
Election Results in Connection with Acquisition. Retrieved April 27, 2019, from
https://www.thewaltdisneycompany.com/disney-and-21st-century-fox-announce-preliminary-
election-results-in-connection-with-acquisition/
The Walt Disney Company. (2019b, April 11). 2019 Investor Day [Webcast]. Burbank, California, United
States. Retrieved April 19, 2019, from https://www.thewaltdisneycompany.com/the-walt-
disney-companys-2019-investor-day-webcast/
Thomson Reuters Eikon. (2019). Thomson Reuters Eikon Database.
TiVo. (2017). Q3 2017 Online Video and Pay-TV Trends Report. Retrieved March 28, 2019, from
assets.fiercemarkets.net/public/007-Telecom/tivo-q3.pdf
Trading Economics. (2019). United States Unemployment Rate. Retrieved April 21, 2019, from
https://tradingeconomics.com/united-states/unemployment-rate
Udland, M. (2015, February 18). Here's how movie theaters are still making money even though ticket
sales are down. Retrieved April 22, 2019, from Business Insider:
https://www.businessinsider.com/movie-concessions-drive-amc-earnings-2015-
2?international=true&r=US&IR=T

86
Viacom. (2018). 4th Quarter '18 Earnings Press Release. Retrieved May 4, 2019, from
https://ir.viacom.com/static-files/e84e813a-1e00-48fe-aca1-e447c13fe80a
Welch, C. (2018, June 13). Comcast makes $65 billion offer to steal 21st Century Fox away from Disney.
Retrieved from TheVerge.com: https://www.theverge.com/2018/6/13/17457244/comcast-21st-
century-fox-film-tv-studios-acquisition-deal-announced
Wharton Research Data Services. (2019). Beta Suite.
Young, A. (2017, December 12). Here's why a small-town Iowa movie theater won't show 'Star Wars: The
Last Jedi' . Retrieved from Des Moines Register:
https://eu.desmoinesregister.com/story/entertainment/movies/2017/11/15/star-wars-last-jedi-
elkader-iowa-movie-theater/865776001/
Young, M., Sullivan, P., Nokhasteh, A., & Holt, A. (1999). All Roads Lead to Rome. Goldman Sachs
Investment Research.