A major shift in diversification rate helps explain …€¦ · across the evolutionary history of...
14
ORIGINAL ARTICLE doi:10.1111/evo.13237 A major shift in diversification rate helps explain macroevolutionary patterns in primate species diversity Jessica H. Arbour 1,2 and Sharlene E. Santana 1,3 1 Department of Biology, University of Washington, Seattle, Washington 98195 2 E-mail: [email protected] 3 Burke Museum of Natural History and Culture, University of Washington, Seattle, Washington 98195 Received July 8, 2016 Accepted March 12, 2017 Primates represent one of the most species rich, wide ranging, and ecologically diverse clades of mammals. What major macroevo- lutionary factors have driven their diversification and contributed to the modern distribution of primate species remains widely debated. We employed phylogenetic comparative methods to examine the role of clade age and evolutionary rate heterogeneity in the modern distribution of species diversity of Primates. Primate diversification has accelerated since its origin, with decreased extinction leading to a shift to even higher evolutionary rates in the most species rich family (Cercopithecidae). Older primate clades tended to be more diverse, however a shift in evolutionary rate was necessary to adequately explain the imbalance in species diversity. Species richness was also poorly explained by geographic distribution, especially once clade age and evolutionary rate shifts were accounted for, and may relate instead to other ecological factors. The global distribution of primate species diversity appears to have been strongly impacted by heterogeneity in evolutionary rates. KEY WORDS: BAMM, cercopithecidae, lineage diversification, mammals, phylogenetic imbalance, phylogenetic comparative methods. Primates is one of the largest (>400 species), most ecologically diverse, socially complex, and broadly distributed orders of mam- mals (Lefebvre et al. 2004; Dunbar and MacDonald 2013; Fahy et al. 2013; Tran 2014). As a consequence, considerable inter- est has been placed in how Primates have diversified and the factors contributing to the uneven distribution of species diver- sity across its major clades (Fabre et al. 2009; Stadler 2011; Springer et al. 2012). Modern Primates span 16 families, which vary considerably in species richness (Figs. 1 and 2)–-from the monotypic Daubentoniidae (Aye-Aye) to the diverse Cercopithe- cidae (Old World monkeys, >100 species). A number of studies have focused on investigating patterns of lineage diversification within Primates; these have suggested discrete speciation or ex- tinction rate shifts in particular clades (e.g., Cercopithecidae and Galagidae, Purvis et al. 1995; Anthropoidea, Lemuriformes and Macaca, Fabre et al. 2009) or at specific times (e.g., increases in the late Miocene, slowdowns in the Pleistocene; Springer et al. 2012). Other comparative analyses have linked changes in pri- mate lineage diversification to biogeographic or ecological fac- tors (Gomez and Verdu 2012; Rolland et al. 2014). For example, primate diversity peaks toward the equator (Fig. S1), and a combi- nation of increased speciation and decreased extinction has been proposed to contribute to the high species richness of Primates in the tropics (Rolland et al. 2014). This hypothesis, however, is not well supported within the largest primate family (Cerco- pithecidae). It has also been proposed that changes in diversifi- cation rates among Primates may be associated with changes in geographic range size, with larger geographic ranges enhancing speciation rates potentially as a result of increased allopatric spe- ciation (Gomez and Verdu 2012). This diversification pattern is consistent with patterns of increasing range overlap as node level increases in some primate tribes (largely consistent with allopatric speciation; Barraclough 1998; Kamilar and Martin 2009). Con- trastingly, some analyses have found higher species richness in 1600 C 2017 The Author(s). Evolution C 2017 The Society for the Study of Evolution. Evolution 71-6: 1600–1613
-
Upload
phungtuong -
Category
Documents
-
view
218 -
download
0
Transcript of A major shift in diversification rate helps explain …€¦ · across the evolutionary history of...

ORIGINAL ARTICLE
doi:10.1111/evo.13237
A major shift in diversification rate helpsexplain macroevolutionary patterns inprimate species diversityJessica H. Arbour1,2 and Sharlene E. Santana1,3
1Department of Biology, University of Washington, Seattle, Washington 981952E-mail: [email protected]
3Burke Museum of Natural History and Culture, University of Washington, Seattle, Washington 98195
Received July 8, 2016
Accepted March 12, 2017
Primates represent one of the most species rich, wide ranging, and ecologically diverse clades of mammals. What major macroevo-
lutionary factors have driven their diversification and contributed to the modern distribution of primate species remains widely
debated. We employed phylogenetic comparative methods to examine the role of clade age and evolutionary rate heterogeneity
in the modern distribution of species diversity of Primates. Primate diversification has accelerated since its origin, with decreased
extinction leading to a shift to even higher evolutionary rates in the most species rich family (Cercopithecidae). Older primate clades
tended to be more diverse, however a shift in evolutionary rate was necessary to adequately explain the imbalance in species
diversity. Species richness was also poorly explained by geographic distribution, especially once clade age and evolutionary rate
shifts were accounted for, and may relate instead to other ecological factors. The global distribution of primate species diversity
appears to have been strongly impacted by heterogeneity in evolutionary rates.
KEY WORDS: BAMM, cercopithecidae, lineage diversification, mammals, phylogenetic imbalance, phylogenetic comparative
methods.
Primates is one of the largest (>400 species), most ecologically
diverse, socially complex, and broadly distributed orders of mam-
mals (Lefebvre et al. 2004; Dunbar and MacDonald 2013; Fahy
et al. 2013; Tran 2014). As a consequence, considerable inter-
est has been placed in how Primates have diversified and the
factors contributing to the uneven distribution of species diver-
sity across its major clades (Fabre et al. 2009; Stadler 2011;
Springer et al. 2012). Modern Primates span 16 families, which
vary considerably in species richness (Figs. 1 and 2)–-from the
monotypic Daubentoniidae (Aye-Aye) to the diverse Cercopithe-
cidae (Old World monkeys, >100 species). A number of studies
have focused on investigating patterns of lineage diversification
within Primates; these have suggested discrete speciation or ex-
tinction rate shifts in particular clades (e.g., Cercopithecidae and
Galagidae, Purvis et al. 1995; Anthropoidea, Lemuriformes and
Macaca, Fabre et al. 2009) or at specific times (e.g., increases in
the late Miocene, slowdowns in the Pleistocene; Springer et al.
2012). Other comparative analyses have linked changes in pri-
mate lineage diversification to biogeographic or ecological fac-
tors (Gomez and Verdu 2012; Rolland et al. 2014). For example,
primate diversity peaks toward the equator (Fig. S1), and a combi-
nation of increased speciation and decreased extinction has been
proposed to contribute to the high species richness of Primates
in the tropics (Rolland et al. 2014). This hypothesis, however,
is not well supported within the largest primate family (Cerco-
pithecidae). It has also been proposed that changes in diversifi-
cation rates among Primates may be associated with changes in
geographic range size, with larger geographic ranges enhancing
speciation rates potentially as a result of increased allopatric spe-
ciation (Gomez and Verdu 2012). This diversification pattern is
consistent with patterns of increasing range overlap as node level
increases in some primate tribes (largely consistent with allopatric
speciation; Barraclough 1998; Kamilar and Martin 2009). Con-
trastingly, some analyses have found higher species richness in
1 6 0 0C© 2017 The Author(s). Evolution C© 2017 The Society for the Study of Evolution.Evolution 71-6: 1600–1613

A SHIFT IN PRIMATE DIVERSIFICATION
cerc
opith
ecid
aepi
thec
iidae
calli
trich
idae
chei
roga
leid
aele
pile
mur
idae
atel
idae
cebi
dae
lem
urid
aein
driid
aega
lagi
dae
hylo
batid
aeao
tidae
lors
idae
tars
iidae
hom
inid
aeda
uben
toni
idae
Num
ber o
f spe
cies
020
4060
8010
012
0
= strepsirrhines
= haplorhines
140
Figure 1. Species richness in primate families. Species counts are
derived from the IUCN red list, with additions from recent taxo-
nomic descriptions or revisions (see Methods). Dark gray = Strep-
sirrhini, light gray = Haplorhini.
species with small ranges (Eeley and Foley 1999). More complex
scenarios, such as changing opportunities following extinction
events (Meredith et al. 2011; Perelman et al. 2011; Springer et al.
2012), changing climatic conditions (Springer et al. 2012), or
cycles of habitat contraction and expansion (Kamilar and Martin
2009; Guschanski et al. 2013), have also been proposed as driving
primate diversification trends.
Overall, there remains considerable debate on the major
factors influencing primate diversification and their impact on
species richness. Importantly, most previous studies of primate
diversification have not applied comparative methods that can si-
multaneously accommodate processes occurring broadly across a
phylogeny (e.g., changing diversification through time) as well
as discrete, clade-specific shifts in evolutionary rates. Failure
to account for such a mixture of processes may bias param-
eter estimates, for example of clades of differing ages (Ra-
bosky 2010, 2014; Rabosky and Glor 2010). Additionally, rarely
have studies subsequently investigated the extent to which pro-
posed diversification rate changes or shifts actually contribute
to patterns of primate diversity, for example with posterior pre-
dictive approaches (Slater and Pennell 2014). These are criti-
cally needed to understand if and how historical and ecologi-
cal factors have shaped heterogeneity in evolutionary rates, and
the uneven species diversity observed among modern primate
clades.
In the following analyses, we seek to use modern tools to
address the impact of three factors that have been previously
linked to the distribution of species diversity across a variety
of clades (e.g., McPeek and Brown 2007; Wiens 2011; Pyron
and Burbrink 2013; Morlon 2014; Rabosky 2014; Stadler et al.
2014), and that are likely to have influenced species richness
and patterns of diversification in Primates: (1) time, (2) evolu-
tionary rate heterogeneity, and (3) geographic distribution. Using
a published, time-calibrated phylogeny (Springer et al. 2012),
we test for diversification rate heterogeneity by applying a re-
cently developed Bayesian Markov Chain Monte Carlo (MCMC)
method that is capable of accommodating a mixture of evolu-
tionary rate regimes, including both continuous and discrete pro-
cesses. This Bayesian MCMC method also accounts for missing
lineages under a conservative assumption of constant evolutionary
rates (Rabosky 2014). With an evolutionary-simulation approach,
we further examined whether and how changing evolutionary
rates through time and within specific clades has had an impact
on the unevenness in species diversity across primate families and
across the evolutionary history of primates. Lastly, to investigate
if changes in diversification rates among Primates are associ-
ated with changes in geographic range, we tested for relation-
ships between species richness and geographic variables while
accounting for factors such as clade age and evolutionary rate
heterogeneity. Altogether, these new analyses clarify the strong
influence of clade age and changes in diversification rate among
the largest clade on the distribution of species diversity across
Primates.
MethodsPRIMATE PHYLOGENIES
We took phylogenetic relationships and divergence times from a
supermatrix analysis of 69 nuclear and 10 mitochondrial genes
from 367 species, with 14 fossil calibrations applied in a “MCMC
tree” analysis in PAML (Yang 2007; Springer et al. 2012). Diver-
gence time analyses in the aforementioned study used either au-
tocorrelated or independent rates, and either hard or soft-bounded
divergence time constraints, for a total of four divergence time
scenarios (Springer et al. 2012). To account for uncertainty asso-
ciated with the divergence times in primates, we carried out all
subsequent analyses across each of the four phylogenies avail-
able from Springer et al. (2012). After eliminating synonymized
taxa from the phylogenies following the International Union for
Conservation of Nature’s “Red List” (IUCN 2015), we retained
subtrees containing a total of 340 primate species from the orig-
inal set of 367 (>80% of the total primate species diversity) for
lineage diversification. Phylogenies, as well as BAMM control
files and R scripts for functions (see below), are provided via
Dryad (DOI:10.5061/dryad.q51ph).
EVOLUTION JUNE 2017 1 6 0 1
J. H. ARBOUR AND S. E. SANTANA
60 50 40 30 20 10 00.0
0.1
0.2
0.3
0.4
0.5
net d
iver
sific
atio
n ra
te
primates
60 50 40 30 20 10 00.0
0.1
0.2
0.3
0.4
0.5
net d
iver
sific
atio
n ra
te
cercopithecids
non−cercopithecids
60 50 40 30 20 10 00.0
0.1
0.2
0.3
0.4
0.5
spec
iatio
n ra
te
primates
60 50 40 30 20 10 00.0
0.1
0.2
0.3
0.4
0.5
spec
iatio
n ra
te cercopithecids
non−cercopithecids
60 50 40 30 20 10 00.00
0.05
0.10
0.15
0.20
0.25
0.30
time before present (Ma)
extin
ctio
n ra
te
primates
60 50 40 30 20 10 00.00
0.05
0.10
0.15
0.20
0.25
0.30
time before present (Ma)
extin
ctio
n ra
te
cercopithecidsopitheecidsecidsecidscercopitheecidsecidsecidsecidscercopitheecidsecidsecercopit
non−cercopithecids
D
Galago_thomasiGalago_demidoffGalago_matschieiGalago_moholiGalago_gallarumGalago_senegalensisGalago_orinusGalago_grantiGalago_zanzibaricusOtolemur_crassicaudatusOtolemur_garnettiiGalago_gabonensisGalago_alleniEuoticus_elegantulusLoris_lydekkerianusLoris_tardigradusNycticebus_pygmaeus
Nycticebus_menagensis
Nycticebus_javanicus
Nycticebus_bengalensis
Nycticebus_coucang
Perodicticus_potto
Arctocebus_calabarensis
Arctocebus_aureus
Daubentonia_madagascariensis
Varecia_rubra
Varecia_variegata
Lemur_catta
Prolemur_simus
Hapalemur_aureus
Hapalemur_occidentalis
Hapalemur_alaotrensis
Hapalemur_griseus
Hapalemur_meridionalis
Eulemur_rufifrons
Eulemur_fulvus
Eulemur_albifrons
Eulemur_sanfordi
Eulemur_cinereice
ps
Eulemur_collaris
Eulemur_
rufus
Eulemur_
mongo
z
Eulemur_
macac
o
Eulemur_
flavif
rons
Eulemur_
coron
atus
Eulemur_
rubriv
enter
Phane
r_pall
esce
ns
Lepil
emur
_aee
clis
Lepil
emur
_ran
drian
asolo
i
Lepil
emur
_hub
bard
orum
Lepil
emur
_rufi
caud
atus
Lepil
emur
_leuc
opus
Lepil
emur
_pet
teri
Lepil
emur
_micr
odon
Lepil
emur
_otto
Lepil
emur
_gre
wcoc
koru
m
Lepil
emur
_edw
ards
i
Lepi
lem
ur_s
epte
ntrio
nalis
Lepi
lem
ur_a
nkar
anen
sis
Lepi
lem
ur_t
ymer
lach
soni
Lepi
lem
ur_m
ilano
ii
Lepi
lem
ur_m
itter
mei
eri
Lepi
lem
ur_s
aham
alaz
ensis
Lepi
lem
ur_a
hman
soni
Lepi
lem
ur_d
orsa
lis
Lepi
lem
ur_s
eali
Lepi
lem
ur_w
right
i
Lepi
lem
ur_f
leur
etae
Lepi
lem
ur_m
uste
linus
Lepi
lem
ur_b
etsi
leo
Lepi
lem
ur_j
ames
orum
Allo
cebu
s_tri
chot
is
Mirz
a_co
quer
eli
Mirz
a_za
za
Mic
roce
bus_
gris
eoru
fus
Mic
roce
bus_
mur
inus
Mic
roce
bus_
mac
arth
urii
Mic
roce
bus_
danf
ossi
Mic
roce
bus_
rave
lobe
nsis
Mic
roce
bus_
bong
olav
ensi
s
Mic
roce
bus_
rufu
sM
icro
cebu
s_sa
mbi
rane
nsis
Mic
roce
bus_
arnh
oldi
Mic
roce
bus_
mam
iratra
Mic
roce
bus_
mar
gotm
arsh
aeM
icro
cebu
s_m
yoxi
nus
Mic
roce
bus_
berth
aeM
icro
cebu
s_le
hila
hyts
ara
Mic
roce
bus_
mitt
erm
eier
iM
icro
cebu
s_si
mm
onsi
Mic
roce
bus_
jolly
aeM
icro
cebu
s_ge
rpi
Mic
roce
bus_
tava
ratra
Che
iroga
leus
_sib
reei
Che
iroga
leus
_cro
ssle
yiC
heiro
gale
us_m
ajor
Che
iroga
leus
_med
ius
Indr
i_in
dri
Avah
i_ra
man
ants
oava
ni
Avah
i_m
erid
iona
lisAv
ahi_
peyr
iera
siAv
ahi_
bets
ilioAv
ahi_
lani
ger
Avah
i_oc
cide
ntal
is
Avah
i_cl
eese
iAv
ahi_
unic
olor
Prop
ithec
us_p
errie
ri
Prop
ithec
us_e
dwar
dsi
Prop
ithec
us_d
iade
ma
Prop
ithec
us_t
atte
rsal
li
Prop
ithec
us_c
oque
reli
Prop
ithec
us_v
erre
auxi
Tars
ius_
dent
atus
Tars
ius_
walla
cei
Tars
ius_
tars
ier
Tars
ius_
sang
irens
is
Tars
ius_la
riang
Tars
ius_b
anca
nus
Tars
ius_s
yrich
ta
Caca
jao_c
alvus
Cacaja
o_ho
som
i
Chirop
otes
_chir
opot
es
Chirop
otes_
utahic
ki
Pithec
ia_pit
hecia
Pithec
ia_mon
achu
s
Pithec
ia_irr
orata
Callice
bus_
lugen
s
Callice
bus_
torqu
atus
Callice
bus_
perso
natus
Callice
bus_
coim
brai
Callice
bus_
nigrifr
ons
Callice
bus_
cupre
us
Callice
bus_
brunn
eus
Callicebu
s_moloch
Callicebu
s_hoffm
annsi
Callicebus_caligatus
Callicebus_donacophilus
Alouatta_pigra
Alouatta_palliata
Alouatta_caraya
Alouatta_sara
Alouatta_nigerrima
Alouatta_macconnelli
Alouatta_guariba
Alouatta_belzebul
Brachyteles_hypoxanthus
Brachyteles_arachnoides
Lagothrix_cana
Lagothrix_lagotricha
Lagothrix_poeppigii
Lagothrix_lugens
Ateles_fusciceps
Ateles_hybridus
Ateles_belzebuth
Ateles_geoffroyi
Ateles_paniscus
Ateles_marginatus
Ateles_chamek
Saimiri_ustus
Saimiri_sciureus
Saimiri_oerstedii
Saimiri_boliviensis
Cebus_libidinosus
Cebus_apellaCebus_xanthosternos
Cebus_robustusCebus_capucinusCebus_kaaporiCebus_albifronsSaguinus_fuscicollisSaguinus_melanoleucusSaguinus_nigricollisSaguinus_tripartitus Saguinus_oedipus Saguinus_geoffroyi Saguinus_bicolor Saguinus_martinsi Saguinus_niger Saguinus_midas Saguinus_imperator Saguinus_labiatus Saguinus_mystax Saguinus_leucopus
Leontopithecus_rosaliaLeontopithecus_chrysopygus
Leontopithecus_chrysomelas
Callimico_goeldiiCallithrix_satereiCallithrix_auritaCallithrix_geoffroyi
Callithrix_kuhliiCallithrix_jacchus
Callithrix_penicillata
Callithrix_argentata
Callithrix_emiliae
Callithrix_mauesi
Callithrix_humeralifera
Callithrix_humilis
Callithrix_pygmaea
Aotus_vociferans
Aotus_lemurinus
Aotus_griseimembra
Aotus_trivirgatus
Aotus_nancymaae
Aotus_nigriceps
Aotus_azarae
Pongo_abelii
Pongo_pygmaeus
Pan_troglodytes
Pan_paniscus
Homo_sapiens
Gorilla_beringei
Gorilla_gorilla
Hoolock_hoolock
Hoolock_leuconedys
Symphalangus_syndactylus
Hylobates_pileatus
Hylobates_klossii
Hylobates_moloch
Hylobates_agilis
Hylobates_albibarbis
Hylobates_muelleri
Hylobates_lar
Nomascus_leucogenys
Nomascus_siki
Nomascus_gabriellae
Nomascus_concolor
Nomascus_nasutus
Nomascus_hainanus
Macaca_sylvanus
Macaca_nem
estrina
Macaca_silenus
Macaca_pagensis
Macaca_siberu
Macaca_leonina
Macaca_hecki
Macaca_nigrescens
Macaca_tonkeana
Macaca_nigra
Macaca_m
aura
Macaca_ochreata
Macaca_arctoides
Macaca_thibetana
Macaca_assam
ensis
Macaca_sinica
Macaca_radiata
Macaca_m
unzala
Macaca_cyclopis
Macaca_m
ulatta
Macaca_fuscata
Macaca_fascicularis
Theropithecus_gelada
Papio_papioPapio_ham
adryasPapio_cynocephalusPapio_ursinusPapio_anubisR
ungwecebus_kipunji
Lophocebus_albigenaLophocebus_aterrim
usM
andrillus_leucophaeusM
andrillus_sphinxC
ercocebus_chrysogasterC
ercocebus_galeritusC
ercocebus_agilisC
ercocebus_atysC
ercocebus_torquatusC
ercopithecus_campbelli
Chlorocebus_cynosuros
Chlorocebus_sabaeus
Chlorocebus_pygerythrus
Chlorocebus_aethiops
Chlorocebus_tantalus
Cercopithecus_solatus
Cercopithecus_preussi
Cercopithecus_lhoesti
Erythrocebus_patas
Cercopithecus_ham
lyni
Cercopithecus_neglectus
Cercopithecus_m
ona
Cercopithecus_pogonias
Cercopithecus_diana
Cercopithecus_nictitans
Cercopithecus_mitis
Cercopithecus_ascanius
Cercopithecus_erythrogaster
Cercopithecus_erythrotis
Cercopithecus_cephus
Cercopithecus_petaurista
Allenopithecus_nigroviridis
Miopithecus_ogouensis
Miopithecus_talapoin
Semnopithecus_priam
Trachypithecus_vetulus
Semnopithecus_hector
Semnopithecus_entellus
Trachypithecus_johnii
Trachypithecus_geei
Trachypithecus_pileatus
Trachypithecus_laotum
Trachypithecus_hatinhensis
Trachypithecus_delacouri
Trachypithecus_francoisi
Trachypithecus_poliocephalus
Trachypithecus_auratus
Trachypithecus_cristatus
Trachypithecus_germaini
Trachypithecus_barbei
Trachypithecus_obscurus
Trachypithecus_phayrei
Rhinopithecus_bieti
Rhinopithecus_roxellana
Rhinopithecus_avunculus
Rhinopithecus_brelichi
Simias_concolor
Nasalis_larvatus
Pygathrix_nigripes
Pygathrix_cinerea
Pygathrix_nemaeus
Presbytis_potenziani
Presbytis_rubicunda
Presbytis_melalophos
Presbytis_comata
Presbytis_hosei
Presbytis_frontata
Presbytis_chrysomelas
Presbytis_thomasi
Presbytis_femoralis
Piliocolobus_rufomitratus
Piliocolobus_kirkii
Piliocolobus_gordonorum
Piliocolobus_pennantii
Piliocolobus_preussi
Piliocolobus_badius
Procolobus_verus
Colobus_satanas
Colobus_polykomos
Colobus_vellerosus
Colobus_guerezaColobus_angolensis
Aot
Ate
Cal
Ceb
Cer
Che
Dau
Gal
Hom
Hyl
Ind
Lem
Lep
Lor
PitTar
0
0.1
0.2
0.3
(i)
(ii)
C
A B
= prior probability
= posterior probability
0 1 2 3 4 5 6 7 8 9 10Number of Shifts
0.0
0.1
0.2
0.3
0.4
0.5
0.6
Freq
uenc
y
Hylobatidae
Aotidae
Atelidae
CallithrichidaeCebidae
Cercopithecidae
Cheirogaleidae
Daubentoniidae
Galagidae
Hominidae
Indriidae
LemuridaeLepilemuridae
Lorisidae
PitheciidaeTarsiidae
10
Figure 2. Patterns of primate diversification rates from BAMM analyses. (A) Prior and posterior distribution of diversification rate shifts
from a Bayesian analysis of lineage diversification in primates; (B) Primate phylogeny with branch lengths scaled to the mean marginal
odds ratio (across all four phylogenies) for a shift occurring per branch (scale bar givens the length of a 10-fold increase in the probability
of a rate shift); (C) Primate phylogeny (AS) with branches colored by median diversification rate as summarized from its BAMM posterior
distribution. The first and second best supported rate shifts are given as (i) and (ii) respectively. Species names follow Springer et al.
(2012). Family abbreviations: Gal = Galagidae, Lor = Lorisidae, Dau = Daubentoniidae, Lem = Lemuridae, Lep = Lepilemuridae, Che =Cheirogaleidae, Ind = Indriidae, Tar = Tarsiidae, Pit = Pitheciidae, Ate = Atelidae, Ceb = Cebidae, Cal = Callitrichidae, Aot = Aotidae,
Hom = Hominidae, Hyl = Hylobatidae, Cer = Cercopithecidae; (D) Diversification, speciation and extinction rates through time across
the posterior distribution of BAMM analyses of the AS primate phylogeny. Lines give the median values from the posterior distribution,
while shaded areas give the 95% confidence intervals.
DIVERSIFICATION ANALYSES
We employed a recently developed Bayesian approach to estimate
discrete shifts in lineage diversification rates across the evolu-
tionary history of primates. We conducted a Bayesian Analysis of
Macroevolutionary Mixtures (Rabosky 2014) (bamm-project.org)
using the “BAMM” software package (v. 2.5), and the R package
“BAMMtools.” BAMM implements reversible jump, Metropolis
Coupled Markov Chain Monte Carlo, and allows for both time-
dependent speciation rates as well as discrete shifts in the rate
and pattern of diversification. To account for incomplete taxon
1 6 0 2 EVOLUTION JUNE 2017
A SHIFT IN PRIMATE DIVERSIFICATION
0
0.5
1
Cer
copi
thec
idae
Sim
iifor
mes
Cercopithecidae
Simiiformes
0
0.2
0.4
Cer
copi
thec
idae
Sim
iifor
mes
Cercopithecidae
SimiiformesA B
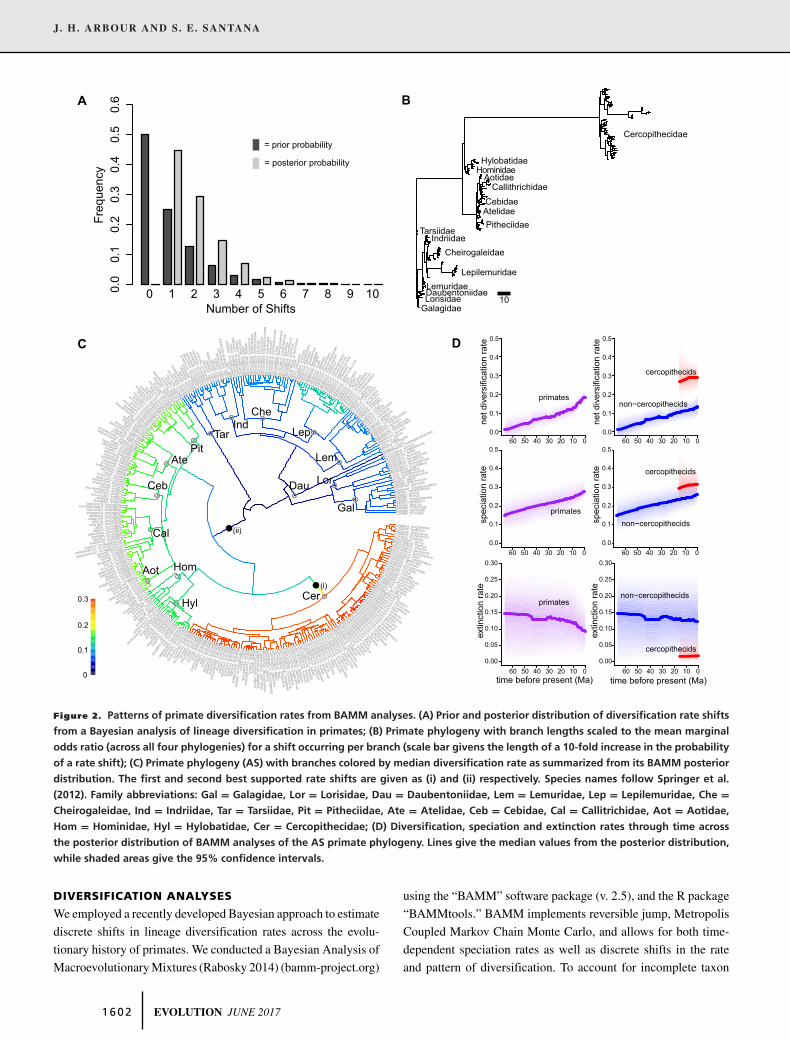
Figure 3. Macroevolutionary cohorts across primates; (A) cohort matrix illustrating the cumulative posterior probability (across all four
divergence time scenarios) of any two primate species belonging to the same diversification rate regime; (B) standard deviation of the
posterior probabilities (for evolutionary cohorts) across the four phylogenies examined.
sampling, we determined the percentage of species sampling per
genus where possible (e.g., except for polyphyletic genera, such as
Galago and Cercopithecus, see Springer et al. 2012; see Supple-
mentary Materials). We relied on IUCN taxonomic classifications
(IUCN 2015), with the exception of recent taxonomic descrip-
tions or revisions (Thinh et al. 2010; Gregorin and De Vivo 2013;
Munds et al. 2013; Thiele et al. 2013; Marsh 2014; Lei et al. 2015;
Li et al. 2015).
We sampled four MCMC chains of 10 million generations ev-
ery 10,000 iterations, with a burn-in of 10%, for each phylogeny.
We set the prior distribution of the number of shifts (as shown in
Fig. 1) so that a regime with zero shifts was the most likely con-
dition (BAMM parameter “expectedNumberofShifts” = 1). We
selected phylogeny-specific diversification rate parameter priors
(“lambdaInitPrior,” “lambdaShiftPrior,” and “muInitPrior”) for
each of the four phylogenies using the R function “setBAMM-
priors.” We calculated the effective sample size and examined
trace plots for posterior distribution of (1) the likelihood of the
rate regime and (2) the number of rate shifts in each regime using
functions from the R package “coda.” Given some recent criti-
cisms of BAMM (Moore et al. 2016), especially in regards to the
influence of the prior on the posterior distribution of rate shifts
in versions prior to 2.5, we ran additional BAMM analyses on
all four phylogenies using two extreme values of “expectedNum-
berofShifts” (0.1 and 10; Fig. S2). All three priors resulted in
nearly identical posterior distributions of rate shifts (Fig. 2 and
Fig. S2). Across all trees, the highest probability shift positions
(see below) remained the same across priors (results not shown),
which is consistent with the results of follow-up evaluations of
BAMM (Mitchell and Rabosky 2016; Rabosky et al. 2017).
The prior probability of a rate shift is proportional to
the length of a branch in the phylogeny, and therefore longer
branches have had greater shift opportunities (Rabosky 2014).
We computed the average marginal odds ratio (branch-specific or
“marginal” Bayes-factor, sensu Shi and Rabosky (2015) as the
ratio of the posterior to prior probability of a shift occurring along
each branch across all phylogenies. For each phylogeny, we also
identified the number of core-shifts (defined here as those shifts
with a marginal odds ratio > 10) and the frequency of each unique
configuration of core-shifts using the R function “distinctShift-
Configuration” (threshold = 10). We determined median speci-
ation, extinction, and net diversification rates for each of 100
temporal slices across the posterior distribution of the BAMM
analyses of each phylogeny.
MACROEVOLUTIONARY COHORTS
Macroevolutionary cohort analysis assesses whether pairs of taxa
are likely to have evolved under a common inherited evolutionary
rate regime (Rabosky et al. 2014a). For each sample in the poste-
rior distribution of a BAMM analysis, each pairwise comparison
(between species) is assigned a 1 if they have evolved under the
same regime, and 0 if they evolved under different regimes. Sum-
marizing across the posterior distribution of BAMM analyses,
the resulting matrix (i.e., “cohort matrix”), provides the posterior
probability of two species belonging to the same evolutionary
regime (Rabosky et al. 2014a, 2015; Shi and Rabosky 2015). It
EVOLUTION JUNE 2017 1 6 0 3

J. H. ARBOUR AND S. E. SANTANA
Aotidae
Atelidae
Callitrichidae
Cebidae
Cercopithecidae
Cheirogalidae
Galagidae
Hominidae
HylobatidaeIndriidaeLemuridae
Lepilemuridae
Lorisidae
Pitheciidae
Tarsiidae
30 25 20 15 10 5 0
0.5
1.0
1.5
2.0
Time before present (Ma)
log
(spe
cies
rich
ness
)
20 15 10 5 0
0.0
0.5
1.0
1.5
2.0
Time before present (Ma)
log
(spe
cies
rich
ness
)
Galago-Otolemur
Loris
Nycticebus
Arctocebus Varecia
Lemur-Hapalemur-Prolemur
Eulemur
LepilemurAllocebus-Mizra-Microcebus
Cheirogaleus
Avahi-Propithecus
Tarsius(dentatus)
Tarsius (bancanus)
Pitheciinae
Callicebus
Atelidae
Cebidae
Callitrichidae
AotidaeHominidae
Hylobatidae
Cercopithecidaetaxonomic families families: stem age > h > crown age
A B
Figure 4. Clade age and species richness relationships in Primates. Age and species richness were analyzed using PGLS (dashed
line = regression line, shaded region = 95% prediction interval), results from the AS phylogeny shown; (A) Species richness versus
age in accepted primate taxonomic families; (B) Species richness vs. age using a stringent time-based criterion (stem age > h (median
taxonomic family age) > crown age) to defined subclades as “families.”
is important to note that longer branches are more likely to have
experienced a rate shift under the BAMM model (Rabosky 2014),
which may result in lower cohort matrix values for species in
clades separated by older divergence times. We determined the
mean cohort matrix across the four phylogenies, and determined
the standard deviation of the cohort matrix pairwise values to
indicate the uncertainty in cohort membership associated with
divergence time variation.
AGE-SPECIES RICHNESS RELATIONSHIPS
We tested for a relationship between the crown age of primate
families and their species richness using phylogenetic general-
ized least squares (PGLS; Grafen 1989) regressions with a Brow-
nian Motion (BM) correlational structure, which accounts for the
evolutionary nonindependence of lineages. We excluded Dauben-
toniidae, the monotypic family of the Aye-Aye, because its crown
age could not be included and stem ages are considered less re-
liable for age-species richness analyses (Stadler et al. 2014). To
determine the effect of incomplete lineage sampling, we con-
trasted species richness per family both from the number of tips
in the phylogeny and previous literature counts with clade age
(see BAMM methods). We log-transformed species counts per
family prior to PGLS, as lineages accumulate exponentially un-
der a pure-birth process (Rabosky et al. 2012; Bloom et al. 2014;
Stadler et al. 2014; Shi and Rabosky 2015).
Stadler et al. (2014) showed that taxonomic classifications
may bias age-species richness relationships toward nonsignificant
or negative results. Such bias may be resolved by using a stringent
phylogenetic definition of taxonomic levels. We defined “Fam-
ilies” using the Sibley-Ahlquist model, as those lineages whose
crown age is younger than time h and whose stem age is older
than time h (Sibley and Ahlquiest 1990; Stadler et al. 2014). We
repeated the PGLS analysis of log10 species richness (based on
tips in the phylogeny) using a time-based criterion for subclades,
based on h being equal to the median primate family crown age
for each phylogeny, and after removing monotypic “families.” To
ensure that the results were not unique to the single chosen value
of h for each tree, we also used values of h +5 Ma to –5 Ma, in 1
Ma steps (see Table S2).
PHYLOGENETIC IMBALANCE
Shi and Rabosky (2015) described a method for measuring time-
specific phylogenetic imbalance (the extent to which lineages vary
in diversity) based on the variability of species richness occurring
across contemporaneous subclades. As such, we characterized
phylogenetic imbalance as the variance in the log-transformed
descendant species richness across all lineages present at a partic-
ular time in the phylogeny. We extended this analysis by adopting
the posterior predictive methods applied to several other compar-
ative phylogenetic analyses (Slater and Pennell 2014) to assess
the significance of this metric of phylogenetic imbalance under a
number of null evolutionary scenarios.
We calculated the observed phylogenetic imbalance (PIobs)
and the imbalance calculated from a series of 1000 simulated trees
with 340 extant tips (PIsim) across 100 uniformly distributed tem-
poral slices across each phylogeny (Fig. 5). Simulated phyloge-
nies were generated under a series of models, including a constant
rate birth-death process, a time-variable birth-death process, and a
time variable birth-death process with the best supported rate shift
from BAMM analyses (see Results). Similar to the morphological
1 6 0 4 EVOLUTION JUNE 2017

A SHIFT IN PRIMATE DIVERSIFICATION
Table 1. Diversification rate parameters for Primates under three evolutionary models.
Model Tree λ1 μ1 k1 λ2 μ2 k2
Birth-death, constant rate AS 0.304 0.231 — — — —AH 0.291 0.219 — — — —IS 0.486 0.435 — — — —IH 0.416 0.359 — — — —
Birth-death, variable rate AS 0.159 0.152 0.0198 — — —AH 0.111 0.111 0.0183 — — —IS 0.260 0.334 0.0178 — — —IH 0.282 0.341 0.0103 — — —
Discrete shift model (w/variable rates) AS 0.174 0.187 0.0141 0.323 0.015 0.0029AH 0.171 0.167 0.0139 0.343 0.0174 0.0022IS 0.254 0.324 0.0118 0.463 0.0216 0.0024IH 0.281 0.355 0.0111 0.485 0.0477 0.0026
Median diversification parameter values (λ = speciation [# lineages/Ma], μ = extinction [# lineages/Ma], k = scaler, change in speciation through time).
Parameters were calculated from the function “birthdeath” in the R package “ape” (constant rate) and from BAMM analyses of primate phylogenies (variable
rates and discrete shift). Where multiple regimes were estimated, λ1, μ1, and k1 give the root process and λ2, μ2, and k2 give the cercopithecid regime values.
Time since root (Ma)
Phy
loge
netic
imba
lanc
eva
rianc
e of
log(
desc
enda
nt ri
chne
ss)
Time since root (Ma)
(constant rate birth-death model) (BAMM model:time-variable speciation,
reduced cercopithecid extinction)
A B
0 10 20 30 40 50 60
0.0
0.5
1.0
1.5
2.0
2.5
0 10 20 30 40 50 60
0.0
0.5
1.0
1.5
2.0
Figure 5. Patterns of phylogenetic imbalance through time among primates. Black, solid lines display the phylogenetic imbalance, as
measured by the variance of log (descendant species richness) for each lineage present in the phylogeny (AS divergence times) at each
of 100 points in time (PIobs). Gray lines show the phylogenetic imbalance for a sample of 100 simulated phylogenies (PIsim). Dashed lines
show the median imbalance per time slice in the phylogeny across 1000 simulated phylogenies; (A) Primate phylogenetic imbalance
compared to expectations under a constant rate model; (B) Primate phylogenetic imbalance compared to expectations under the BAMM
rate shift model (faster diversification among cercopithecids and changing diversification rates through time).
disparity index (MDI) in “disparity-through-time” analyses
(Slater and Pennell 2014), we quantified total phylogenetic imbal-
ance as the area between the PIobs curve (Fig. 6 dark, solid lines)
and the median PI values of all simulated curves (Fig. 5, dashed
lines). Henceforth, this value is referred to as the Descendant
Variability Index (DVI). Positive values of DVI indicate that the
number of descendant species is more unevenly distributed across
contemporaneous subclades in the phylogeny than expected un-
der a particular generating process (Shi and Rabosky 2015). The
posterior predictive P-value was calculated as the frequency of
the (1000) simulated DVI values greater than the observed DVI
(Slater et al. 2010; Slater and Pennell 2014).
The median values of speciation, extinction, and time-
dependent rate from the posterior distribution of each of the four
BAMM analyses (Table 1) were used to simulate phylogenies.
We used the function “tess.sim.taxa.age” from the R package
“TESS” to simulate trees under constant rate and variable rate
processes, based on the number of primate species (n = 340) and
the root age for each phylogeny. Trees with a discrete shift were
generated by simulating separate phylogenies (with proportional
species numbers), which were subsequently combined at the ap-
propriate ages using the R function “bind.tree” from the package
“ape.” We calculated DVI after truncating the first and last 15%
of time in the phylogeny, to account for the low sampling of
EVOLUTION JUNE 2017 1 6 0 5

J. H. ARBOUR AND S. E. SANTANA
Table 2. Clade age–species richness relationships across Primates.
Phylogeny h (Ma) intercept (SD) slope (SD) P
Taxonomic familiesAS NA 1.07 (0.365) 0.0114 (0.0153) 0.473AH NA 1.11 (0.368) 0.00862 (0.0144) 0.561IS NA 1.08 (0.381) 0.0120 (0.0169) 0.492IH NA 1.09 (0.380) 0.0108 (0.0155) 0.500
Time-based “families”AS 18.1 0.530 (0.255) 0.0378 (0.0132) 0.0097∗
AH 18.0 0.527 (0.243) 0.0366(0.0134) 0.0131∗
IS 13.2 0.509 (0.295) 0.0519 (0.0165) 0.0052∗
IH 13.7 0.494 (0.281) 0.0497 (0.0154) 0.0042∗
Results of PGLS analysis of log (species richness) on clade age under a taxonomic definition of primate families and a stringent time-based categorization (h)
of “family” (Sibley and Ahlquiest 1990; Stadler et al. 2014). ∗Indicates significant values (P < 0.05). The intercept is given in log(species) and the slope is given
in log(species)/Ma. The cutoff age for time-based “families” is given as h in Ma before present. For taxonomic families, n = 15, for time-based “families”,
n = 22.
lineages early in the tree and incomplete taxon sampling toward
the present, respectively (Slater et al. 2010; Shi and Rabosky
2015).
RELATIONSHIPS BETWEEN SPECIES RICHNESS AND
BIOGEOGRAPHY
We obtained species distributions shapefiles from the IUCN mam-
mal distribution database and analyzed them using functions from
the R packages “sp,” “rgeos,” “rgdal,” and “geosphere.” We cal-
culated the absolute value for the centroid latitude of each species
distribution, so that these measures represented distances from the
Table 3. Summary of phylogenetic imbalance analyses.
Tree Diversification model DVI ppp
AS Birth-death 14.3 0.032∗
Time-variable birth-death 14.8 0.076Cercopithecidae shift 11.4 0.118
AH Birth-death 13.3 0.023∗
Time-variable birth-death 13.6 0.012∗
Cercopithecidae shift 10.6 0.126IS Birth-death 17.6 0.037∗
Time-variable birth-death 18.3 0.060Cercopithecidae shift 17.2 0.105
IH Birth-death 15.3 0.035∗
Time-variable birth-death 15.9 0.045∗
Cercopithecidae shift 16.5 0.130
DVI is the area between the observed and simulated phylogenetic imbal-
ance curves across 100 temporal slices across the phylogeny (see Fig. 5);
higher values indicate higher variance in species richness per lineage than
expected. Posterior predictive P-values were calculated using a distribution
of 1000 simulated trees with 340 tips, per primate phylogeny and diversifi-
cation model.∗Indicates significant values (P < 0.05).
equator (Santana et al. 2013). We determined the total geographic
range (in km2 using the R function “areaPolygon,” from the pack-
age “geosphere”) from each shapefile and log10 transformed it.
We measured degree of sympatry as the sum of a species’ terri-
tory shared with other members of its genus (Santana et al. 2013),
scaled by the total area occupied by the target species (e.g., 1
unit = a species shares 100% of its range with one congeneric, or
50% of its range with each of two congenerics, etc.). We made
comparisons among congenerics because secondary sympatry is
more common in older lineages (Barraclough 1998) and con-
generics are more likely to be similar in morphology and ecology.
This measurement did not appear to be biased by range size or
species richness per genus (results not shown).
We used PGLS to investigate the impact of each of these three
geographic variables on the phylogenetic distribution of primate
species diversity. We determined the mean of each geographic
variable for each of the time-based subclades (stem age > h >
crown age, see age-species richness methods) and compared them
to the log species richness for each subclade (Table 4, Fig. 6).
The cercopithecid subclade appeared as an outlier in some
comparisons (Fig. 6C, right) and may have undergone a ma-
jor diversification rate shift (see results), so all PGLS analyses
were repeated after excluding this family. Additionally, to ac-
count for the potential impact of clade age, we calculated time-
corrected richness (residuals of species richness on clade age;
Table 2) and tested these values against all geographic variables
(Table 4).
ResultsLINEAGE DIVERSIFICATION OF PRIMATES
In a Bayesian MCMC analysis of discrete evolutionary rate
shifts occurring across the primate phylogeny, we found strong
1 6 0 6 EVOLUTION JUNE 2017
A SHIFT IN PRIMATE DIVERSIFICATION
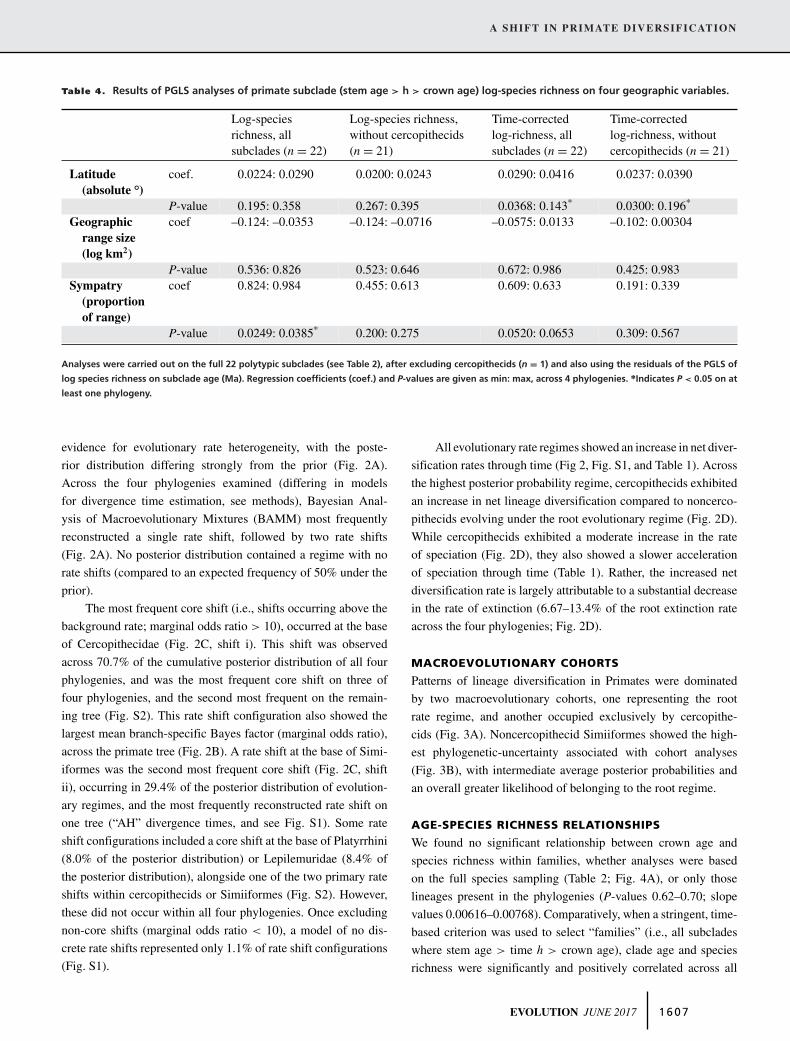
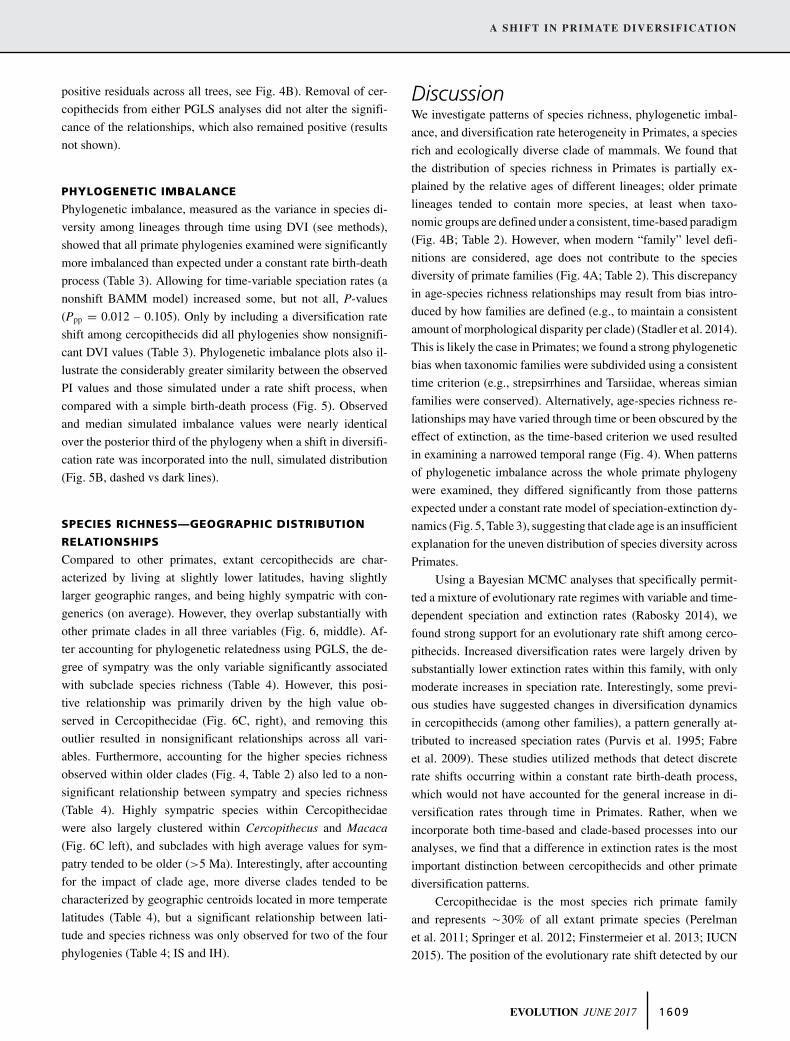
Table 4. Results of PGLS analyses of primate subclade (stem age > h > crown age) log-species richness on four geographic variables.
Log-speciesrichness, allsubclades (n = 22)
Log-species richness,without cercopithecids(n = 21)
Time-correctedlog-richness, allsubclades (n = 22)
Time-correctedlog-richness, withoutcercopithecids (n = 21)
Latitude(absolute °)
coef. 0.0224: 0.0290 0.0200: 0.0243 0.0290: 0.0416 0.0237: 0.0390
P-value 0.195: 0.358 0.267: 0.395 0.0368: 0.143∗ 0.0300: 0.196∗
Geographicrange size(log km2)
coef –0.124: –0.0353 –0.124: –0.0716 –0.0575: 0.0133 –0.102: 0.00304
P-value 0.536: 0.826 0.523: 0.646 0.672: 0.986 0.425: 0.983Sympatry
(proportionof range)
coef 0.824: 0.984 0.455: 0.613 0.609: 0.633 0.191: 0.339
P-value 0.0249: 0.0385∗ 0.200: 0.275 0.0520: 0.0653 0.309: 0.567
Analyses were carried out on the full 22 polytypic subclades (see Table 2), after excluding cercopithecids (n = 1) and also using the residuals of the PGLS of
log species richness on subclade age (Ma). Regression coefficients (coef.) and P-values are given as min: max, across 4 phylogenies. ∗Indicates P < 0.05 on at
least one phylogeny.
evidence for evolutionary rate heterogeneity, with the poste-
rior distribution differing strongly from the prior (Fig. 2A).
Across the four phylogenies examined (differing in models
for divergence time estimation, see methods), Bayesian Anal-
ysis of Macroevolutionary Mixtures (BAMM) most frequently
reconstructed a single rate shift, followed by two rate shifts
(Fig. 2A). No posterior distribution contained a regime with no
rate shifts (compared to an expected frequency of 50% under the
prior).
The most frequent core shift (i.e., shifts occurring above the
background rate; marginal odds ratio > 10), occurred at the base
of Cercopithecidae (Fig. 2C, shift i). This shift was observed
across 70.7% of the cumulative posterior distribution of all four
phylogenies, and was the most frequent core shift on three of
four phylogenies, and the second most frequent on the remain-
ing tree (Fig. S2). This rate shift configuration also showed the
largest mean branch-specific Bayes factor (marginal odds ratio),
across the primate tree (Fig. 2B). A rate shift at the base of Simi-
iformes was the second most frequent core shift (Fig. 2C, shift
ii), occurring in 29.4% of the posterior distribution of evolution-
ary regimes, and the most frequently reconstructed rate shift on
one tree (“AH” divergence times, and see Fig. S1). Some rate
shift configurations included a core shift at the base of Platyrrhini
(8.0% of the posterior distribution) or Lepilemuridae (8.4% of
the posterior distribution), alongside one of the two primary rate
shifts within cercopithecids or Simiiformes (Fig. S2). However,
these did not occur within all four phylogenies. Once excluding
non-core shifts (marginal odds ratio < 10), a model of no dis-
crete rate shifts represented only 1.1% of rate shift configurations
(Fig. S1).
All evolutionary rate regimes showed an increase in net diver-
sification rates through time (Fig 2, Fig. S1, and Table 1). Across
the highest posterior probability regime, cercopithecids exhibited
an increase in net lineage diversification compared to noncerco-
pithecids evolving under the root evolutionary regime (Fig. 2D).
While cercopithecids exhibited a moderate increase in the rate
of speciation (Fig. 2D), they also showed a slower acceleration
of speciation through time (Table 1). Rather, the increased net
diversification rate is largely attributable to a substantial decrease
in the rate of extinction (6.67–13.4% of the root extinction rate
across the four phylogenies; Fig. 2D).
MACROEVOLUTIONARY COHORTS
Patterns of lineage diversification in Primates were dominated
by two macroevolutionary cohorts, one representing the root
rate regime, and another occupied exclusively by cercopithe-
cids (Fig. 3A). Noncercopithecid Simiiformes showed the high-
est phylogenetic-uncertainty associated with cohort analyses
(Fig. 3B), with intermediate average posterior probabilities and
an overall greater likelihood of belonging to the root regime.
AGE-SPECIES RICHNESS RELATIONSHIPS
We found no significant relationship between crown age and
species richness within families, whether analyses were based
on the full species sampling (Table 2; Fig. 4A), or only those
lineages present in the phylogenies (P-values 0.62–0.70; slope
values 0.00616–0.00768). Comparatively, when a stringent, time-
based criterion was used to select “families” (i.e., all subclades
where stem age > time h > crown age), clade age and species
richness were significantly and positively correlated across all
EVOLUTION JUNE 2017 1 6 0 7

J. H. ARBOUR AND S. E. SANTANA
0 35
Absolute latitude (degrees)D
ensi
ty0 5 10 15 20 25 30 35
0.00
0.04
0.08
0.12
0 5 10 15 20 25 30 35
0.00
0.04
0.08
0.12
1.3 6.9
log [geographic range (sq. km)]
Den
sity
0 1 2 3 4 5 6 7
0.0
0.1
0.2
0.3
0.4
0.5
0 1 2 3 4 5 6 7
0.0
0.1
0.2
0.3
0.4
0.5
0 4.1
Den
sity
0 1 2 3 4
0.0
0.2
0.4
0.6
0.8
Degree of sympatry0 1 2 3 4
0.0
0.2
0.4
0.6
0.8
A
B
C
= cercopithecids= non-cercopithecids
= cercopithecids= non-cercopithecids
= cercopithecids= non-cercopithecids
5 10 15 20
0.5
1.0
1.5
2.0
Absolute latitude (degrees)
Log(
Spe
cies
Ric
hnes
s)3.5 4.0 4.5 5.0 5.5
0.5
1.0
1.5
2.0
log [geographic range (sp. km)]Lo
g(S
peci
es R
ichn
ess)
0.0 0.1 0.2 0.3 0.4 0.5 0.6
0.5
1.0
1.5
2.0
Degree of sympatry
Log(
Spe
cies
Ric
hnes
s)
Figure 6. Comparison of macroevolutionary cohorts and geographic distribution of 334 primate species. Variables from top to bottom
are, (A) absolute latitude of the centroid of the species distribution, (B) geographic range size (area in log (km2)), (C) degree of sympatry
measured as the total overlapping area of all congenerics scaled by the range size of the species. Left column: phenogram of geographic
distribution variables on the AS primate phylogeny (ancestral values estimated under BM). Red node indicates the origin of Cercopitheci-
dae, Middle column: density histogram of geographic variables within cercopithecids (blue) and other primate clades (red). Right column:
log of species richness compared to the mean value of each geographic variable per time-based subclade (cercopithecid = blue, other
primate clades = red).
phylogenies for h = median family crown age (Table 2;
Fig. 4B). Almost all alternative values of h (h + 5Ma to h –
5 Ma before present) also showed a significant and positive re-
lationship between richness and age, with the exception of two
early values (+5Ma) where sample size was small and h was older
than almost all primate families (Table S2). A time-based taxo-
nomic criterion (h = median family crown age) preserved most
simian families (all except Pitheciidae), but subdivided families in
Strepsirrhini as well as Tarsiidae (Fig. 4B). This indicates a simian
bias in taxonomic classification systems. Based on the stringent,
time-based definitions of primate families, cercopithecids were
unusually species rich for their crown age (i.e., showed very large,
1 6 0 8 EVOLUTION JUNE 2017
A SHIFT IN PRIMATE DIVERSIFICATION
positive residuals across all trees, see Fig. 4B). Removal of cer-
copithecids from either PGLS analyses did not alter the signifi-
cance of the relationships, which also remained positive (results
not shown).
PHYLOGENETIC IMBALANCE
Phylogenetic imbalance, measured as the variance in species di-
versity among lineages through time using DVI (see methods),
showed that all primate phylogenies examined were significantly
more imbalanced than expected under a constant rate birth-death
process (Table 3). Allowing for time-variable speciation rates (a
nonshift BAMM model) increased some, but not all, P-values
(Ppp = 0.012 – 0.105). Only by including a diversification rate
shift among cercopithecids did all phylogenies show nonsignifi-
cant DVI values (Table 3). Phylogenetic imbalance plots also il-
lustrate the considerably greater similarity between the observed
PI values and those simulated under a rate shift process, when
compared with a simple birth-death process (Fig. 5). Observed
and median simulated imbalance values were nearly identical
over the posterior third of the phylogeny when a shift in diversifi-
cation rate was incorporated into the null, simulated distribution
(Fig. 5B, dashed vs dark lines).
SPECIES RICHNESS—GEOGRAPHIC DISTRIBUTION
RELATIONSHIPS
Compared to other primates, extant cercopithecids are char-
acterized by living at slightly lower latitudes, having slightly
larger geographic ranges, and being highly sympatric with con-
generics (on average). However, they overlap substantially with
other primate clades in all three variables (Fig. 6, middle). Af-
ter accounting for phylogenetic relatedness using PGLS, the de-
gree of sympatry was the only variable significantly associated
with subclade species richness (Table 4). However, this posi-
tive relationship was primarily driven by the high value ob-
served in Cercopithecidae (Fig. 6C, right), and removing this
outlier resulted in nonsignificant relationships across all vari-
ables. Furthermore, accounting for the higher species richness
observed within older clades (Fig. 4, Table 2) also led to a non-
significant relationship between sympatry and species richness
(Table 4). Highly sympatric species within Cercopithecidae
were also largely clustered within Cercopithecus and Macaca
(Fig. 6C left), and subclades with high average values for sym-
patry tended to be older (>5 Ma). Interestingly, after accounting
for the impact of clade age, more diverse clades tended to be
characterized by geographic centroids located in more temperate
latitudes (Table 4), but a significant relationship between lati-
tude and species richness was only observed for two of the four
phylogenies (Table 4; IS and IH).
DiscussionWe investigate patterns of species richness, phylogenetic imbal-
ance, and diversification rate heterogeneity in Primates, a species
rich and ecologically diverse clade of mammals. We found that
the distribution of species richness in Primates is partially ex-
plained by the relative ages of different lineages; older primate
lineages tended to contain more species, at least when taxo-
nomic groups are defined under a consistent, time-based paradigm
(Fig. 4B; Table 2). However, when modern “family” level defi-
nitions are considered, age does not contribute to the species
diversity of primate families (Fig. 4A; Table 2). This discrepancy
in age-species richness relationships may result from bias intro-
duced by how families are defined (e.g., to maintain a consistent
amount of morphological disparity per clade) (Stadler et al. 2014).
This is likely the case in Primates; we found a strong phylogenetic
bias when taxonomic families were subdivided using a consistent
time criterion (e.g., strepsirrhines and Tarsiidae, whereas simian
families were conserved). Alternatively, age-species richness re-
lationships may have varied through time or been obscured by the
effect of extinction, as the time-based criterion we used resulted
in examining a narrowed temporal range (Fig. 4). When patterns
of phylogenetic imbalance across the whole primate phylogeny
were examined, they differed significantly from those patterns
expected under a constant rate model of speciation-extinction dy-
namics (Fig. 5, Table 3), suggesting that clade age is an insufficient
explanation for the uneven distribution of species diversity across
Primates.
Using a Bayesian MCMC analyses that specifically permit-
ted a mixture of evolutionary rate regimes with variable and time-
dependent speciation and extinction rates (Rabosky 2014), we
found strong support for an evolutionary rate shift among cerco-
pithecids. Increased diversification rates were largely driven by
substantially lower extinction rates within this family, with only
moderate increases in speciation rate. Interestingly, some previ-
ous studies have suggested changes in diversification dynamics
in cercopithecids (among other families), a pattern generally at-
tributed to increased speciation rates (Purvis et al. 1995; Fabre
et al. 2009). These studies utilized methods that detect discrete
rate shifts occurring within a constant rate birth-death process,
which would not have accounted for the general increase in di-
versification rates through time in Primates. Rather, when we
incorporate both time-based and clade-based processes into our
analyses, we find that a difference in extinction rates is the most
important distinction between cercopithecids and other primate
diversification patterns.
Cercopithecidae is the most species rich primate family
and represents �30% of all extant primate species (Perelman
et al. 2011; Springer et al. 2012; Finstermeier et al. 2013; IUCN
2015). The position of the evolutionary rate shift detected by our
EVOLUTION JUNE 2017 1 6 0 9
J. H. ARBOUR AND S. E. SANTANA
analyses is consistent with the unusually high species diversity
of cercopithecids relative to their age (Fig. 4). Diversification dy-
namics within Primates may therefore be characterized by two
macroevolutionary rate regimes, one predominantly influenced
by a trend of increasing diversification toward the present, and a
second with more temporally stable but greatly increased diver-
sification rates. This scenario contrasts with a previous BAMM
analysis of another major mammalian clade, Chiroptera (Shi and
Rabosky 2015). This study found that significant evolutionary
rate heterogeneity was limited to a subclade (Stenodermatinae),
that most bat lineages could be attributed to a global pattern of de-
celerating diversification rates, and that diversification rates and
speciation rates were strongly associated. These differences be-
tween Primates and bats illustrate how major mammalian clades
may be defined by very different macroevolutionary processes,
even when both exhibit positive clade age–-species richness rela-
tionships.
The Bayesian analysis presented here revealed a pattern of
dramatically decreased extinction rates among cercopithecids. It
is important to note, however, that while the BAMM analyses
used herein incorporate incomplete lineage sampling, they do
not include fossil taxa (Rabosky 2014; Rabosky et al. 2014b,
2015). The reliability of extinction rates estimated from molec-
ular phylogenies, which lack fossil taxa, remains controversial
(Rabosky 2010, 2015; Beaulieu and O’Meara 2015), and thus the
difference in extinction rates between the two macroevolutionary
regimes should be interpreted with caution. However, a consid-
erable and disproportionate bias in the fossil record for primate
lineages would be necessary to significantly alter the patterns
of diversification observed here. Rather, fossil records from the
palaeobiology database (https://paleobiodb.org), which is albeit
a geographically and temporally biased sample, present numer-
ous and diverse extinct prosimian species (e.g., Adapiformes and
Omomyiformes), and noncercopithecid simians (Springer et al.
2012). Furthermore, previous analyses using different diversifi-
cation models have also shown reduced extinction among cerco-
pithecids compared to the background primate rate (Rolland et al.
2014).
The uneven distribution of species diversity in Primates could
not be completely explained by clade age (Fig. 5, Table 3). Nev-
ertheless, when a shift in cercopithecid diversification rates was
incorporated into simulated phylogenies, we consistently found a
nonsignificant difference with the observed phylogenetic imbal-
ance of Primates, even across several divergence time scenarios
(Table 3; Fig. 5). Therefore, significant rate heterogeneity across
this global mammalian radiation contributes to the uneven distri-
bution of species in modern taxa.
Geographic distribution did not explain the allocation of
species diversity across primate subclades, especially once ac-
counting for the influence of a rate shift among cercopithecids
and for the impact of clade age on species richness (Table 4,
Fig. 6). The lack of association between species richness and
latitude in Primates is comparable to the results of recent diversi-
fication rate analyses in birds, mammals, and among several other
clades (Soria-Carrasco and Castresana 2012; Rabosky et al. 2015;
Sanchez-Ramirez et al. 2015; Marin and Hedges 2016; Schluter
2016). Comparatively, Rolland et al. (2014) found an association
between high speciation and low extinction rates in tropical (vs
temperate) species in several mammalian clades, including Pri-
mates. This may have been partly driven by diversification pat-
terns among cercopithecids, which showed poor support (�AICs
< 2) for differing tropical versus temperate speciation rates (Rol-
land et al. 2014); a latitudinal pattern across Primates may have
been biased by the high evolutionary rates of the somewhat more
tropical Cercopithecidae (Fig. 6A, middle). Interestingly, after
accounting for the impact of clade age and a rate shift among
cercopithecids, higher subclade species richness was marginally
associated (significant across some but not all phylogenies;
Table 4) with more temperate latitudes, opposite to predictions
based on Rolland et al. (2014). The state-based speciation and
extinction (“-SSE”) class of diversification models (i.e., GeoSSE,
BiSSE, etc.) appear to have a propensity toward elevated type I
error rates (Maddison et al. 2007; Goldberg et al. 2011; Rabosky
and Goldberg 2015; Beaulieu and O’Meara 2016). Such methods
may be particularly weak in cases where a single subclade diver-
sifies at a different rate from the “background” process (Rabosky
and Goldberg 2015), as appears to be the case within Primates.
While larger geographic range sizes have been previously as-
sociated with increased speciation in Primates (Gomez and Verdu
2012), we found no relationship between range size and species
richness (Table 4), and the distribution of range sizes in cercop-
ithecids was very similar to that of other primate clades (Fig. 6B,
middle). Lastly, while allopatric speciation has been proposed as a
major mode of divergence in Primates (possibly through cycles of
waxing and waning habitats; Gomez and Verdu 2012; Guschan-
ski et al. 2013; Kamilar and Martin 2009), clades with a higher
degree of sympatry were found to be more species rich on av-
erage. Nevertheless, the significance of this pattern was entirely
driven by the usually high range overlap between congenerics in
Cercopithecidae (Table 4; Fig. 6C, right). Overall, the geographic
parameters examined here were insufficient to explain patterns of
species richness across Primates. It is possible that the geographic
distribution of modern species does not reflect the conditions un-
der which speciation occurred (Barraclough 1998; Losos and Glor
2003). For example, the degree of sympatry is expected to increase
with clade age even under a paradigm of solely parapatric speci-
ation (Barraclough 1998), and the positive relationship between
sympatry and species richness was weakened when age-corrected
subclade values were used. However, the increased incidence of
highly sympatric species among cercopithecids (Fig. 6C, middle
1 6 1 0 EVOLUTION JUNE 2017

A SHIFT IN PRIMATE DIVERSIFICATION
and right) is somewhat suggestive that ecological or social factors
may have contributed to the faster rates of evolution in this highly
diversifying clade. Previous work has associated the complexity
of facial coloration, which may be useful to individual and species
recognition, with higher sympatry and social group size in catar-
rhine primates (Santana et al. 2013). Thus, it is possible that the
evolution of socially relevant phenotypes could have facilitated
cercopithecid diversification. This hypothesis requires further ex-
ploration, especially in light of the considerable overlap in degree
of sympatry between the two macroevolutionary regimes, and the
broad variation in facial features and social systems in cercopithe-
cids. Geographic data at finer resolution and addressing sympatry
at the ecosystem level may also be necessary to fully address their
impact on primate diversification.
It is also possible that diversification rates among Primates
have been influenced by ecological or habitat opportunities. A
previous analysis of the evolution of climatic niches found a
greater number of diversification rate shifts among cercopithe-
cids than any other primate clade (Duran and Pie 2015), sug-
gesting that these shifts may be related to the presence of more
variable climatic environments (e.g., montane regions, or ecosys-
tems with monsoons). Gomez and Verdu (2012) also suggest that
mutualistic ecological interactions with plants increases specia-
tion rates, possibly through associated expansions in range size.
Thus, increased lineage diversification rates may have also been
enabled by traits that permitted expansion into a wider variety
of habitats and climatic niches. It is important to note that the
diversification rates estimated here under the BAMM framework
are based on an assumption of discrete shifts in evolutionary
rates. While BAMM provides a robust MCMC framework for
diversification pattern estimation, some processes may be better
described by changes in rates distributed over several nodes (Ra-
bosky 2014; Burin et al. 2016). Future studies should investigate
diversification rates in an explicit ecological or community con-
text to elucidate if ecological or environmental factors (or a com-
bination thereof) explain the extreme divergence in macroevo-
lutionary patterns between cercopithecids and other primate
clades.
The comparative analyses presented here illustrate that both
age and a pattern of heterogeneous diversification rates explain
the uneven distribution of modern species diversity across pri-
mate clades. While some previous studies have linked diversifica-
tion patterns in Primates to biogeographical variables, we found
no association between species richness and major geographic
factors such as latitude, range size, or range overlap. Incorpo-
rating information about habitat, ecology, behavior, or innova-
tions may be necessary to explain the remarkable diversity of the
most species rich family of Primates. Reduced extinction rates,
potentially stemming from favorable ecological conditions, ap-
pear to have facilitated the high species diversity of Old World
monkeys compared to other primate clades. Primates exhibit a
particularly high incidence of endangered species compared to
other mammal orders (Jernvall and Wright 1998; IUCN 2015),
and our analyses indicate that different clades have experienced
vastly different extinction rates. The potential impact of this evo-
lutionary history on the conservation risk of different primate
clades is unknown and deserves further investigation. Further
studies are also necessary to elucidate the causes of the high
diversification rate (and potentially low extinction rate) of cerco-
pithecids. This will improve our understanding of the origin of
species diversity in this clade, and across the global radiation of
Primates.
AUTHOR CONTRIBUTIONSS. Santana and J. Arbour conceived of and designed the study. J. Arbourcarried out and summarized the analyses. J. Arbour and S. Santana wrotethe manuscript.
ACKNOWLEDGMENTSThis work was funded by the University of Washington and the Na-tional Science Foundation (award #1557125) to S.E.S. We are gratefulto R. Kelly, L. Miller, and K. Stanchak for comments on a draft of themanuscript, and to two anonymous reviewers for suggestions that im-proved our analyses and interpretations.
DATA ARCHIVINGThe doi for our data is doi:10.5061/dryad.q51ph.
LITERATURE CITEDBarraclough, T. G. 1998. Revealing the factors that promote speciation. Philos.
Trans. R. Soc. B Biol. Sci. 353:241–249.Beaulieu, J. M., and B. C. O’Meara. 2015. Extinction can be estimated from
moderately sized molecular phylogenies. Evolution 69:1036–1043.———. 2016. Detecting hidden diversification shifts in models of trait-
dependent speciation and extinction. Syst. Biol. 65:583–601.Bloom, D. D., M. Fikacek, and A. E. Z. Short. 2014. Clade age and diversi-
fication rate variation explain disparity in species richness among waterscavenger beetle (Hydrophilidae) lineages. PLoS One 9:e98430.
Burin, G., W. D. Kissling, P. R. Guimaraes, C. H. Sekercioglu, and T. B.Quental. 2016. Omnivory in birds is a macroevolutionary sink. Nat.Commun. 7:11250.
Dunbar, R., and I. MacDonald. 2013. Primate social systems. Springer Science& Business Media, New York.
Duran, A., and M. R. Pie. 2015. Tempo and mode of climatic niche evolutionin Primates. Evolution 69:2496–2506.
Eeley, H. A. C., and R. A. Foley. 1999. Species richness, species range size andecological specialisation among African primates: geographical patternsand conservation implications. Biodivers. Conserv. 8:1033–1056.
Fabre, P. H., A. Rodrigues, and E. J. P. Douzery. 2009. Molecular phylogenet-ics and evolution patterns of macroevolution among primates inferredfrom a supermatrix of mitochondrial and nuclear DNA. Mol. Phylogenet.Evol. 53:808–825.
Fahy, G. E., M. Richards, J. Riedel, J.-J. Hublin, and C. Boesch. 2013. Stableisotope evidence of meat eating and hunting specialization in adult malechimpanzees. Proc. Natl. Acad. Sci. USA 110:5829–5833.
EVOLUTION JUNE 2017 1 6 1 1

J. H. ARBOUR AND S. E. SANTANA
Finstermeier, K., D. Zinner, M. Brameier, M. Meyer, E. Kreuz, M. Hofreiter,and C. Roos. 2013. A mitogenomic phylogeny of living Primates. PLoSOne 8:1–10.
Goldberg, E. E., L. T. Lancaster, and R. H. Ree. 2011. Phylogenetic inferenceof reciprocal effects between geographic range evolution and diversifi-cation. Syst. Biol. 60:451–465.
Gomez, J. M., and M. Verdu. 2012. Mutualism with plants drives primatediversification. Syst. Biol. 61:567–577.
Grafen, A. 1989. The phylogenetic regression. Philos. Trans. R. Soc. B326:119–157.
Gregorin, R., and M. De Vivo. 2013. Revalidation of Saguinus ursula Hoff-mannsegg (Primates: Cebidae: Callitrichinae). Zootaxa 3721:172–182.
Guschanski, K., J. Krause, S. Sawyer, L. M. Valente, S. Bailey, K. Finster-meier, R. Sabin, E. Gilissen, G. Sonet, Z. T. Nagy, et al. 2013. Next-generation museomics disentangles one of the largest primate radiations.Syst. Biol. 62:539–554.
IUCN. 2015. The IUCN red list of threatened species. Version 2015-4.Jernvall, J., and P. C. Wright. 1998. Diversity components of impending
primate extinctions. Proc. Natl. Acad. Sci. USA 95:11279–11283.Kamilar, J. M., and S. K. Martin. 2009. Combining biogeographic and phy-
logenetic data to examine Primate speciation: an example using Cerco-pithecin monkeys. Biotropica 41:514–519.
Lefebvre, L., S. M. Reader, and D. Sol. 2004. Brains, innovations and evolutionin birds and primates. Brain. Behav. Evol. 63:233–246.
Lei, R., A. T. Mclain, C. L. Frasier, J. M. Taylor, C. A. Bailey, S. E. Engberg, A.L. Ginter, S. D. Nash, R. Randriamampionona, C. P. Groves, et al. 2015.A new species in the genus Cheirogaleus (Cheirogaleidae). 2015:1–12.
Li, C., C. Zhao, and P.-F. Fan. 2015. White-cheeked macaque (Macacaleucogenys): a new macaque species from Medog, southeastern Tibet.Am. J. Primatol. 77:753–766.
Losos, J. B., and R. E. Glor. 2003. Phylogenetic comparative methods and thegeography of speciation. Trends Ecol. Evol. 18:220–227.
Maddison, W. P., P. E. Midford, and S. P. Otto. 2007. Estimating a binarycharacter’s effect on speciation and extinction. Syst. Biol. 56:701–710.
Marin, J., and S. B. Hedges. 2016. Time best explains global variationin species richness of amphibians, birds and mammals. J. Biogeogr.43:1069–1079.
Marsh, L. K. 2014. A taxanomic revision of the Saki Monkeys, Pithecia Des-marest, 1804. Neotrop. Primates, IUCN/SSC Primate Spec. Gr. 21:1–82.
McPeek, M. A., and J. J. M. Brown. 2007. Clade age and not diversificationrate explains species richness among animal taxa. Am. Nat. 169:E97–E106.
Meredith, R. W., J. E. Janecka, J. Gatesy, O. A. Ryder, C. A. Fisher, E. C.Teeling, A. Goodbla, E. Eizirik, T. L. L. Simao, T. Stadler, et al. 2011.Impacts of the Cretaceous terrestrial revolution and KPg extinction onmammal diversification. Science 334:521–524.
Mitchell, J. S., and D. L. Rabosky. 2016. Bayesian model selection withBAMM: effects of the model prior on the inferred number of diversifi-cation shifts. Methods Ecol. Evol. 8:37–46.
Moore, B. R., S. Hohna, M. R. May, B. Rannala, and J. P. Huelsenbeck. 2016.Critically evaluating the theory and performance of Bayesian analysisof macroevolutionary mixtures. 113:9569–9574.
Morlon, H. 2014. Phylogenetic approaches for studying diversification. Ecol.Lett. 17:508–525.
Munds, R. A., K. A. I. Nekaris, and S. M. Ford. 2013. Taxonomy of theBornean slow Loris, with new species Nycticebus kayan (Primates,Lorisidae). Am. J. Primatol. 75:46–56.
Perelman, P., W. E. Johnson, C. Roos, H. N. Seuanez, J. E. Horvath, M. A. M.Moreira, B. Kessing, J. Pontius, M. Roelke, Y. Rumpler, et al. 2011. Amolecular phylogeny of living primates. PLoS Genet. 7:1–17.
Purvis, A., S. Nee, and P. H. Harvey. 1995. Macroevolutionary inferencesfrom primate phylogeny. Proc. R Soceity B 260:329–333.
Pyron, R. A., and F. T. Burbrink. 2013. Phylogenetic estimates of speciationand extinction rates for testing ecological and evolutionary hypotheses.Trends Ecol. Evol. 28:729–736.
Rabosky, D. L. 2014. Automatic detection of key innovations, rate shifts, anddiversity-dependence on phylogenetic trees. PLoS One 9:e89543.
———. 2015. Challenges in the estimation of extinction from molecularphylogenies: a response to Beaulieu and O’Meara. Evolution 79:218–228.
———. 2010. Extinction rates should not be estimated from molecular phy-logenies. Evolution 64:1816–1824.
Rabosky, D. L., S. C. Donnellan, M. Grundler, and I. J. Lovette. 2014a.Analysis and visualization of complex macroevolutionary dynamics: anexample from Australian Scincid lizards. Syst. Biol. 63:610–627.
Rabosky, D. L., and R. E. Glor. 2010. Equilibrium speciation dynamics in amodel adaptive radiation of island lizards. Proc. Natl. Acad. Sci. USA107:22178–22183.
Rabosky, D. L., and E. E. Goldberg. 2015. Model inadequacy and mistakeninferences of trait-dependent speciation. Syst. Biol. 64:340–355.
Rabosky, D. L., M. Grundler, C. Anderson, P. Title, J. J. Shi, J. W. Brown,H. Huang, and J. G. Larson. 2014b. BAMMtools: an R package for theanalysis of evolutionary dynamics on phylogenetic trees. Methods Ecol.Evol. 5:701–707.
Rabosky, D., J. S. Mitchell, J. Chang. 2017. Is BAMM flawed? Theoretical andpractical concerns in the analysis of multi-rate diversification models.Syst. Biol. Early View, DOI: 10.1093/sysbio/syx.
Rabosky, D. L., G. J. Slater, and M. E. Alfaro. 2012. Clade age and speciesrichness are decoupled across the eukaryotic tree of life. PLoS Biol.10:e1001381.
Rabosky, D. L., P. O. Title, and H. Huang. 2015. Minimal effects of latitudeon present-day speciation rates in New World birds. Proc. R Soc. B Biol.Sci. 282:20142889.
Rolland, J., F. L. Condamine, F. Jiguet, and H. Morlon. 2014. Faster specia-tion and reduced extinction in the tropics contribute to the mammalianlatitudinal diversity gradient. PLoS Biol. 12:e1001775.
Sanchez-Ramirez, S., R. S. Etienne, and J. M. Moncalvo. 2015. High specia-tion rate at temperate latitudes explains unusual diversity gradients in aclade of ectomycorrhizal fungi. Evolution 69:2196–2209.
Santana, S. E., J. L. Alfaro, A. Noonan, and M. E. Alfaro. 2013. Adaptiveresponse to sociality and ecology drives the diversification of facialcolour patterns in catarrhines. Nat. Commun. 4:2765.
Schluter, D. 2016. Speciation, ecological opportunity, and latitude. Am. Nat.187:1–18.
Shi, J. J., and D. L. Rabosky. 2015. Speciation dynamics during the globalradiation of extant bats. Evolution 69:1528–1545.
Sibley, C. G., and J. E. Ahlquiest. 1990. Phylogeny and classification of birds.Yale University Press, New Haven, CT, USA.
Slater, G. J., and M. W. Pennell. 2014. Robust regression and posterior predic-tive simulation increase power to detect early bursts of trait evolution.Syst. Biol. 63:293–308.
Slater, G. J., S. A. Price, F. Santini, and M. E. Alfaro. 2010. Diversity versusdisparity and the radiation of modern cetaceans. Proc. R. Soc. B 3097–3104.
Soria-Carrasco, V., and J. Castresana. 2012. Diversification rates and thelatitudinal gradient of diversity in mammals. Proc. R. Soc. B Biol. Sci.279:4148–4155.
Springer, M. S., R. W. Meredith, J. Gatesy, C. A. Emerling, J. Park, D. L.Rabosky, T. Stadler, C. Steiner, O. A. Ryder, J. E. Janecka, et al. 2012.Macroevolutionary dynamics and historical biogeography of primatediversification inferred from a species supermatrix. PLoS One 7:e49521.
1 6 1 2 EVOLUTION JUNE 2017

A SHIFT IN PRIMATE DIVERSIFICATION
Stadler, T. 2011. Mammalian phylogeny reveals recent diversification rateshifts. Proc. Natl. Acad. Sci. 108:6187–6192.
Stadler, T., D. L. Rabosky, R. E. Ricklefs, and F. Bokma. 2014. On age andspecies richness of higher taxa. Am. Nat. 184:447–455.
Thiele, D., E. Razafimahatratra, and A. Hapke. 2013. Discrepant partition-ing of genetic diversity in mouse lemurs and dwarf lemurs—biologicalreality or taxonomic bias? Mol. Phylogenet. Evol. 69:593–609.
Thinh, V. N., A. R. Mootnick, V. N. Thanh, T. Nadler, and C. Roos. 2010.A new species of crested gibbon, from the central Annamite mountainrange. Vietnamese J. Primatol. 1:1–12.
Tran, L. A. P. 2014. The role of ecological opportunity in shaping disparatediversification trajectories in a bicontinental primate radiation. Proc. RSoc. B 281:20131979.
Wiens, J. 2011. The causes of species richness patterns across space, time andclades and the role of “ecological limits.” Q. Rev. Biol. 83:153–169.
Yang, Z. 2007. PAML 4: phylogenetic analysis by maximum likelihood. Mol.Biol. Evol. 24:1586–1591.
Associate Editor: M. AlfaroHandling Editor: P. Tiffin
Supporting InformationAdditional Supporting Information may be found in the online version of this article at the publisher’s website:
Fig. S1: Primate species diversity across latitude.Fig. S2: Prior (black) and posterior (grey) distributions of rate shifts under an expected number of shifts of a) 0.1 and b) 10, across all four phylogenies.Fig. S3: All distinct shift configurations (shifts with marginal odds ratio > 10) found on at least 5% of samples from the posterior distribution ofdiversification rate shifts across Primates (rows = results of BAMM analyses on each of the four phylogenies from Springer et al 2012).Table S1: Effective sample sizeTable S2: Analysis of clade-age species richness relationships based on stringent time-based definition of “families” on each of the four primatephylogenies.
EVOLUTION JUNE 2017 1 6 1 3