A LOOK INTO THE FUTURE OF THE GLOBAL WTE INDUSTRY · A LOOK INTO THE FUTURE OF THE GLOBAL WTE...
24
The future is already happening A LOOK INTO THE FUTURE OF THE GLOBAL WTE INDUSTRY Nickolas J. Themelis, Director, Earth Engineering Center, Columbia University, Chair, Global WTERT Council (GWC)
Transcript of A LOOK INTO THE FUTURE OF THE GLOBAL WTE INDUSTRY · A LOOK INTO THE FUTURE OF THE GLOBAL WTE...

The future is already happening
A LOOK INTO THE FUTURE OF
THE GLOBAL WTE INDUSTRY
Nickolas J. Themelis,
Director, Earth Engineering Center, Columbia University,
Chair, Global WTERT Council (GWC)
• Thermal treatment (WTE): 200 mill. tons
• Sanitary landfill, partial CH4 recovery: 200 mill. tons
• Landfilled without CH4 recovery: >800 mill. Tons
Estimated global disposition of urban post-recycling municipal solid wastes (total: 1.2 billion tons; 2012)
ad
Global Disposition of Urban MSW
Management
All numbers are expected to double by 2030

Text
Goals of waste management
• Destruction of pathogens
• Volume reduction
• Environmental protection
• Mineralization and immobilization of hazardous substances
• Resource conservation
• Public acceptance
• Affordable capital cost
Goals of waste management (Brunner)
WTE meets these criteria, except the last two

Public acceptance of WTE
• The results of early waste incineration were an environmental disaster (Brunner and Zobrist, 1983).
• It has taken a new generation of science, technology, and legislation to perform the quantum leap that was necessary to improve incineration to the point that it has become WTE and an integral part of sustainable waste management
• However, In the U.S., Canada, and Australia, there is still opposition based on past history.
• It is necessary for industry to use the media and the universities to inform the public and through the public the legislators (“bottom up” approach)

What is affordable cost of WTE?
• Depending on their economic capacity and culture, countries spend between 0.2% and 0.4% of their GDP on MSW management (Brunner and Fellner, 2007).
• Since the per capita GDP ranges from $200-$100,000, there is no uniform solution for all countries when attempting to reach the goals of waste management.
WTERT 2014 Award to South Korea
•With regard to sustainable waste management,
South Korea is ahead of the U.S., although the
ROK GDP per capita = 63% of the U.S. GDP

How South Korea has done it?
Very high levels of recycling, composting and WTE,
achieved in less than 20 years, by means of:
•Planning, policy, regulations, and public
education at national level
•Implementation at municipal level
•Assistance by national/regional agencies to
municipalities in implementing regulations
•Citizen compliance and participation

Only two options to manage post-recycling
wastes:Thermal treatment (WTE) or Sanitary landfill
WTE advantages:
•Destruction of pathogens
•Conservation of land near cities
•Electricity production (>0.5 MW over sanitary LF
•Reduction of GHG emission (0.5-1 ton per ton MSW to WTE
WTE disadvantage: Higher gate fee needed (EEC study on
Latin America)
Global Experience

RESULTS OF THREE LA CASE STUDIES
STUDIES-2
Case Study Toluca,
Mexico
Valparaiso,
Chile
Metro.
Buenos
Aires,
Argentina
Landfilled MSW, tons/year 227,000 360,000 2,900,000
WTE plant capacity, tons/day 480 1,000 3,000
WTE plant annual capacity,
tons/year 158,000 336,000 990,000
Electricity production,
kWh/ton MSW 600 540 600
Electricity to the grid,
MWh/year 96,000 182,000 600,000
Electricity price, US$/MWh 62 90 102

Case Study Toluca,
Mexico
Valparaiso,
Chile
Metro. Buenos Aires,
Argentina
WTE plant capacity, tons/year 158,000 336,000 990,000
CAPEX, $ million 120 225 600
CAPEX, $/ton MSW 750 670 595
OPEX, $ million 7.6 13.1 32
OPEX , $/ton MSW 47.5 39 31.8
Current gate fee, $/ton MSW 13 14 20
Electricity rev., $/ton MSW 37.2 46 61
Metal recovery, $/ton MSW 0.93 3.9 0.96
Carbon Credits, $/ton MSW 5 5 7.7
COMPARISON OF THREE CASE STUDIES
STUDIES-2

• The EEC study in Latin America showed that the total cost (”gate
fee”) of semi-sanitary landfills is about $20 per ton MSW
• By coincidence, this is more than the average difference between WTE nad LF gate fees in the U.S. (Columbia Survey of 2011 data)
• At current CAPEX, for a WTE plant to be economic, it needs a gate fee of at least $40 per ton MSW, plus the electricity revenue.
• The $20/ton difference in gate fee would disappear if the CAPEX of WTE plants can be reduced by $200 per annual ton of capacity
• By coincidence, this is the average difference betwe
Conclusions re WTE for Latin America

• Mass-burn combustion is the oldest and still leading technology for WTE.
• However, its CAPEX per ton MSW has not decreased since the nineties (“learning curve” of industrial experience). More R&D?
• Fluidized bed WTE is coming strong. (Very large investment in R&D by China)
– 5.8% of the global capacity of WTE plants built since 2000
– 45% of plants built from 2001 to 2005 in China (over 40 WTE plants)
12
Olivier Morin
July 2014 Lower CAPEX of WTE??
technologies?

! "#$ %"&'( #"'
Moving grate WTE Circulating fluid bed WTE
Moving grate and CFB WTE
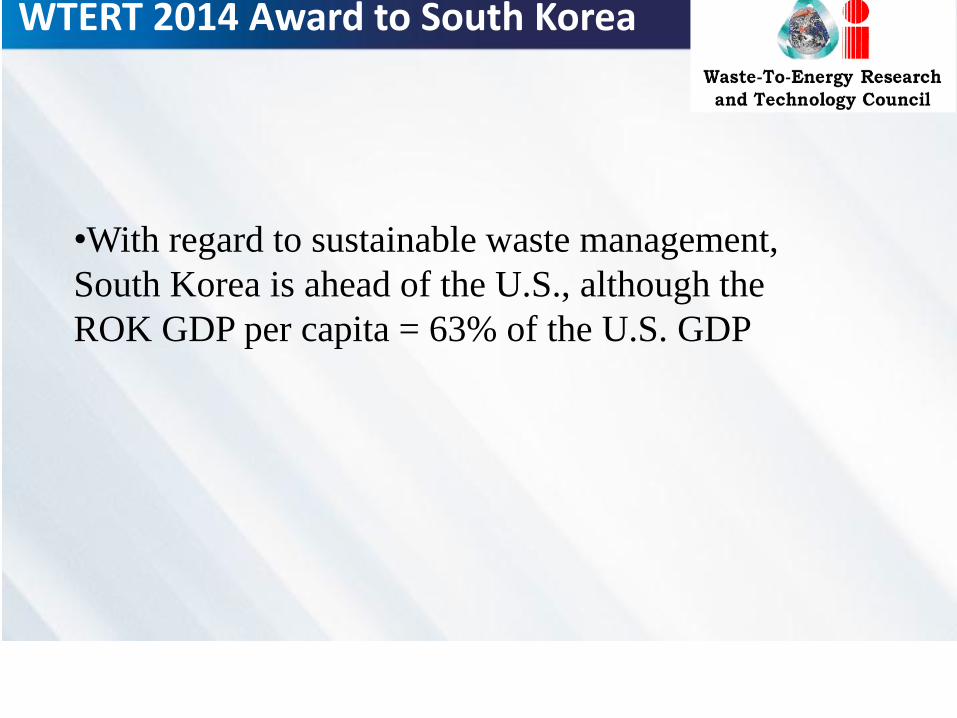
Phenomenal growth of WTE in China
China is now number 1 user of WTE

Difference MSW/biomass and fossil fuels
Fuel % Carbon % Hydrogen % Oxygen Dry wood 47% 5% 40 % Dry MSW 30% 4.5% 27% Fossil fuels 80-85% 7-12 % 0%

Comparison of fossil and “waste"solid fuels
% C N
g/kg S
g/kg Cl
g/kg Cd
mg/kg Hg
mg/kg Pb
mg/kg
Zn mg/k
g
HV MJ/kg
Fuel oil 85% 3 15 0.01 <1 0.01 10 20 41 Anthracite coal 85% 12 10 1.5 1 0.5 80 85 30 Sawdust/wood 47% 0.3 1 0.6 0.8 0.02 3 30 17 Non-recycled plastics 64% 7.9 0.7 17 73 1.3 390 550 35
U.S. MSW 30% 7 4 8.7 11 2 810 1100 11

Capex $/kW of biomass power plants
0
500
1,000
1,500
2,000
2,500
3,000
3,500
4,000
4,500
2005 2010 2015 2020 2025 2030 2035 2040 2045 2050
Cap
ital
Co
st (
20
07
$/
kW)
Year MiniCAM 2008 NREL-SEAC 2008 AEO 2009 MERGE 2009 EPA 2009
• CAPEX of biomass power plants: $2,000-$3000/kW
• CAPEX of recently built WTE in N.A.: $8,200/kW
Tidball R., Bluestein J., Rodriguez N., and Knoke S., 2010. Cost and Performance Assumptions for Modeling
Electricity Generation Technologies. National Renewable Energy Laboratory report, pp. 26

Comparison of power plants
SEMASS
WTE, pre-
shredding
Brescia WTE
moving grate
Union County WTE,
moving grate
Essex Co.
WTE, roller
grate
Archangelsk wood, fluid
bed
Starting year 1988 1998 1994 1990 2001
Capacity, tons/day 910 792 480 845 1584
Heat value of fuel, MJ/kg 11.6 11.3 11.0 11.0 8.7
Height, m 30 22 19 20.42 16.2
Length x width of grate, m2 6 x 11=66 8*12.8=102 7.5*7.8=58 10.7*6=66 6.4*5.8=37
Process gas volume, Nm3/hour 219917 135003 125280 205532 247500
Flue gas flow, Nm3/ton 5800 4091 5653 5200 3750
Gas velocity through chamber, m/s 3.95 2.60 3.91 7.62 7.91
Average minimum residence time, s 7.59 8.45 4.86 2.68 2.05
Heat release, MW/m2 1.86 1.01 1.05 12.9 42.7
Electricity to the grid, MW 23 23 11 18 NA
Net electricity, kWh/ton 610 682 550 513 NA
Thermal efficiency 18.9% 21.7% 18.0% 16.8% NA

Text
Plant Brescia, Italy Zhejiang University, Cixi
Reactor type MG CFB
Starting year 1998 2012
Capacity, tons/day 792 800
Heat value of fuel, MJ/kg 11.3 3.98
Height, m 22 16.8
Grate area, m2 102.4 21.8
Combustion chamber cross section area, m2 62 21.8
Volume of combustion chamber, m3 1,210 366
Process gas volume, Nm3/hour 135,003 85,000
Flue gas flow, Nm3/ton 4,091 2,553
Velocity of gas in main section of chamber, m/s 2.5 4.5
Gas average minimum residence time, s 8.79 3.8
Grate combustion intensity, tons/day/m2 7.73 36.7
Net electricity (kWh/Ton) 682 279
Net electricity generation, MW 23 9.3
Heat release rate, MJ/(h m2) 3,139 6,085
Heat release, MW/m2 1.01 1.69
Net electricity generation, MW/m2 0.22 0.43
Thermal efficiency (heat to electricity) 21.7% 25.2%

CAPEX per ton of annual capacity
0
200
400
600
800
1,000
1,200
1,400
1,600
1,800
2,000
0 100 200 300 400 500 600 700 800 900 1,000
Cap
ital
co
st ,
$/t
on
MSW
WTE capacity, thousand tons MSW
Average of 25 other plants: $880/ton
Average of 21 Chinese plants: $228/ton

WTE fly ash: A future ore?
• APC residues are rich in heavy metals and are more hazardous.
• They are disposed of in underground storages (EU) or mixed with bottom ash (US).
• The latest development in Europe is to extract secondary resources such as iron, aluminum, copper, zinc and other metals from these residues.
• In the future, incineration is likely to become a means to conserve resources by both utilizing energy and recycling materials.

Text
Metal Concentration, ppm Metal Concentration, ppm
Min Max Min Max
Aluminum 25,000 45,000 Copper 1500 5000
Antimony 700 5000 Magnesium 6000 18,000
Arsenic 20 120 Manganese 400 900
Barium 50 200 Sodium 25,000 70,000
Lead 7000 25,000 Nickel 60 300
Cadmium 150 1000 Mercury 0 3
Calcium 100,000 250,000 Silver 30 60
Chrome 100 500 Silicon 50,000 100,000
Cobalt 20 100 Titan 2500 5000
Iron 18,000 55,000 Zinc 20,000 120,000
Potassium 30,000 60,000 Tin 800 3000
Concentration of metals in fly ash**
*Brunner and Rechtberger

27%$
8%$41%$
24%$
Region$1$
23%$
4%$
21%$52%$
Region$2$
24%$
5%$17%$
54%$
Region$3$
15%$ 5%$
4%$
76%$
Region$5$9%$10%$
2%$
79%$
Region$8$
32%$
10%$
3%$
55%$
Region$10$
37%$
10%$
2%$
51%$
Region$9$
11%$
11%$
78%$
Region$6$
22%$2%$
76%$
Region$7$
19%$ 2%$
6%$
73%$
Region$4$
Recycled'
Composted'
Combusted'(WTE)'
Landfilled'
Breakdown$by$EPA$Regions$Recycling, composting, combusting, and landfilling rates by regions

Results of Columbia Survey…..
…will be published in SWANA’s
“MSW Management” this fall
Thank you for attending this lecture!
www.wtert.org