A Lean RACE Model for Continuous Improvement in Four...
17
A Lean RACE Model for Continuous Improvement in Four Possible Directions Hung-da Wan, Associate Professor Department of Mechanical Engineering Center for Advanced Manufacturing and Lean Systems The University of Texas at San Antonio (UTSA) University of Texas at San Antonio (UTSA) 1
Transcript of A Lean RACE Model for Continuous Improvement in Four...
A Lean RACE Model for Continuous Improvement in Four Possible Directions
Hung-da Wan, Associate Professor
Department of Mechanical EngineeringCenter for Advanced Manufacturing and Lean Systems
The University of Texas at San Antonio (UTSA)
University of Texas at San Antonio (UTSA) 1
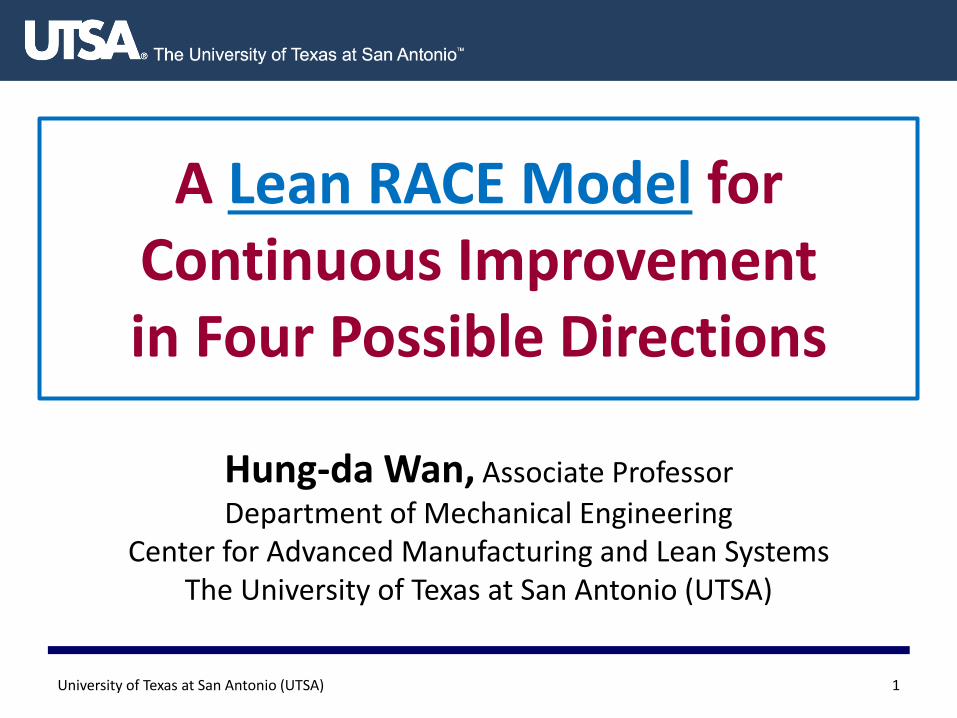
“Current State” mapped.
Now what? How do we identify improvement opportunities?
Which lean tools should be used?
University of Texas at San Antonio (UTSA) 2
?C/T=1 sec
C/O=1 hour
Uptime=85%
27,600 sec. av.
EPE=2weeks
Production Control
MRP
Weekly Schedule Daily Ship
Schedule
I IIIII200 T
Stamping
Staging
ShippingAssembly#2Assembly#1S. Weld#2S. Weld#1
C/T=40 sec
C/O=0
Uptime=100%
2 Shifts
27600 sec. Av.
C/T=62 sec
C/O=0
Uptime=100%
2 Shifts
27600 sec. Av.
C/T=46 sec
C/O=10 min
Uptime=80%
2 Shifts
27600 sec. Av.
C/T=39 sec
C/O=10 min
Uptime=100%
2 Shifts
27600 sec. Av.
Coils
5 days
4600L
2400R
1100L
600R
1600L
850R
1200L
640R
2700L
1440R
Michigan
Steel Co.
18,400 pcs/mo
-12,000 “L”
-6,400 “R”
Tray= 20 pieces
2Shifts
State Street
Assembly
90/60/30 day
Forecasts6 week
Forecast
Daily
Order
Weekly
Fax
Tues.+
Thurs.
1X
Daily
1 1 1 1

The “7+1 Types of Waste” in TPS
University of Texas at San Antonio (UTSA) 3
8 Types of Waste
Defects
Overproduction
Waiting
Non-utilized Resources/Talent
Transportation
Inventory
Motion
Excess Processing
After current state mapped, we often do “Waste Audit” based on Toyota’s 8 wastes.
The 8 types of wastes are “symptoms” of problems, not root causes.
Good starting point, but not necessarily leading to good improvement opportunities.
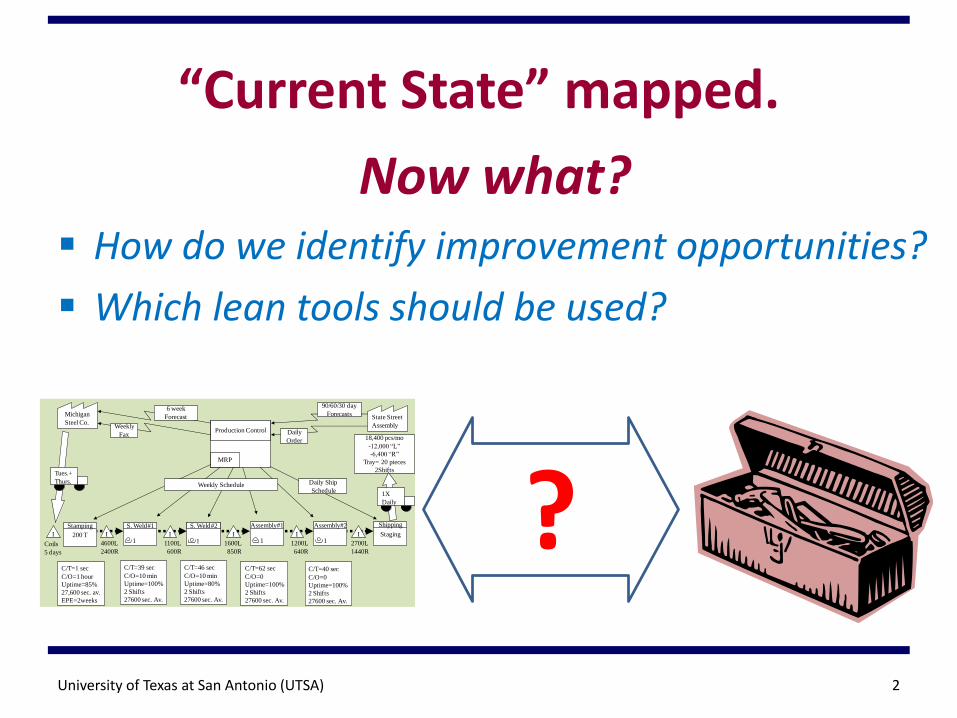
Process Improvement Methods
Lean Daily Management
Value Stream Mapping
Six Sigma’s DMAIC
Deming’s PDCA
A3 + 8 Step
How to prioritize the improvement targets?
How to identify opportunities for improvement?
How to define the target to be measured and analyzed?
How to pick the right target for the problem solving cycle?
How to set correct targets for root cause analysis?
University of Texas at San Antonio (UTSA) 4
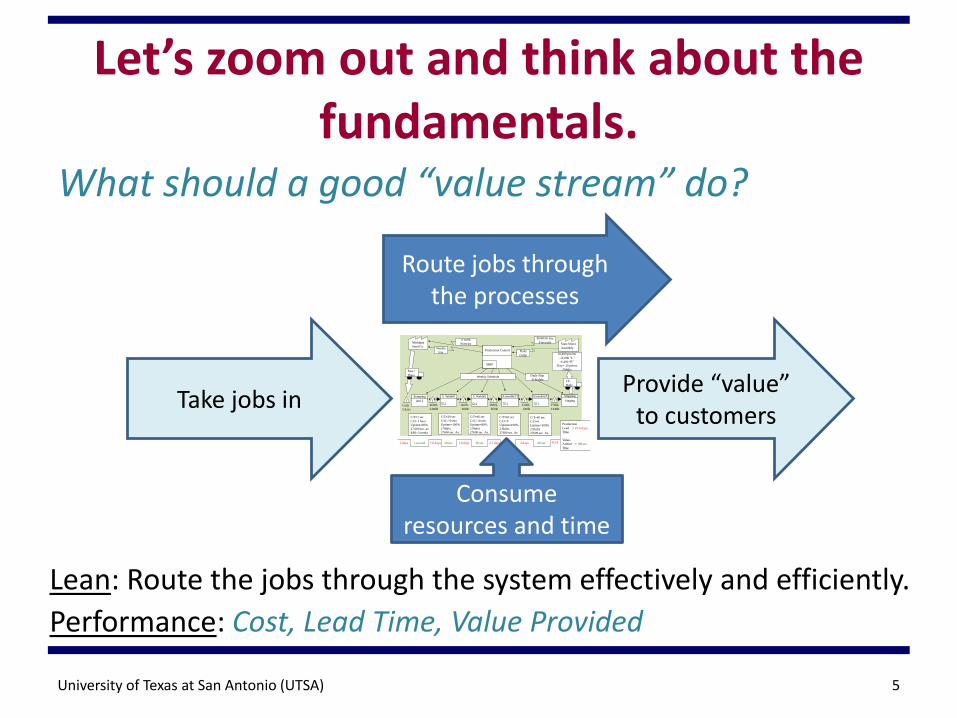
Let’s zoom out and think about the fundamentals.
What should a good “value stream” do?
University of Texas at San Antonio (UTSA) 5
C/T=1 sec
C/O=1 hour
Uptime=85%
27,600 sec. av.
EPE=2weeks
Production Control
MRP
Weekly Schedule Daily Ship
Schedule
I IIIII200 T
Stamping
Staging
ShippingAssembly#2Assembly#1S. Weld#2S. Weld#1
C/T=40 sec
C/O=0
Uptime=100%
2 Shifts
27600 sec. Av.
C/T=62 sec
C/O=0
Uptime=100%
2 Shifts
27600 sec. Av.
C/T=46 sec
C/O=10 min
Uptime=80%
2 Shifts
27600 sec. Av.
C/T=39 sec
C/O=10 min
Uptime=100%
2 Shifts
27600 sec. Av.
Coils
5 days
4600L
2400R
1100L
600R
1600L
850R
1200L
640R
2700L
1440R
Michigan
Steel Co.
18,400 pcs/mo
-12,000 “L”
-6,400 “R”
Tray= 20 pieces
2Shifts
State Street
Assembly
90/60/30 day
Forecasts6 week
Forecast
Daily
Order
Weekly
Fax
Tues.+
Thurs.
1X
Daily
1 1 1 1
5 days 1 second 7.6 days 39 sec. 1.8 days 46 sec. 2.7 days 62 sec. 2 days 40 sec. 4.5 d.
Production
Lead = 23.6 days
Time
Value-
Added = 188 sec.
Time
Take jobs in
Route jobs through the processes
Consume resources and time
Provide “value” to customers
Lean: Route the jobs through the system effectively and efficiently.
Performance: Cost, Lead Time, Value Provided
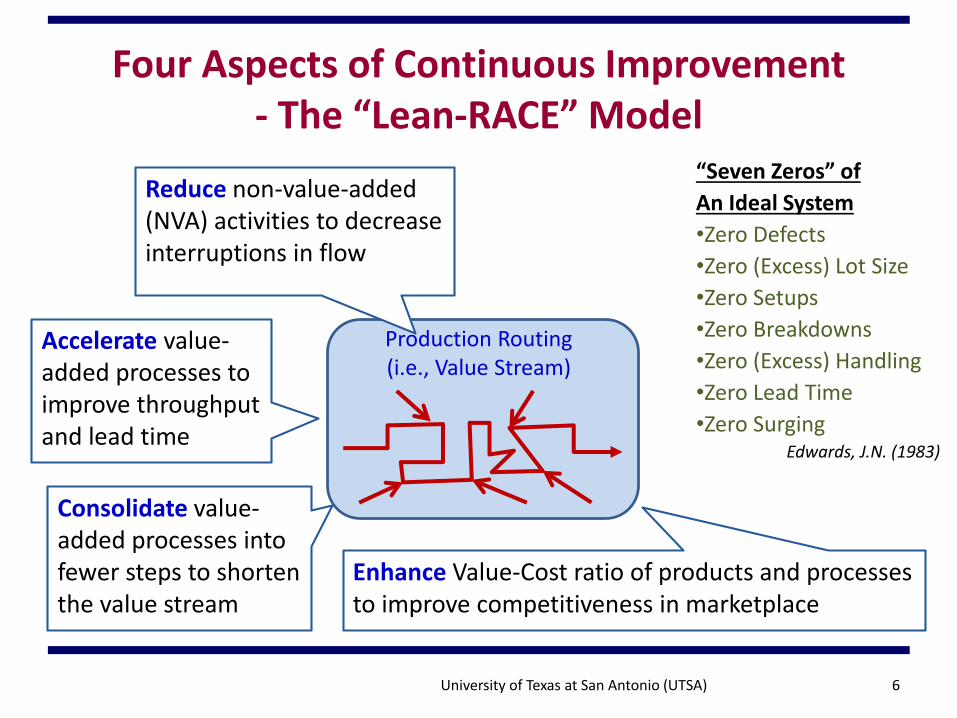
Four Aspects of Continuous Improvement- The “Lean-RACE” Model
6
Production Routing(i.e., Value Stream)
Reduce non-value-added (NVA) activities to decrease interruptions in flow
Accelerate value-added processes to improve throughput and lead time
Consolidate value-added processes into fewer steps to shorten the value stream
Enhance Value-Cost ratio of products and processes to improve competitiveness in marketplace
“Seven Zeros” of
An Ideal System
•Zero Defects
•Zero (Excess) Lot Size
•Zero Setups
•Zero Breakdowns
•Zero (Excess) Handling
•Zero Lead Time
•Zero SurgingEdwards, J.N. (1983)
University of Texas at San Antonio (UTSA)

1) Reduce NVA
Reduce non-value-added (NVA) activities to decrease interruptions in flow
Methods All Lean-Six Sigma tools to stabilize & standardize
processes and to eliminate the 8 wastes.
Examples 5S, Visual Aid, Standardized Work: Standardize
processes and stabilize the performance
Kanban, Heijunka, SMED: Streamline the job flow
University of Texas at San Antonio (UTSA) 7
Waste!
Necessary
NVAValue
Adding
(Non-Value
Adding)

2) Accelerate VA
Accelerate value-added processes to improve throughput and lead time
Methods Theory of Constraints (TOC), Technology Deployment
Examples Add more operators at the bottleneck to improve
system capacity
Use better/faster equipment and/or automationto increase throughput
University of Texas at San Antonio (UTSA) 8
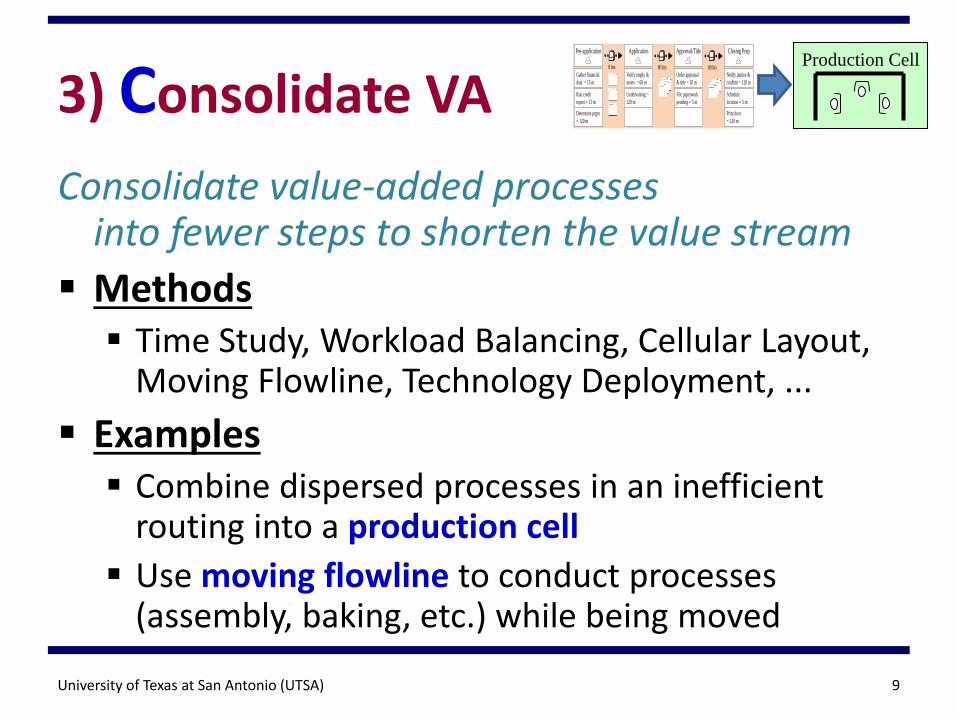
3) Consolidate VA
Consolidate value-added processes into fewer steps to shorten the value stream
Methods Time Study, Workload Balancing, Cellular Layout,
Moving Flowline, Technology Deployment, ...
Examples Combine dispersed processes in an inefficient
routing into a production cell
Use moving flowline to conduct processes (assembly, baking, etc.) while being moved
University of Texas at San Antonio (UTSA) 9
Production CellPre-application
8 hrs 80 hrs 80 hrsGather financial
data = 15 m
Run credit
report = 15 m
Determine prgm
= 120 m
Application
Verify emply &
assets = 60 m
Underwriting =
120 m
Approval/Title
Order appraisal
& title = 20 m
File paperwork
pending = 5 m
Closing Prep
Notify parties &
confirm = 120 m
Schedule
location = 5 m
Print docs
= 120 m

4) Enhance Value Provided
Enhance Value-Cost ratio of products and processes to improve competitiveness in marketplace
Methods VOC & CTQ, Value Engineering, SPC, Marketing, …
Examples Ball Bearing: Improve process capability
Higher-grade products
Awning: Faster & more accurate delivery Higher-end market
University of Texas at San Antonio (UTSA) 10
3s
6s

No just yet!
Before the future state is mapped, the trade-offs of improvement opportunities should be evaluated.
University of Texas at San Antonio (UTSA) 11
150 min
8 hrs
180 min
80 hrs
25 min
80 hrs
245 min
240 hrs
Pre-application
8 hrs 80 hrs 80 hrs 40 hrs
Client
Gather financial
data = 15 m
Run credit
report = 15 m
Determine prgm
= 120 m
Application
Verify emply &
assets = 60 m
Underwriting =
120 m
Approval/Title
Order appraisal
& title = 20 m
File paperwork
pending = 5 m
Closing Prep
Notify parties &
confirm = 120 m
Schedule
location = 5 m
Print docs
= 120 m
(10 days) (10 days) (5 days)(1 day)
LevelingFIFO Lane
Standard
Work
Runner
Folder
System
5S
Kanban
Supplies
Cross
Training
Pitch Folders
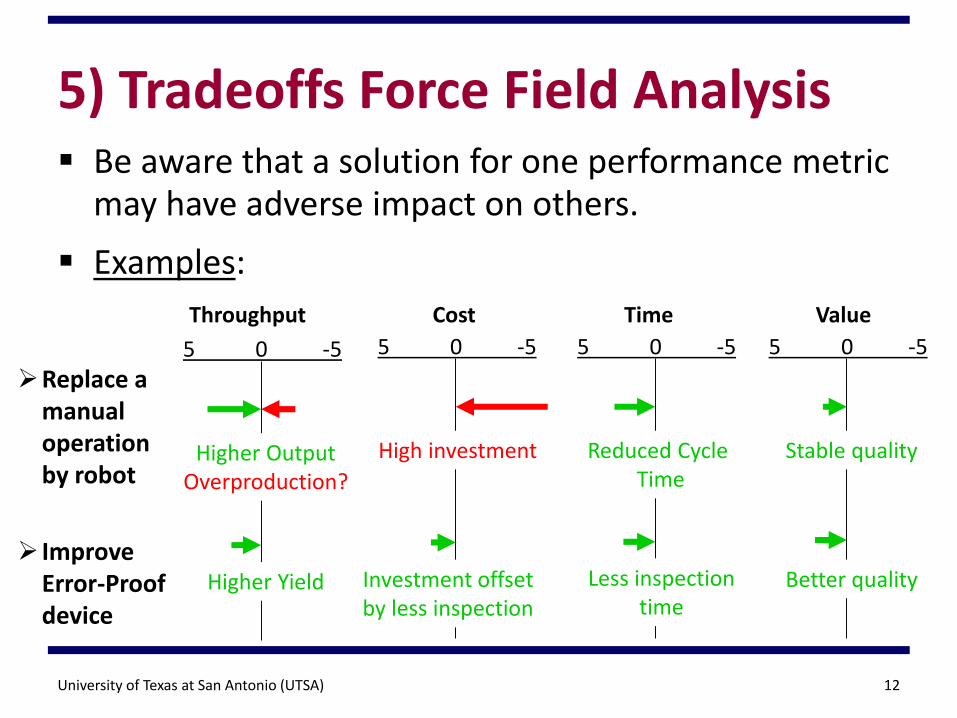
5) Tradeoffs Force Field Analysis
University of Texas at San Antonio (UTSA) 12
Be aware that a solution for one performance metric may have adverse impact on others.
Examples:
Throughput Cost Time Value
5 0 -5 5 0 -5 5 0 -5
Replace a manual operation by robot
Improve Error-Proof device
High investment Reduced Cycle Time
Stable quality
Investment offset by less inspection
Less inspection time
Better quality
5 0 -5
Higher OutputOverproduction?
Higher Yield
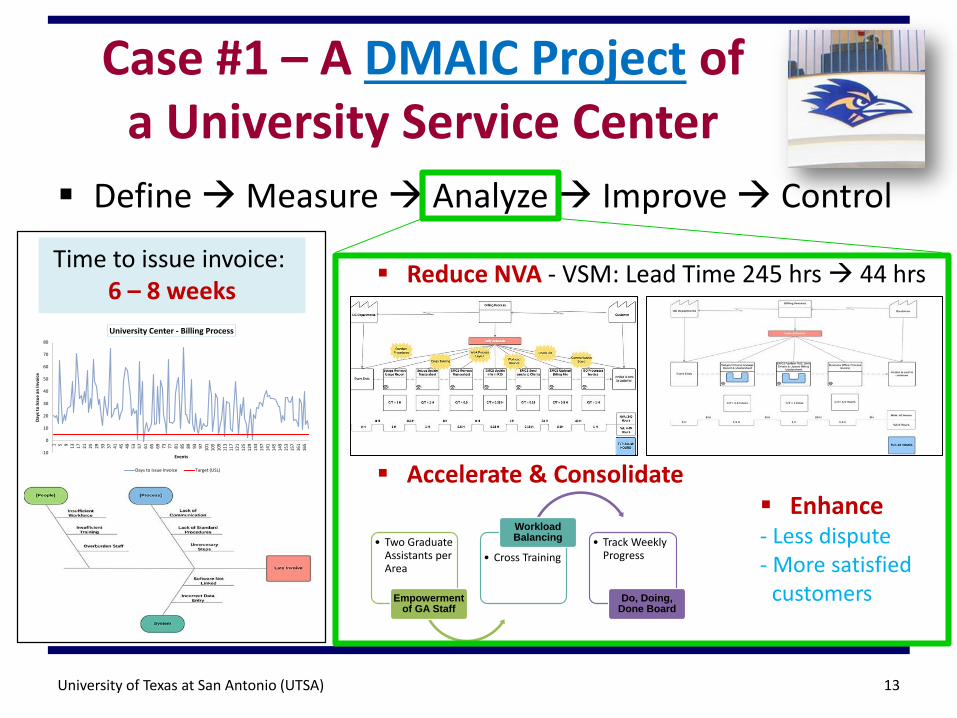
Case #1 – A DMAIC Project of a University Service Center
Define Measure Analyze Improve Control
University of Texas at San Antonio (UTSA) 13
Time to issue invoice: 6 – 8 weeks
-10
0
10
20
30
40
50
60
70
80
1 5 91
31
72
12
52
93
33
74
14
54
95
35
76
16
56
97
37
78
18
58
99
39
71
01
10
51
09
11
31
17
12
11
25
12
91
33
13
71
41
14
51
49
15
31
57
16
11
65
Day
s to
Issu
e a
n In
voic
e
Events
University Center - Billing Process
Days to Issue Invoice Target (USL)
Reduce NVA - VSM: Lead Time 245 hrs 44 hrs
Accelerate & Consolidate
• Two Graduate Assistants per Area
Empowerment of GA Staff
• Cross Training
WorkloadBalancing • Track Weekly
Progress
Do, Doing, Done Board
Enhance- Less dispute- More satisfied
customers
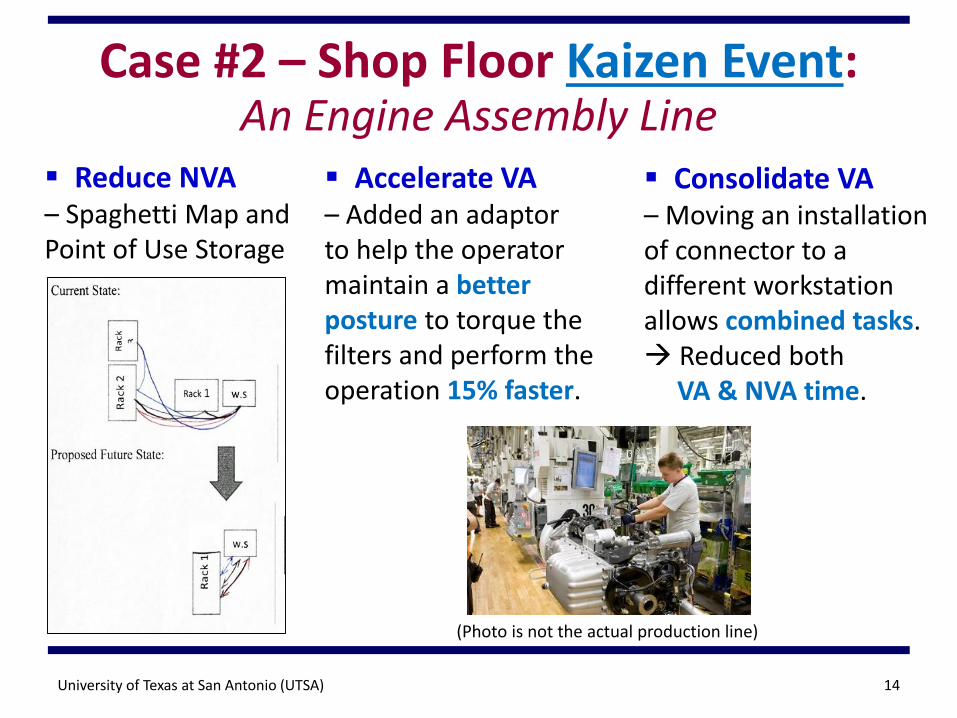
Case #2 – Shop Floor Kaizen Event:An Engine Assembly Line
University of Texas at San Antonio (UTSA) 14
Reduce NVA– Spaghetti Map and Point of Use Storage
Accelerate VA– Added an adaptor to help the operator maintain a better posture to torque the filters and perform the operation 15% faster.
(Photo is not the actual production line)
Consolidate VA– Moving an installation of connector to a different workstation allows combined tasks. Reduced both
VA & NVA time.

Case #3 – Reporting Improvementsthrough RACE Analysis
Define Current State Map
with 7 processes
Measure VA Time >100 hrs Total Lead Time >480 hrs
Analyze CTQ, SIPOC, Fishbone, Pareto, CPM
Improve Future State Map with 5 processes VA Time reduced by 14 hrs
Control Automated standardized process
University of Texas at San Antonio (UTSA) 15
Improvements Summary Reduce NVA
Quality at source
Accelerate VA Saved 14 hrs
Consolidate VA Combined 3 reports in 1 Combined statement
format with E-bill
Enhance Value Reduced billing errors
and disputes Automated bill format to
meet customer’s needs

Process improvement methods plus Lean RACE Model
to identify more potential opportunities
Lean Daily Management
Value Stream Mapping
Six Sigma’s DMAIC
Deming’s PDCA
A3 + 8 Step
University of Texas at San Antonio (UTSA) 16
ReduceNVA
ConsolidateVA
AccelerateVA
EnhanceValue
Lean RACE gives 4 directions of potential improvements

Thank you!
Conclusion of Lean RACE Model
A method to identify improvement opportunities in process excellence practices.
Continuous improvement in 4 possible directions.
University of Texas at San Antonio (UTSA) 17
Reduce NVA
Accelerate VA
Consolidate VA
Enhance Value
Trade-offsValue Stream


![[Lean 101] Introduction to Lean - Preparing a Lean Canvas](https://static.fdocuments.in/doc/165x107/58f160751a28abf1658b4621/lean-101-introduction-to-lean-preparing-a-lean-canvas.jpg)