A KEY PERFORMANCE INDICATOR AND LIFETIME ANALYSIS OF ...
93
The Pennsylvania State University The Graduate School College of Earth and Mineral Engineering A KEY PERFORMANCE INDICATOR AND LIFETIME ANALYSIS OF DIESEL VS. BATTERY POWERED LOAD HAUL DUMP VEHICLES IN UNDERGROUND MINING OPERATIONS A Dissertation in Energy and Mineral Engineering by Richard S. Schatz ©2016 Richard S. Schatz Submitted in Partial Fulfillment of the Requirements for the Degree of Doctor of Philosophy May 2016
Transcript of A KEY PERFORMANCE INDICATOR AND LIFETIME ANALYSIS OF ...

The Pennsylvania State University
The Graduate School
College of Earth and Mineral Engineering
A KEY PERFORMANCE INDICATOR AND LIFETIME ANALYSIS OF
DIESEL VS. BATTERY POWERED
LOAD HAUL DUMP VEHICLES IN UNDERGROUND MINING OPERATIONS
A Dissertation in
Energy and Mineral Engineering
by
Richard S. Schatz
©2016 Richard S. Schatz
Submitted in Partial Fulfillment
of the Requirements
for the Degree of
Doctor of Philosophy
May 2016

ii
The dissertation of Richard S Schatz was reviewed and approved* by the following:
Antonio Nieto
Associate Professor of Mining Engineering
Dissertation Co-Advisor
Chair of Committee
Serguei N. Lvov
Professor of Energy and Mineral Engineering
Professor of Materials Science and Engineering
Director of the Electrochemical Technologies Program
Dissertation Co-Advisor
Antonios Armaou
Professor of Chemical Engineering
Jeremy Gernand
Assistant Professor of Industrial Health and Safety
Luis F. Ayala
H. Professor of Petroleum and Natural Gas Engineering
FCMG Chair in Fluid Behavior and Rock Interactions
Associate Department Head of the EME Graduate Program
*Signatures are on file in the Graduate School

iii
Abstract
One of the most prohibitive issues that plague new technologies reaching the mass
market is the STEM (science, technology, engineering, and mathematics) gap. This occurs
when STEM personnel and non-STEM personnel have difficulty expressing their ideas
efficiently. The most frequent example of this is the expressing of a new technology or
idea as a monetary value. This research focuses on bridging that gap by developing an
economic model that adapts to different processes and compares technology by assessing
the value each technology adds to the process. This is achieved by an economic value study
for the major equipment of a process carried out in the desired process industry. This
dissertation focuses on exploring battery powered alternatives to diesel powered
underground load haul dump (LHD) equipment. The economic model developed for this
project provides corporate investors and, in turn, its consumer base with an added net value
to the process for each alternative. Corporate customers and audience being; plant and
operations managers, corporate operations and technology, engineering and reliability
decisions makers. The project was divided into four chapters, each of which consist of an
accepted or submitted peer reviewed journal publication.
The first chapter involved determining the current default equipment used in the
process in combination with the replacement technology. All the data that could be
obtained for the equipment and process was gathered and, with appropriate assumptions
for missing or incomplete data, used to initiate development of the model used to compare
the technologies. The lead acid battery is most commonly used for battery powered mining
equipment. Two battery chemistries, lithium-ion and Sodium Metal Halide (NaMX), were
selected as the replacement technology using six criteria for cell performance; safety,
environmental footprint, life span, degradation, scalability and toughness. Initial
calculations were conducted to determine approximate battery cost, volume and weight.
The second chapter, involved process flow diagram creation and investigation of
the equipment and each step of the process. Key performance indicators were calculated
using operational mine data and were also used to find out the main factors that impact the
economic value of each technology. Analysis of the performance data led to the
understanding of the distribution of uptime and downtime for each vehicle. Understanding
each issue that added more downtime for both electric and diesel powered LHDs allowed
for the estimation of uptime and downtime for battery powered LHDs.
The third chapter finalized the value model used to convert technical details of the
technology to a single economic value. Wear characteristics and life time of both the
current and replacement technology were calculated using the same data set used in the
second chapter added to the existing input parameters. The parameters were used in
numerical models to determine the value each technology contributed to the process.
Assessments focused on both profit and cost only analysis for a more in depth comparison
of each technology’s value. A stability analysis was performed to address the variability of
the input parameters. This was used to develop a range of conditions in which each
technology was superior.
The fourth chapter expanded the value model, exploring new parameters and their effect
of the value of the new technology. A parameter, focusing on the reduction of energy costs
due to reductions in ventilation requirements, was added to determine the effect reduced
iv
energy costs had on the value battery LHDs. Multiple battery chemistries were analyzed
not only compared to diesel but each other to determine the technology that would add the
most value to an underground hard rock mine. The model was improved to allow for
sensitivity model to be run by computer allowing for orders of magnitude improvement in
accuracy. The parameters are adjusted for inflation each year, however the revenue and
costs remains the same for each year. There would be significant reduction in the variation
in the input parameters over a 10-year span than a 35-year span; therefore the model
duration was shortened to the span of a lifetime of an LHD, or 10 years.

v
TABLE OF CONTENTS
List of Figures .............................................................................................................. viii
List of Tables ............................................................................................................... x
Acknowledgements ...................................................................................................... xi
Chapter 1. Introduction ................................................................................................ 1
1.1 Background information ................................................................................. 1 1.2 Previous Studies.............................................................................................. 3
1.3 Scope of Work ................................................................................................ 4 Chapter 1 References ............................................................................................ 5
Chapter 2. Using Modern Battery Systems in Light Duty Mining Vehicles ............... 7
Preface .................................................................................................................. 7 Abstract ................................................................................................................. 8 2.1 – Introduction .................................................................................................. 9
2.2 –Background Information ............................................................................... 10 2.2.1 –Lead Acid (PbA) ................................................................................. 10
2.2.2 –Lithium Ion ......................................................................................... 12 2.2.3 – Sodium Metal halide (NaMx) ............................................................ 14
2.3 – Six criteria for cell performance .................................................................. 17 2.4 –Personnel Safety ........................................................................................... 17
2.4.1 – Toxicity .............................................................................................. 17 2.5 – Environmental impact .................................................................................. 18
2.5.1 – Hazards from MOC ........................................................................... 18
2.6 –Life Span ....................................................................................................... 18 2.6.1 – Cycle Life .......................................................................................... 18
2.6.2 – Calendar Life ..................................................................................... 19 2.7 –Degradation pathways .................................................................................. 19
2.8 – Ease of Scalability ....................................................................................... 21 2.9 –Toughness ..................................................................................................... 22
2.9.1 – Reliability .......................................................................................... 22 2.9.2 – Cell Durability ................................................................................... 23
2.10 – Mining Equipment ..................................................................................... 24 2.10.1 Soft Rocks .......................................................................................... 25 2.10.2 Underground Soft Rock Mining Methods .......................................... 25
2.10.3 Mining Vehicles ................................................................................. 26 2.11 – Conclusions................................................................................................ 29 2.12 – Acknowledgements.................................................................................... 30 2.14 Publication 1 References .............................................................................. 31

vi
Chapter 3. Performance Analysis of Electric and Diesel Equipment for Battery
Replacement of Tethered LHDs Vehicles in Underground Mining .......... 33
Preface .................................................................................................................. 33 Abstract ................................................................................................................. 34 3.1 – Introduction .................................................................................................. 35 3.2 –Equipment overview ..................................................................................... 36
3.2.1 –Underground mining vehicles ............................................................ 36
3.2.2 – Load-Haul-Dump Vehicles (LHD) .................................................... 37 3.3 – Methodology ................................................................................................ 37
3.3.1 – General expenses ............................................................................... 38
3.3.2 – Key Performance Indicators (KPIs) .................................................. 39 3.4 ––Results and Discussion ............................................................................... 41
3.4.1 – General Costs ..................................................................................... 41
3.4.2 – Key Performance Indicators .............................................................. 43 3.5 –Conclusions/Recommendations .................................................................... 44
3.5.1 – Conclusions ....................................................................................... 44 3.5.2 – Recommendations for future work .................................................... 45
3.6 – Acknowledgements ...................................................................................... 45
3.7 – Publication 2 References ............................................................................. 46
Chapter 4. Long-term economic sensitivity analysis of light duty underground
mining vehicles by power source ............................................................... 47
Preface .................................................................................................................. 47
Abstract ................................................................................................................. 48 4.1 Introduction ..................................................................................................... 49
4.2 Methodology ................................................................................................... 49 4.2.1 –Economic indicators ........................................................................... 49
4.3 – Results.......................................................................................................... 51
4.3.1 – Assumptions and variables ................................................................ 51 4.3.2 – Economic Analysis – Profit Focus .................................................... 53 4.3.3 – Economic Analysis – Cost Focus ...................................................... 55
4.4 – Conclusions.................................................................................................. 59
4.5 – Final Remarks .............................................................................................. 59 4.6 Publication 3 References ................................................................................ 61
Chapter 5. A Short Term Economic Sensitivity Analysis of Diesel Vs. Battery
Powered Load Haul Dump Vehicles.......................................................... 62
Preface .................................................................................................................. 62 Abstract ................................................................................................................. 63 5.1 Introduction ..................................................................................................... 64
5.2 Considered factors .......................................................................................... 64 5.2.1 Invested Capital and maintenance Cost ................................................ 64 5.2.2 Mine Data ............................................................................................. 65

vii
5.2.3 Revenue ................................................................................................ 65 5.2.4 Energy ................................................................................................... 65
5.2.5 Ventilation ............................................................................................ 66 5.3 Methodology ................................................................................................... 66
5.3.1 Model Parameters ................................................................................. 66 5.3.2 Model description ................................................................................. 68
5.4 Results............................................................................................................. 69
5.4.1 Base Case .............................................................................................. 69 5.4.2 Sensitivity Analysis .............................................................................. 70
5.5 Conclusions..................................................................................................... 77 5.6 Publication 4 References ................................................................................ 78
Chapter 6. Closing Statements..................................................................................... 79
6.1 Conclusions..................................................................................................... 79
6.2 Future Work .................................................................................................... 81
viii
List of Figures
Figure 2.2-1 Prismatic (a) VRLA battery (cutaway view) and (b) monobloc battery
(exploded view) adapted from Lindens handbook of batteries.7 ......... 11
Figure 2.2-2. Lead acid battery plates with (a) flat plates and (b) tubular plates.5 ..... 11
Figure 2.2-3. Adapted from Tarascon & Armand. (a) cylindrical (b) coin (c)
prismatic (d) thin and flat. Note the unique flexibility of the thin and
flat plastic Li-ion configuration.10 ........................................................ 13
Figure 2.2-4. Comparison of beta alumina tube cross-sections for first(left) and
second(right) generation cells34 ........................................................... 15
Figure 2.2-5. Components of a sodium nickel chloride cell.12 .................................... 16
Figure 2.2-6. Schematic of a laboratory scale planar sodium nickel chloride
battery16 ................................................................................................ 16
Figure 2.7-1.SEM images of negative electrodes from as received and end of life
cells adapted from Liu et al.19 .............................................................. 20
Figure 2.7-2. SEM image of Ni/NaCl positive electrode after cycling adapted from
Lu et al.16 .............................................................................................. 20
Figure 2.8-1.Schematic of VLRA battery. ................................................................... 21
Figure 2.10-1. 4-ton (7.2 kW) Underground mining locomotive31 ............................ 27
Figure 2.10-2. Load-Haul-Dump vehicle © Caterpillar Company 2013 ..................... 28
Figure 3.2-1. Load-Haul-Dump vehicle © GE Mining Company 2014 ...................... 37
Figure 3.4-1. Break down of operating time for Diesel (outer ring) and Tethered
Electric (inner ring) LHDs .................................................................... 42
Figure 4.3-1. Battery Vs Diesel-Adjustment of tons moved(blue), ore density(red),
electricity price(green), battery equipment capitol(purple), and
Diesel maintenance cost(Orange)| reference line (black)| ..................... 54
Figure 4.3-2. Buyback period of initial investment for battery equipment based
adjusting tons hauled. Battery equipment(red) was adjusted
negatively and Diesel(blue) equipment adjusted positively. The
dotted lines are the respective fit showing exponentially. ..................... 55
ix
Figure 4.3-3. Adjustment of electricity cost(blue), cost of fuel(red), cost of battery
pack(green), Equipment capitol (battery equipment costing 5% more
than diesel)(purple), cost of maintenance (ratio of diesel to battery
constant)(orange), and cost of Diesel Maintenance(tan)| reference
line (black)|. ........................................................................................... 57
Figure 4.3-4. Adjustment of equipment capitol, battery equipment Capitol Vs.
Diesel. .................................................................................................... 58
Figure 4.3-5. Adjustment of lifetime of diesel equipment(blue), battery
equipment(red), and battery packs(green) |Reference line(Black)| ....... 58
Figure 5.4-1.Diesel Vs NaMx star plot: Battery Haulage(Gray), Ore Price(Blue),
Diesel Maintenance (Purple), Diesel Fuel Cost(Indigo), Ventilation
Savings(Yellow), Electricity Costs(Red), Equipment Capital
ratio(Brown), Battery Maintenance(Green), Diesel Haulage
(Orange). ................................................................................................ 71
Figure 5.4-2. Payback of additional Capital vs. deviation from LHD haulage
powered with LFP(blue) PbA(Gray), and NaMX(Orange) battery
packs. ..................................................................................................... 73
Figure 5.4-3. Annual energy savings by fleet size ....................................................... 74
Figure 5.4-4. NPV diesel vs. battery: 0% (light) and 30% (Dark) difference in
capital between diesel and battery powered LHDs for LFP(blue)
PbA(Gray), NaMX(Orange). ................................................................. 75
Figure 5.4-5. NPV diesel vs. battery: adjusting the lifetime of Battery(orange),
Diesel(gray) and Both (Blue) ................................................................ 75
Figure 5.4-6. NPV diesel vs. battery: adjusting the battery pack lifetime of LFP
(Blue), PbA(gray) and NaMX(orange) ................................................. 76

x
List of Tables
Table 2.6-1. General table of technologies and their characteristics adapted from
Ferreira et al.33 ....................................................................................... 19
Table 2.10-1. Estimated parameters for alternate cell chemistries for 7.1 kW
locomotive............................................................................................... 28
Table 2.10-2. Estimated parameters for alternate cell chemistries for 112kW LHD .. 29
Table 3.4-1.Haulage data for LHDs by power source annual tonnage and hourly
rates ......................................................................................................... 43
Table 3.4-2. Key performance Indicators for T. Electric and Diesel equipment ......... 44
Table 4.3-1.Equipment dependent control values........................................................ 52
Table 4.3-2.Equipment independent control values .................................................... 52
Table 4.3-3.NPV and IRR over 35 year period ........................................................... 53
Table 4.3-4.Incremental analysis average profit increase ............................................ 53
Table 4.3-5.Incremental analysis average operating cost savings ............................... 56
Table 5.3-1. Base case values for equipment dependent parameters ........................... 67
Table 5.3-2. Base case values for equipment independent parameters ........................ 67
Table 5.3-3. Base case values for electrochemical parameters .................................... 68
Table 5.4-1. Incremental analysis of base case data: Diesel Vs. Battery..................... 70
Table 5.4-2. Lifetime value deviation per percent deviation from base value ............ 72

xi
Acknowledgements
I would first like to thank my family for their love and support and for believing in
me every step of the way. I would also like to thank Dr. Lvov for taking a chance on me
and accepting me into his lab, your advice and support over the years have been invaluable.
I would also like to thank Dr. Nieto for his guidance and encouragement through every
stage of my PhD. I would like to personally thank Justin Beck and Derek Hall for their
constructive criticism and for being sounding boards when I needed it most. Finally, I
would like to thank Arupananda Sengupta for his couch and the jam sessions that made the
crazy weeks bearable.

1
Chapter 1.
Introduction
1.1 Background information
Hard rock mining is mainly categorized as mines that focus on the extraction of
crystalline minerals such as salt and metallic bearing minerals called ores. These metallic
ores include gold, copper, zinc, nickel, and lead just to name a few. Underground mines
are some of the harshest operating conditions for mechanical equipment. There is little
room to fit gargantuan amounts of power able to operate continuously throughout the day.
Most underground mines operate in cycles of three 8-hour shifts to maximize productivity.
Equipment must also endure hot humid dusty operating conditions and weather constant
abrasion to nearly all moving parts. There is a plethora of equipment used in underground
mines, increasingly growing by the constant mechanization of mining operations to
increase productivity and therefore profitability. This study, however, focuses on the
smaller vehicle equipment ranging in power from 50 to 125 kilowatts. Vehicles in this
category are arguably the most indispensable equipment in the underground mining
operation, including: locomotives, load haul dump (LHD) vehicles, and drilling jumbos.
These vehicles have similar main body construction, however they are customized for very
different tasks such as; transportation of man and machine, ore extraction and assisting in
drilling blasting holes. The similar construction allows for an extension of this investigation
to include the value of converting to battery power on all three of the aforementioned
equipment. The model, however, was created based on operational data focusing on LHDs
and, therefore, LHDs are primarily the focus of this investigation.
The power source for an LHD can be either electric or diesel. Electric power tools
and vehicles has always been outshined by the reliability, portability, and power of diesel
equipment, developing a stigma against electric LHDs. Over the past couple decades, there
has been major improvements in electric motor and battery technology. There has been a
push to remove this stigma by reviewing and comparing in mine testing data of the newer
more powerful LHDs to that of diesel LHDs. Although, diesel prices are currently the
lowest they have been in seven years, most projections from the energy information agency
show that prices will rebound and increase significantly more than that of electricity
costs.[1] The U.S. mine safety and health administration investigated the relation of miner
lung cancer death to exposure to diesel particulate matter (DPM). This was published in
the US federal register explaining the reason for the new regulations implemented for
limiting miner exposure to DPM.[2] Title 30, part of the U.S. code of federal regulations,
was revised in 2014 and reflected the new regulations, with stringent mine ventilation
requirements to allow less particulates and toxic gas emissions in general.[3] These
concerns sparked a renewed interest in alternatives to diesel LHDs.
The problem is not so much that EVs require electricity as it is getting the electricity
to the vehicle. Electric vehicles have had many innovations to attempt to solve this problem
starting with the easiest solution, an electric tether. [4] Tethered electric vehicles had a
major drawback though, the equipment required several inch-thick cables to be able to not

2
only manage the immense power consumption but also the insulation which prevented
shock hazards and protected the cable from damage. This much copper and rubber was
bulky and heavy, which limited the amount that could fit on the spool at the rear of the
vehicle. Trolley lines were another approach, however the lines were fixed and exposed,
creating a shock hazard. An upgrade to this technology came in the form of coaxial winding
transformers (CWT) as suggested in a study by Klontx et al. [5] Hailed as a method that
won’t spark or expose live current, this method still limited the portability of electric LHDs.
The solution had to be a portable source of power like diesel engines. The first battery
powered LHDs were powered by lead acid (PbA) batteries and were slow, weak and had
low energy density leading to relatively short runtimes. Fuel cells were being heavily
examined as possible alternatives for fossil fuel powered vehicles at the turn of the
millennium. The fuel cell propulsion institute started development on a locomotive
powered by hydrogen. [6] [7] Caterpillar’s R1300 fuel cell LHD, was the next step,
collaborating with the fuel cell propulsion institute.[8] In 2005, however, the R1300, was
suffering major setbacks with initial testing in the U.S. and has not been developed past
the prototype stage.[9]
Diesel LHDs were still able to comfortably preside over all other rival technologies,
with the exception of extreme depth or space restrictions, due to longer runtime, and
increased power. The National Institute for Occupational Safety and Health (NIOSH)
reviewed several methods to reduce DPM with the knowledge that diesel LHDs would be
employed for years to come. These included maintenance procedures, engine designs,
alternative fuels and after-treatment technologies. [10] Fuel alternatives such as biodiesel
blends are well known, however there has been extensive research on fuel-water blends
that have shown the ability to reduce NOx and particulate matter by 40-50% with no fuel
cost penalty. Other fuel additives include catalytic metals (i.e., Platinum (Pt), iron (Fe),
etc.) known as fuel-borne catalysts have also shown promise in reducing harmful
particulate and gaseous emissions.
Batteries powered LHDs experienced a resurgence after MSHA-approved lithium
iron phosphate (LFP) batteries for use in RHD’s Muckmaster 300EB[11] and GE
Fairchild’s battery powered AC LHD[12]. Over recent years, the automotive industry has
been focused on improving LFP cell technology for use in personal automotive
transport.[13] Another battery, hailed for its thermal and chemical stability, relative low
cost and similar performance to that of LFP is sodium metal halide (NaMX) technology.
A major drawback keeping NaMX cell technology out of the automotive industry is the
operating temperature of 250-350 ºC, requiring the cell to be in constant operation. There
are several sectors that require constant operation for which NaMX cells are being
considered such as; mass transport, grid storage, and even submarine rescue.[14], [15]
Mining is another industry that would benefit from constant-use battery technology. Due
to the overwhelming amount of research and development being conducted around the
world, both LFP and NaMX cell chemistries will be investigated for their benefits to PbA
and diesel LHDs.
3
1.2 Previous Studies
Tethered electric or fuel cell LHDs vs. Diesel were the focus of previous research,
due to the fact that they were much more prevalent in underground mining operations than
battery LHDs. Battery technology was investigated for the environmental consequences
battery manufacturing and disposal have on the environment in a study by McManus.[16]
The economics of ventilation reduction was performed in 2004. A computer model
was developed to determine how much fuel cell LHDs would reduce the required
ventilation currently demanded by diesel LHDs. [17] Nine U.S. hard rock mines, both
metallic and nonmetallic, were examined. Each mine ranged in production from 150-
2500 kt. The diesel fleet of each mine ranged from 0.7 to 15 MW. It was concluded that all
nine mine studies would receive benefits in significant savings from energy, capital, or
both from a reduction of ventilation requirements due to the absence of diesel exhaust.
Brake and Nixon performed an in-depth study on diesel ventilation requirements using 0.5
m3·kW-1, an Australian a statutory requirement, in a 2008 study. [18] No equipment was
directly analyzed; however, important information was discussed about commonly
overlooked parameters when planning primary ventilation to a mine. These studies were
adapted for use in the economic model to investigate how underground mines would
benefit from lower ventilation requirements by replacing diesel LHDs with battery LHDs,
which also do not emit toxic pollutants or DPM particulates.
Sayadi created a numerical model to estimate capital and operating costs of diesel
and electric LHDs.[19] The data used for the 6 tethered electric LHDs and 11 diesel LHDs
in this study was acquired from InfoMine. The study analyzed the overall width and height,
horsepower and bucket capacity of the LHDs to develop single and multiple linear
regression models to estimate operating and capital cost based on the aforementioned
parameters. This model was used to calculate the estimated base case operating and capital
costs for a 2.3 m3 LHD.
Jacobs et al performed similar economic analysis for tethered electric and diesel
powered LHDs.[20] Two loaders, manufactured by Sandvik were compared the diesel
powered LH514 and the tethered electric LH514E. The majority of costs were estimated
using the cost estimation handbook for the Australian mining industry. The study found
that while there were several advantages to electric loaders they were not a universal
replacement to diesel powered LHDs.
Though much work has been done to understand electric vs. diesel LHDs, the
analysis of how much value LFP and NaMX cell-powered battery LHDs add to
underground mines compared to diesel and PbA cell-powered LHDs remains largely
uninvestigated. As such, there are no predictions or calculations of how LFP and NaMX
cell-powered battery LHDs will perform in underground mines. Furthermore, there are no
economic sensitivity analyses of how current cell chemistries powering battery LHDs
compare to that of PbA cell-powered LHDs or diesel LHDs.
4
1.3 Scope of Work
This work is presented with the goal of determining the productivity and overall
value battery LHDs, with various cell chemistries, bring to an underground hard rock mine.
To that end, the following hypothesis were investigated:
1. If electric LHDs are more productive than diesel LHDs then the key performance
indicators of diesel would be consistently lower than that of electric LHDs.
2. If battery powered LHDs are a financially viable replacement for diesel powered
LHDs than an economic sensitivity analysis would show that battery powered
LHDs have more value over the lifetime of a mine within a plausible range of
parameters.
3. If multiple cell chemistries are available for use in battery powered LHDs,
expanding its versatility, than an economic sensitivity analysis would show that
battery powered LHDs have more value than diesel LHDs over the lifetime of
an LHD within a wider plausible range of parameters than that of one battery
chemistry.

5
Chapter 1 References
[1] U.S. Energy Information Administration, “Annual Energy Outlook 2015,” Off.
Integr. Int. Energy Anal., vol. 1, pp. 1–244, 2013.
[2] M. S. and H. Administration, “Diesel Particulate Matter Exposure of Underground
Coal Miners; Final Rule,” Fed. Regist., vol. 75, no. 61, pp. 16050–16065, 2001.
[3] U.S.government, “Title 30,” U.S. Code Fed. Regul., 2014.
[4] J. Paraszczak, E. Svedlund, K. Fytas, and M. Laflamme, “Electrification of Loaders
and Trucks – A Step Towards More Sustainable Underground Mining,” Renew.
Energy Power Qual. J., no. 12, 2014.
[5] D. W. Novotny, R. D. Lorenz, S. Member, K. Klontz, and D. Divan, “Contactless
power delivery system for mining applications,” Ind. Appl. …, vol. 3, no. I, 1995.
[6] A. Miller and D. Barnes, “Advanced underground vehicle power and control
fuelcell mine locomotive,” Proceeding 2002 US DOE Hydrog. …, pp. 1–7, 2002.
[7] A. R. Miller, “Tunneling and mining applications of fuel cell vehicles,” Fuel Cells
Bull., vol. 3, no. 22, pp. 5–9, 2000.
[8] D. L. Barnes, P. Contact, and A. R. Miller, “Fuel Cell-Powered Front-End Loader
Mining Vehicle,” pp. 1–4, 2003.
[9] M. Woof, “Technology for Underground Loading and Hauling Systems Offers
Exciting Prospects,” Eng. Min. J., vol. 206, no. 3, p. 32, 2005.
[10] CDC, “Review of Technology Avaiable To the Undergound Mining Industry for
Control of Diesel Emissions,” Inf. Circ., 2002.
[11] RDH mining Equipment, “RDH Muckmaster 300EB,” 2016. [Online]. Available:
http://www.rdhminingequipment.com/product/muckmaster-300eb/.
[12] GE-Fairchild, “GE Battery Powered AC LHD,” 2016. [Online]. Available:
http://www.getransportation.com/mining/ge-fairchild-battery-powered-load-haul-
dump.
[13] T. Reddy and D. Linden, Linden’s Handbook of Batteries, 4th ed. McGraw-Hill
Education, 2010.
[14] H. Chen, T. Ngoc, W. Yang, C. Tan, Y. Li, T. N. Cong, and Y. Ding, “Progress in
electrical energy storage system: A critical review,” Prog. Nat. Sci., vol. 19, no. 3,
pp. 291–312, Mar. 2009.
[15] S. Galant, E. Peirano, and L. Debarberis, “Energy Storage: A New Flexibility
Option for Future Power Systems,” in Advanced Technologies for Future
Transmission Grids, G. Migliavacca, Ed. London: Springer London, 2013, pp. 247–
284.
[16] M. McManus, “Environmental consequences of the use of batteries in sustainable
systems: battery production.,” 2nd Int. Conf. Microgeneration …, 2011.
[17] G. Righettini and P. Mousset-Jones, “Ventilation Savings With Fuel Cell Vehicles
A Cost-Benefit Analysis For Selected U.S. Metal/Non-Metal Mines,” pp. 1–5,
2004.
[18] D. J. Brake and T. Nixon, “Correctly Estimating Primary Airflow Requirements for
Underground Metalliferous Mines,” Tenth Undergr. Oper. Conf., no. April, pp. 14–
16, 2008.

6
[19] A. R. Sayadi, A. Lashgari, and J. J. Paraszczak, “Hard-rock LHD cost estimation
using single and multiple regressions based on principal component analysis,”
Tunn. Undergr. Sp. Technol., vol. 27, no. 1, pp. 133–141, 2012.
[20] W. Jacobs, M. R. Hodkiewicz, and T. Braunl, “A Cost Benefit Analysis of Electric
Loaders to Reduce Diesel Emissions in Underground Hard Rock Mines,” IEEE
Trans. Ind. Appl., vol. 51, no. 3, pp. 2565–2573, 2013.
7
Chapter 2.
Using Modern Battery Systems in Light Duty Mining Vehicles
The contents of this chapter was originally published in the International Journal of
Mining, Reclamation and Environment and is referenced as: Schatz, R.S., Nieto, A.,
Dogruoz, C., and Lvov, S.N., 2014. Using modern battery systems in light duty mining
vehicles International Journal of Mining, Reclamation and Environment, 37-41.K
Preface
The first step to finding a replacement for any piece of equipment is knowing how
to determine the best options available. In this chapter, a method for analyzing batteries for
their benefits and detriments was developed. This method was used to analyze sodium
metal halide and lithium ion batteries for use in load haul dump vehicles. Initial calculations
for each battery type were carried out to determine approximate cost and weight of the
battery packs required for use in LHDs. The utilization of each battery chemistry in battery
powered LHDs were analyzed for their economic value over the lifetime of a mine in
chapter three and the vehicle’s lifetime in chapter four. The six criteria for cell performance
method of battery selection and the initial calculations were developed and conducted
solely by the primary author.

8
Abstract
Sodium metal halide (NaMx) batteries are an emerging technology, with
performance and longevity comparable to that of lithium ion batteries, yet, require less
capital. NaMx technology has been considered for mass transit and industrial applications
to date. Mining vehicles are most commonly powered by diesel engines, despite their
reputation for air pollution and inefficiency. These diesel powerhouses can be replaced by
efficient, clean batteries while maintaining economic viability. In underground mining,
locomotives and load-haul-dump (LHD) are the most common light duty (<500HP)
equipment used in room and pillar and longwall mining methods to advance and prepare
the mining site. PbA batteries are commonly used in battery powered mining equipment
and will serve as the control. Replacing these batteries with more energy dense NaMx or
Li-ion batteries will increase operating time, therefore increasing, mine productivity.
Keywords: sodium metal halide, underground mining vehicles, battery power, Li-
ion.

9
2.1 – Introduction
There is a variety of equipment used in the mining industry. Some machines require
substantial amounts of power and need direct connections to external generators, while
others can be powered via diesel engine. Some of the most significant underground mining
equipment was analyzed in this study to determine whether it is feasible to incorporate
current battery technology into these machines.
Most mining machines run solely on diesel power used in conjunction with
hydraulics to power the vehicle. The conversion to portable and powerful battery systems
will, therefore, require some creative engineering. Currently, diesel engines are the
standard power source for light duty mining equipment, however, they are not a perfect
solution. They are a source of ignition, noisy, and emit fine particulates as well as carbon
dioxide into the mine. For that reason, current battery technology is being explored as a
safer alternative in the mining machines. Although, the packs need to be replaced once
during the vehicle lifetime, lack of engine maintenance and operating expenses can help
mitigate this cost.
In general, there are two different types of mining methods, open pit and
underground mining. In this study, underground mining methods were the focus of the
investigation. The most common of these methods, room and pillar and, longwall were
reviewed and mining vehicles were selected based on their significance in each method.
Because of their tasks, dimensions and energy requirements, locomotives and load-haul-
dump (LHD) vehicles are the most important equipment as they are used for each of the
mining methods. Continuous miners are the most common vehicles which are used in room
and pillar and longwall mining methods. Longwall miners incorporate shearers, conveyors
and mechanized shields into a unified piece of equipment and are specifically engineered
for the longwall mining method. According to Caterpillar inc., Continuous miners require
between 500-750 kW of electricity and longwall machines require approximately 1600 kW
of electricity leading to the conclusion that it would be unfeasible to power the equipment
using current battery technology, therefore, these two pieces of equipment will not be
included in the study.
The locomotives and LHDs, however will be considered for conversion to battery
power and analyzed for the feasibility of incorporating Lead acid (PbA), lithium ion, and
sodium metal halide (NaMx) to replace the diesel engine. Two chemistries, out of the
family of lithium ion configurations are investigated. They are iron phosphate positive
electrode with a graphite negative electrode (LFP/C) and Manganese oxide spinel positive
electrode with a lithium titanate spinel negative electrode (LMO/LTO).
10
2.2 –Background Information
2.2.1 –Lead Acid (PbA)
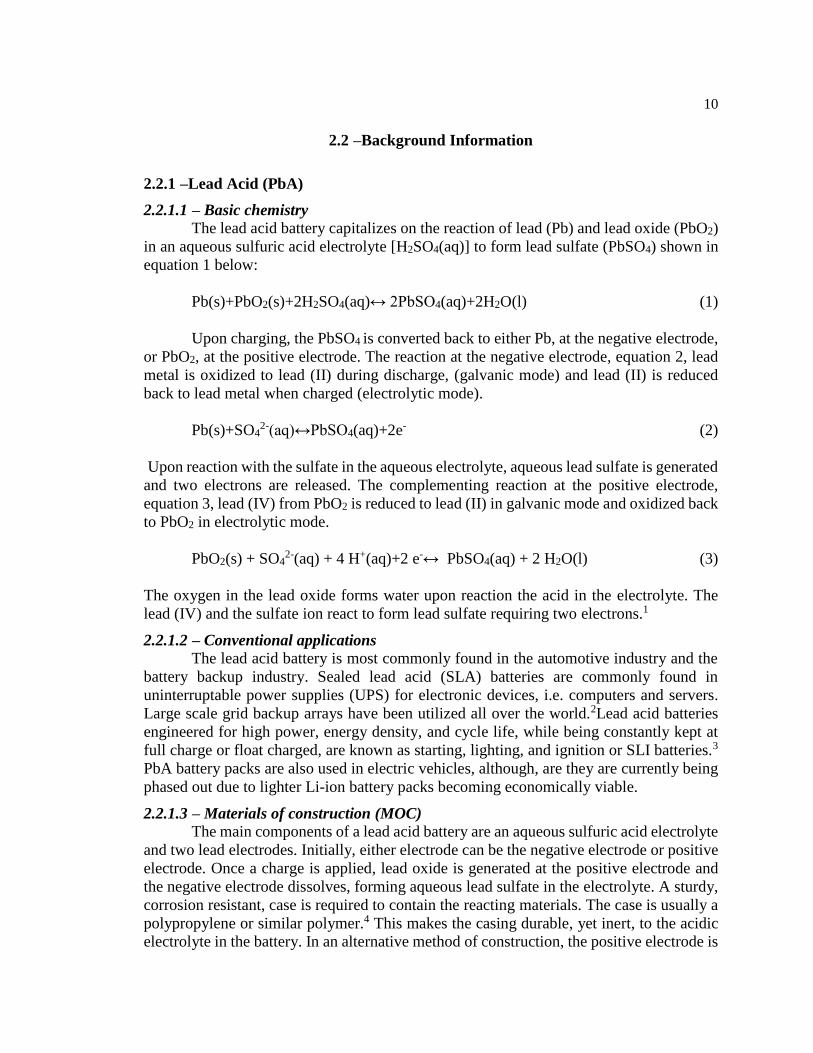
2.2.1.1 – Basic chemistry
The lead acid battery capitalizes on the reaction of lead (Pb) and lead oxide (PbO2)
in an aqueous sulfuric acid electrolyte [H2SO4(aq)] to form lead sulfate (PbSO4) shown in
equation 1 below:
Pb(s)+PbO2(s)+2H2SO4(aq)↔ 2PbSO4(aq)+2H2O(l) (1)
Upon charging, the PbSO4 is converted back to either Pb, at the negative electrode,
or PbO2, at the positive electrode. The reaction at the negative electrode, equation 2, lead
metal is oxidized to lead (II) during discharge, (galvanic mode) and lead (II) is reduced
back to lead metal when charged (electrolytic mode).
Pb(s)+SO42-(aq)↔PbSO4(aq)+2e-
(2)
Upon reaction with the sulfate in the aqueous electrolyte, aqueous lead sulfate is generated
and two electrons are released. The complementing reaction at the positive electrode,
equation 3, lead (IV) from PbO2 is reduced to lead (II) in galvanic mode and oxidized back
to PbO2 in electrolytic mode.
PbO2(s) + SO42-(aq) + 4 H+(aq)+2 e-↔ PbSO4(aq) + 2 H2O(l) (3)
The oxygen in the lead oxide forms water upon reaction the acid in the electrolyte. The
lead (IV) and the sulfate ion react to form lead sulfate requiring two electrons.1
2.2.1.2 – Conventional applications
The lead acid battery is most commonly found in the automotive industry and the
battery backup industry. Sealed lead acid (SLA) batteries are commonly found in
uninterruptable power supplies (UPS) for electronic devices, i.e. computers and servers.
Large scale grid backup arrays have been utilized all over the world.2Lead acid batteries
engineered for high power, energy density, and cycle life, while being constantly kept at
full charge or float charged, are known as starting, lighting, and ignition or SLI batteries.3
PbA battery packs are also used in electric vehicles, although, are they are currently being
phased out due to lighter Li-ion battery packs becoming economically viable.
2.2.1.3 – Materials of construction (MOC)
The main components of a lead acid battery are an aqueous sulfuric acid electrolyte
and two lead electrodes. Initially, either electrode can be the negative electrode or positive
electrode. Once a charge is applied, lead oxide is generated at the positive electrode and
the negative electrode dissolves, forming aqueous lead sulfate in the electrolyte. A sturdy,
corrosion resistant, case is required to contain the reacting materials. The case is usually a
polypropylene or similar polymer.4 This makes the casing durable, yet inert, to the acidic
electrolyte in the battery. In an alternative method of construction, the positive electrode is

11
covered in a lead oxide paste prior to charging. Modern day automotive batteries contain
calcium and either tin or strontium to help strengthen and harden the plate. These alloys
also increase the over potential required for hydrogen evolution reducing gassing of the
electrolyte. 5
2.2.1.4 – Form factors/construction
The external cases for the lead acid batteries are all very similar, usually consisting
of a polypropylene tub containing the lead plates and electrolyte as shown in Figure 2.2-1.
Figure 2.2-1 Prismatic (a) VRLA battery (cutaway view) and (b) monobloc battery (exploded view)
adapted from Lindens handbook of batteries.7
The flat plate design, depicted in Figure 2.2-2, is mainly used for automotive
ignition batteries. The construction of these plates have been highly optimized for
maximum efficiency and minimum cost. The tubular plate design, specialized for deep
discharge use by electric vehicles, are more expensive and sacrifice power for the ability
to be repeatedly deep discharged.5
Figure 2.2-2. Lead acid battery plates with (a) flat plates and (b) tubular plates.5

12
2.2.1.5 –Electrochemical Performance
Lead acid batteries are very heavy and bulky but have one major redeeming factor,
expense. Much cheaper than other batteries of similar capacity, VRLAs cost about
150 $∙kWh-1. The reduction potential for the half reaction shown in equation 2, the
negative electrode half reaction, is -0.36V. The positive half reaction, equation 3, has a
reduction potential of 1.69 V. In galvanic (discharge) mode, equation 2, is run as an
oxidation reaction and equation 3 is corresponding reduction reaction. The resulting
standard potential difference (standard open circuit potential), Eo, between electrodes at
25ºC and ambient pressure is 2.04 V. Depending on the electrolyte concentration the open
circuit potential can be somewhere between 1.85 and 2.15 V. VRLA batteries also have
limited cycle life, restricted to approximately only 700 cycles, however, certain traction
batteries can have cycle lives up to 1200. The specific energy of VRLAs are on the order
of 30 Wh∙Kg-1 and have an energy density of 80 Wh∙L-1.3,6
2.2.2 –Lithium Ion
2.2.2.1 – Basic chemistry
Lithium ion batteries work by shuttling lithium ions between molecular lattices
which temporarily hold the lithium until the cell is in use. Non-aqueous electrolytes are
used to keep the lithium ions mobile between the lithium hosts at the negative and positive
electrodes. The net ionic reactions for both the positive and negative electrodes of the most
general case, lithium metal oxide/carbon chemistry is shown below in equations 4 and 5
respectively.7
[4]
[5]
There are a plethora of compounds which can be used for the positive electrode.
The most common positive electrode materials include lithium transition metal oxides (i.e.
LiM2O4 or LiMO2) and lithium transition metal phosphates (LiMPO4).8 Graphite is most
commonly used for the negative electrode, although it is certainly not the only option,
though. Lithium titanate spinel (Li4Ti5O12) is also a viable option and is praised for being
a safer alternative to graphite with a high cycle life (≈20,000) and rapid (constant current)
charging ability.4,6,9This review focuses on two lithium ion combinations, lithium iron
phosphate (LiFePO4) positive electrode with a graphite negative electrode and lithium
manganese oxide (LiMnO2) positive electrode with a lithium titanate spinel negative
electrode.

13
2.2.2.2 – Conventional applications
Lithium ion batteries are becoming highly commercialized and are commonly
found in a gargantuan number of devices. Practically, any rechargeable handheld device
utilizes Li-ion technology including: cell phones, e-readers, tablets, laptop computers, etc..
Many watches, memory backups, handheld sensors, etc. make use of the primary CR2032
LiMnO2 coin cell.3Lithium ion batteries can also be found in the automotive industry
replacing the heavier lead acid and nickel metal hydride(NiMH) packs powering electric
vehicles.
2.2.2.3 – Materials of construction(MOC)
The materials of construction vary depending on the cell; however, some
components remain the same. This includes the separator or insulating material, aluminum
cathodic current collector, copper anodic current collector, non-aqueous liquid electrolyte
and the cell casing, usually metallic coated, with plastic to prevent electrical shorts. The
materials that vary include the negative electrode and positive electrode material. The
negative electrodes analyzed in this study are carbon (C) and lithium titanate oxide
spinel(LTO) and the positive electrodes are lithium iron phosphate(LFP) and lithium
manganese oxide(LMO).
2.2.2.4 – Form factors/construction
In order to adapt the batteries to the variety of different shapes required to fit the
devices that utilize this cell chemistry, several different form factors are required. Figure
2.2-3, below, shows exploded views of four common form factors, cylindrical, coin,
prismatic, thin and flat. The thin and flat configurations boast unique properties such as
being flexible and containing no free electrolyte.10 The prismatic form factor is commonly
used in cell phones and other devices that require a thin profile. The coin form factor is
most commonly used with LiMnO2 primary cells for low power sensory devices due to its
relatively low capacity. The cylindrical variation is manufactured usually conforming to
the AA and AAA size specifications.
Figure 2.2-3. Adapted from Tarascon & Armand. (a) cylindrical (b) coin (c) prismatic (d) thin and
flat. Note the unique flexibility of the thin and flat plastic Li-ion configuration.10

14
2.2.2.5 – Electrochemical Performance
Li-ion batteries have a wide range of chemistries which affect voltage, specific
energy, energy density, stability, and cost. LMO/LTO are one of the most expensive
chemistries, costing upwards of 2000 $∙kWh-1. This battery chemistry also suffers from a
low cell voltage compared to other Li-ion chemistries. While the cathode, LMO, has a
potential of 4.05 V vs. lithium, the anode, LTO, has a potential 1.55 V vs. lithium. This
high oxidation potential reduces the cell voltage to 2.50 V. This battery compensates for
this with its extreme stability, generally lasting for upwards of 18,000 cycles. The battery
has a moderate specific energy of around 100Wh∙Kg-1. LFP/C batteries are a bit more well
rounded with a moderate cost of 350 $∙kWh-1, cycle life of approximately 3000 and
potential of 3.4 V compared with other Li-ion chemistries. The LFP cathode has a potential
of 3.45 V vs. lithium and the graphite anode has a potential of 0.1 V vs. lithium. The
graphite does not have as strong a support as LTO and suffers more degradation per cycle
than its counterpart, thus shorting its lifespan. LFP/C batteries boast an impressive specific
energy of 140 Wh∙Kg-1 and energy density of 380 Wh∙L-1 allowing for relatively small,
lightweight battery packs.3,6
2.2.3 – Sodium Metal halide (NaMx)
2.2.3.1 – Basic chemistry
Sodium metal halide batteries usually use either a nickel chloride or ferric chloride
cathodic material and sodium aluminum chloride electrolyte. Because the electrolyte and
negative electrode are both liquid at operating temperature a β–Al2O3 solid electrolyte
(BASE) membrane is required to transport the sodium ions to and from the
electrolyte.11The complete reaction taking place in the cell is shown below in equation 6.
2Na(l)+NiCl2(aq)↔ 2NaCl(aq)+Ni(s) (6)
When the cell is in a state of discharge, sodium ions react with nickel chloride to
form metal nickel on the nickel positive electrode current collector and sodium chloride.
When charging the sodium chloride reacts with the nickel forming sodium ions which
transport through the BASE membrane and form molten sodium at the negative
electrode.12When performing the initial charge, the metal shims connect the negative
electrode side of the membrane to the anodic current collector completing the circuit. This
allows the charging reaction to occur in the absence of sodium at the negative electrode. A
fully charged cell utilizes the metal wicks to keep the BASE membrane coated in molten
sodium. The wicks can be seen in contact with the membrane in Figure 2.2-4. The anodic
half cell reaction, equation 7, involves molten sodium being oxidized.

15
Figure 2.2-4. Comparison of beta alumina tube cross-sections for first(left) and second(right)
generation cells34
Na↔Na++e- (7)
The sodium ion transports through the BASE membrane and releases an electron
to the negative electrode current collector. In the cathodic reaction, equation 8, nickel
chloride reacts with the sodium ion to form sodium chloride and deposits solid nickel on
the nickel metal current collector. The reactions are reversed when the cell is being charged.
NiCl2+2Na++e-↔2NaCl +Ni (8)
2.2.3.2 – Conventional applications
Sodium metal halide batteries are still being heavily researched and developed, but
has been used in a few applications. In Switzerland, FZ SoNick SA, formerly known as
MES-DEA, is adapting the high-temperature battery system for use in automotive
applications.13Beta R&D, in the UK, has been attempting to deploy a high energy version
for storing renewable energy. Potential marine/navy applications include the NATO
submarine rescue system (NSRS).14Sodium batteries operate at a temperature of
approximately 250-350ºC, which is lower than that of the Na/S batteries but still quite high.
Attempts have been made to reduce the operating temperature to around 150ºC which
would allow for a wider range of applications.15
2.2.3.3 – Materials of construction(MOC)
The sodium nickel chloride battery requires a steel outer casing which also doubles
as the anodic current collector. A tubular BASE membrane and metal wicks are inserted
into the casing. The membrane is filled with a blend of sodium aluminum chloride, sodium
chloride, and nickel powder. A nickel current collector is inserted into the powder and the
cell is sealed. When the cell is heated and charged, molten sodium forms at the negative
electrode and nickel chloride and sodium aluminum chloride remain in the cathodic
compartment. All of the components can be seen laid out in Figure 2.2-5 below.

16
Figure 2.2-5. Components of a sodium nickel chloride cell.12
2.2.3.4 – Form factors/construction
The most common and only form factor used currently for industrial applications
is the square prism design shown above in Figure 2-5. There is research underway to
develop a planar version of the cell but to date no NaMx battery with a planar configuration
is currently being utilized.16 The proposed planar design of the sodium nickel chloride
battery is shown below in Figure 2.2-6.
Figure 2.2-6. Schematic of a laboratory scale planar sodium nickel chloride battery16
A benefit to having a solid electrolyte is the ability to modify its shape, to increase
surface area for example. The first generation cells used a cylindrical tube which caused a
significant increase in positive electrode resistance as the effective electrode resistance
increased during discharge. This was surpassed in the second generation cells by increasing
the surface area by about 40% leading to a reduction in cell resistance contribution by
almost a third.12 The first and second generation designs are shown in Figure 2.2-4 left and
right respectively.
2.2.3.5 – Electrochemical Performance
NaMx batteries have shown performance similar to LFP/C batteries with a cycle
live exceeding 3000 and specific energy around 120 Wh∙Kg-1. NaMx batteries cost less per
kilowatt hour than LFP/C cells with an average price around 290 $∙kWh-1.The average cell
potential, 2.5 V, is comparable to VRLA and MNO/LTO cell chemistries, though, lower
than that of the LFP/C cell. Also, while not the bulkiest, NaMx batteries require twice as
much space as LFP/C cells with an energy density of 190 Wh∙L-1.3,6

17
2.3 – Six criteria for cell performance
In this paper the cells will be analyzed for safety, environmental footprint, life span,
degradation, scalability, and toughness. The safety criteria will focus on the cell’s response
to thermal physical and electrical addressing potential hazards to the mining personnel. The
toxicity of the materials of construction (MOC) to humans will also be taken into account
in case of a cell breach, leading to exposure. The environmental footprint criteria focuses
on the impact the manufacture, recycling, and disposal of these cells have on the
environment. The toxicity of the MOCs to the environment will also be addressed. Life
span focuses on the cycle life and calendar life of the batteries and how the cells compare
to each other. All cells suffer from a degradation of performance, and the degradation
section focuses on each battery’s weakness and what causes the drop in performance. It is
important to be able to scale the cells so that larger devices/equipment can be operated
safely. The ease of scalability section addresses the limitations to scaling and how the
batteries must be scaled in order to prevent failure. The final criterion concentrates on the
cell’s toughness, dealing with how physical damage/stress, rapid thermal changes,
inconsistent electrical loads and rapid charging affect the performance of each battery.
2.4 –Personnel Safety
2.4.1 – Toxicity
PbA batteries are without a doubt the most toxic of those explored in this review.
The MSDS for modern Pb-Ca lead acid batteries still contain up to 2 wt.% antimony and
0.2 wt.% arsenic. Lead accounts for approximately 60% of the battery by weight. The
corrosive aqueous sulfuric acid electrolyte accounts for anywhere from 10-30% of the
weight depending on the cell type. Arsenic and lead are well known toxins and can cause
systemic system failure in humans if not immediately and professionally treated. Sulfuric
acid is very caustic and can cause severe respiratory damage if the electrolyte is vaporized
and aspirated or burns if in contact with skin.
The lithium ion batteries reviewed in this study contain lithium iron phosphate,
graphite, manganese oxide, lithium titanate spinel nanofibers, aluminum, copper, and non-
aqueous electrolytes. According to the MSDS, the non aqueous electrolytes make up
approximately 12-17 wt. % of the battery and are the most toxic materials including but
not limited to: ethylene carbonate, dimethyl carbonate, ethyl methyl carbonate, lithium
hexafluorophosphate. According to the MSDS, California prop 65, none of the MOCs for
the lithium ion batteries are known to cause cancer or reproductive toxicity.
Sodium batteries contain sodium aluminum chloride which, according to the
MSDS, is corrosive. It is known that nickel chloride may have mutagenic affects on organs
such as the blood, skin, mucous membranes, kidneys, liver and upper respiratory tract. The
other MOC are either inert or do not pose any serious toxicity risks. As with the other cells,
under normal operating conditions, the end user does not come into contact with the
hazardous MOC.

18
2.5 – Environmental impact
2.5.1 – Hazards from MOC
The PbA battery would be the most hazardous of the three, not only containing the
most toxic materials such as lead, sulfuric acid and arsenic but is the least structurally
sealed of the three. Many SLI batteries, found in automobiles, only have plastic covers
separating the electrolyte from the environment. VRLA batteries are at least sealed off from
the environment, but still contain materials that are still exceptionally harmful to the
environment especially in aquatic environments. If there was a leak underground, the
materials could cause contamination of the surrounding area. Due to the extreme toxicity
of this battery’s chemistry a large recycling infrastructure is in place to minimize if not
eliminate the waste from depleted cells.
Li-ion batteries are completely sealed and surrounded by an inert polymer. The
polymer coating helps prevent shorts and limits exposure to the elements. The internal
materials are significantly safer than those contained in the PbA cell though still toxic to
marine environments. While a moderate recycling initiative is in place there is a good deal
of waste being generated by improper disposal of depleted batteries. The large, industrial
scale, packs are generally returned/exchanged with the original equipment manufacturer
(OEM).
Sodium metal halide batteries hold a fairly small share in the commercial markets,
being tailored more toward industrial uses. This allows for tighter regulation and a smaller
infrastructure for the depleted cells to be returned or exchanged for new cells. The battery
case is so intensively robust there is very little probability that the MOC will be released
into the environment. The battery does still contain materials that would be toxic to the
environment if the battery were to spend an extended amount of time exposed to the
elements such as in a landfill.
2.6 –Life Span
2.6.1 – Cycle Life
Cycle life is defined as the amount of charge discharge cycles a battery can
complete before its capacity is depleted (< 80% of initial capacity) and varies depending
on the depth of discharge (DoD). Capacity is defined as the amount of charge a battery can
store and is typically measured in amp hours (Ah). The voltage during discharge or
nominal voltage multiplied by the capacity is used to calculate the energy measured in watt
hours (Wh). Table 2.6-1 shows range for each characteristic, to cover the spectrum of
different cell sub-types available for each battery chemistry. The common DoD is
dependent on battery type.8While 80% is standard DoD for PbA, Li-ion, and NaMx,
without any major cycle life decrease, some battery chemistries such as MNO/LTO
batteries can repeatedly reach a DoD of 100%.3 The spinel lithiation reaction proceeds
topotactically allowing for a 100% DoD while causing zero volumetric strain. Li-ion
batteries have a large cycle life range due to the multitude of cell chemistries available.
LFP batteries have a cycle life around 3,000, while lithium titanate spinel batteries have
cycle lives upwards of 10,000+.9PbA batteries depend on the type of plate used. The flat

19
plate design commonly used for SLI batteries only have about a 500-700 cycle life span
where as the tubular plate design used in electric vehicles (i.e. traction batteries) have
longer lives upwards of 1200-1500 cycles.3 NaMx batteries have comparable lives to LFP
batteries around 3000 cycles.
Table 2.6-1. General table of technologies and their characteristics adapted from Ferreira et al.33
2.6.2 – Calendar Life
Calendar life is a factor of temperature and time. The battery’s capacity will fade
over time regardless of usage. This statistic is useful for applications that require long term
storage or infrequent use. Calendar life is also known as chronological durability as is used
in Table 2.6-1. Li-ion, NaMx, and PbA batteries all have similar chronological life spans,
as seen in Table 2.6-1 above, ranging from 5-20 years plus or minus a few years depending
on the cell in question.
2.7 –Degradation pathways
Cell degradation occurs with each charge and discharge cycle. Whether it is
corrosion, electrochemical side reactions, or irreversible deposition, every cell has its
weakness. PbA batteries suffer from a process known as sulfation, which includes a
multitude of failure mechanisms, some of which include positive grid corrosion, a
passivating lead oxide film on the positive electrode, and formation of lead sulfate at the
negative electrode. Lead dioxide reacts with the lead positive electrode current collector to
form a divalent lead salt, an irreversible corrosion process. A passivating layer of lead
oxide forms on the positive electrode reducing the corrosion rate of the positive electrode,
however, the thicker the layer becomes, the higher the batteries internal resistance
develops. This occurs from long term storage at low states of charge (SoC). The oldest and

20
most well known method of failure for PbA batteries is lead sulfate crystal growth at the
negative electrode. Over time under deep discharge conditions lead sulfate recrystallization
makes it difficult if not impossible to recharge the battery.17,18
Lithium batteries also suffer from multiple degradation methods such as anodic
carbon microcracking, active lithium loss, and cathodic metal ion migration. In a recent
cell performance analysis by Liu et al. an SEM analysis of the negative electrode surface
revealed the formation of microcracks. The anodic microcracks can be seen below in
Figure 2.7-1.
Figure 2.7-1.SEM images of negative electrodes from as received and end of life cells adapted from
Liu et al.19
Lithiated carbon is only effective with the presence of a solid-electrolyte interphase
(SEI) layer at its surface. Because the SEI layer acts as an ion conductive barrier between
the negative electrode and the non-aqueous electrolyte its stability is of great importance.
Capacity is lost in the construction and maintenance of the SEI layer, therefore, long term
storage can lead to capacity loss. As for the positive electrode, LiFePO4 can experience
similar degradation from Fe ions dissolving into the electrolyte and migrating toward the
negative electrode.19
Figure 2.7-2. SEM image of Ni/NaCl positive electrode after cycling adapted from Lu et al.16
21
Sodium metal halide batteries are not immune from degradation either. Nickel can
dissolve in the electrolyte and while the solubility of nickel is low in molten sodium
aluminum chloride, long term use of the cell can result in the formation of particles over
40 µm in diameter, large enough to cause issues. Oversized sodium chloride particles can
cause an issue as well. Small particles will tend to disappear upon charging and redistribute
when the cell is in a state of discharge. If the particles grow too large, however, enough of
the active material is blocked to cause a decrease in capacity. SEM analysis, shown in
Figure 2.7-2, of a lab built cell by Lu etal. revealed a distribution of NaCl and NiCl2 on the
positive electrode after cycling.
2.8 – Ease of Scalability
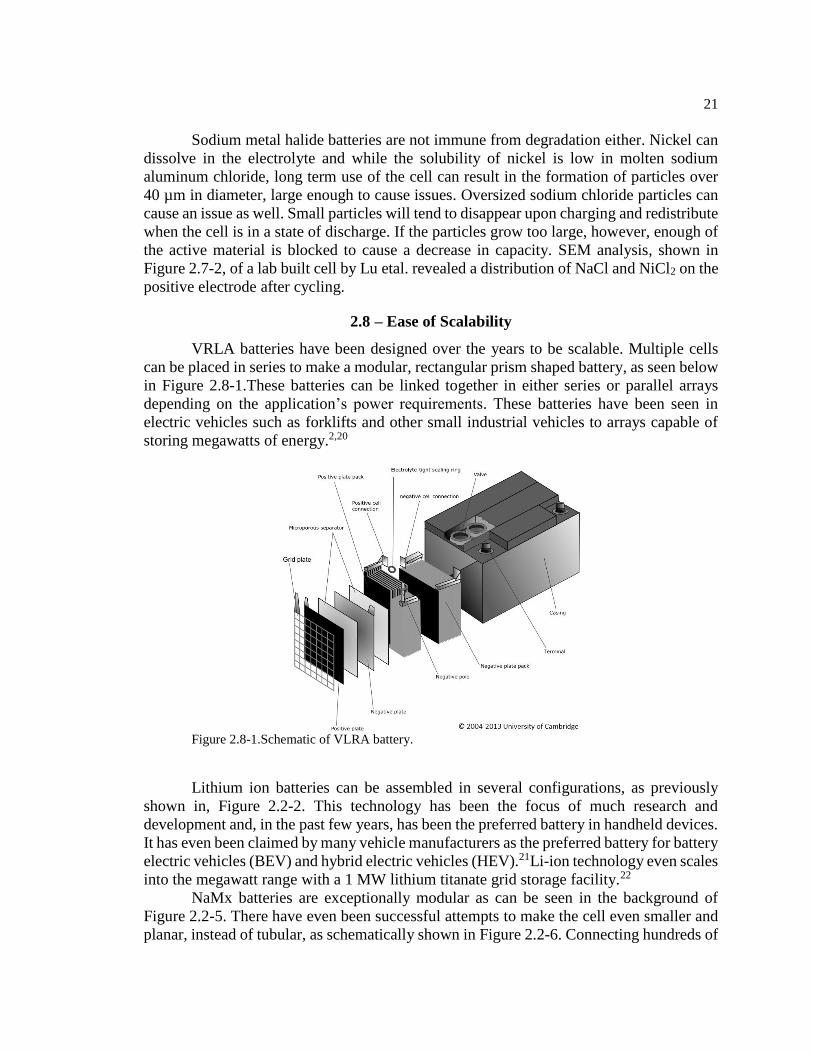
VRLA batteries have been designed over the years to be scalable. Multiple cells
can be placed in series to make a modular, rectangular prism shaped battery, as seen below
in Figure 2.8-1.These batteries can be linked together in either series or parallel arrays
depending on the application’s power requirements. These batteries have been seen in
electric vehicles such as forklifts and other small industrial vehicles to arrays capable of
storing megawatts of energy.2,20
Figure 2.8-1.Schematic of VLRA battery.
Lithium ion batteries can be assembled in several configurations, as previously
shown in, Figure 2.2-2. This technology has been the focus of much research and
development and, in the past few years, has been the preferred battery in handheld devices.
It has even been claimed by many vehicle manufacturers as the preferred battery for battery
electric vehicles (BEV) and hybrid electric vehicles (HEV).21Li-ion technology even scales
into the megawatt range with a 1 MW lithium titanate grid storage facility.22
NaMx batteries are exceptionally modular as can be seen in the background of
Figure 2.2-5. There have even been successful attempts to make the cell even smaller and
planar, instead of tubular, as schematically shown in Figure 2.2-6. Connecting hundreds of
22
these modular cells together and placing them in a heated, thermally insulated, protective
case allows them to be a viable option for larger applications such as electric vehicle or
mining equipment and grid backup systems.
2.9 –Toughness
2.9.1 – Reliability
PbA cells are very reliable batteries if utilized properly. The cells should not be
overcharged or stored below 2.1 V. Overcharging will cause gassing of the electrolyte
which is detrimental if the pressure triggers the pressure relief valves as there is no way of
replenishing the lost water. The release of hydrogen and oxygen in an underground mine
increases the amount of flammable substances in the air, thus increasing the chance of an
explosion. Discharging only to 80% DoD will prolong life, however, the upper limit to
VRLA cycle life is only around 1500. Thermal regulation is minimal in mining applications
as the operational range is between -40 and 60 ºC. Cell reliability will significantly decrease
outside the aforementioned temperature range. Humidity is of little concern to the battery’s
internals as it is sealed from the outside environment, though even if “flooded” type cells
were used humidity would be all but irrelevant. VRLA cells are relatively maintenance free
if the aforementioned care is taken in its use.
Li-ion batteries are also very reliable cells, again, if properly operated. The cells
should never be overcharged or stored at full charge. Discharging below 80% DoD will
shorten its lifespan. Different battery chemistries have maximum charging rates which
should be obeyed to avoid decreased life. Thermal regulation is a larger concern with Li-
ion batteries as storing above room temperature can cause irreversible self discharge of the
cell. Thermal runaway becomes increasingly more probable as the cell temperature
increases past 60 ºC. The battery will exhibit increasingly unpredictable behavior the
further it is from its operational temperature range of -40 – 60 ºC. Humidity is, again, only
a secondary concern as the cell has a polymer coating to prevent outside moisture from
reaching the reactive lithium inside. If crushed or punctured, however, even a low relative
humidity is enough to react with the battery, potentially causing a fire or explosion.
NaMx cells are exceptionally protected from environmental conditions. The double
layer, vacuum insulated, steel casing manages internal cell temperature. This makes the
environmental temperature irrelevant, within reason. Significant testing was conducted by
an independent automotive technology center called MIRA. In a 1998 NREL report23,
MIRA brought suspended a fully charged, fully functional battery 40 cm over a pool of
burning gasoline. The vacuum between the double walled steel case was even released
remove its effect as a thermal insulator. The battery case remained intact, all cell voltages
remained normal and there were no signs of excessive heat buildup.23 While this test was
performed with automobiles in mind, but, it is important to know that these batteries can
remain intact when in contact with fire. In a mining setting, if there was a conflagration or
fire the batteries would be able to withstand the heat until either the fire was extinguished
or miners were able to evacuate the area. Although the cells can be stored in their solid
state, they require a lengthy cool down and warm up time. The BASE membrane is subject
to thermal cracking and may do so if thermal stress is applied by a rapid or repeated

23
temperature change. Because the cells are so far removed from the outside environment,
though, humidity is of no concern despite the high reactivity of the molten sodium.
2.9.2 – Cell Durability
2.9.2.1 – Thermal Resilience
The main concern for PbA and Li-ion batteries are high temperatures. Both cells
have a similar thermal window of operation, Li-ion -20 – 60 ºC and PbA -40 – 60 ºC with
some variations having a smaller range. Lead acid batteries can generate oxygen and
hydrogen which can cause an explosion. This has been mitigated in sealed (SLA) or valve
regulated (VRLA) models but if the pressure relief valves were to be triggered, the gases
released pose an explosion hazard.
Li-ion batteries are also dangerous when overheated. Due to the fact that lithium
aggressively reacts with water, only non aqueous electrolytes can be utilized in
construction. While attempts have been made to use non flammable electrolytes, current
models utilize flammable electrolytes with fire retardant additives. Also, as the battery
heats up, the decomposition of metastable charged products is more favorable. The
decomposition is exothermic and typically releases oxygen gas. The exothermic reaction
further heats the cell causing a thermal runaway until the cell ignites or explodes.24
Combustion of the cell components would be accelerated by the oxygen gas produced due
to the decomposition reaction.
Sodium batteries operate between 250-350 ºC which requires external heating and
thermal insulation. This is both an advantage and a disadvantage. The heaters and
insulation add to the manufacturing cost and require energy to operate. Additionally, the
ceramic membranes must be heated slowly, sometimes taking upwards of 48 h, depending
on the size of the cell array. However, once at temperature, the cell temperature is not
dependant on the outside environment. Thermocouples can regulate the cell temperature to
adapt to environmental variations.
2.9.2.2 – Physical Resilience
Lead acid batteries are fairly resilient being encased in thick durable polypropylene.
A big enough jolt, however, can cause the case to crack and, therefore, a secondary
containment unit would be required. This is hazardous regardless of the battery style. If a
VRLA is breached depending on the location of the breach, pressurized oxygen, hydrogen,
sulfuric acid containing lead sulfate or a mixture could be released. This mixture is toxic,
corrosive and flammable. Even if a flooded PbA cell is breached, sulfuric acid could leak
out which most likely will contain dissolved lead sulfate, both toxic and corrosive.
Li-ion batteries are also encased in shock resistant polymers. If one is jolted enough
to crack, or if it is punctured, it can quickly become dangerous. The puncture could create
an internal short, which would generate a large amount of heat. If the hermetic seal has
been breached, moisture from the environment could react with the lithium generating heat
and hydrogen gas. The heat from either could initiate the decomposition reaction in the
previous section leading to a thermal runaway enhanced by oxygen gas in the
aforementioned reaction. Secondary containment is suggested as well as several
temperature monitors to make sure the temperature does not reach critical levels. MSHA
certification would also be required for any secondary containment to be utilized.
24
Sodium batteries are at a bit of an advantage in this scenario. The array is contained
in a temperature-controlled, double-walled, sealed, vacuum-insulated battery case.23This
will allow the array to survive significantly more physical abuse than the other mentioned
batteries. In the 1998 NREL report23, it was also stated that MIRA, the independent
automotive technology center, conducted several impact and penetration tests, none
resulted in a release of inner cell material. Furthermore, it was stated the battery case was
specifically designed to crumple in a manner such as to seal the breach. This is important
because the internal materials would react more violently than lithium with water and even
water vapor in the atmosphere if released.
2.9.2.3 – Electrical Resilience
PbA batteries are usually charged by a constant voltage of 2.4 V. the cell is then
maintained at full charge with an applied potential of 2.24 V, called float charging. If the
battery is undercharged or stored below 2.1 V, sulphanation can occur degrading the
batteries future performance.3This cell chemistry is fairly tolerant of overcharging, though,
it is not recommended. Overcharging the cell results in water electrolysis of the electrolyte,
commonly referred to as gassing. While this poses no immediate threat to the cell, the
electrolyte will start to dry up as it is electrolyzed. The resulting hydrogen and oxygen
mixture is flammable and in an underground mine would increase the probability of a
conflagration or explosion.
Li-ion batteries are commonly charged by a constant current to a voltage between
4.1 and 4.2 V. The batteries should never be stored at full charge as doing so could result
in irreversible self discharge.3 Li-ion cells are not very tolerant of being over charged. Upon
overcharging, the cell experiences expansion which is significant enough, in some cases,
to cause a cell breach. The cell temperature increases rapidly upon overcharge, which if
unchecked would lead to thermal breakdown of metastable components releasing heat and
oxygen. This positive feedback leads to a thermal runaway. The excessive heat, flammable
electrolyte and oxygen gas leads to fire and explosion despite the addition of flame
retardant additives. This can also happen to the cell if it is charged too quickly.
A charging regime was developed by Beta R&D which resulted in stable capacity
for over 3,000 cycles. Limiting the current to 15 A per 32 Ah cell, or 0.47C, a 2.67 V
potential was applied. The charging was stopped when the current fell below 0.5
A/cell(0.02C).12 The NaMx battery is exceptionally tolerant to overcharging. Upon
overcharge, the sodium aluminum chloride will react with the nickel positive electrode to
form nickel chloride. If overcharge continues, even after the nickel metal is consumed, the
electrolyte itself starts to decompose to sodium metal, chlorine gas, and aluminum chloride.
The cell can be 100% overcharged before chlorine is evolved. The electrolyte is also useful
in the event of over-discharge reacting with sodium to form sodium chloride and aluminum
metal.23
2.10 – Mining Equipment
PbA batteries are the most developed among the automotive applications market.
Advanced VLRA batteries have been able to provide relatively safe and maintenance free
power for electric vehicles. Though heavy, the $100-150 kWh-1price tag is reasonably
affordable. Another reason VLRA batteries have been limited to industrial applications is

25
that they have quite low specific energy ranging from 35-40 Wh∙kg-1.20Since even
relatively light duty mining vehicles such as locomotives, LHD machines require large
amounts of energy to run, these batteries would be better suited for conveyor motors, fans
and pumps etc.
Li-ion technology has the biggest portion of the commercial market to date. The
technology is capable specific energies around 125 Wh∙kg-1, allowing for ranges in excess
of 150 miles. The batteries, however, are not without flaw. The high cost, $700-
1200 kWh-1, combined with degraded power capacity at low temperatures and chemistry
dependent flaws such as degradation show this technology still has room for improvement.3
Li-ion batteries offer more power in relatively smaller, lighter weight packages than most
other batteries currently available. These batteries, however, are fairly sensitive to high
temperatures and harsh environmental conditions, so caution should be used selecting this
cell type for underground mining. Intense scrutiny should be focused on the containment
of the lithium cells, if selected, and all containment would require MSHA certification.
Sodium metal halide batteries are the preferred sodium beta battery (NBB), with
respect to electric vehicles. The cells provide a specific energy of around 115 Wh∙kg-1 and
hold a comparatively low price tag of approximately $600 kWh. One major limitation is
the operating temperature of 250-300 ºC. This limitation has all but restricted this cell
chemistry from being used in commercial vehicles. It is currently being considered for high
frequency applications which keep the battery in constant use. Such applications include
public transportation and mining vehicles.20,25 NaMx batteries, having similar
electrochemical performance to Li-ion batteries and offer a more reliable option for
underground mining. This battery type is isolated from the environment by a double walled
vacuum insulated steel container and offer protection from the harsh operating conditions
in the mine.
2.10.1 Soft Rocks
Soft rocks usually are part of the sedimentary minerals classification. This is further
categorized into three subdivisions: clastic, organic, and chemical. Coal, shales, potash,
salt, and trona encompass the majority of soft-rock ores. The most common geographical
layout for these ores consists of laterally extensive beds in a nearly horizontal inclination
but with, at most, a shallow dip angle.26In underground mining, especially for coal mining,
mining equipment has a significant role in industry. The best equipment combination
should be employed to ensure efficient mining. Furthermore, the more efficient the
machines are at extraction, the higher the profit margin will be. Therefore, the ability to
use a greater number of battery powered than diesel powered machinery in the same area
of the mine is of significant interest.
2.10.2 Underground Soft Rock Mining Methods
Current mining methods are so diverse that any ore type can be extracted by
adapting existing extraction methods. Underground methods require an extensive
evaluation of the geological variables.27 Underground mining methods are classified into
three groups: unsupported, supported and caving. Unsupported methods include room-and-
pillar, stope-and-pillar, shrinkage stoping, sublevel stoping and vertical crater retreat; the

26
supported group includes cut-and-fill and the caving category includes longwall, sublevel
caving.28
Every mining method has benefits and risks that must be understood when
determining the technique to be used for a given set of variables.29This is especially
important when determining duration of mine operation, operating costs and required
capital as an uninformed decision can result in significant loss of profit. Room and pillar
and longwall are among the most utilized in coal mining and are expanded upon below.
Using battery powered mining vehicles in underground soft rock methods can be more
economic and is a safer technology for underground mining methods.
2.10.2.1 Room and Pillar Method
The room and pillar mining method is popular for tabular and lenticular deposits
and is frequently applied in soft-rock mines. The most important parameters for this
method are the position of the ore-body, elevation of the mining horizon, slope of the ore
and depth of the deposit. This method is used if there is no need to drill or blast which is
usually the case in soft rock mining. Continuous miners are the preferred equipment for
this method. This type of autonomous miner uses a large rotating drum to break the
material in front of the platform. After that an internal part loads the broken ore onto the
onboard conveyor. The material is then sent to a separate haulage system which carries the
material to the surface, usually consisting of a shuttle car and locomotive or a belt
conveyor.26 For the room and pillar underground mining method, using the battery
powered mining vehicles can be more efficient due to the relatively larger space in the
underground rooms. LHDs will have enough space to easily maneuver even with the large
battery packs at the rear of the vehicle. High maneuverability allows for greater ease in
charging the vehicles or the maintenance of the equipment.
2.10.2.2 Longwall Mining Method
The longwall mining method is generally combined with the room-and-pillar
technique to generate the most efficient and highest-producing underground coal mines.
Initially the main entries follow the conventional room and pillar techniques and are created
using continuous miners. In this method, a series of panels, branching perpendicular from
the main entries, are bounded by a two-to-three entry room-and-pillar border, leaving a
huge solid block of coal within it.30 A longwall shearer, armored face conveyor and shield
wall are moved to the end of the panel before longwall mining commences. The shearer
moves back and forth across the coal block, excavating only the ore, causing the material
to fall onto the conveyor and be transported away to the main belt conveyor system. The
shields advance along with the shearer to hold up the roof directly above the equipment.
The excavated area behind the shields is allowed to collapse. Mining progresses as
continuous miners develop additional longwall panels and the shearers are moved from
one to the next throughout the course of the mine life.28 Though longwall equipment
requires too much power, LHDs and locomotives are irreplaceable and possess power
requirements within the range to be considered for conversion to battery power.
2.10.3 Mining Vehicles
In underground coal mining, the most common vehicles are locomotives, load-haul-
dump vehicles (LHDs), continuous miners, and longwall equipment. As mentioned before,

27
continuous miners, and longwall equipment require too much energy to make battery
conversion feasible. The locomotives and LHDs are most commonly powered by diesel
engine. Several companies, however, have shown a large interest in powering these
vehicles solely from battery power. According to the mining methods and all other
parameters such as material strength, ore type, rock mass etc, it is very important to choose
the best suited vehicles and power systems.
2.10.3.1 Locomotives
Transportation of miners and materials underground is one of the most significant
operations in the mining sector. For this reason, locomotives are mainly used in
underground mines due to their capabilities. There are different types of locomotives such
as diesel powered, battery powered and trolley locomotives. Locomotives have been used
for many years in underground mining and because of their reliability and are preferred as
an easy, economical transportation vehicle.
In a study conducted by the DOE a four-ton battery locomotive (Figure 2.10-1)
manufactured by RA Warren Equipment was adapted to run off a PEM fuel cell.31 The
battery pack on the commercial model consists of 52 VRLA cells yielding a nominal
potential of 104 V. The capacity, as well as cycle life and rate of charge could be increased
by replacing the VRLA cells with either NaMx or Li-ion Cells.
Figure 2.10-1. 4-ton (7.2 kW) Underground mining locomotive31
The technical specifications of the battery operated vehicle were used to estimate
the parameters of battery packs of similar volume to that of the standard pack but of
differing cell chemistries. A volume of 500 L was estimated by dividing the specified
capacity of 43 kWh by the average energy density of VRLA as specified in section 2.2.1.5.
The run time was calculated by dividing the gross capacity (43 kWh) by the power of the
locomotive (7.2 kW). This ratio was used to estimate the approximate run time for the
higher capacity packs. The results, shown below in Table 2.10-1, demonstrate how cell
chemistry affects the battery cost and duration of locomotive operation.
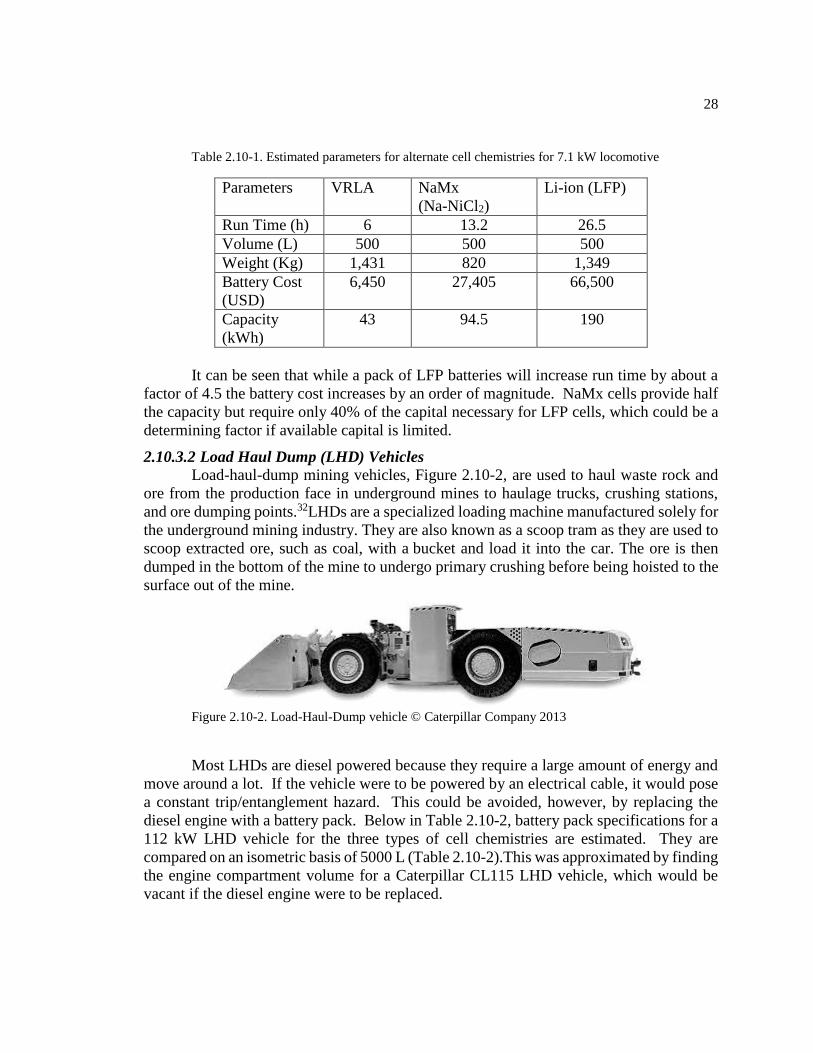
28
Table 2.10-1. Estimated parameters for alternate cell chemistries for 7.1 kW locomotive
Parameters VRLA NaMx
(Na-NiCl2)
Li-ion (LFP)
Run Time (h) 6 13.2 26.5
Volume (L) 500 500 500
Weight (Kg) 1,431 820 1,349
Battery Cost
(USD)
6,450 27,405 66,500
Capacity
(kWh)
43 94.5 190
It can be seen that while a pack of LFP batteries will increase run time by about a
factor of 4.5 the battery cost increases by an order of magnitude. NaMx cells provide half
the capacity but require only 40% of the capital necessary for LFP cells, which could be a
determining factor if available capital is limited.
2.10.3.2 Load Haul Dump (LHD) Vehicles
Load-haul-dump mining vehicles, Figure 2.10-2, are used to haul waste rock and
ore from the production face in underground mines to haulage trucks, crushing stations,
and ore dumping points.32LHDs are a specialized loading machine manufactured solely for
the underground mining industry. They are also known as a scoop tram as they are used to
scoop extracted ore, such as coal, with a bucket and load it into the car. The ore is then
dumped in the bottom of the mine to undergo primary crushing before being hoisted to the
surface out of the mine.
Figure 2.10-2. Load-Haul-Dump vehicle © Caterpillar Company 2013
Most LHDs are diesel powered because they require a large amount of energy and
move around a lot. If the vehicle were to be powered by an electrical cable, it would pose
a constant trip/entanglement hazard. This could be avoided, however, by replacing the
diesel engine with a battery pack. Below in Table 2.10-2, battery pack specifications for a
112 kW LHD vehicle for the three types of cell chemistries are estimated. They are
compared on an isometric basis of 5000 L (Table 2.10-2).This was approximated by finding
the engine compartment volume for a Caterpillar CL115 LHD vehicle, which would be
vacant if the diesel engine were to be replaced.

29 Table 2.10-2. Estimated parameters for alternate cell chemistries for 112kW LHD
Parameters VRLA NaMx
(Na-NiCl2)
Li-ion (LFP)
Run Time (h) 4 8.5 17
Volume (L) 5,000 5,000 5,000
Weight (kg) 14,310 8,200 13,490
Battery Cost
(USD)
64,500 274,050 665,000
Capacity
(kWh)
430 945 1,900
The NaMx cells would provide enough energy to last one 8-hour shift and would
be the lightest of the three packs at just over 8,000 kg. An LFP pack would last more than
two shifts but costs 60% more than the NaMx battery pack. Since a VRLA pack would
only last 4 hours, requiring the operator to replace the battery during the shift. However,
the battery is significantly cheaper than the other two and may make up for the inefficiency
of lasting only half a shift.
2.11 – Conclusions
In this study, high priority equipment for soft rock mining methods, such as room
and pillar and longwall mining, were explored for their feasibility to be converted to run
on battery power. Most commonly used for soft rock ores such as coal, locomotives,
LHDs, continuous miners and longwall equipment are the most common vehicles for these
underground mining methods.
Three modern battery chemistries used for vehicles, VRLA, NaMx and Li-ion, were
analyzed for their ability to withstand the harsh environmental conditions found in
underground mines. These include but are not limited to varying temperatures, high
humidity, flammable vapors, high temperature, and crushing hazards. Batteries in this
environment must be able to operate safely and efficiently to be considered adequate for
use in mining vehicles. Despite being the most developed of the batteries, VRLA batteries
have exceptionally low energy density and contain exceptionally toxic internal materials
making it the least favorable choice of the three. Two specific Li-ion cell chemistries were
reviewed, LFP/C and LMO/LTO. LMO/LTO batteries are exceptionally stable, offer an
exceptional cycle/calendar life and are exceptionally expensive. Along with an expensive
price tag this type of Li-ion cell also possesses a low energy density. These detriments
make it an unlikely candidate for use in these machines. LFP batteries are more sensitive
to heavy current draw or over-discharging, however, LFP/C cells compensate for this with
a moderate price per kilowatt-hour and the highest energy density of the types explored.
NaMx batteries offer a decent middle ground between the low cost and energy
density of VRLA batteries and high cost and energy density of LFP batteries. A major
drawback of this battery type is the required operating temperature of 250-350 ºC. This
issue is offset by the insulated, double walled, steel container isolating it from the external
environment. The steel, cell case is also beneficial in protecting the individual cells from

30
crushing and puncture hazards. Furthermore, due to the fact that the battery will be
undergoing constant use, no cooling/heating cycles will be necessary.
It was found that locomotives and LHD vehicles could be adapted to run on battery
power, however, continuous miners and longwall equipment require too large/expensive a
battery pack to convert to battery power. It was shown that in a 4-tonne, 7.1kWh,
locomotive a pack of LFP batteries will increase run time by about a factor of 4.5 over a
VRLA pack of the same volume. The battery cost, however, increases by an order of
magnitude. While NaMx cells provide half the capacity, they require 60% less capital than
the LFP cells. Since no examples of battery powered LHDs were found in literature, the
volume engine compartment was determined for a standard Caterpillar model LHD
vehicle. Since the diesel engine would be absent in a battery powered vehicle, this presents
an approximation of how much space would be available for a battery pack. The resulting
calculations for the approximate energy capacity of each battery type, in a 5,000 L package,
are shown in this paper. The NaMx would provide enough energy to last one 8-hour shift
and would be the lightest of the three packs at just over 8,000 kg. An LFP pack would last
more than two shifts but costs 60% more than the NaMx battery pack. Since the VRLA
would only last 4 hours, it would require charging twice a shift. The battery is significantly
cheaper than the other two, however, and may compensate for the inconvenience of lasting
only half a shift.
This review explores major equipment for soft rock mining techniques and the
possible options for powering them. Though, a significant amount of studies have been
conducted with PbA and Li-ion batteries, NaMx research is still in its infancy. Further
electrochemical studies are required for this battery type including but not limited to
membrane durability and impedance testing to better understand the scalability of these
batteries.
2.12 – Acknowledgements
The authors gratefully acknowledge the financial support of this work by General
Electric. We thank Patrick Jansen, for his valuable discussion of the results

31
2.14 Publication 1 References
1. Reddy, T. & Linden, D. Linden’s Handbook of Batteries. 1457 (McGraw-Hill
Professional Publishing, 2010).
2. Parker, C. Lead–acid battery energy-storage systems for electricity supply networks.
J. Power Sources 100, 18–28 (2001).
3. Pistoia, G. Battery Operated Devices and Systems. 387 (2009).
4. Haas, O. & Cairns, E. . Electrochemical energy storage. Annu. Reports Sect.
C"(Physical Chem. (1999).
5. Dell, R. Batteries fifty years of materials development. Solid State Ionics 134, 139–
158 (2000).
6. Tie, S. F. & Tan, C. W. A review of energy sources and energy management system
in electric vehicles. Renew. Sustain. Energy Rev. 20, 82–102 (2013).
7. Reddy, T. & Linden, D. Linden’s Handbook of Batteries. 1457 (McGraw-Hill
Professional Publishing, 2010).
8. Park, J.-K. Principles and Applications of Lithium Secondary Batteries. 382 (Wiley-
VCH Verlag GmbH & Co. KGaA, 2012).
9. Yang, Z. et al. Electrochemical energy storage for green grid. Chem. Rev. 111, 3577–
613 (2011).
10. Tarascon, J. M. & Armand, M. Issues and challenges facing rechargeable lithium
batteries. Nature 414, 359–67 (2001).
11. Zyl, A. Van. Review of the zebra battery system development. Solid state ionics
(1996). at <http://www.sciencedirect.com/science/article/pii/0167273896002007>
12. Sudworth, J. The sodium/nickel chloride (ZEBRA) battery. J. Power Sources 100,
149–163 (2001).
13. Galant, S., Peirano, E. & Debarberis, L. in Adv. Technol. Futur. Transm. Grids
(Migliavacca, G.) 247–284 (Springer London, 2013).
doi:10.1007/978-1-4471-4549-3
14. Chen, H. et al. Progress in electrical energy storage system: A critical review. Prog.
Nat. Sci. 19, 291–312 (2009).
15. Li, G. et al. Novel ternary molten salt electrolytes for intermediate-temperature
sodium/nickel chloride batteries. J. Power Sources 220, 193–198 (2012).
16. Lu, X., Coffey, G., Meinhardt, K. & Sprenkle, V. High power planar sodium-nickel
chloride battery. ECS … 28, 7–13 (2010).
17. Catherino, H. a., Feres, F. F. & Trinidad, F. Sulfation in lead–acid batteries. J. Power
Sources 129, 113–120 (2004).
18. Culpin, B. & Rand, D. Failure modes of lead/acid batteries. J. Power Sources 36, 415
(1991).
19. Liu, P. et al. Aging Mechanisms of LiFePO[sub 4] Batteries Deduced by
Electrochemical and Structural Analyses. J. Electrochem. Soc. 157, A499 (2010).
20. Gerssen-Gondelach, S. J. & Faaij, A. P. C. Performance of batteries for electric
vehicles on short and longer term. J. Power Sources 212, 111–129 (2012).
21. Division, E. S. A Review of Battery Life-Cycle Analysis : State of Knowledge and
Critical Needs.
22. Roberts, B. Capturing grid power. Power Energy Mag. IEEE 7, 32–41 (2009).

32
23. Trickett, D. in NREL Publ. 1–53 (1998). at
<http://www.nrel.gov/docs/fy99osti/25553.pdf>
24. Grey, C. P. Rechargeable Batteries for Transport and Grid Applications: Current
Status and Challenges. Energy, Transp. Environ. 253 – 271 (2012).
doi:10.1007/978-1-4471-2717-8
25. Veneri, O., Migliardini, F., Capasso, C. & Corbo, P. ZEBRA battery based propulsion
system for urban bus applications: Preliminary laboratory tests. 2012 Electr. Syst.
Aircraft, Railw. Sh. Propuls. 1–6 (2012). doi:10.1109/ESARS.2012.6387489
26. Nieto, A. SME Mining Engineering Handbook. 389–396
27. Hartman, H. L. & Mutmansky, J. M. Intoductory Mining Engineering. 570 (2002).
28. Nieto, A. Key deposit indicators (KDI) and key mining method indicators (KMI) in
underground mining method selection. Trans. Soc. Mining, Metall. Eng. 328, 381–
396 (2011).
29. Hustrulid, W. A. Underground Mining Methods Handbook. (1982).
30. Buchan, G. Long panels for longwall mining at Cyprus twentymile Coal. Min. Eng.
50, 21–27 (1998).
31. Miller, A. & Barnes, D. Advanced underground vehicle power and control fuelcell
mine locomotive. Proceeding 2002 US DOE Hydrog. … 1–7 (2002). at
<https://www.eere.energy.gov/hydrogenandfuelcells/pdfs/32405a30.pdf>
32. Bhattacherya, I., Dunn, P. & Eger, T. Development of a new operator visibility
assessment technique for mobile equipment. JOURNAL-SOUTH AFRICAN … 87–
92 (2006).
33. Ferreira, H. L., Garde, R., Fulli, G., Kling, W. & Lopes, J. P. Characterisation of
electrical energy storage technologies. Energy (2013).
doi:10.1016/j.energy.2013.02.037
34. Galloway, R. & Haslam, S. The ZEBRA electric vehicle battery: power and energy
improvements. J. Power Sources 164–170 (1999).

33
Chapter 3.
Performance Analysis of Electric and Diesel Equipment for Battery
Replacement of Tethered LHDs Vehicles in Underground Mining
The contents of this chapter has been accepted for publication by the Journal of the
South African Institute of Mining and Metallurgy and is referenced as: Schatz, R.S., Nieto,
A., Dogruoz, C., and Lvov, S.N., 2016. Performance Analysis of Electric and Diesel
Equipment for Battery Replacement of Tethered LHDs Vehicles in Underground Mining
South African Institute of Mining and Metallurgy
Preface
After the selection of the battery chemistries that are best suited for the hostile
environment of underground mining, the performance of the LHD needs to be determined.
In this chapter, operational data for entire fleets of diesel and electric LHDs from an
underground gold mine in Peru was analyzed. The results of this analysis were used to
estimate the performance data for battery powered LHDs. The primary author carried out
all calculations and data analysis conducted in this study.

34
Abstract
LHDs, haulers, and locomotives are essential to both hard and soft rock mining and
drilling jumbos are used exclusively for hard rock mines. Key performance indicators were
calculated for both diesel and electric LHDs using data provided by a multinational mining
company operating metal (hard rock) mines. Battery powered vehicles, having a both the
advantage of low maintenance and no tether to haul, showed a 7% baseline improvement
in uptime. The increased uptime allows for a lower performing vehicle to compete with
diesel powered equipment. Equipment that performs as well as diesel decreases the
difference in capital cost through an increased tonnage of approximately 2000 tn∙yr-1. The
electric fleet was, on average, operational 11 hours longer than diesel vehicles before they
are pulled off for maintenance. The results from comparing diesel and electric equipment,
show that the best equipment would be a fusion of the reliability of electric vehicles and
the mobility of diesel equipment, both being attributes of battery powered equipment.
Battery powered vehicles are constantly improving and will only increase their prowess
over diesel equipment.
Keywords: performance analysis, underground mining vehicles, battery power,
battery mining equipment, mining KPIs.

35
3.1 – Introduction
Hard rock mining is mainly concerned with metallic ores such as gold, copper, zinc,
nickel, and lead. Focusing on the delineation and grade of a hard rock orebody, “diamond
drilling” exploration is used to recover samples for lab assays testing. Underground hard
rock mining refers to specific underground mining techniques used to excavate and extract
the ore Nieto (2011a).
In hard rock mining, equipment requires more energy due to the resilience of the
material. Compared to soft rock mining, hard rock mining equipment is expensive and
requires extensive operator training to be properly utilsed. The additional time required for
addressing technical difficulties may arise during excavation of the metal ore. Some of
these problems involve dust, high power requirements, and heavy machine wear.
Furthermore, the gargantuan power requirements for these machines make it very difficult
to convert to run solely off battery power. That being said, a more efficient use of energy
through electric power can lead to lower costs. As stated in Curry et al. (2014) Energy costs
typically comprise a majority of the ongoing operating costs of mining.
The two most commonly used underground hard rock mining methods are caving
methods such as block caving, and support methods both artificial and natural, such as cut-
and-fill and room and pillar techniques, respectively. These techniques may also be used
in soft rock mining, however in hard rock mining, the high strength of the rock requires
fewer underground supports when compared to soft rock mining (Nieto 2011b:386).
Underground mining is an industry, which takes place in an extreme environment.
All mining methods have benefits and risks that should be understood when determining
the technique to be used for a given set of variables Buchan (1998). In a previous study by
Schatz et al. (2014), three battery systems were examined to better understand their
strengths and weaknesses as well as predict how well they would perform in the hostile
underground environment. This study also reflected on how the advancement of battery
technology is increasingly replacing diesel equipment. Load haul dump (LHD) and
locomotives were selected, as they are lighter duty mining vehicles than continuous miners
or long wall shearers, which could feasibly replace their diesel engines with battery
systems.
In this study, these vehicles are explored to see how certain operational aspects can
effect energy consumption and maintenance. The economic value is based on two key
factors, general cost and productivity. General cost will cover generic costs such as capital
costs, fuel/energy, and direct maintenance costs. The productivity section will focus on the
indirect maintenance costs, an example of which being productivity loss due to down time,
and also revenue generated from active time. These key factors, also known as key
performance indicators (KPI), are used to find the total cost ownership for the vehicles
considered. The cost of ownership is calculated by considering operational costs against
the opportunity value generated by the equipment. This value is generally expressed in
dollars per ton per vehicle, with tonnage remaining constant. This value can also be
expressed in dollars per year per vehicle. A study by Crowson (2003) showed that
economies of scale has continuously increased the average mine size. This will cause

36
amount of vehicles in service to increase requiring them to be highly efficient both in time
management and energy usage.
3.2 –Equipment overview
3.2.1 –Underground mining vehicles
In underground soft rock mines the mining equipment most commonly used, besides
extraction equipment, are haulers, loaders, and locomotives. As mentioned above, these
vehicles are also commonly found in hard rock underground mining operations. In
underground hard rock mining, similar vehicles are used including low profile haulers,
LHD vehicles and drilling jumbos. Haulers haul material to dumping points while LHD
vehicles muck and haul material to dumping points over relatively short distances. Drilling
jumbos are mainly used in hard rock mining for drilling holes for either installing bolts or
blasting. Transportation of miners and materials in underground mining is a key operational
task and locomotives are mainly used in underground mines to accomplish this task. There
are different types of locomotives such as diesel powered, battery powered and trolley
locomotives. Locomotives have been used for many years in underground mining and
because of their reliability they are preferred as a simple and economical solution for
material and personnel transportation purposes. According to Miller (2000), compared to
the battery vehicle from which it is derived, the fuel cell locomotive has equivalent power
and tractive effort, at least twice the volumetric energy density, and greater availability.
Moreover, in one of the studies conducted by the United States Department of Energy
(DOE) a four-ton battery locomotive manufactured by RA Warren Equipment was adapted
to run off a PEM fuel cell by Miller and Barnes (2002). However, battery powered
locomotives are usually more convenient and safer than the fuel cell locomotives due to
the fact they do not have to be fueled with a volatile, flammable fuel.
Hard rock material is denser than soft rock material, thus during mucking and loading tasks,
more energy is required to move the same volume of material. A heavier denser material
implies a direct increase of the power consumption, producing high power peaks during a
normal load cycle and directly affecting operational costs.
In general, comparing the lithium ion and NaMx batteries, NaMx batteries are the preferred
sodium beta battery, with respect to electric vehicles as they are comparable to Li-ion yet
are cheaper and safer. The cells provide a specific energy of around 115Wh kg−1 and hold
a comparatively low price tag of approximately $150 kWh−1. One major limitation is the
operating temperature of 250–300 °C as explained by Ferreira et al. (2013: 3). This
limitation has all but restricted this cell chemistry from being used in commercial vehicles.
It is currently being considered for high frequency applications which keep the battery in
constant use. Such applications include public transportation and mining vehicles (Gerssen
and Faaij, 2012; Veneri et al., 2012).

37
3.2.2 – Load-Haul-Dump Vehicles (LHD)
Load-haul-dump mining vehicles, Figure 3.2-1, are used to haul waste rock and ore
from the production face in underground mines to haulage trucks, crushing stations, and
ore dumping points. LHDs are a specialised loading machine manufactured solely for the
underground mining industry. They are also known as a scoop-tram as they are used to
scoop fragmented ore with a bucket and tram it into a dump point.
Figure 3.2-1. Load-Haul-Dump vehicle © GE Mining Company 2014
Choosing the type of LHD vehicles is important in underground mining. LHD vehicles
vary according to their capacities and capabilities. Energy consumption is entirely
dependent on the power supply, size and type of LHD vehicle in the underground mine.
They are used to haul waste rock and ore from the production face in underground mines
to haulage trucks, crushing stations, and ore dumping points. According to Kumar et. al.
(1989), it seems that preventive maintenance of the engines of LHD machines could reduce
the maintenance costs.
An accurate model has been developed for LHD costs estimation by Sayadi et.al. (2011).
The cost functions have been classified on the basis of the cost type (capital and operating
costs along with operating cost items) and motor type (diesel and electric). It was also
stated by Sayadi et al. (2011:139) that these functions could be a useful tool for cost
estimations in preliminary and detailed feasibility studies of mining projects.
3.3 – Methodology
When determining the feasibility of a system or modification to that system, the
economics are always the most influential. Many inefficient or hazardous processes have
been chosen over safer or more efficient processes to save money. The two key factors that

38
will be considered for this study are general expenses and productivity. These two factors
will cover the most important aspects mines look for in a vehicle. General expenses cover
basic expenses such as consumable parts and general maintenance. The energy required
to power the vehicles are also examined as different power sources have different
efficiencies. Due to each vehicle containing different key parts, the capital required will
be different and should be taken into account as well. Any advantages from lower capital
costs can be eliminated by lowered productivity due to low vehicle availability, which may
be caused by high failure rates. To accurately monitor the productivity of each vehicle,
KPIs will be used to quantify the productivity of the vehicle. Mine safety is becoming
more and more important to mining companies with each passing year and heavy fines can
be imposed for not following strict guidelines of governing agencies. Emission standards
can restrict the number of equipment in a specific area but, if the equipment doesn’t have
any emissions, only spatial restrictions apply. This has the potential to allow more
equipment at the face, resulting in greater productivity. Ventilation is always a major
concern especially with the operation of diesel vehicles in confined spaces. This leads to
reduced productivity and increased energy expenditure, both decreasing mine profitability.
3.3.1 – General expenses
General expenses are a large part of owning equipment. Aside from the initial
capital cost, there are several recurring expenses required to be able to operate it. Energy
cost is one of the most obvious when considering engine driven equipment. Whether
chemical or electrical, energy costs money and the efficiency of how that energy is utilsed
is a major factor in determining that cost. Maintenance is a deceptively large portion of the
cost of running equipment, from the cost of consumables such as replacement parts and
lubricating fluids to the labor costs of the maintenance, the expense of maintenance is the
culmination of several relatively small expenses to form a sizable portion of the operation
costs.
3.3.1.1 – Capital Cost
When determining which vehicle to acquire, one of the first things mines look at is
the initial investment. This one-time expense, also known as capital cost is relatively small
compared to the operation expenditure. If not bought outright, a payment plan is
established with the equipment manufacturer, adding finance charges to the price tag.
Capital cost is important when determining feasibility of a vehicle being used in a particular
mine because certain components may cost more or may negate the need for other
components. A fuel tank is much cheaper than a battery pack, when comparing energy
storage systems for example. Even if the initial expense for one vehicle is far greater than
another, the operational expenditures may make the additional price worth it.
3.3.1.2 – Energy Cost
After the vehicle cost, there is another key factor of determining the feasibility and
is the first of the recurring costs, energy. There are two key parts to determining the energy
costs, cost of energy and energy utilisation. Diesel engines may cost less than battery
39
systems but they only use 30-40% of the energy contained in the fuel they use. Battery
systems, however, are approximately 98% efficient meaning that less of the energy, and
more importantly, money, is wasted. Unfortunately, this benefit only applies to grid
powered mines. If diesel generators are used to power the plant then the same diesel
efficiency applies in addition to the battery system losses.
3.3.1.3 – General Maintenance Cost
Once the energy costs are taken into account the standard maintenance costs for the
equipment is factored in. This includes routine maintenance such as tune-ups and
overhauls as well as parts, which require replacement on regular intervals such as
lubrication and belts. The maintenance staff, required to perform the maintenance, must
also be taken into account. If less staff is required to perform the maintenance due to either
easier maintenance or large time between maintenance intervals, then less money will be
required.
3.3.2 – Key Performance Indicators (KPIs)
It is without a doubt that another significant portion of expense is associated with
planned costs such as capital, energy, and general maintenance costs. What is hard to plan,
however, are breakdowns and downtime, resulting in loss of productivity and, therefore,
revenue. There are five indicators which aid in the planning of unexpected maintenance
expenses. These key performance indicators, use of available hours, downtime, rostered
hours, utilsed hours, lost time, and repair hours set a good metric for comparing vehicles.
These parameters are generally retrieved from company records, as was done in this study.
Key aspects such as down time, repair hours and lost time can be used with the vehicle’s
haulage and revenue per ton ore to find the cost of lost productivity and the utilsed hours
to find the profit gained from the vehicle.
3.3.2.1 – Availability
Availability takes into account the amount of time the vehicle is allowed to
function, regardless of ability and compares it to the amount of time it is allowed and able
to work, or available. It is calculated by dividing the amount of time the equipment was
allowed and able to work by the time the vehicle was cleared for work. The two values are
defined via three parameters, rostered hours, lost time, and down time.
𝐴𝑣𝑎𝑖𝑙𝑎𝑏𝑖𝑙𝑖𝑡𝑦 =𝑟𝑜𝑠𝑡𝑒𝑟𝑒𝑑 ℎ𝑜𝑢𝑟𝑠−𝑑𝑜𝑤𝑛𝑡𝑖𝑚𝑒−𝑙𝑜𝑠𝑡 𝑡𝑖𝑚𝑒
𝑟𝑜𝑠𝑡𝑒𝑟𝑒𝑑 ℎ𝑜𝑢𝑟𝑠−𝑙𝑜𝑠𝑡 𝑡𝑖𝑚𝑒 [1]
Rostered hours are defined as the amount of time the mine was operational. Lost
time is the amount of time the vehicle could not operate due to an unscheduled obstruction
or event. Downtime is the amount of time the vehicle could not operate due to equipment
failure. Refilling the fuel tank or recharging the battery would normally fall in to the
category of downtime, however, this is a unique circumstance as it is maintenance that can
be accomplished during the vehicles’ scheduled idle time. For example, if a shift is eight
hours and the equipment is scheduled for only four of them, then it is idle for four hours,
meaning that it can operate but is not required to. It is during this idle time that the
40
machines can be prepped for their next round of service. This way it effects its availability
and utilisation of availability appropriately.
3.3.2.2 – Utilisation of Availability (UoA)
utilisation of availability is when the aforementioned idle time is taken into account.
Just because a vehicle is allowed and able to work, doesn’t mean it is required to. Where
availability took into account the amount of time the equipment was in operation and the
amount of time it was able to operate, utilisation of availability finds the percentage
available time the vehicle was actually in operation. This is accomplished by taking the
amount of time the vehicle was in operation and dividing it by the time it was allowed and
able to work.
𝑈𝑜𝐴 =𝑟𝑜𝑠𝑡𝑒𝑟𝑒𝑑 ℎ𝑜𝑢𝑟𝑠−𝑑𝑜𝑤𝑛𝑡𝑖𝑚𝑒−𝑙𝑜𝑠𝑡 𝑡𝑖𝑚𝑒−𝑖𝑑𝑙𝑒 𝑡𝑖𝑚𝑒
𝑟𝑜𝑠𝑡𝑒𝑟𝑒𝑑 ℎ𝑜𝑢𝑟𝑠−𝑑𝑜𝑤𝑛𝑡𝑖𝑚𝑒−𝑙𝑜𝑠𝑡 𝑡𝑖𝑚𝑒 [2]
Utilisation of availability allows basic maintenance to be performed during idle
time. This allows for what would normally be production affecting downtime to become
downtime that has no effect on production, thus creating a more efficient operation.
3.3.2.3 – Utilisation
Utilisation is defined by the amount of time the vehicle is actually in operation and
divided by the time it is allowed to work, regardless of ability. It is the percentage of time
the vehicle is cleared to operate that the equipment is actually working.
𝑈𝑡𝑖𝑙𝑖𝑠𝑎𝑡𝑖𝑜𝑛 =𝑟𝑜𝑠𝑡𝑒𝑟𝑒𝑑 ℎ𝑜𝑢𝑟𝑠−𝑑𝑜𝑤𝑛𝑡𝑖𝑚𝑒−𝑙𝑜𝑠𝑡 𝑡𝑖𝑚𝑒−𝑖𝑑𝑙𝑒 𝑡𝑖𝑚𝑒
𝑟𝑜𝑠𝑡𝑒𝑟𝑒𝑑 ℎ𝑜𝑢𝑟𝑠−𝑙𝑜𝑠𝑡 𝑡𝑖𝑚𝑒 [3]
= 𝑎𝑣𝑎𝑖𝑙𝑎𝑏𝑖𝑙𝑖𝑡𝑦 ∗ 𝑈𝑜𝐴
Utilisation can also be determined by multiplying the availability by the utilisation
of availability. For example if the availability of a piece of equipment is 0.75 and the
utilisation of that availability, the percent of the availability the equipment was in
operation, is 0.833 then the utilisation is 0.625. If this data was gathered over an eight hour
shift then the equipment was allowed and able to work for 75%, or six, of those hours. It
was actually working for 83.3%, or five, of those hours. Therefore the amount of time the
equipment was in operation during the entire shift was five of eight hours or 62.5%.
3.3.2.4 – Mean time between failures (MTBF)
Mean time between failures focuses on how reliable the equipment is. It takes into
account how many times a piece of equipment breaks down in a given set of operating
hours. This can be used to estimate how long the equipment generally operates before a
break down is likely to occur.
𝑀𝑇𝐵𝐹 =𝑟𝑜𝑠𝑡𝑒𝑟𝑒𝑑 ℎ𝑜𝑢𝑟𝑠−𝑑𝑜𝑤𝑛𝑡𝑖𝑚𝑒−𝑙𝑜𝑠𝑡 𝑡𝑖𝑚𝑒−𝑖𝑑𝑙𝑒 𝑡𝑖𝑚𝑒
𝑓𝑎𝑖𝑙𝑢𝑟𝑒 𝑓𝑟𝑒𝑞𝑢𝑒𝑛𝑐𝑦 [4]
MTBF can also be used to compare the reliability of two pieces of equipment. This,
however, should be used with caution as it is an average and does not take the length of

41
time to repair into account. It is also unlikely that the equipment will fail at constant
intervals, instead, malfunctioning rarely at first and increasing with time logarithmically.
3.3.2.5 – Mean time to repair (MTTR)
Mean time to repair is the complement of MTBF, taking the length of time to repair
a malfunction into account. Where MTBF takes reliability into account, MTTR takes
maintainability, or ease of maintenance, into account.
𝑀𝑇𝑇𝑅 =𝑅𝑒𝑝𝑎𝑖𝑟 ℎ𝑜𝑢𝑟𝑠
𝑓𝑎𝑖𝑙𝑢𝑟𝑒 𝑓𝑟𝑒𝑞𝑢𝑒𝑛𝑐𝑦 [5]
While a complement to MTBF, MTTR is still an average and, therefore, should be
used with caution. Equipment generally does not break down in constant intervals. It is
more likely to be a disproportionate range, like with MTBF, from basic maintenance in the
early hours of usage and more complex failures occurring after many hours of use.
3.4 ––Results and Discussion
The following analysis was performed using annual operational data taken from a
Peruvian underground hard rock mining company. The raw data, acquired from the mine,
was organized to find out the factors of diesel and tethered electric powered LHD vehicles.
The KPIs were calculated and used to evaluate the comparison between diesel and tethered
electric powered LHD vehicles. Equipment productivity, downtime and energy
requirements are important in mining sector, therefore these factors should be well known
in underground mining. On the other hand, maintenance is a major cost of the mining
process and should be determined to aid in the economic analysis.
3.4.1 – General Costs
Unplanned failures are a source of uncontrollable downtime that can be reduced by
purchasing more reliable equipment. Logistical downtime, on the other hand, is controlled
by mine efficiency and also includes hazards created from the vehicles. A tethered LHD,
for example, causes issues by creating roadway hazards that delay other drivers and reduce
productivity. It also limits the range and route that the vehicle can take. This explains why
the tethered vehicle’s logistical downtime, shown in Figure 3.4-1, is larger than that of the
untethered diesel vehicle. This added downtime negates the time saved from less
maintenance.

42
Figure 3.4-1. Break down of operating time for Diesel (outer ring) and Tethered Electric (inner ring)
LHDs
Due to limited use of battery LHDs, powered via lithium ion or NaMX technology, in depth
details on the performance and maintenance of these vehicles were unavailable. Therefore,
two logical assumptions were made regarding the fundamental construction and operation
of battery vehicles. The first being that batteries would have similar maintenance times to
tethered electric vehicles because the vehicles are identical save the source of electrical
energy. The vehicles should have, at least, similar logistical downtime to diesel vehicles
which also do not have to drag a tether behind them. In fact, the logistical downtime should
be less than that of diesel LHDs due to the lack of emissions and therefore lower concern
for ventilation. The majority of some mines such as iron, coal and bauxite transport are
fueled by diesel or fuel oil, which was therefore the main focus of many of the mitigation
suggestions. Li et al. (2011:1439) states that from a domestic transport perspective, carbon
offsetting in the short term could make the biggest impact.
All of the aforementioned decreases in downtime can be calculated by adding
together the downtime due to maintenance of electric equipment (19 h) and the logistical
downtime of diesel (152 h) and comparing the estimated downtime (171 h) to the non-
battery downtime (183 h). This 7% increase in uptime is an estimated baseline
improvement in uptime, which can be increased upon the inclusion of additional factors,
for the battery powered equipment. This can be applied to performance data to estimate
increased ore haulage. The ore haulage rate data from our source for diesel equipment was
used to estimate the haulage data for the battery powered equipment in Table 3.4-1to set a
benchmark.
Uptime
Planned Maintenance
Unplanned Maintenance
Logistical Downtime
Tethered Electric
Diesel

43
This benchmark is the minimum haulage performance needed to compete with that
of a diesel's and is annotated with a superscript 1. The second calculation for battery
powered equipment shows the estimated haulage if the battery powered equipment's
performance was equal to that of diesel powered equipment and is annotated with a
superscript 2. The data values for the other equipment power types were calculated directly
from the mine data. Rostered haulage data is the overall haulage divided by the rostered
time (downtime + uptime). This parameter was calculated to show how downtime affects
the haulage rate for the equipment.
Table 3.4-1.Haulage data for LHDs by power source annual tonnage and hourly rates
Overall (tn / yr)
Rostered (tn / h)
Uptime (tn / h)
T. electric 25,164 5.2 9.6
Diesel 34,624 7.2 13.2
Battery1 34,624 7.2 12.5
Battery2 36,528 7.6 13.2
The tethered electric vehicles in the mine data studied were a bit less powerful and thus
had a slower tramming and mucking speed. This put the vehicle at a disadvantage resulting
in lower tons hauled compared to diesel for the same uptime. Both fleets of vehicle types
were limited to similar numbers of vehicles with similar age distributions. Since the first
calculation for battery equipment was assumed to have the same overall haulage, rostered
performance is identical to diesel. The increased uptime, however, allowed for a lower
performing vehicle to compete with diesel powered equipment. This is important because
lower performing battery powered equipment should require less capital thus lessening the
difference between the diesel and battery powered equipment. The second way of
comparing battery power to diesel power is to use equipment that performs equally well
and make up the difference in capital cost through increased tonnage and reduced operating
costs. This showed an increase of almost 2,000 tons per year which over the life of a battery
powered vehicle is approximately 20,000 tons, save the cost for one replacement battery
pack. Depending on the selling price of the ore and if the existing infrastructure can handle
the extra production this increase in productivity and decrease in operating costs can make
up any increase in capital over diesel powered equipment.
3.4.2 – Key Performance Indicators
Availability reflects how much of the scheduled time the equipment can work and is
calculated using equation 1. The same chronological data used for Figure 3.4-1 was used
to calculate the values in Table 3.4-1. Uptime data was used to calculate the idle time
parameter. Repair downtime data was used for the downtime parameter and logistical
downtime data was used for the lost time parameter. Since the data was collected over the
course of a month and the mine continuously operational, the rostered hours was calculated
as 744 hours (24 h∙day-1 ∙ 31day∙mth-1). As expected, the increased maintenance on the
diesel equipment affected its availability. The utilisation of availability as well as the

44
utilisation of the vehicles were mainly a product of the mine planning. Since individual
vehicle data was used for this calculation, the low value obtained could be a result of
planning equipment downtime so that it is not constantly in operation. The scenario being
that two vehicles with approximately 0.50 idle time would allow for constant mucking, yet
keeping the vehicles from constant operation. The utilization of the time the vehicles were
available, UoA, was effectively equal since the idle time of the two types of equipment was
also essentially equal. Due to the lengthy idle time the utilisation of these vehicles were
under 0.40.
Table 3.4-2. Key performance Indicators for T. Electric and Diesel equipment
Availability UoA Utilisation MTTR
(hours)
MTBF
(hours)
T. Electric 0.965 0.407 0.393 4.3 78.0
Diesel 0.949 0.408 0.387 4.5 67.5
The Maintenance data for several vehicles in both the electric and diesel fleet were
averaged and used to calculate both MTTR and MTBF. These two performance indicators
are focused more on the vehicle performance rather than on mine operation as with
utilisation of availability. The fleet data for tethered electric powered equipment was
consistent with the electric vehicle, used in the side by side comparison for the first three
parameters, this showed that electric vehicles were more reliable. The electric fleet was,
on average, operational 11 hours longer than diesel vehicles before they required
maintenance as can be seen in Table 3.4-2. Maintainability of the two vehicles, however,
was a different story. The mean time to repair was only 12 minutes longer, on average, for
the diesel fleet than the electric, which are too similar to draw any significant conclusions
regarding superiority.
3.5 –Conclusions/Recommendations
3.5.1 – Conclusions
The first analysis was performed on the downtime with respect to maintenance
induced downtime and downtime due to logistical issues. It was assumed that battery based
equipment would have maintenance times less than or equal to tethered electric vehicles
and similar logistical downtime to diesel vehicles, which do not have to drag a cable with
it when moving from one location to another point in the mine.
The downtime of battery powered LHD vehicles was determined by adding
downtime due to maintenance of tethered electric equipment (19 h), since the only
difference between the two types is the power source, and the logistical downtime of diesel
equipment (152 h), since both types do not have tether cables and are relatively of the same
size. Comparing the estimated downtime, (171 h) to the non-battery downtime (183 h), a
7% increase in uptime is an estimated baseline improvement in uptime. This conservative

45
estimate can be improved by calculating downtime improvement from logistical issues
diesel equipment have that battery equipment do not have. The haulage data for comparing
diesel and battery power sources was calculated in two ways. The first calculation assumed
that battery equipment was to have the same overall haulage capacity and speed. The
increased uptime allowed for a lower performing battery LHD to compete with diesel
powered LHD vehicles which was important because it meant that a less powerful battery
was required, and thus, less capital. The second way was to use equipment that performs
equally well and make up the difference in capital cost through increased tonnage of
approximately 2000 tn∙yr-1. The increased maintenance on the diesel LHD vehicles lower
its availability to 0.949 compared to 0.965 for electric LHD vehicles. Though it may seem
insignificant, a 0.026 increase in availability can make a large difference in a vehicle's
60,000 hour lifespan. Upon comparing reliability (MTBF) and maintainability (MTTR) of
the two power sources, it was found that the electric fleet was, on average, operational 11
hours longer than diesel vehicles before they required maintenance. The mean time to
repair, however, was only 12 minutes longer, on average, for the diesel vehicles when
compared to the electric vehicles, which was too close to draw any significant conclusions
regarding superiority. The hidden costs, the reduction of maintenance hours, parts replaced,
inspection time, ventilation, etc., combined with increased tonnage of approximately 2000
tn∙yr-1 cover the battery powered vehicle’s additional cost.
The results from comparing the diesel and tethered electric LHD vehicles, show
that the best equipment would be a fusion of the reliability of electric vehicles and the
mobility of diesel equipment. Battery powered equipment is an excellent way to achieve
this, with the benefits of both power sources. Moreover, battery powered vehicles are
constantly improving in power, speed, and duration which will only increase its prowess
over diesel equipment.
3.5.2 – Recommendations for future work
Ventilation requirements should be calculated for both electric and diesel vehicles
to further refine the decreases in logistical downtime. Besides performance indicators,
economic indicators should be calculated. An incremental economic analysis and
sensitivity analysis of battery-electric versus diesel equipment is recommended in addition
to net present value (NPV), economic rate of return (ERR), and internal rate of return
(IRR). These values will need to be calculated for all three power sources on an annual
basis for both equipment and mine lifetime bases.
3.6 – Acknowledgements
The authors gratefully acknowledge the financial support of this work by General
Electric. We thank Patrick Jansen, for his valuable discussion of the results.

46
3.7 – Publication 2 References
G. Buchan, 1998, Long panels for longwall mining at Cyprus twentymile Coal, Min. Eng.
50 pp. 21–27.
P.Crowson, 2003, ‘Mine size and the structure of costs’, Resources Policy 29 , 15–36,
Elsevier, 2004
J.A.Curry,M.J.L.Ismay, G.J.Jameson, 2013,‘Mine operating costs and the potential
impacts of energy and grinding’, Minerals Engineering, Elsevier,
http://dx.doi.org/10.1016/j.mineng.2013.10.020
H. L. Ferreira, R. Garde, G. Fulli, W. Kling, J. P. Lopes, H. Lopes, and J. Pecas,
“Characterisation of electrical energy storage technologies,” Energy, Mar. 2013.
S.J. Gerssen-Gondelach and A.P.C. Faaij, 2012,Performance of batteries for electric
vehicles on short and longer term, J. Power Sources 212 pp. 111–129.
U.Kumar, B.Klefsjo, S.Granholm, 1989, ‘Reliability investigation for a fleet of Load Haul
Dump Machines in a Sweish mine’, Reliability Engineering and System Safety, ,
S-951-87, Elsevier,
Y.,Li, G.D.Corder, B.C.McLellan, 2011, ‘Transport in the minerals industry –
Contributions to greenhouse gas emissions and potential for mitigation’, Minerals
Engineering, Elsevier, doi:10.1016/j.mineng.2011.07.001
A.R.Miller,2000 ‘Tunneling and Mining Applications of Fuelcell Vehicles’, Fuel Cells
Bulletin, July pp. 5-9
A. Miller and D. Barnes, 2002, Advanced underground vehicle power and control
fuelcell mine locomotive. Proceeding 2002 US DOE Hydrogen Program Review,
pp. 1–7.
A. Nieto, 2011a, SME Mining Engineering Handbook, 29 pp. 377–384.
A., Nieto, 2011b, “Key Deposit Indicators (KDI) and Key Mining Method Indicators
(KMI) in Underground Mining Method Selection Criteria”, SME Transactions,
Vol. Jan. 2011
A.R.Sayadi, A.Lashgari, J.,Paraszczak, 2011, ‘Hard-rock LHD cost estimation using
single and multiple regressions based on principal component analysis’, Tunnelling
and Underground Space Technology, Elsevier, doi:10.1016/j.tust.2011.08.006
R.Schatz, A.Nieto, C.Dogruoz and S.Lvov, 2014, ‘Using modern battery systems in light
duty mining vehicles’, International Journal of Mining, Reclamation and
Environment, DOI:10.1080/17480930.2013.866797
O. Veneri, F. Migliardini, C. Capasso and P. Corbo, 2012, ZEBRA battery based
propulsion system for urban bus applications: preliminary laboratory tests, Electr.
Syst. Aircraft, Railw. Sh.Propuls. pp. 1–6.doi:10.1109/ESARS.2012.6387489
47
Chapter 4.
Long-term economic sensitivity analysis of light duty underground mining
vehicles by power source
The contents of this chapter has been accepted for publication by the international
Journal of Mining Science and Technology and is referenced as: Schatz, R.S., Nieto, A.,
and Lvov, S.N., 2016. “Long-term economic sensitivity analysis of light duty underground
mining vehicles by power source” Journal of Mining Science and Technology.
Preface
In chapter four, long term economics of diesel and NaMX battery powered LHDs
over the lifetime of a hard rock mine was the primary focus. The goal of this chapter was
to analyze and compare each power type to determine which would add the most value to
the mine. This was accomplished by assigning a single economic value to an LHD of each
power type analyzed. Sensitivity analysis was performed on several parameters to
determine how the economic values would change due to fluctuation of input parameter
values between each mine. The primary author was responsible for all calculations, the
development of the economic model and the sensitivity analysis.

48
Abstract
LHD’s are expensive vehicles, therefore it is important to accurately define the
financial consequences associated with the investment of purchasing the mining
equipment. This study concentrates on long-term incremental and sensitivity analysis to
determine whether it is feasible to incorporate current battery technology into these
machines. When revenue was taken into account, decreasing the amount of haulage in
battery operated equipment by 5% or 0.2 tons per hour amounts to a $40k loss of profit per
year. On average it was found that using battery operated equipment generated $95k more
in income annually, reducing the payback period from seven to two years to pay back the
additional $100k investment of buying battery powered equipment over cheaper diesel
equipment. Due to the estimated 5% increase in capital, it was observed that electric
vehicles must possess a lifetime that is a minimum of one year longer than that of diesel
equipment.
Keywords: Sensitivity analysis, underground mining vehicles, battery
power, battery mining equipment, Economic evaluation.

49
4.1 Introduction
Mining equipment is expensive, not only to acquire but also to maintain.
Depending on the terrain where the mining operation is located it may be difficult to obtain
resources necessary to maintain the equipment. Mining is also a very energy intensive
process requiring both electricity and fuel to provide energy equipment operation.[1,2] The
majority of load haul dump vehicles, LHDs, in underground mining operations are
currently powered by diesel. However, with recent advancements in battery technology it
is becoming more feasible, both physically and economically, to convert larger equipment,
such as LHDs, from diesel power to battery. [3-5] Lithium ion and sodium metal halide,
NaMx, batteries are an optimal choice for use in the harsh underground mining
environment LHDs operate in. These technologies are compact, durable, relatively
inexpensive, and easy to manufacture to scale.[6,7] These benefits make LHDs powered
by these technologies a great improvement over the currently used lead acid technology.
In a previous study the performance analysis for diesel and tethered electric LHD fleets
were calculated using data acquired from a Peruvian underground mine. It was observed
that the electric vehicles not only required less planned maintenance but also broke down
less often leading to lower unplanned maintenance as well.[8]
In addition to performance analysis, a detailed, long-term, economic analysis of
both electric and diesel powered mining vehicles was performed to properly gauge which
equipment power source brings the most benefit to underground mines. In this study,
LHD’s were examined with respect to their power sources. Battery powered and electric
and diesel powered LHD’s were studied and the data related to their power types were used
to generate an economic model. Data from the same Peruvian mine used in the previous
study was also used in the economic model. The model, generated, in house calculated the
present value, in both nominal and constant dollar values, net present value, internal rate
of return cumulative value and payback period. The data calculated for the two equipment
power sources were compared using incremental analysis. The comparison was then tested
using sensitivity analysis to determine a range of profitability for each vehicle power
source.
4.2 Methodology
4.2.1 –Economic indicators
The economic analysis was performed, considering several variables, to accurately
define the investment required for purchasing the mining equipment. The following
economic analyses were determined in this project and the results compared between
battery powered and electric and diesel powered equipment. The main economic indicators,
explained in further detail below, include Present Value (PV), Net Present Value (NPV),
Internal Rate of Return (IRR), Constant Dollars (CD), Cumulative Value (CV), and
Payback Period. The Two methods of analyzing the aforementioned indicators are
incremental analysis and sensitivity analysis, also expanded upon below. [9,10]

50
4.2.1.1 – Present Value, Net Present Value, and Internal Rate of Return
Present value, also known as present discounted value, is a future amount of money
that has been discounted to demonstrate its potential buying power if it existed today. Due
to the interest earning potential of money, also referred to as the time value of money, the
further from the present the money is acquired, the lower the present value will be. Present
value is used to calculate net present value, which is the sum of the present values over the
lifetime of the project. In this study, NPV is used to define the net profit over each vehicle’s
lifetime in current value. The internal rate of return is used to compare the profitability of
investments, but IRR does not take interest and inflation into account, therefore focusing
on a projects profitability. IRR is used in conjunction with NPV to help determine the value
a particular investment. It expands upon the information the NPV provides, whether the
investment is a net income or loss, by providing a percentage of increase over the lifetime
of the project. A company can set a bare minimum percent return on investment, known
as a hurdle rate, to ensure payback periods within acceptable limits.
4.2.1.2 – Constant Dollars
The purchasing power of the dollar changes over time due to inflation, so in order
to compare dollar values from one year to another, they need to be converted from nominal
(current) dollar values to constant dollar values. Also identified as the real dollar value,
constant dollars allow the visualization of consistent revenue and expenditures at set
inflation rates over the lifetime of the project.
4.2.1.3 – Cumulative value and payback period
Cumulative value is when the present value is added cumulatively over time, with
the value at project termination being the net present value. Cumulative value is used in
this project to determine the payback period by noting the length of time the CV is negative.
Payback period is the length of time required to acquire the initial investment from profits
gained from the investment. The time value of money is not taken into account for payback
period, however, it is a common method of determining how long something takes to "pay
for itself". Equipment is generally selected with payback periods usually limited to a set
percentage of the lifetime of the equipment to allow time for the equipment to generate its
return on investment.[11]
4.2.1.4 Incremental Analysis
Incremental analysis is performed by comparing the differences in operating costs
and profits between two tasks. In underground mining, incremental analysis can be used to
compare two different equipment models considered for purchase. Comparing costs of the
electricity to each machine, maintenance costs, efficiency, and also the productivity of the
new mining vehicles can be aid in providing a complete picture of where each vehicle
exceeds the other financially. The versatility of this analysis allows the determination the
differences in operating expenses or overall costs

51
4.2.1.5 Sensitivity Analysis
Sensitivity analysis is used to give more detail on how rapidly changing
variables, such as commodities, can effect the profitability of the equipment under review.
The technique particularly useful when a model contains a large number of input
parameters, allowing for the observation of a range of profitability for each variable.[12]
Only one variable, in the financial model, is changed at a time, all other variables remain
constant, removing any constructive or destructive interference from other variables. NPV
and IRR were both analyzed for the magnitude of effect of input adjustment and compared
with that of the other vehicle power sources.
4.3 – Results
4.3.1 – Assumptions and variables
In this study certain assumptions were made while developing the economic model
used to assess the value battery vehicles bring to the mine. First, due the fact that LHDs,
haulers, and drilling jumbos are similarly constructed, it was assumed that the economic
model created in this study would be useful in estimating value of a vehicle of similar
construction to light duty LHDs. The battery equipment was assumed to have similar
maintenance to tethered equipment and similar logistical downtime to diesel vehicles. The
economic model was conducted over a 35 year period to account for several equipment life
cycles so that a fair account could be taken of each vehicle type. The length was decided
to establish a period of the least common multiple of battery/battery pack and diesel
lifetimes. The capital costs for the equipment and battery packs were assumed to remain
constant over the length of the study. Though on the long side, the length is short enough
to be considered the life of a typical mine. The assumed lifetimes for the equipment were
7 years for diesel and 10 years for electric, based on the average lifetimes of electric and
diesel equipment in the Peruvian mine data used in this study. The economic model
required several variables that could be categorized in one of two major categories,
equipment dependent and equipment independent variables.
4.3.1.1 – Equipment Dependent Variables
Equipment dependent variables, shown in Table 4.3-1 below, include capital cost,
maintenance, annual tonnage, operating hours, energy consumption and energy cost. The
battery cost was estimated by rounding up $128,964 to $130,000 based on cost, calculated
in a previous study, for a 4 hour battery.[13] Operating hours were calculated using the
data set. Diesel averaged 219 hours of uptime per month giving an estimated annual total
of 2628 hours per year. Since batteries were estimated to have 5.5% more uptime the
monthly average increased to 231h, giving an annual total of 2772 hours per year. Tonnage
was also obtained by taking the average monthly data for diesel equipment and estimated
for batteries by increasing it by 5.5%. Maintenance costs were taken from the data set for
tethered and Diesel equipment as well. The same value for tethered equipment was used
for battery equipment. Energy consumption was based on the power rating of the tethered
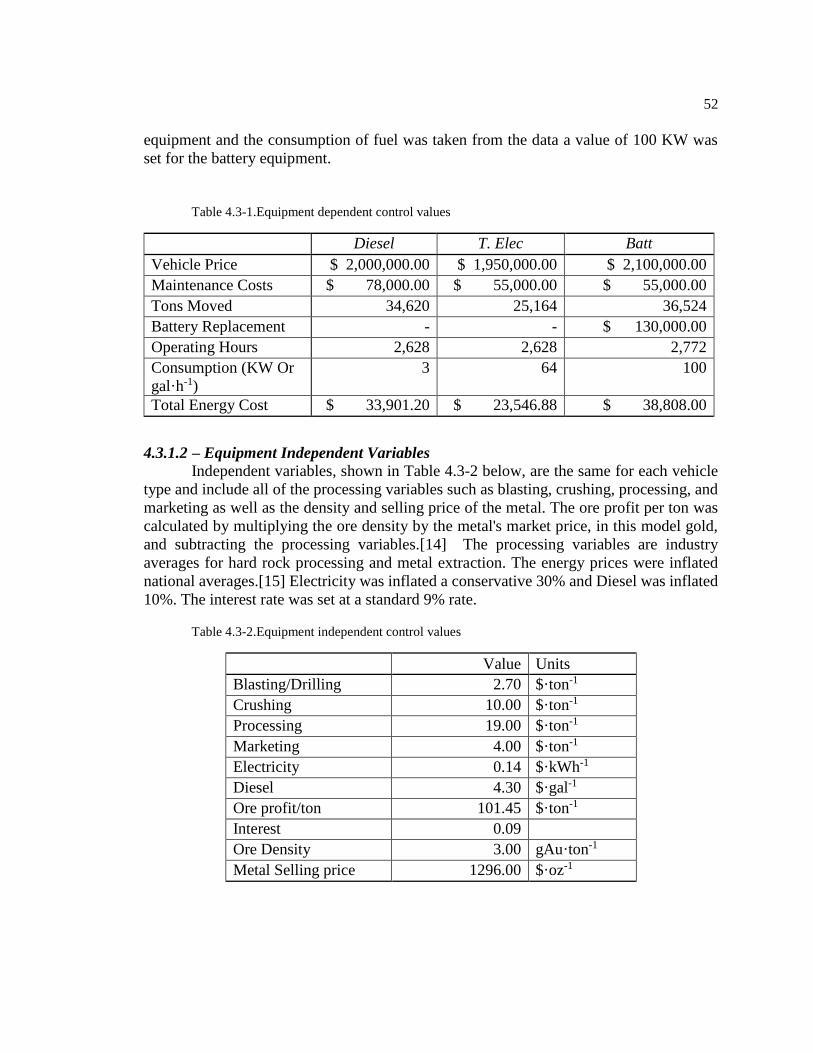
52
equipment and the consumption of fuel was taken from the data a value of 100 KW was
set for the battery equipment.
Table 4.3-1.Equipment dependent control values
Diesel T. Elec Batt
Vehicle Price $ 2,000,000.00 $ 1,950,000.00 $ 2,100,000.00
Maintenance Costs $ 78,000.00 $ 55,000.00 $ 55,000.00
Tons Moved 34,620 25,164 36,524
Battery Replacement - - $ 130,000.00
Operating Hours 2,628 2,628 2,772
Consumption (KW Or
gal·h-1)
3 64 100
Total Energy Cost $ 33,901.20 $ 23,546.88 $ 38,808.00
4.3.1.2 – Equipment Independent Variables
Independent variables, shown in Table 4.3-2 below, are the same for each vehicle
type and include all of the processing variables such as blasting, crushing, processing, and
marketing as well as the density and selling price of the metal. The ore profit per ton was
calculated by multiplying the ore density by the metal's market price, in this model gold,
and subtracting the processing variables.[14] The processing variables are industry
averages for hard rock processing and metal extraction. The energy prices were inflated
national averages.[15] Electricity was inflated a conservative 30% and Diesel was inflated
10%. The interest rate was set at a standard 9% rate.
Table 4.3-2.Equipment independent control values
Value Units
Blasting/Drilling 2.70 $·ton-1
Crushing 10.00 $·ton-1
Processing 19.00 $·ton-1
Marketing 4.00 $·ton-1
Electricity 0.14 $·kWh-1
Diesel 4.30 $·gal-1
Ore profit/ton 101.45 $·ton-1
Interest 0.09
Ore Density 3.00 gAu·ton-1
Metal Selling price 1296.00 $·oz-1

53
4.3.2 – Economic Analysis – Profit Focus
4.3.2.1 – Net Present Value, Payback, and Internal rate of return
Using the aforementioned variables and assumptions, the energy and maintenance
costs subtracted from the revenue gave the profit which was adjusted for present value. It
was observed that battery vehicles returned net present value $3MM higher than diesel
vehicles, Table 4.3-3, and therefore had a greater internal rate of return. This extra profit
was due to reduced maintenance and increased uptime compared to the diesel equipment.
Since the amount of revenue these vehicles generate is so large compared to their capital
cost, the payback period is one year.
Table 4.3-3.NPV and IRR over 35 year period
Diesel T. Electric Battery
Total NPV $ 31,564,433 $ 22,715,048 $ 34,888,889
IRR 164% 122% 169%
IRR after Inflation 158% 117% 162%
4.3.2.2 – Incremental Analysis - Net Present Value, Payback, and Internal rate of return
The incremental analysis was used to compare the profits of each equipment type.
When comparing battery equipment to diesel equipment there is a $3MM+ increase in
profit for a $0.1MM investment leading to a 258% internal rate of return. Dividing the
∆NPV by the length of the model yields the average present value which is approximately
$95k, Table 4.3-4, annual increase in profit buying battery instead of diesel equipment.
Generating $95k more in income, annually, requires two years to pay back the $100k
investment of buying battery powered equipment.
Table 4.3-4.Incremental analysis average profit increase
Vs. Diesel T. Electric Battery
Diesel - $ 862,927 $ (94,985)
Tethered $ (862,927) - $ (1,161,177)
Battery $ 94,985 $ 1,161,177 -
4.3.2.3 – Sensitivity Analysis
Every mine is different and therefore they have different operating parameters.
Equipment manufacturers also have different standards of construction and with that,
different equipment specifications. This is where sensitivity analysis is important. The first
sensitivity analysis in this section focuses on the variables that specifically effect revenue.
Some major cost factors, such as electricity price, battery pack cost, and diesel maintenance
cost are also included to observe their effect on revenue compared to their effect on cost as
seen in Figure 4.3-3. The star plot in Figure 4.3-1 shows that the revenue is especially
sensitive to the amount of tons each vehicle hauls. Decreasing the amount of battery
haulage by 5% or 0.2 tons per hour can affect the profitability significantly, approximately

54
$1.3MM. This amounts to a $40k loss of profit per year. If the vehicle can be improved by
this much through increased mobility, productivity and uptime, that deficit can become a
bonus. Ore density also has quite a significant effect on revenue, although this cannot be
controlled. The ore density can be taken into account, when planning the mine and aid in
the decision of which vehicle will bring more value to the mine. One interesting
observation was that the capital cost of the battery equipment and the maintenance of diesel
equipment have similar impacts on revenue.
Figure 4.3-1. Battery Vs Diesel-Adjustment of tons moved(blue), ore density(red), electricity
price(green), battery equipment capitol(purple), and Diesel maintenance cost(Orange)| reference line (black)|
The buyback period is dependent on variables that significantly affect
profitability, such as tons hauled. The impact of adjusting the amount of tons mined was
shown to have an exponential effect on buy back period as shown in Figure 4.3-2.
$-
$25,000.00
$50,000.00
$75,000.00
$100,000.00
$125,000.00
$150,000.00
$175,000.00
$200,000.00
-50% -40% -30% -20% -10% 0% 10% 20% 30% 40% 50%
Ave
rage
An
nu
al S
avin
gs V
s. D
iese
l Eq
uip
me
nt
Deviation from Control Values

55
Figure 4.3-2. Buyback period of initial investment for battery equipment based adjusting tons
hauled. Battery equipment(red) was adjusted negatively and Diesel(blue) equipment adjusted positively. The
dotted lines are the respective fit showing exponentially.
4.3.3 – Economic Analysis – Cost Focus
While revenue is a large factor in determining the value of a vehicle to the mine it
is important to analyze the operating costs as well. This provides more detail on how each
vehicle type performs regardless of the revenue it provides. The following section performs
the tests conducted previously, taking revenue into account, now taking only costs into
account.
4.3.3.1 – Net Present Value
According to the model, the estimated operating costs for a battery are $4.8MM
compared to the $5.5MM Diesel equipment costs to operate maintain and replace over a
35 year period. This $700k+ difference is attributed to the longer service life of electric
vehicles, lower operating costs and lower maintenance. This difference also includes the
increased energy costs for the longer uptime battery equipment is operating. Due to the fact
that this analysis focuses solely on costs every value is negative and therefore neither
payback nor internal rate of return can be calculated. In the next step payback and internal
rate of return are calculated using the difference in operating costs for the vehicle types.
0
5
10
15
20
25
30
35
-15% -10% -5% 0% 5% 10% 15%
Bu
ybac
k P
eri
od
(yr
)
Percent Deviation from Control Values

56 Table 4.3-5.Incremental analysis average operating cost savings
Vs. Diesel T. Electric Battery
Diesel Vs. - $ (36,773) $ (20,763)
Tethered Vs. $ 36,773 - $ 16,010
Battery Vs. $ 20,763 $ (16,010) -
4.3.3.2 – Incremental Analysis - Net Present Value, Payback, and Internal rate of return
As mentioned in the previous section, the net present operating costs for the Battery
versus diesel equipment shows that battery equipment is almost $0.75MM cheaper to
operate. This leads to an average annual operating savings of just under $21k,Table 4.3-5.
The reason battery equipment has a 7 year payback for costs have an interesting
explanation. The annual difference in operating costs slowly pays back the investment until
the diesel equipment requires replacement. Since the electric equipment doesn't need
replacing for another 3 years that money adds to the cost differential. Three years later,
when the electric vehicle requires replacement, the present value of the investment three
years later is less than the increase in capital for battery equipment. This means that as long
as the battery vehicle has a longer service life than the diesel vehicle it will add more value
to the mine. Equipment service life is addressed in detail in section 4.3.3.3, Figure 4.3-5.
4.3.3.3 – Sensitivity Analysis.
The sensitivity analysis for costs took many of the parameters that are very volatile
during the operation of the mine. These costs include energy prices, both electric and diesel,
equipment capital and maintenance costs. It was found that there were several different
methods of calculating cost variation. Maintenance costs for example could be calculated
as keeping one cost fixed and adjusting the other, adjusting the ratio, seen in Figure
4.3-3(tan). It could also be varied by adjusting one cost and keeping the other at a fixed
ratio, seen in Figure 4.3-3(orange). It was found that the two methods had significantly
different impacts on costs.

57
Figure 4.3-3. Adjustment of electricity cost(blue), cost of fuel(red), cost of battery pack(green),
Equipment capitol (battery equipment costing 5% more than diesel)(purple), cost of maintenance (ratio of
diesel to battery constant)(orange), and cost of Diesel Maintenance(tan)| reference line (black)|.
Another, interesting comparison was the energy costs with respect to electricity
price(blue) and diesel price(red). Figure 4.3-3 shows that cost difference is more sensitive
to electricity prices than to diesel fuel fluctuations. The cost differentiation for adjusting
capitol cost was used fixing the cost of battery equipment to 5% higher than diesel costs,
however, this ratio is not a guarantee. Figure 4.3-4 was created to address this issue by
comparing the effect of capital cost on cost savings, varying the price increase from 5% to
25%.
$(5,000.00)
$-
$5,000.00
$10,000.00
$15,000.00
$20,000.00
$25,000.00
$30,000.00
$35,000.00
$40,000.00
$45,000.00
$50,000.00
-100% -80% -60% -40% -20% 0% 20% 40% 60% 80% 100%
Ave
rage
An
nu
al S
avin
gs V
s. D
iese
l Eq
uip
me
nt
Deviation from Control Values

58
Figure 4.3-4. Adjustment of equipment capitol, battery equipment Capitol Vs. Diesel.
The reason that the costs are not zero at -100%(i.e. no capital cost) are because
battery equipment is cheaper to maintain and reenergize. It can also be observed that
between 30%-50% increased capital costs, depending on the battery price markup, there is
a deviation from linear behavior. This is caused by the capital cost becoming so high that
interest costs are being added due to the capital exceeding the year’s profit.
Figure 4.3-5. Adjustment of lifetime of diesel equipment(blue), battery equipment(red), and battery
packs(green) |Reference line(Black)|
$(5,000.00)
$-
$5,000.00
$10,000.00
$15,000.00
$20,000.00
$25,000.00
$30,000.00
$35,000.00
$40,000.00
$45,000.00
-100% -50% 0% 50% 100%
Ave
rage
An
nu
al S
avin
gs V
s. D
iese
l Eq
uip
me
nt
Deviation from Control Values
5%
10%
15%
20%
25%
$(20,000.00)
$-
$20,000.00
$40,000.00
$60,000.00
$80,000.00
$100,000.00
-3.00 -2.00 -1.00 0.00 1.00 2.00 3.00
Ave
rage
An
nu
al S
avin
gs V
s. D
iese
l Eq
uip
me
nt
Deviation from Control Values

59
Another important plot in addressing volatile parameters is the adjustment of
service life of the equipment. Figure 4.3-5 increases the lifetime of diesel and battery
equipment as well as the frequency of battery replacement. It can also be seen that in order
for battery equipment to remain less costly, they must provide at least extra one year of
service than diesel equipment. It should also be noted that though it appears that plot for
the battery pack lifetime Figure 4.3-5(green) appears linear it is not.
4.4 – Conclusions
According to the model, the estimated operating costs for a battery are $4.8MM
compared to the $5.5MM Diesel equipment costs to operate maintain and replace over a
35 year period. This is a $700k+ is an average annual operating savings of just under $21k.
The reason battery equipment has a seven year payback for costs was found to be solely
due to the difference in service life for the two vehicles. The energy costs with respect to
electricity price and diesel price show that the cost difference is more sensitive to electricity
prices than to diesel fuel fluctuations. According to diesel production, alternative energy
generation, and cost trends from the Energy Information Agency (EIA), the price of diesel
is expected to rise significantly while increases in alternative forms of generation such as
solar and wind energy technology are expected to decrease in price. Comparing the effect
of capital cost on cost savings, varying the price increase from 5% to 25%, showed
significant impact on the average annual cost savings. It was also found that in order for
battery equipment to remain less costly, they must provide at least extra one year of service
than diesel equipment.
Taking revenue into account only improved the value of battery equipment due to
increased uptime and productivity. The revenue was found to be especially sensitive to the
amount of tons each vehicle hauls. Decreasing the amount of battery haulage by 5% or 0.2
tons per hour amounts to a $40k loss of profit per year. If the vehicle can be improved by
this much through increased mobility, productivity and uptime, that deficit can become a
bonus. When comparing battery equipment to diesel equipment there is a $3MM+ increase
in profit for a $0.1MM investment leading to a 258% internal rate of return. Dividing the
∆NPV by the length of the model yields the average present value which is approximately
$95k. Generating $95k more in income annually reduces the payback period from seven to
two years to pay back the $100k investment of buying battery powered equipment.
4.5 – Final Remarks
Battery equipment offer significant value to an underground mine through
increased profits and reduced maintenance and energy costs. The battery to be used in the
vehicles is highly dependent on which of the following factors is most important to the
equipment manufacturer, safety, cost, size, and weight. Lead acid batteries, of any type,
are strongly recommended against. While their low cost lead to their current widespread
use, they are also toxic, very heavy, and have only a fraction of the energy density of the
other two cell chemistries. As discussed in previous works, lithium ion batteries are more
energy dense, leading to smaller packs but weigh more and have a higher cost than NaMx

60
packs. NaMx batteries have a much safer cell chemistry, have the same cycle life, cost less
and weigh less, however more volume is required to house the battery. NaMx cell
chemistry also better adapted for constant use than lithium ion batteries. Over the coming
years, the refinement of these two cell chemistries as well as several others will provide
lighter, safer, longer lasting, alternatives to lead acid batteries.

61
4.6 Publication 3 References
1. Nieto, A., 2011. SME Mining Engineering Handbook 3rd Ed., Society for Mining,
Metallurgy, and Exploration, Inc. 389–396.
2. Nieto, A., 2011. Key deposit indicators (KDI) and key mining method indicators
(KMI) in underground mining method selection, Trans. Soc. Mining, Metall. Eng.
381–396
3. Paraszczak, J., Svedlund, E., Fytas, K., & Laflamme, M. (2014). Electrification of
Loaders and Trucks – A Step Towards More Sustainable Underground Mining.
Renewable Energy and Power Quality Journal, (12).
4. Lu, X., Xia, G., Lemmon, J. P., & Yang, Z. (2010). Advanced materials for sodium-
beta alumina batteries: Status, challenges and perspectives. Journal of Power Sources,
195(9), 2431–2442. http://doi.org/10.1016/j.jpowsour.2009.11.120
5. Scrosati, B., & Garche, J. (2010). Lithium batteries: Status, prospects and future.
Journal of Power Sources, 195(9), 2419–2430.
6. T. Reddy and D. Linden, Linden’s handbook of batteries. 1457, McGraw-Hill
Professional, 2010.
7. Ferreira, H. L., Garde, R., Fulli, G., Kling, W., Lopes, J. P., Lopes, H., & Pecas, J.
(2013). Characterisation of electrical energy storage technologies. Energy.
8. Schatz, R.S., Nieto, A., Dogruoz, C., and Lvov, S.N., 2016. Performance Analysis of
Electric and Diesel Equipment for Battery Replacement of Tethered LHDs Vehicles in
Underground Mining South African Institute of Mining and Metallurgy,
9. Moyer Charles, William Kretlow, James McGuigan, 2011. Contemporary Financial
Management, Winsted South Western Publishing Co.
10. Farris, Paul,W., Neil T. Bendle, Phillip E. Pfeifer, David J. Reibstein, 2010. Marketing
Metrics: The definitive guide to measuring marketing performance, Pearson
Education.
11. Kim, B., Shim, E., & Reinschmidt, K. F. (2013). Probability Distribution of the Project
Payback Period Using the Equivalent Cash Flow Decomposition, 112–136.
http://doi.org/10.1080/0013791X.2012.760696
12. Firth, S. K., Lomas, K. J., & Wright, A. J. (2010). Targeting household energy-
efficiency measures using sensitivity analysis. Building Research & Information,
38(1), 25–41.
13. Schatz, R.S., Nieto, A., Dogruoz, C., and Lvov, S.N., 2014. Using modern battery
systems in light duty mining vehicles International Journal of Mining, Reclamation and
Environment, 37-41.
14. US Geological Survey 2015
<www. http://minerals.usgs.gov/minerals/pubs/commodity/gold/>
15. US Energy Information Agency, 2015. <www.EIA.gov>

62
Chapter 5.
A Short Term Economic Sensitivity Analysis of Diesel Vs. Battery
Powered Load Haul Dump Vehicles
The contents of this chapter has been submitted to the International Journal of
Mining, Reclamation and Environment and is referenced as: Schatz, R.S., Nieto, A., and
Lvov, S.N., 2016. “A Short-Term Economic Sensitivity Analysis of Diesel Vs. Battery
Powered Load Haul Dump Vehicles” The International Journal of Mining, Reclamation
and Environment.
Preface
In chapter five, the short-term economics of diesel and battery powered LHDs over
the 10-year lifetime of an LHD was the primary focus. The goal of this chapter was to
improve the accuracy of the economic model by adding new parameters and analyzing
several types of battery chemistries in addition to NaMX. The effects of reducing energy
costs with lower ventilation requirements were investigated to determine its effect on the
value of each LHD. Lead acid and lithium iron phosphate battery chemistries were
analyzed and compared to NaMX to determine which battery added the most value to a
battery powered LHD. All improvements to the economic model, sensitivity analysis, and
calculations were conducted by the primary author.

63
Abstract
Due to unstable fuel costs, and increasing concern for miner safety there has been a push
to find a battery that can outperform the century old PbA technology while remaining
economically competitive with diesel. This study focuses on the operating costs and
revenue generated by battery and diesel powered LHDs. The data was used to generate a
short-term economic model which calculated the present value(PV) in both nominal and
constant dollar values, net present value (NPV), and payback period both overall and for
the extra capital required for battery operated vehicles. The base case results confirmed
that battery LHDs brought a greater value to a mine adding roughly $200,000 annually per
vehicle compared to diesel LHDs. Diesel LHDs, however, had a calculated IRR an average
of 10.5% higher than NaMX battery LHDs.
Keywords: Underground mining, Alternative power source, Short term Economic
analysis, Sensitivity Analysis, Incremental Analysis
64
5.1 Introduction
The profitability of a mine is dependent on several factors. Some are obvious such
as the upfront capital cost the maintenance cost, energy cost, etc but it is the indirect impact
certain equipment has that are often overlooked. This often happens when the decision is
made quickly or equipment is replaced with the same model to save time. Load Haul Dump
Vehicles (LHDs) can either be powered by diesel or electricity. The most common electric
powered LHD are tethered to a power source by a several inch-thick cable. Until recently,
the only battery powered LHDs available used lead acid (PbA) batteries. Valued for their
mechanical and thermal stability and relative low cost, PbA technology seems like a perfect
technology. The batteries, however, not only have relatively low energy density, but
contain toxic materials and have low cycle life. Due to unstable fuel costs, and increasing
concern for miner safety there has been a push to find alternative ways to power LHDs.[1]–
[4] One option being a battery that can outperform the century old PbA technology while
remaining economically competitive with diesel. Well known mine vehicle manufacturers
such as RDH mining equipment in Alban, Canada and GE’s Fairchild in the United States
have already answered with mining vehicles that utilize lithium-ion technology. Battery
operated vehicles generally cost 10-20% more than diesel and, although the average vehicle
lifetime is 10 years, current battery technology only lasts approximately 3500 cycles or 3-
4 years.[5]–[7] This need for replacement only adds to the maintenance cost of the vehicle.
Battery technologies that last upwards of 10,000 cycles are currently available,
however they are either cost or size prohibitive. In the 1990’s, sodium metal halide
(NaMX) batteries were developed for the sole purpose of powering electric vehicles. These
batteries offered the same mechanical and thermal stability as PbA batteries but with two
to three times the cycle life and increased energy density. The major stumbling block being
the operating temperature of 230ºC. This means that fresh cells need several hours
operating temperature. First marketed by Sony in 1991, Lithium ion batteries offered
similar cycle life, a 30% increase energy density compared to NaMX. This remarkable
advance was not without its costs as even current Li-ion batteries are expensive, still use
flammable electrolytes, and are relatively sensitive to thermal stress. [8], [9]
This study focuses on the operating costs and revenue generated by battery and
diesel powered LHDs. The data was used to generate a short-term economic model which
calculated the present value(PV) in both nominal and constant dollar values, net present
value (NPV), and payback period both overall and for the extra capital required for battery
operated vehicles. Incremental analysis was used to exclude revenue and costs both power
sources require. NaMX and Lithium-ion batteries will be compared with PbA batteries in
this study and all three battery technologies will be compared to diesel.
5.2 Considered factors
5.2.1 Invested Capital and maintenance Cost
A 2012 study by Sayadi et al. used Single Regression Analysis (SRA) and a
combination of Multiple linear regression (MLR) and Principal component analysis (PCA)
to model the capital and operating costs of both diesel and electric vehicles using data
65
acquired from infomine.[6] The equations developed by this analysis were used to estimate
a base case parameter for both capital and operating costs for both power types. As
mentioned in an earlier study, it was assumed that the only difference between tethered
electric and battery powered LHDs were that the tether spool was replaced with a
battery.[10]
5.2.2 Mine Data
Performance data for both diesel and electric LHD fleets over the course of one
year was acquired from a Peruvian gold mine. The diesel fleet consisted of nine diesel
powered LHDs with a bucket capacity ranging between 2.2-3.5 m3. The electric fleet
consisted of 7 Tethered electric LHDs with a bucket capacity of the same range as the
diesel fleet. The performance data, provided for each individual vehicle, consisted of
vehicle tonnage, operational expenses and time logs. The operational expenses included
fuel consumption and maintenance expenses and were categorized in tires, lubrication, and
replacement parts. The time logs provided duration of uptime and downtime. Downtime
was broken down by cause with duration for each cause. The performance data was
analyzed in a previous study and showing that electric LHDs suffered less breakdowns. It
was also postulated that by removing all of the logistical issues such as tether setup and
breakdown, battery operated vehicles would benefit from a conservative seven percent
increase in uptime.[10]
5.2.3 Revenue
The revenue generated from each vehicle was calculated by multiplying the
individual haulage with the profit from processing a ton of ore. Since this scenario only
accounts for the replacement of LHDs of one type with another it is assumed no additional
processing equipment nor expenses are needed to meet the demands of the replacement
LHD. The operational mine data acquired from Peru was a gold mine, so the ore
characteristics used were for gold ore. The 2015 average market price for gold was
obtained from the United States Geological Survey (USGS).[11]
5.2.4 Energy
5.2.4.1 Fuel Costs: Diesel Fuel and Electricity
The cost of diesel fuel has been on the decline after a 3.5 year period holding steady
around $3.50. The average 2015 U.S. national average price of diesel fuel was used in the
model, inflated a conservative 30% to account for any rebound in 2016.[12] As mentioned
above, fuel consumption was based off of the data acquired from the Peruvian mine.
The cost of electricity, unlike petroleum, is much less volatile however, averaging
a slow and steady rise at the rate of two percent over the past 13 years. The average 2015
U.S. national average price of electricity for the industrial sector was used in the model,
inflated a conservative 30% to account for any spikes in cost in 2016.[12] Electricity
consumption will vary with use but it was assumed that the LHD would require of 64 kW,
the energy rating of the drive motor.

66
5.2.4.2 Battery Costs
According to a 2013 study by Ferreira et al, NaMX are the least expensive of the
three batteries analyzed in this paper at approximately 150 USD·kWh-1.[7] PbA technology
is slightly more at approximately 200 USD·kWh-1. Li-ion batteries are the most expensive
range of batteries with lithium iron phosphate (LFP) cells averaging approximately 600
USD·kWh-1 and lithium titanate spinel cells at the other end of the spectrum averaging
approximately 2,500 USD·kWh-1. Due to its prohibitive cost, lithium titanate spinel cells
will not be discussed further in this paper.
5.2.5 Ventilation
Ventilation costs are a major expense and highly regulated by mine safety
organizations such as the Mine Safety and health administration (MSHA) in the United
States.[3] Replacing Diesel equipment with zero-emission equipment on average reduces
the required ventilation energy costs by approximately 20%.[13] Since mines eventually
require major renovations to the main ventilation system at one point or another, due to an
extension in depth, lateral extent or production rate, lowering ventilation requirements with
zero emission LHDs could save considerable capital expenses in the future.[14]
A study by Righettini and Mousset-Jones analyzed several American underground
hardrock mines to determine how much ventilation would be saved by using an emission
free alternative to Diesel.[13] The data from this study was used to determine the
approximate energy savings, per 64 kW LHD. The calculated energy savings were divided
by corresponding diesel fleet size for each mine analyzed to calculate an average kWh
saved per kW of vehicle power. The value was then multiplied by the vehicle size and
electricity price used in this study to obtain the operating cost savings per LHD.
5.3 Methodology
5.3.1 Model Parameters
They were separated into 3 categories, vehicle dependent, vehicle independent, and
electrochemical parameters. Vehicle dependent parameters are those that vary due to
differences in the construction or operation of the vehicle. Vehicle independent parameters
remain the same regardless of the type of vehicle in operation. Electrochemical parameters
are specific to battery LHDs and vary with respect to cell chemistry.
5.3.1.1 Vehicle dependent Parameters
Equipment dependent variables, shown in Table 5.3-1 below, include capital costs,
maintenance costs, vehicle lifetime, haulage, hours of operation, and energy requirements.
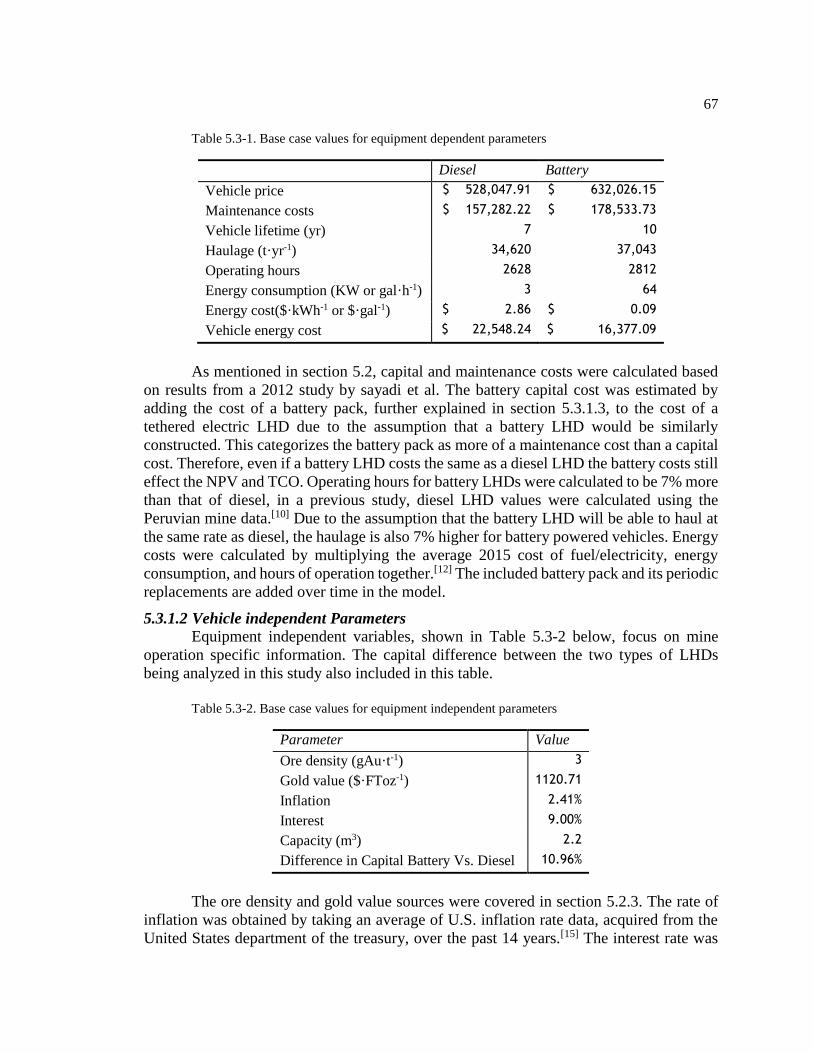
67 Table 5.3-1. Base case values for equipment dependent parameters
Diesel Battery
Vehicle price $ 528,047.91 $ 632,026.15
Maintenance costs $ 157,282.22 $ 178,533.73
Vehicle lifetime (yr) 7 10
Haulage (t·yr-1) 34,620 37,043
Operating hours 2628 2812
Energy consumption (KW or gal·h-1) 3 64
Energy cost($·kWh-1 or $·gal-1) $ 2.86 $ 0.09
Vehicle energy cost $ 22,548.24 $ 16,377.09
As mentioned in section 5.2, capital and maintenance costs were calculated based
on results from a 2012 study by sayadi et al. The battery capital cost was estimated by
adding the cost of a battery pack, further explained in section 5.3.1.3, to the cost of a
tethered electric LHD due to the assumption that a battery LHD would be similarly
constructed. This categorizes the battery pack as more of a maintenance cost than a capital
cost. Therefore, even if a battery LHD costs the same as a diesel LHD the battery costs still
effect the NPV and TCO. Operating hours for battery LHDs were calculated to be 7% more
than that of diesel, in a previous study, diesel LHD values were calculated using the
Peruvian mine data.[10] Due to the assumption that the battery LHD will be able to haul at
the same rate as diesel, the haulage is also 7% higher for battery powered vehicles. Energy
costs were calculated by multiplying the average 2015 cost of fuel/electricity, energy
consumption, and hours of operation together.[12] The included battery pack and its periodic
replacements are added over time in the model.
5.3.1.2 Vehicle independent Parameters
Equipment independent variables, shown in Table 5.3-2 below, focus on mine
operation specific information. The capital difference between the two types of LHDs
being analyzed in this study also included in this table.
Table 5.3-2. Base case values for equipment independent parameters
Parameter Value
Ore density (gAu·t-1) 3
Gold value ($·FToz-1) 1120.71
Inflation 2.41%
Interest 9.00%
Capacity (m3) 2.2
Difference in Capital Battery Vs. Diesel 10.96%
The ore density and gold value sources were covered in section 5.2.3. The rate of
inflation was obtained by taking an average of U.S. inflation rate data, acquired from the
United States department of the treasury, over the past 14 years.[15] The interest rate was

68
used to calculate the annual present value and therefore cumulative present value and net
present value.
5.3.1.3 Electrochemical Parameters
Three different battery chemistries are being analyzed in this model, lithium iron
phosphate, sodium metal halide, and lead acid. Each technology has differing operating
parameters as shown in Table 5.3-3. The fundamental differences for each cell chemistry
are outlined in detail in a previous study.[9]
Table 5.3-3. Base case values for electrochemical parameters
Parameters LFP NaMX PbA
Cell cost ($·kWh-1) $ 600 $ 150 $ 200
Cycle life 3,250 3,250 1,100
Capacity fade multiplier 0.2 0.2 0.2
Desired capacity(kWh) 256 256 256
Required capacity(kWh) 307.2 307.2 307.2
Charge frequency (hr) 4 4 4
Eecharges per day 3 3 3
Battery lifetime (yr) 3 3 1
Battery pack total cost $ 184,320 $ 46,080 $ 61,440
Weight (Kg·kWh-1) 6.5 8 25
Battery Pack Weight (Kg) 1,997 2,458 7,680
The cost of the battery pack is calculated by multiplying the required capacity by
the cell cost. The required capacity takes utilization capacity fade into account by inflating
the desired capacity by a capacity fade multiplier. This provided a surplus of capacity that
will allow for a minimum of the desired capacity to be used for the cells expected lifetime.
Also, discharging certain technologies to a 100 percent depth of discharge (DoD) can cause
irreparable damage and a decrease in lifetime. The capacity fade multiplier allows for the
cell to operate its desired duration while minimizing cell degradation. Many underground
hard rock mining operations operate in blast haul cycles lasting approximately 4 hours each
leading to 1 cycle per shift including setup and breakdown. This leads to a recharge
frequency of about four hours per recharge or 3 recharges per day. This rate allows for
approximately a year of use for every 1,100 cycles of a batteries lifetime. Weight also has
an impact on the stress of the vehicle’s components, leading to more frequent repairs. The
last two parameters in Table 5.3-3 estimate how much each battery pack will weigh.
5.3.2 Model description
The economic model is similar to one used in a previous study, to calculate the long
term economics of diesel and NaMX LHDs over the lifetime of a mine.[16] Some
improvements were made to the model to present a more accurate analysis such as the
inclusion of ventilation costs as well as an update of the base case values. The model was
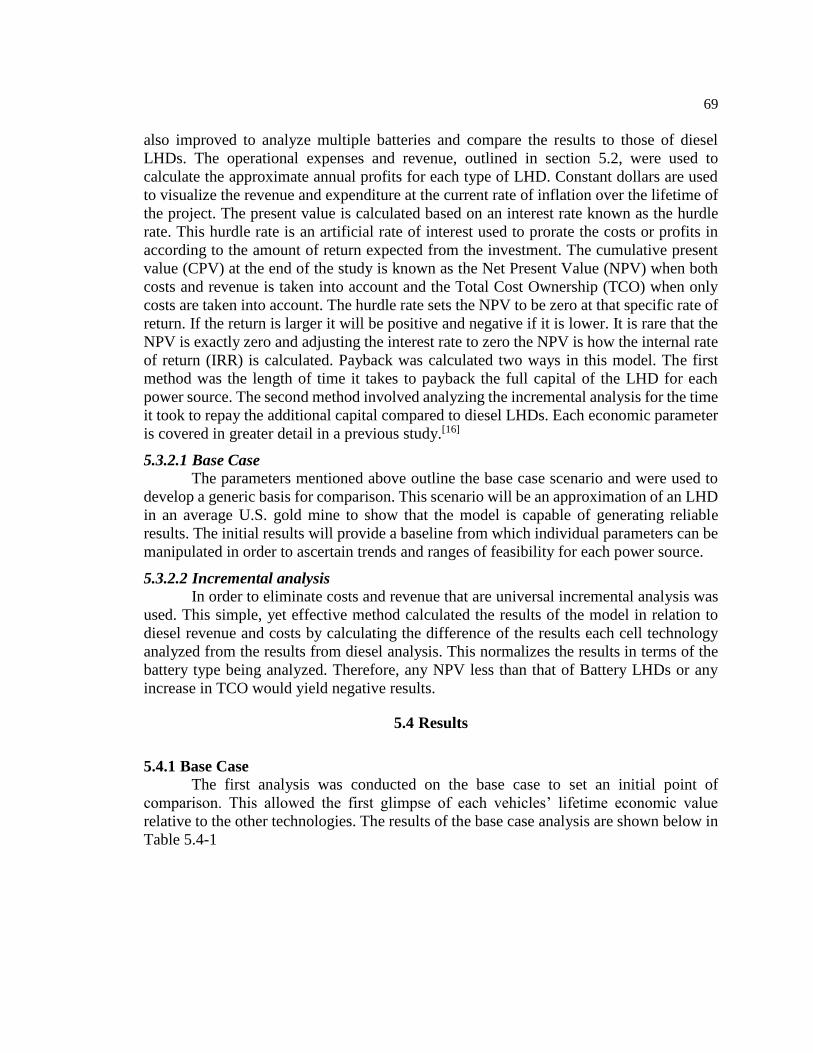
69
also improved to analyze multiple batteries and compare the results to those of diesel
LHDs. The operational expenses and revenue, outlined in section 5.2, were used to
calculate the approximate annual profits for each type of LHD. Constant dollars are used
to visualize the revenue and expenditure at the current rate of inflation over the lifetime of
the project. The present value is calculated based on an interest rate known as the hurdle
rate. This hurdle rate is an artificial rate of interest used to prorate the costs or profits in
according to the amount of return expected from the investment. The cumulative present
value (CPV) at the end of the study is known as the Net Present Value (NPV) when both
costs and revenue is taken into account and the Total Cost Ownership (TCO) when only
costs are taken into account. The hurdle rate sets the NPV to be zero at that specific rate of
return. If the return is larger it will be positive and negative if it is lower. It is rare that the
NPV is exactly zero and adjusting the interest rate to zero the NPV is how the internal rate
of return (IRR) is calculated. Payback was calculated two ways in this model. The first
method was the length of time it takes to payback the full capital of the LHD for each
power source. The second method involved analyzing the incremental analysis for the time
it took to repay the additional capital compared to diesel LHDs. Each economic parameter
is covered in greater detail in a previous study.[16]
5.3.2.1 Base Case
The parameters mentioned above outline the base case scenario and were used to
develop a generic basis for comparison. This scenario will be an approximation of an LHD
in an average U.S. gold mine to show that the model is capable of generating reliable
results. The initial results will provide a baseline from which individual parameters can be
manipulated in order to ascertain trends and ranges of feasibility for each power source.
5.3.2.2 Incremental analysis
In order to eliminate costs and revenue that are universal incremental analysis was
used. This simple, yet effective method calculated the results of the model in relation to
diesel revenue and costs by calculating the difference of the results each cell technology
analyzed from the results from diesel analysis. This normalizes the results in terms of the
battery type being analyzed. Therefore, any NPV less than that of Battery LHDs or any
increase in TCO would yield negative results.
5.4 Results
5.4.1 Base Case
The first analysis was conducted on the base case to set an initial point of
comparison. This allowed the first glimpse of each vehicles’ lifetime economic value
relative to the other technologies. The results of the base case analysis are shown below in
Table 5.4-1

70 Table 5.4-1. Incremental analysis of base case data: Diesel Vs. Battery
LFP NaMx PbA
NPV $ (1,098,335) $ (1,484,143) $ (1,157,005)
NPV (annual) $ (171,080) $ (231,175) $ (180,218)
Payback 1 0 0
IRR 26.5% 10.5% 14.0%
The incremental analysis shows that diesel LHDs net less profit when compared to
all of the battery technologies. NaMX performs best of all the batteries netting almost 1.5
MMUSD more than diesel LHDs. This was followed by PbA at approximately 1.2
MMUSD and LFP around 1.1 MMUSD more than diesel LHDs. The annual NPV was
calculated at an interest rate of nine percent over ten years. Although, battery LHDs excel
on a per LHD bases, diesel excels on a cost bases with an IRR 10.5 percent higher than the
best battery LHD. Therefore, the best vehicle for the mine depends on the amount of capital
and how many LHDs require replacement. LHDs powered by an LFP battery pack were
the only technology that required a longer payback than diesel requiring an extra year to
pay off its initial expenses.
5.4.2 Sensitivity Analysis
Analysis of the base case provides detailed information on the comparison of the
vehicles with respect to its power source, however it is only a single scenario. No two
mines have the same operating parameters, so to address that fact a sensitivity analysis was
performed. This technique is particularly useful when a model contains a large number of
input parameters, allowing for the observation of a range of profitability for each
variable.[17] The parameters were modified individually to isolate trends for each variable.
5.4.2.1 Star Plot
It is hard to tell from first glance what variables have the greatest impact so a star
plot is used to determine the most influential parameters of the model. Since all of the
parameter multipliers were identical for all battery LHDs, the battery with the best lifetime
value, NaMX, was used to produce the star plot seen below in Figure 5.4-1. The axis was
zeroed at the base case value which would also be a zero percent deviation from any
parameter. This split the plot into four quadrants allowing for efficient visualization of the
parameter’s effect. According to standard Cartesian quadrants, quadrant I shows
parameters that, when increased, increases diesel’s lifetime value. Quadrant II shows
parameters that, when decreased, increases diesel’s lifetime value. Quadrants III and IV
shows the inverse of that of the first two quadrants. Therefore, the corresponding y-axis
value, for a given parameter, is a potential lifetime value deviation from owning a diesel
LHD instead of a NaMX powered LHD.

71
Figure 5.4-1.Diesel Vs NaMx star plot: Battery Haulage(Gray), Ore Price(Blue), Diesel
Maintenance (Purple), Diesel Fuel Cost(Indigo), Ventilation Savings(Yellow), Electricity
Costs(Red), Equipment Capital ratio(Brown), Battery Maintenance(Green), Diesel Haulage
(Orange).
Performing a sensitivity analysis on several parameters gives some perspective on
which parameters have the greatest effect on the lifetime value of the LHD. It was observed
that parameters with negative trends tended to be larger in magnitude those that have
positive trends. This leads to the conclusion that diesel LHDs tend to benefit from a general
decrease in the magnitude of a parameter. As a result, battery LHDs tend have the inverse
relationship.
$(2,250,000.00)
$(2,000,000.00)
$(1,750,000.00)
$(1,500,000.00)
$(1,250,000.00)
$(1,000,000.00)
$(750,000.00)
-50% -40% -30% -20% -10% 0% 10% 20% 30% 40% 50%
NPV D
iese
l Vs.
NaM
X (U
SD
)
Percent of Base Case

72 Table 5.4-2. Lifetime value deviation per percent deviation from base value
Parameter Deviation
Diesel LHD Haulage 240,164
Battery LHD maintenance 11,457
Capital cost (% difference) 3,755
Extra Pack capacity required (Li-ion) 857
Extra Pack capacity required (PbA) 759
Electricity Costs 601
Extra Pack capacity required (NaMX) 214
Ventilation -434
Diesel fuel Costs -1,447
Diesel LHD maintenance -10,093
Ore price -16,811
Ore density -16,812
Battery LHD Haulage -256,976
The parameters in Table 5.4-2 are organized from parameters with the most positive
trends, benefiting diesel LHD NPV, to those with negative trends, benefiting battery LHD
NPV. The parameters that made the largest impact on the lifetime value of the LHDs were
unsurprisingly haulage, ore density, and ore price. Maintenance costs, capital costs, and
energy prices were the most influential in determining the TCO
5.4.2.2 Annual Tonnage
One of the largest impacts on the model are from modifying the tonnage of the
LHDs. Figure 5.4-2 shows how negatively effecting battery LHD haulage has an
exponential effect on the length of time required to payback the extra capital required for
Battery LHDs.

73
Figure 5.4-2. Payback of additional Capital vs. deviation from LHD haulage powered
with LFP(blue) PbA(Gray), and NaMX(Orange) battery packs.
The model also showed that if the annual haulage of battery powered LHDs was
decreased by approximately 2000 tons for LFP and PbA, 2500 tons for NaMX, would lose
all financial benefit over diesel powered LHDs. This would also occur if diesel powered
LHDs were able to increase its annual haulage by the same amount.
5.4.2.3 Ventilation
It may be surprising to see that ventilation has such a small impact on the difference
in TCO between diesel and battery powered LHDs when studies have shown five and even
six figure savings by replacing diesel LHDs with zero emission alternatives. The
mathematics behind those large savings stress two major factors. The first being the amount
of energy saved by reductions in fan speed and the second being the size of the fleet
replaced. It was calculated that, for a 10 year period, $9.13x10⁻⁴ was saved per kWh of
ventilation energy usage reduction saved for every kW of diesel fleet removed. Figure 5.4-3
shows how this scales to typical diesel fleet sizes in underground mines. Removing kW of
diesel fleet saves an average of 1.5 MWh of energy used for ventilation annually.
0
1
2
3
4
5
6
7
8
9
10
-2500 -2000 -1500 -1000 -500 0 500
Payback E
xtr
a I
nvest
ment
Vs.
Die
sel
(yr)
Deviation from Base Case Haulage (t)

74
Figure 5.4-3. Annual energy savings by fleet size
Reduced ventilation requirements are an excellent byproduct of battery LHDs,
however even if ventilation savings are 0, each battery type earn a larger NPV than diesel
LHDs.
5.4.2.4 Capital Investment
LHDs can be procured in various ways, by multiple suppliers, leading to
fluctuations in capital cost. Another factor that effects this parameter is the availability of
the product. The more manufacturers producing a specific type of LHD, the larger the cost
fluctuations. The difference in capital costs is also a factor, battery LHDs have been
reported to cost anywhere from ten to as high as thirty percent more.[5], [6] This is addressed
in Figure 5.4-4 with a two dimensional sensitivity analysis of capital cost for different cost
ratios. Each triangle shows how the difference in NPV between both LHD power sources
changes as capital costs are varied when battery LHDs cost between zero and thirty percent
more than diesel.
$0.00
$100,000.00
$200,000.00
$300,000.00
$400,000.00
$500,000.00
$600,000.00
$700,000.00
0 25 50 75 100 125 150
Energ
y S
avin
gs
(USD
)
Energy savings per LHD (MWh)
1000kW
3000kW
2500kW
2000kW
1500kW
500kW

75
Figure 5.4-4. NPV diesel vs. battery: 0% (light) and 30% (Dark) difference in capital
between diesel and battery powered LHDs for LFP(blue) PbA(Gray),
NaMX(Orange).
The analysis showed that at when battery LHDs cost 8.75% more than diesel capital
cost fluctuations effect both power sources equally. It was observed that increased capital
cost is an asset to battery LHDs at lower ratios and an asset to diesel LHDs at higher ratios.
5.4.2.5 Equipment Lifetime
Another mine dependent parameter is how long each vehicle is kept before it is
junked, sold, or traded. This model, however, does not take into account resale values or
leasing of equipment and as such they will not be discussed further in this study. How well
maintained the vehicles are or how hard the operator runs the equipment can effect the
LHDs lifetime. The effect of this variation in lifetime is explored in Figure 5.4-5. The
lifetime for the power source not being adjusted was maintained at 10 to accurately
compare the curves.
Figure 5.4-5. NPV diesel vs. battery: adjusting the lifetime of Battery(orange),
Diesel(gray) and Both (Blue)
-$1.7
-$1.6
-$1.5
-$1.4
-$1.3
-$1.2
-$1.1
-$1.0
-$0.9
-$0.8
$0.0 $0.2 $0.4 $0.6 $0.8 $1.0
NPV D
iese
l Vs.
Bat
tery
(M
MU
SD)
Diesel capital cost (MMUSD)
($5.0)
($4.0)
($3.0)
($2.0)
($1.0)
$0.0
$1.0
$2.0
$3.0
0 1 2 3 4 5 6 7 8 9 10
NPV D
iese
l Vs.
Ele
ctr
ic (
MM
USD
)
Lifetime (yr)
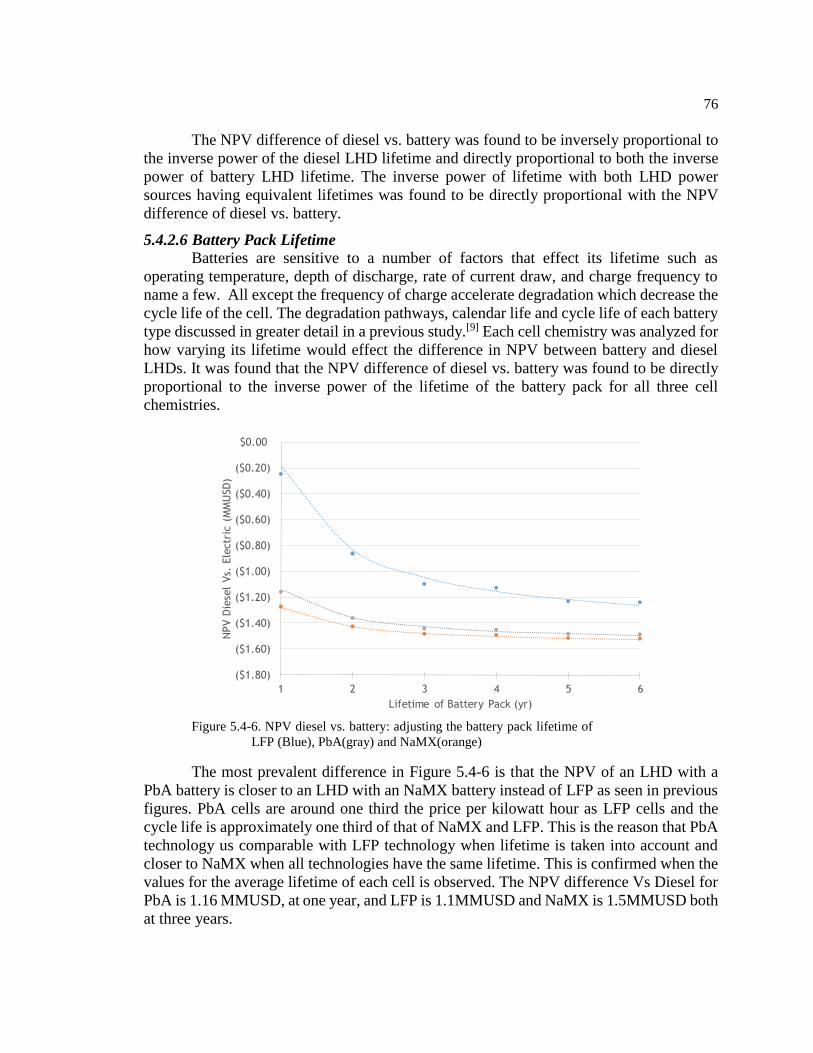
76
The NPV difference of diesel vs. battery was found to be inversely proportional to
the inverse power of the diesel LHD lifetime and directly proportional to both the inverse
power of battery LHD lifetime. The inverse power of lifetime with both LHD power
sources having equivalent lifetimes was found to be directly proportional with the NPV
difference of diesel vs. battery.
5.4.2.6 Battery Pack Lifetime
Batteries are sensitive to a number of factors that effect its lifetime such as
operating temperature, depth of discharge, rate of current draw, and charge frequency to
name a few. All except the frequency of charge accelerate degradation which decrease the
cycle life of the cell. The degradation pathways, calendar life and cycle life of each battery
type discussed in greater detail in a previous study.[9] Each cell chemistry was analyzed for
how varying its lifetime would effect the difference in NPV between battery and diesel
LHDs. It was found that the NPV difference of diesel vs. battery was found to be directly
proportional to the inverse power of the lifetime of the battery pack for all three cell
chemistries.
Figure 5.4-6. NPV diesel vs. battery: adjusting the battery pack lifetime of
LFP (Blue), PbA(gray) and NaMX(orange)
The most prevalent difference in Figure 5.4-6 is that the NPV of an LHD with a
PbA battery is closer to an LHD with an NaMX battery instead of LFP as seen in previous
figures. PbA cells are around one third the price per kilowatt hour as LFP cells and the
cycle life is approximately one third of that of NaMX and LFP. This is the reason that PbA
technology us comparable with LFP technology when lifetime is taken into account and
closer to NaMX when all technologies have the same lifetime. This is confirmed when the
values for the average lifetime of each cell is observed. The NPV difference Vs Diesel for
PbA is 1.16 MMUSD, at one year, and LFP is 1.1MMUSD and NaMX is 1.5MMUSD both
at three years.
($1.80)
($1.60)
($1.40)
($1.20)
($1.00)
($0.80)
($0.60)
($0.40)
($0.20)
$0.00
1 2 3 4 5 6
NPV D
iese
l Vs.
Ele
ctr
ic (
MM
USD
)
Lifetime of Battery Pack (yr)

77
5.5 Conclusions
In the continuing struggle to improve mine safety while maintaining or increasing
profits, alternatives to diesel powered machinery will continue to be explored and
improved. Battery powered LHD popularity is increasing with current battery technologies
replacing PbA cells. This economic analysis showed the limitations to a battery LHDs
economic prowess over diesel and identified ranges when each power source adds the most
value to the mine.
The base case results confirmed that battery LHDs brought a greater value to a mine
adding roughly $200,000 annually per vehicle compared to diesel LHDs. Diesel LHDs,
however, had a calculated IRR an average of 10.5% higher than NaMX battery LHDs.
Sensitivity analysis of the parameters expectantly revealed haulage, ore density, and ore
price had the largest effect on NPV. Maintenance costs, capital costs, and energy prices
were the most influential in determining the TCO. The model also showed that battery
powered LHDs breakeven point would be met if it hauled an average of 2,500 fewer tons
annually. The savings from ventilation proved to be small on a per vehicle bases but quite
substantial for the entire mine. It was calculated that, for a 10 year period, $9.13x10⁻⁴ was
saved per kWh of ventilation energy usage reduction saved for every kW of diesel fleet
removed. Analysis of the capital of the vehicle showed more insight on how manufacturers
can effect the value each LHD power source brings to the mine. As long as battery LHDs
cost more than 8.75% more than diesel, increasing prices will reduce the NPV of battery
LHDs more than that of diesel LHDs. Lifetime analysis for both the vehicles and battery
packs both has an inverse power relationship with NPV of battery Vs. diesel LHDs.
NaMx was found to be the best battery due to low cost, and cycle life comparable
to LFP. If the battery is constantly in use, which is feasible in a mining environment, then
there would be no need to heat the cells for use other than for the initial use. Although not
as large as NaMX, results confirm that PbA batteries that they have a significant advantage
over diesel LHDs. LFP cells were similar to PbA but were found to be less cost effective
than PbA batteries. LFP cells will need to drop in cost a bit more to beat out PbA. Now
that companies like GE and RDH are supplying the market with powerful LFP powered
battery LHDs, some may say they already have. Mine productivity data for this new breed
of LHD will become more prevalent, leading to more accurate, operational data for battery
powered LHDs. Replacing the estimated parameters with raw operational data from
underground mines, will improve the models accuracy. It is highly recommended that in
this resurgence of battery powered LHDs, NaMX batteries are given serious consideration
for deployment in the underground mining industry.

78
5.6 Publication 4 References
[1] U.S.government, “Mine Safety and Health Administration,” 2016. [Online].
Available: www.MSHA.gov.
[2] U.S.government, “Energy Information Agency,” 2016. [Online]. Available:
www.eia.gov.
[3] U.S.government, “Title 30,” U.S. Code Fed. Regul., 2014.
[4] U.S.government, “Diesel Particulate Single Source Page,” 2016. [Online]. Available:
http://www.msha.gov/01-995/dieselpartmnm.htm.
[5] W. Jacobs, M. R. Hodkiewicz, and T. Braunl, “A Cost Benefit Analysis of Electric
Loaders to Reduce Diesel Emissions in Underground Hard Rock Mines,” IEEE
Trans. Ind. Appl., vol. 51, no. 3, pp. 2565–2573, 2013.
[6] A. R. Sayadi, A. Lashgari, and J. J. Paraszczak, “Hard-rock LHD cost estimation
using single and multiple regressions based on principal component analysis,” Tunn.
Undergr. Sp. Technol., vol. 27, no. 1, pp. 133–141, 2012.
[7] H. L. Ferreira, R. Garde, G. Fulli, W. Kling, J. P. Lopes, H. Lopes, and J. Pecas,
“Characterisation of electrical energy storage technologies,” Energy, Mar. 2013.
[8] T. Reddy and D. Linden, Linden’s Handbook of Batteries, 4th ed. McGraw-Hill
Education, 2010.
[9] R. S. Schatz, A. Nieto, C. Dogruoz, and S. N. Lvov, “Using modern battery systems
in light duty mining vehicles,” Int. J. Mining, Reclam. Environ., no. February 2014,
pp. 37–41, 2014.
[10] R. S. Schatz, A. Nieto, C. Dogruoz, and S. N. Lvov, “Performance Analysis of
Electric and Diesel Equipment for Battery Replacement of Tethered LHDs Vehicles
in Underground Mining,” South African Inst. Min. Metal., 2016.
[11] U.S.government, “United States Geological Survey,” 2016. [Online]. Available:
www.usgs.gov.
[12] U.S.government, “Monthly Energy Review,” 2016. [Online]. Available:
https://www.eia.gov/totalenergy/data/monthly/previous.cfm.
[13] G. Righettini and P. Mousset-Jones, “Ventilation Savings With Fuel Cell Vehicles A
Cost-Benefit Analysis For Selected U.S. Metal/Non-Metal Mines,” pp. 1–5, 2004.
[14] D. J. Brake and T. Nixon, “Correctly Estimating Primary Airflow Requirements for
Underground Metalliferous Mines,” Tenth Undergr. Oper. Conf., no. April, pp. 14–
16, 2008.
[15] U.S.government, “U.S. Treasury Resource Center: Interest Rate Statistics,” 2016.
[Online]. Available: https://www.treasury.gov/resource-center/data-chart-
center/interest-rates/Pages/default.aspx.
[16] R. S. Schatz, A. Nieto, and S. N. Lvov, “Long-term economic sensitivity analysis of
light duty underground mining vehicles by power source,” Int. J. Min. Sci. Technol.,
2016.
[17] S. K. Firth, K. J. Lomas, and A. J. Wright, “Targeting household energy-efficiency
measures using sensitivity analysis.,” Build. Res. Inf., vol. 38, no. 1, pp. 25–41, 2010.

79
Chapter 6.
Closing Statements
6.1 Conclusions
In chapter 2, high priority equipment for soft rock mining methods, such as room
and pillar and longwall mining, were explored for their feasibility to be converted to run
on battery power. Most commonly used for soft rock ores such as coal, locomotives,
LHDs, continuous miners and longwall equipment are the most common vehicles for these
underground mining methods. It was found that locomotives and LHD vehicles could be
adapted to run on battery power, however, continuous miners and longwall equipment
require too large/expensive a battery pack to convert to battery power. Three modern
battery chemistries used for vehicles, VRLA, NaMx and Li-ion, were analyzed for their
ability to withstand the harsh environmental conditions found in underground mines.
NaMx batteries offer a decent middle ground between the low cost and energy density of
VRLA batteries and high cost and energy density of LFP batteries. A major drawback of
this battery type is the required operating temperature of 250-350 ºC, however, due to the
fact that the battery will be undergoing constant use, no cooling/heating cycles will be
necessary.
The first analysis of the data focused on the performance of the LHDs and was
performed on the downtime with respect to maintenance induced downtime and downtime
due to logistical issues. Analysis of the key performance indicators of both electric and
diesel LHDs confirmed that electric LHDs had consistently higher KPIs than diesel and
therefore have greater productivity. It was assumed that battery based equipment would
have maintenance times less than or equal to tethered electric vehicles and similar logistical
downtime to diesel vehicles, which do not have to drag a cable with it when moving from
one location to another point in the mine. The downtime of battery powered LHD vehicles
was determined by adding downtime due to maintenance of tethered electric equipment
(19 h), since the only difference between the two types is the power source, and the
logistical downtime of diesel equipment (152 h), since both types do not have tether cables
and are relatively the same size. Comparing the estimated downtime, (171 h) to the non-
battery downtime (183 h), a 7% increase in uptime is an estimated baseline improvement
in uptime. This conservative estimate can be improved by calculating downtime
improvement from logistical issues diesel equipment have that battery equipment do not.
The results from comparing the diesel and tethered electric LHD vehicles show that the
best equipment would be a fusion of the reliability of electric vehicles and the mobility of
diesel equipment. Battery powered equipment is an excellent way to achieve this, with the
benefits of both power sources.
The determination of value over the lifetime of a mine was accomplished in Chapter
3. Battery equipment was shown to offer significantly more value than diesel equipment to
an underground mine through increased profits and reduced maintenance and energy costs.
The battery to be used in the vehicles, however, is highly dependent on which of the
following factors is most important to the equipment manufacturer, safety, cost, size, and

80
weight. The economic model showed that the value of battery equipment improved due to
increased uptime and productivity. The revenue was found to be especially sensitive to the
amount of tons each vehicle hauls. Decreasing the amount of battery haulage by 5% or 0.2
tons per hour amounts to a $40k loss of profit per year. If the vehicle can be improved by
this much through increased mobility, productivity and uptime, that deficit can become a
bonus. Dividing the ∆NPV by the length of the model yields the average present value
which is approximately $95k. Generating $95k more in income annually reduces the
payback period from seven to two years to pay back the $100k investment of buying battery
powered equipment. The results of the economic sensitivity analysis showed that battery
LHDs have more value over the lifetime of a mine within a range of plausible parameters,
leading to the conclusion that a generic battery LHDs are a financially viable replacement
for diesel powered LHDs.
The short term economic analysis showed the limitations to a battery LHDs
economic prowess over diesel and identified ranges when each power source adds the most
value to the mine. Sensitivity analysis of the parameters expectantly revealed haulage, ore
density, and ore price had the largest effect on NPV. Maintenance costs, capital costs, and
energy prices were the most influential in determining the TCO. The savings from
ventilation proved to be small on a per-vehicle bases but quite substantial for the entire
mine. Analysis of the capital of the vehicle showed more insight on how manufacturers can
affect the value each LHD power source brings to the mine. As long as battery LHDs cost
more than 8.75% more than diesel, increasing prices will reduce the NPV of battery LHDs
more than that of diesel LHDs. Lifetime analysis for both the vehicles and battery packs
both has an inverse power relationship with NPV of battery vs. diesel LHDs. Results from
a short term economic sensitivity analysis of multiple cell chemistries confirm that battery
LHDs are able to operate in a wider range of plausible mine parameters.
Overall, the value of diesel and battery powered LHDs are so dependent on the
operating parameters of the mine that currently, there is not an all-purpose solution. NaMx
was consistently found to be the best battery to use in battery operated LHDs due to low
cost, and a cycle life comparable to LFP. If the battery is constantly in use, which is feasible
in a mining environment, then there would be no need to heat the cells for use other than
for the initial use. The model shows that LFP cells yield similar value to PbA, however
the lower replacement rate and significant reduction in rate for LFP batteries have proven
to be more desirable for underground mines. PbA technology is improving at a fraction of
the rate of Lithium ion technology and the relentless improvement in cost, energy density,
and cost will continue to make LFP cells increasingly more desirable. NaMX technology
is just as new a technology as LFP and also has significant room for improvement. In the
continuing struggle to improve mine safety while maintaining or increasing profits,
alternatives to diesel powered machinery will continue to be explored and improved It is
highly recommended that in this resurgence of battery powered LHDs, NaMX batteries are
given serious consideration for deployment in the underground mining industry.

81
6.2 Future Work
1. Battery powered LHD popularity is increasing with current battery technologies
replacing PbA cells. Mine productivity data for this new breed of LHD will become
more prevalent with powerful LFP powered battery LHDs being supplied to the
underground mining industry, leading to more accurate, operational data for battery
powered LHDs. Replacing the estimated parameters with raw operational data from
underground mines, will improve the models accuracy.
2. A major topic of investigation is currently the effect of diesel particulate matter
(DPM) on miner health. The model could be further improved with the inclusion of
the effects of DPM on operator health. The amount of productivity loss as well as
miner healthcare costs due to illness caused by DPM could compound those of the
additional costs due to ventilation required to dilute DPM concentrations.
3. Hybrid technology has the potential to increase profitability due to less powerful
engines being operated at optimum performance and smaller, lighter, and cheaper
battery packs. The same method and model used to compare battery and diesel LHDs
can be used to analyze how much value hybrid LHDs bring to underground hard rock
mines.
4. Though, a significant amount of studies has been conducted with PbA and Li-ion
batteries, NaMx research still has considerable room for development. Further
electrochemical studies are required for this battery type including but not limited to
membrane durability and impedance testing to better understand the scalability of
these batteries.

VITA – RICHARD S. SCHATZ
EDUCATION
The Pennsylvania State University
Doctor of Philosophy, Energy and Mineral Engineering, 2016
Doctoral Minor, Electrochemical Science and Engineering, 2016
Master of Science, Energy and Mineral Engineering, 2012
Bachelor of Science, Chemical Engineering, 2011
Bachelor minor, Chemisrty, 2011
WORK EXPERIENCE
The Energy Institute, Research Assistant, 2009-2016
PSU Dpt. Material Science, Research assistant, 2011-2012
PUBLICATIONS 1. Schatz, R.S., Nieto, A., and Lvov, S.N., 2016. “A Short-Term Economic Sensitivity Analysis of Diesel Vs.
Battery Powered Load Haul Dump Vehicles” The International Journal of Mining, Reclamation and
Environment,
2. Schatz, R.S., Nieto, A., and Lvov, S.N., 2016. “Long-term economic sensitivity analysis of light duty
underground mining vehicles by power source” Journal of Mining Science and Technology,
3. Schatz, R.S., Nieto, A., Dogruoz, C., and Lvov, S.N., 2016. Performance Analysis of Electric and Diesel
Equipment for Battery Replacement of Tethered LHDs Vehicles in Underground Mining South African
Institute of Mining and Metallurgy,
4. Arupananda Sengupta, Justin Beck, Haining Zhao, Rich S. Schatz, Margaret Ziomek-Moroz, and Serguei N.
Lvov “Corrosion Behavior of 13Cr Casing in Cement Synthetic Pore Solution” ECS Trans. 2015 66(17): 37-
50;
5. D. M. Hall, E. G. LaRow, R. S. Schatz, J. R. Beck, and S. N. Lvov, “Electrochemical Kinetics of
CuCl(aq)/HCl(aq) Electrolyzer for Hydrogen Production via a Cu-Cl Thermochemical
Cycle,” J. Electrochem. Soc., vol. 162, no. 1, pp. F108–F114, 2015.
6. S. Khurana, D. M. Hall, R. S. Schatz, and S. N. Lvov, “Effect of Clamping Pressure and
Temperature on the Performance of a CuCl(aq)/HCl(aq) Electrolyzer,” ECS Electrochem.
Lett., vol. 4, no. 4, pp. F21–F23, 2015.
7. S. Khurana, D. M. Hall, R. S. Schatz, M. V. Fedkin, and S. N. Lvov, “State-of-health of a CuCl
electrolyzer during a 168-h test,” Int. J. Hydrogen Energy, vol. 40, no. 1, pp. 62–69, 2015.
8. D. M. Hall, N. N. Akinfiev, E. G. LaRow, R. S. Schatz, and S. N. Lvov, “Thermodynamics and
Efficiency of a CuCl(aq)/HCl(aq) Electrolyzer,” Electrochim. Acta, vol. 143, pp. 70–82,
2014.
9. Schatz, R.S., Nieto, A., Dogruoz, C., and Lvov, S.N., 2014. Using modern battery systems in light duty
mining vehicles International Journal of Mining, Reclamation and Environment, 37-41.K
10. R. Schatz, S. Kim, S. Khurana, M. Fedkin, and S. Lvov,”High Efficiency CuCl Electrolyzer for CuCl
Thermochemical Cycle” ECS Transactions, 153- 164, 49 (2013)
11. D. M. Hall, R. S. Schatz, E. G. LaRow, and S. N. Lvov, “CuCl/HCl Electrolyzer Kinetics for
Hydrogen Production via Cu-Cl Thermochemical Cycle,” ECS Trans., vol. 58, no. 2, pp.
15–25, 2013.
12. S. Khurana, D. M. Hall, R. S. Schatz, and S. N. Lvov, “Diagnosis and Modeling of the CuCl
Electrolyzer Using Electrochemical Impedance Spectroscopy,” ECS Trans., vol. 53, no. 9,
pp. 41–50, 2013.
13. Sanchit Khurana, Rich Schatz, Soohyun Kim, Mark V. Fedkin, Serguei N. Lvov, “Using Electrochemical
Impedance Spectroscopy for Characterization of Hydrogen Production in CuCl Electrolyzer:, WHEC, 2012
14. Kim S., Schatz R.S., Khurana S., Fedkin M.V., Wang C. and Lvov S.N., Advanced CuCl Electrolyzer for
Hydrogen Production via the Cu-Cl Thermochemical Cycle”, Electrochemical Society Transactions (2011)
15. Balashov, V. N., Schatz, R. S., Chalkova, E., Akinfiev, N. N., Fedkin, M. V., & Lvov, S. N. (2011). “CuCl
electrolysis for hydrogen production in the Cu–Cl thermochemical cycle”. Journal of The Electrochemical
Society, 158(3), B266-B275.