A Job Analysis Study of the Certified Medical Interpreter … NBCMI JAR... · A Job Analysis Study...
31
A Job Analysis Study of the Certified Medical Interpreter 2017 Conducted for: National Board of Certification for Medical Interpreters (NBCMI) Prepared by: Pamela Ing Stemmer, PhD Senior Psychometrician, Psychometrics Department Neil B. Guman, MA Research Associate, Psychometrics Department Copyright © 2017 by the National Board of Certification for Medical Interpreters (NBCMI). PROPRIETARY. All rights reserved. No part of this publication may be reproduced or transmitted in any form or by any means, electronic or mechanical, including photocopy or recording, or any information and retrieval system, without permission in writing from the NBCMI.
Transcript of A Job Analysis Study of the Certified Medical Interpreter … NBCMI JAR... · A Job Analysis Study...

A Job Analysis Study of the Certified Medical Interpreter
2017
Conducted for: National Board of Certification for Medical Interpreters (NBCMI)
Prepared by: Pamela Ing Stemmer, PhD
Senior Psychometrician, Psychometrics Department
Neil B. Guman, MA Research Associate, Psychometrics Department
Copyright © 2017 by the National Board of Certification for Medical Interpreters (NBCMI). PROPRIETARY. All rights reserved. No part of this publication may be reproduced or transmitted in any form or by any means, electronic or mechanical, including photocopy or recording, or any information and retrieval system, without permission in writing from the NBCMI.

Certified Medical Interpreter Job Analysis Report
© 2017. NBCMI. All rights reserved. ~ i ~
Table of Contents
Executive Summary ...................................................................................................................... 1
Introduction ................................................................................................................................... 2
Methodology ................................................................................................................................. 3 Forming the Advisory Committee ...................................................................................... 3 Advisory Committee Responsibilities ................................................................................ 3 Developing the Job Analysis Survey ................................................................................. 4 Sample Selection .............................................................................................................. 6
Results .......................................................................................................................................... 7 Return Rate and Sample Size ........................................................................................... 7 Demographic Analyses ...................................................................................................... 7 Mean Task Ratings and Percent Performing ................................................................... 20 Decision Rules................................................................................................................. 22 Final Committee Review .................................................................................................. 24 Determination of Test Specifications ............................................................................... 24
Conclusions ................................................................................................................................. 27
References .................................................................................................................................. 28

Certified Medical Interpreter Job Analysis Report
© 2017. NBCMI. All rights reserved. ~ ii ~
List of Tables Table 1. In what medical setting(s) do you currently provide medical interpreting services? ...... 11 Table 2. Which of the following best describes you? ................................................................... 13 Table 3. Which of the following best describes your current position? ........................................ 13 Table 4. Summary of Mean Significance Ratings for Tasks ........................................................ 21 Table 5. Summary of Mean Significance Ratings for Knowledge Topics .................................... 22 Table 6. Summary of Subgroup Analyses ................................................................................... 22 Table 7. Decision Rules for Tasks ............................................................................................... 23 Table 8. Decision Rules for Topics of Knowledge ....................................................................... 24 Table 9. Respondent Allocation of Examination Items ................................................................ 25 Table 10. Test Specifications – Written Exam ............................................................................. 25 Table 11. Test Specifications – Oral Exam ................................................................................. 26 Table 12. Test Specifications – Oral Exam (continued) .............................................................. 26
List of Figures
Figure 1. Highest education (n=1,606) .......................................................................................... 8 Figure 2. Years of experience (n=1,621) ....................................................................................... 8 Figure 3. Hours per week (n=1,620) ............................................................................................. 9 Figure 4. Certified Medical Interpreter (n=1,621) .......................................................................... 9 Figure 5. Choropleth of states (n=1,613)..................................................................................... 10 Figure 6. Region (n=1,613) ......................................................................................................... 10 Figure 7. Community type (n=1,591) ........................................................................................... 11 Figure 8. Age (n=1,541) .............................................................................................................. 12 Figure 9. Gender (n=1,611) ......................................................................................................... 12 Figure 10. Shift (n=1,344) ........................................................................................................... 13 Figure 11. Setting (n=1,347) ....................................................................................................... 14 Figure 12. Primary language (n=1,344) ...................................................................................... 14 Figure 13. Secondary language (n=1,333) .................................................................................. 15 Figure 14. Learn secondary language (n=1,331) ........................................................................ 15 Figure 15. Secondary language proficiency (n=1,333) ............................................................... 16 Figure 16. Third language (n=1,224) ........................................................................................... 16 Figure 17. Learn third language (n=1,158) .................................................................................. 17 Figure 18. Third language proficiency (n=1,162) ......................................................................... 17 Figure 19. Hours training (n=1,332) ............................................................................................ 18 Figure 20. IMIA member (n=1,327) ............................................................................................. 18 Figure 21. Translate documents (n=1,328) ................................................................................. 19 Figure 22. Qualified to translate documents (n=1,327) ............................................................... 19 Figure 23. Survey adequacy (n=1,332) ....................................................................................... 20

Certified Medical Interpreter Job Analysis Report
© 2017. NBCMI. All rights reserved. ~ 1 ~
Executive Summary
The job analysis described in this report was conducted in 2017 at the request of the National Board of Certification for Medical Interpreters (NBCMI). The purpose of the study was to describe the job activities of a certified medical interpreter in sufficient detail to provide a basis for updating professional, job-related oral and written certification examinations. The NBCMI Job Analysis Advisory Committee (JAAC) conducted the activities necessary to identify job responsibilities and to develop specifications for a Certified Medical Interpreter (CMI) certification examination. The JAAC represented varied regions and practice settings. All JAAC members were experts in the duties and activities associated with the profession. The study involved developing job task and knowledge lists and survey, distributing the survey, and analyzing the survey responses. Specifications for a Certified Medical Interpreter certification examination were developed based on survey responses. The JAAC was responsible, with assistant from PSI Services staff, for the following tasks regarding survey development:
a. developing a sampling plan for the survey, b. identifying tasks and topics of knowledge for the survey instrument, c. determining the survey rating scales, d. determining the relevant demographic variables of interest, and e. integrating tasks, topics of knowledge, rating scales and demographics into a
survey instrument. The draft job analysis survey was distributed to JAAC members. The JAAC directed PSI Services (PSI) project staff to modify and finalize the survey for distribution to a sample of 13,000 individuals on an NBCMI mailing list. Electronic invitations to complete the web-based survey were sent to 13,000 NBCMI members and 2,300 members of the Oregon Health Care Interpreters Association (OHCIA). Additionally, web links were distributed through various other channels. Although 2,170 people entered into the survey, usable responses were not provided by all individuals. Usable responses were received from 1,624 participants. Responses to the demographic questions indicated that there were sufficient numbers from relevant groups for subsequent analyses. More than 97% of the respondents felt the job task and topic lists adequately covered the responsibilities of a certified medical interpreter. The task and topic ratings and raters were reliable (consistent). Relevant demographic subgroups were adequately represented. Therefore, the job analysis proceeded to the next phase. Survey data were presented to the JAAC. The JAAC developed and used task and topic exclusion decision rules to identify tasks and topics appropriate for the examination. From the 49 original survey tasks, 15 (30.6%) were excluded based on the exclusion criteria and from the 89 original topics of knowledge, 2 (2.2%) were excluded based on the exclusion criteria. Respondent comments were then reviewed. The detailed content outlines were constructed from the 87 remaining topics and 34 tasks. Taking into account psychometric considerations offered by PSI and programmatic guidance from NBCMI, the JAAC decided that a 75-item written examination (based on topics of knowledge) and an oral examination (based on both tasks and topics of knowledge) would sufficiently sample the content domains to render a pass or fail decision based on examination scores. The JAAC took into account respondents’ input on item allocation and their own expert judgment to create test specifications. The resulting detailed content outline and test specifications are subject to review and approval by the NBCMI for future implementation.

Certified Medical Interpreter Job Analysis Report
© 2017. NBCMI. All rights reserved. ~ 2 ~
Introduction
The job analysis described in this report was conducted in 2017 at the request of the NBCMI. The purpose of the job analysis was to describe a certified medical interpreter’s job in sufficient detail to provide a basis for updating a national certification examination program and ensuring that the content of the written and oral examinations would be job-related. The NBCMI appointed a Job Analysis Advisory Committee (JAAC) to assist in the preparation and review of the job analysis survey instrument. The JAAC developed a comprehensive inventory of activities and topics of knowledge that certified medical interpreters may perform within the performance domain of the job. In addition, demographic variables and a rating scale were selected for use on the survey. After pilot testing, the job analysis survey was distributed to 13,000 individuals on an NBCMI mailing list. The survey responses were analyzed to determine the significance of each task and topic of knowledge to the certified medical interpreter’s job. Job Analysis Survey (JAS) data were evaluated to determine the degree of consensus among certified medical interpreters on critical aspects of the job. Data were specifically analyzed to answer the following questions:
1. What percentage of certified medical interpreters perform each job task? 2. Which tasks are significant to the certified medical interpreter’s job? 3. What percentage of certified medical interpreters apply each topic of knowledge? 4. Which topics of knowledge are significant to the certified medical interpreter’s job?
These questions helped identify the significant job activities from which the content of an examination may be derived.

Certified Medical Interpreter Job Analysis Report
© 2017. NBCMI. All rights reserved. ~ 3 ~
Methodology
Forming the Advisory Committee The JAAC was consulted throughout the survey development stages to ensure that expert judgment was available to PSI Services (PSI) staff. The responsibilities of the JAAC are listed below. The members of the JAAC included experienced certified medical interpreters, thoroughly familiar with the skills and activities of a certified medical interpreter, and were chosen to represent a cross-section of certified medical interpreters (e.g., geographic region, professional roles, work environment, etc.). The JAAC members are listed in the following table.
Name Location
Patricia Alonzo, MA, CMI-Spanish Tampa, FL
Anastasia Antoniou, MBA Lowell, MA
Ben Becker, BSN Layton, Utah
Eric Candle, MA Fairport, NY
David Cardona, CMI-Spanish Portland, OR
Ricardo Diaz-Canedo, MD, CMI-Spanish Chula Vista, CA
Bruce Downing, PhD Minneapolis, MN
Yuka Lysiuk Waikoloa, HI
Jazmin Manjarrez, CMI-Spanish Portland, OR
Carlos Martinez-Morales, BS, CMI-Spanish Midvale, UT
Michael O’Laughlin, PhD Carlisle, MA
Marlene Obermeyer, MA Newton, KS
Ana Rodriguez, MHA, CMI-Spanish Wilder, KY
Sophia Rossovsky, MEd Staten Island, NY
Nina Scott, MS, CMI-Spanish Boston, MA
Ira SenGupta, MA Seattle, WA Advisory Committee Responsibilities
1. Provide PSI current information about the job.
2. Develop the JAS: a. develop a sampling plan for the survey, b. identify tasks and topics of knowledge for the survey instrument, c. determine the survey rating scales, d. determine the relevant demographic variables of interest, and e. integrate the definition, tasks, topics of knowledge, rating scales, and demographics
into a survey instrument.

Certified Medical Interpreter Job Analysis Report
© 2017. NBCMI. All rights reserved. ~ 4 ~
3. Review the final form of the JAS for completeness, relevance to the profession, appropriate language, and clear instructions.
4. Interpret and review survey results, determine task and topic exclusion criteria, and create the final detailed content outline.
A significant investment of time by the JAAC members ensured a successful job analysis study. We are grateful to each of these professionals for their guidance, expertise, and devotion to this complex project. Developing the Job Analysis Survey Developing the Task and Topic Lists With the assistance of PSI project staff, the JAAC drafted an inventory containing a comprehensive list of job tasks and topics of knowledge. The task list was drafted after discussing job descriptions, competency frameworks, and training materials. The JAAC noted that the resulting task list would be relevant to any medical interpreter, so the JAAC compiled the topic list to situate the tasks specifically in certified medical interpreting. The final documents consisted of 34 tasks and 87 topics presented in content order. The survey included a free-response question asking respondents to suggest tasks or topics they believed were missing from the lists. The complete survey is shown in Appendix A. Selecting Rating Scales The JAAC also assisted in the selection of the rating scale used in the job analysis study. The scale was based on similar scales used in previous national job analysis studies by other professions. A significance scale, including a not-performed data point, was selected by the JAAC to include on the survey. The scale was designed to identify the most significant tasks and topics of knowledge to achieving the certified medical interpreters' job objectives. Such information was necessary to demonstrate that any resulting examination would measure significant aspects of the job and cover appropriate content. The following scale was used:
Considering both importance and frequency performed, what is the significance of this task [knowledge] to your medical interpreting practice?
Not part of my practice
Minor
Moderate
Critical

Certified Medical Interpreter Job Analysis Report
© 2017. NBCMI. All rights reserved. ~ 5 ~
Selecting Demographic Information Questions This section was designed to gather information about the respondents’ demographic characteristics. Demographic questions were used to help the JAAC evaluate potential bias in the respondent group and to allow the JAAC to consider responses from relevant subgroups. The following information about survey respondents was collected:
• Whether they are providing medical interpreting services currently • Highest level of education • Years of experience as a medical interpreter • Hours per week providing medical interpreting services • Whether they are currently certified as a Medical Interpreter • Geographic location • Community type • Medical setting(s) • Age • Gender • Race/Ethnicity • Position • Shift • Setting/modality • Primary language • Secondary working language • How they learned secondary working language • Secondary working language proficiency • Third working language • How they learned third working language • Third working language proficiency • Medical Interpreter Training • IMIA member • Frequency expected to translate documents • How important it is to be qualified to translate documents
Region of practice and years of experience were used to identify subgroups for task analyses and to describe the sample, while no subgroups were identified for topics of knowledge. Finalizing the Job Analysis Survey Following the JAAC meeting, PSI staff compiled the survey components into draft form. The draft survey was reviewed by the JAAC. A pilot-study form of the job analysis survey was distributed to all JAAC members and a small number of other subject matter experts for review and comment. The purpose of the pilot study was to determine (1) if the directions were clear, (2) if any important tasks or topics were missing from the survey, (3) if the activities were clearly worded, and (4) if the rating scales were easy to use and understand. Comments from the pilot study participants were reviewed by a subgroup of the JAAC. The committee chair approved final editorial changes to the survey prior to distribution.

Certified Medical Interpreter Job Analysis Report
© 2017. NBCMI. All rights reserved. ~ 6 ~
Sample Selection In an effort to obtain information from respondents who represented medical interpreters throughout the United States 13,000 survey invitations were emailed to a list compiled by NBCMI and 2,300 members of the Oregon Health Care Interpreters Association (OHCIA). Additionally, web links were distributed through various channels, including: the International Medical Interpreters Association (IMIA; n=809), the Utah Translators and Interpreters Association (UTIA; n=45), the Oregon Society of Translators and Interpreters (OSTI; n=103), Facebook (exposure to 729 followers), and Twitter (exposure to 694 followers). As incentive to complete the survey, NBCMI awarded various prizes (i.e., IMIA Annual Membership, NBCMI Gift Certificate, Bilingual Medical Glossary, Interpreter Skills Test, Visa Gift Card) to randomly selected survey respondents. Respondents had the option of entering personal contact information at the end of the survey. This information was used only to randomly select the incentive winners and the information was not associated with their responses to the survey.

Certified Medical Interpreter Job Analysis Report
© 2017. NBCMI. All rights reserved. ~ 7 ~
Results
Return Rate and Sample Size
Invitations and two reminders were sent to 13,000 individuals. A total of 2,170 individuals accessed the survey (1,964 from the email invitation), yielding a raw response rate of 15.1%, however, not all responses were usable. Four hundred and thirteen (413) respondents either indicated that the practitioner definition did not describe them or did not respond to the question and 133 respondents did not provide ratings for any task or topics of knowledge. One respondent entered zero for the age demographic question, indicating an absence of thoughtful response. These cases were omitted from the data analysis sample. PSI staff and the JAAC agreed to omit these cases because the respondents did not appear to be providing meaningful data. Overall, 547 cases were omitted from data analysis, resulting in 1,623 valid cases. Demographic Analyses
Figures 1–22 present background information collected from the respondents. These demographic data helped describe the sample. Respondents were distributed across four geographic regions of the United States, with 2 respondents from Puerto Rico. Detailed information on responses to demographic questions are presented in Appendix B, however the typical respondent could be described as the following:
• has a Bachelor’s degree • over 9 years experience • works over 24 hours per week • is currently certified as a medical interpreter • located in the Western U.S. • works in an urban community • works in a hospital system • is approximately 47 years old • female, Hispanic • works in an interpreter position • day shift • on-site face-to-face staff • speaks Spanish as a primary language • speaks English as secondary working language • learned secondary working language in school • educated professional in secondary language • does not possess a third working language • has completed more than 90 hours of medical interpreting training • not an IMIA member • is not expected to translate documents • finds it very important to be qualified to translate documents

Certified Medical Interpreter Job Analysis Report
© 2017. NBCMI. All rights reserved. ~ 8 ~
Figure 1. Highest education (n=1,606)
Respondents were first asked to indicate their highest level of education. As shown in Figure 1, most respondents indicated that the highest level of education they had earned was a Bachelor’s degree (37.1%).
Figure 2. Years of experience (n=1,621)
Respondents were then asked to indicate how many years of experience they had as a medical interpreter. Figure 2 shows the frequency distribution of responses. The average respondent indicated having 9.57 years of experience (SD = 7.42).

Certified Medical Interpreter Job Analysis Report
© 2017. NBCMI. All rights reserved. ~ 9 ~
Figure 3. Hours per week (n=1,620)
Survey respondents were asked to indicate how many hours per week they provide medical interpreting services. Figure 3 shows the frequency distribution of responses. The average respondent indicated providing medical interpreting services 24.21 hours per week (SD = 14.70).
Figure 4. Certified Medical Interpreter (n=1,621)
Survey respondents were asked whether they were certified as a Medical Interpreter. Figure 4 shows that more than half of respondents (52.7%) are certified as Medical Interpreters.
Certified Medical Interpreter Job Analysis Report
© 2017. NBCMI. All rights reserved. ~ 10 ~
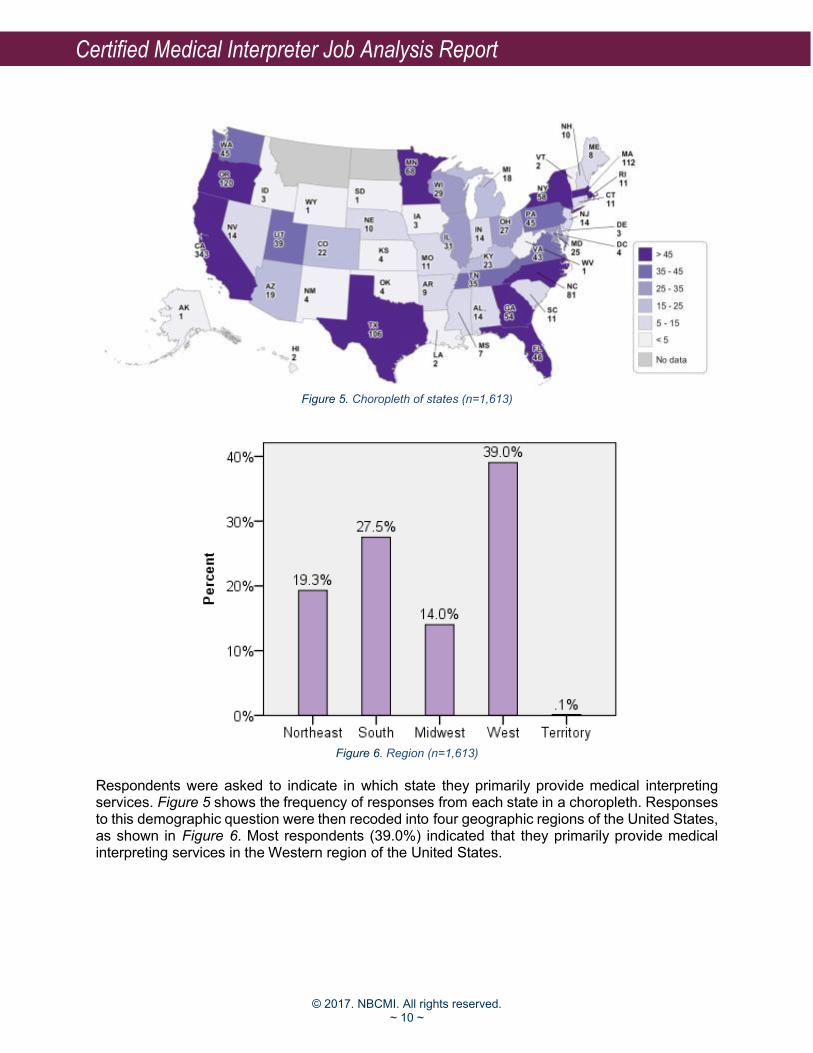
Figure 5. Choropleth of states (n=1,613)
Figure 6. Region (n=1,613)
Respondents were asked to indicate in which state they primarily provide medical interpreting services. Figure 5 shows the frequency of responses from each state in a choropleth. Responses to this demographic question were then recoded into four geographic regions of the United States, as shown in Figure 6. Most respondents (39.0%) indicated that they primarily provide medical interpreting services in the Western region of the United States.

Certified Medical Interpreter Job Analysis Report
© 2017. NBCMI. All rights reserved. ~ 11 ~
Figure 7. Community type (n=1,591)
Respondents were then asked to describe the type of community in which they practice. As shown in Figure 7, the majority of respondents (72.7%) indicated that they practice in an urban community. Survey respondents were also asked to indicate in what medical settings they provide medical interpreting services. Table 1 shows that most respondents (79.1%) provide medical interpreting services in hospital systems. Table 1. In what medical setting(s) do you currently provide medical interpreting services? (Select all that apply)
N Percent*
Diagnostic Testing Center 707 43.5
Hospital Systems 1,284 79.1
Health Insurance Company 291 17.9
Independent Clinic/Private Doctor’s Office 860 53.0
Public Health Department 442 27.2
Pharmacy 315 19.4
Other (please specify) 355 21.9
Total 4,255 262.0 *Note. Because respondents were allowed to choose more than one answer, percentages may not sum to 100.

Certified Medical Interpreter Job Analysis Report
© 2017. NBCMI. All rights reserved. ~ 12 ~
Figure 8. Age (n=1,541)
Respondents were asked to indicate their age. Figure 8 shows a frequency distribution of their responses. The average respondent age was 46.97 years old (SD = 12.11).
Figure 9. Gender (n=1,611)
As shown in Figure 9, the majority of respondents (78.8%) indicated that they identify as female. Respondents were also asked to indicate their race/ethnicity. Table 2 shows that the majority of respondents (60.8%) identified as Hispanic, Latino, or Spanish origin. Table 3 shows that the majority of respondents (76.0%) said that they are interpreters, while 10.9% reported working in a coordinator/supervisor/administrator position.

Certified Medical Interpreter Job Analysis Report
© 2017. NBCMI. All rights reserved. ~ 13 ~
Table 2. Which of the following best describes you? (Select all that apply)
N Percent*
White 491 30.3
Hispanic, Latino, or Spanish origin 986 60.8
Black or African American 37 2.3
Asian 187 11.5
American Indian or Alaska Native 12 0.7
Middle Eastern or North African 43 2.6
Native Hawaiian or Other Pacific Islander 3 0.2
Some other race, ethnicity, or origin 47 2.9
Total 1,806 111.2 *Note. Because respondents were allowed to choose more than one answer, percentages may not sum to 100. Table 3. Which of the following best describes your current position? (Select all that apply)
N Percent*
Interpreter 1,233 76.0
Coordinator/Supervisor/Administrator 177 10.9
Other (please specify) 174 10.7
Total 1,584 97.6 *Note. Because respondents were allowed to choose more than one answer, percentages may not sum to 100.
Figure 10. Shift (n=1,344)
Respondents were asked which shift they usually work as staff interpreters. Figure 10 shows that the majority of respondents (66.4%) report working the day shift.

Certified Medical Interpreter Job Analysis Report
© 2017. NBCMI. All rights reserved. ~ 14 ~
Figure 11. Setting (n=1,347)
Respondents were asked to indicate in which setting/modality they primarily worked as a medical interpreter. Figure 11 shows that the majority of respondents (59.1%) report working as on-site face-to-face staff.
Figure 12. Primary language (n=1,344)
As shown in Figure 12, most respondents (48.4%) reported Spanish as their primary language.
Certified Medical Interpreter Job Analysis Report
© 2017. NBCMI. All rights reserved. ~ 15 ~
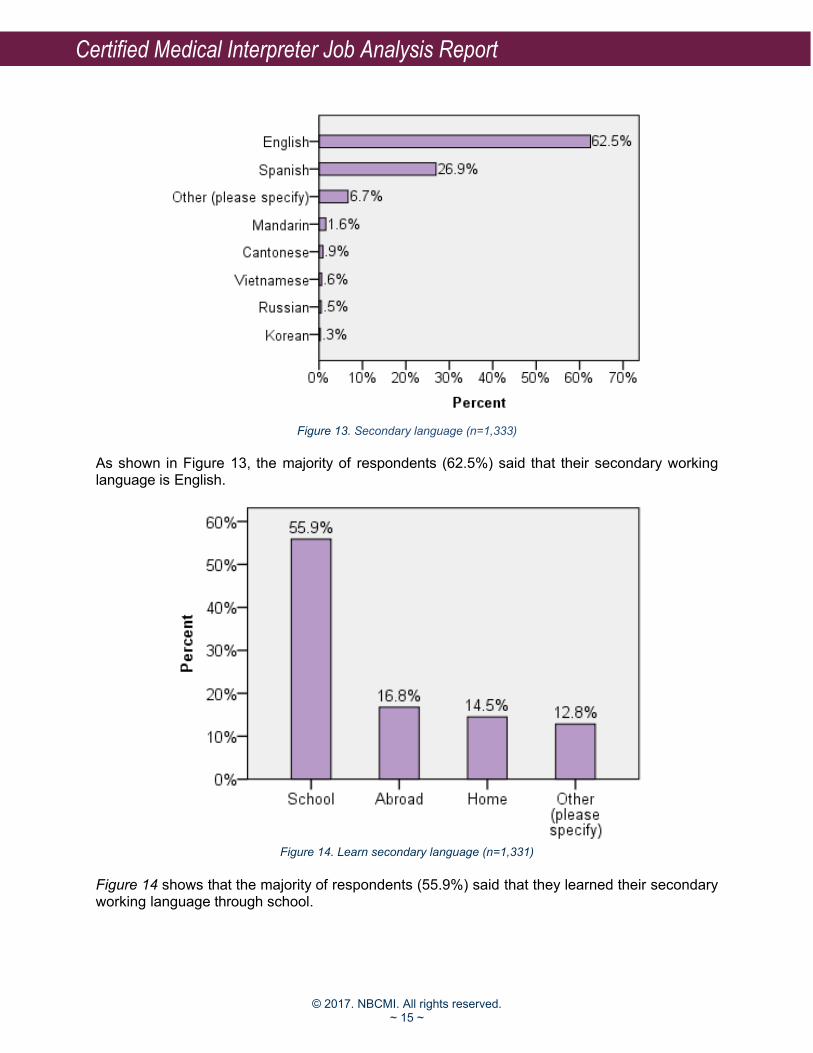
Figure 13. Secondary language (n=1,333)
As shown in Figure 13, the majority of respondents (62.5%) said that their secondary working language is English.
Figure 14. Learn secondary language (n=1,331)
Figure 14 shows that the majority of respondents (55.9%) said that they learned their secondary working language through school.

Certified Medical Interpreter Job Analysis Report
© 2017. NBCMI. All rights reserved. ~ 16 ~
Figure 15. Secondary language proficiency (n=1,333)
Respondents were then asked to rate their proficiency in their secondary working language. Figure 15 shows that the majority of respondents (64.5%) said that they are educated professionals in their secondary working language.
Figure 16. Third language (n=1,224)
Respondents were also asked to indicate their third working language. Figure 16 shows that the question was not applicable to the majority of respondents (73.1%). However, for respondents that did report a third working language, 18.2% indicated that the language was not listed in the response options.

Certified Medical Interpreter Job Analysis Report
© 2017. NBCMI. All rights reserved. ~ 17 ~
Figure 17. Learn third language (n=1,158)
Figure 17 shows that the majority of respondents (71.0%) said that the question was not applicable. However, if respondents did report a third working language, 14.2% said they had learned their third working language through school.
Figure 18. Third language proficiency (n=1,162)
Figure 18 shows that the majority of respondents (73.2%) said that the question was not applicable. However, if respondents did report a third working language, 12.0% said they had intermediate proficiency of their third working language.

Certified Medical Interpreter Job Analysis Report
© 2017. NBCMI. All rights reserved. ~ 18 ~
Figure 19. Hours training (n=1,332)
Respondents were asked to indicate how many hours of medical interpreting training they had completed. As shown in Figure 19, most respondents (44.7%) indicated that they completed more than 90 hours of medical interpreting training.
Figure 20. IMIA member (n=1,327)
Respondents were asked to indicate whether they were members of the IMIA. Figure 20 shows that the majority of respondents (72.9%) said they are IMIA members.

Certified Medical Interpreter Job Analysis Report
© 2017. NBCMI. All rights reserved. ~ 19 ~
Figure 21. Translate documents (n=1,328)
Survey respondents were then asked to estimate how often they are expected to translate documents. Figure 21 shows that the question was not applicable to most respondents (33.0%). However, if respondents were expected to translate documents, most respondents (16.7%) were expected to translate documents monthly.
Figure 22. Qualified to translate documents (n=1,327)
Respondents were asked to indicate how important it is to be qualified to translate documents. Figure 22 shows that most respondents (40.7%) said that being qualified to translate documents was very important.

Certified Medical Interpreter Job Analysis Report
© 2017. NBCMI. All rights reserved. ~ 20 ~
Figure 23. Survey adequacy (n=1,332)
At the end of the survey, there was a question to assess the adequacy of the survey: “How well do you feel this survey covered medical interpreting practice?” As depicted in Figure 23, 97.7% of respondents indicated that the survey at least adequately covered the critical tasks of a certified medical interpreter. Mean Task Ratings and Percent Performing
To determine which tasks were more important and more frequently performed by certified medical interpreters, descriptive data were calculated for each task (see Appendices C, D, and E). The purpose of these data was to determine which tasks remain on the final content outline. Respondents’ ratings were coded on a numeric scale, ranging from “Not part of my practice” at 0 and “Critical” at 3. Ratings of 0 (Not part of my practice) were tracked separately from other ratings, and the mean significance rating for a task is actually the mean of all non-zero ratings. The decision to not include 0 ratings in the mean rating is based on the rationale that only practitioners who actually perform a task should judge its significance. For example, Task 1 (Interpret consecutively: for completing intake/registration forms) had a mean importance rating of 2.35. Over six percent (6.04%) of the respondents provided a “Not part of my practice” or “0” rating for the task. Appendix C presents the tasks in the order they appear on the survey. Appendix C also indicates excluded tasks and the decision rules by which they were excluded. Decision rules are described in a later section of this report. Appendix D presents the tasks in ascending order by the frequency of respondents who provided a non-zero rating. Appendix E provides the same descriptive information as Appendix C and D, with the tasks sorted in ascending order by mean significance rating.

Certified Medical Interpreter Job Analysis Report
© 2017. NBCMI. All rights reserved. ~ 21 ~
The significance scale had values ranging from 0 (Not part of my practice) to 3 (Critical). A summary of the ratings for the significance scale is shown in Table 4. All tasks were rated as at least Moderate or above by the respondents (i.e., mean significance ratings between 1.50 and 2.49). Table 4. Summary of Mean Significance Ratings for Tasks
Significance Value Label Mean Values Range Frequency Percent
Critical 2.50 – 3.00 17 34.7%
Moderate 1.50 – 2.49 32 65.3%
Minor 1.00 – 1.49 0 0.0%
Totals 49 100.0% The JAAC reviewed the data for each task. They concluded that the ratings obtained from the job analysis survey were in agreement with their judgments about the job. Consequently, the JAAC also concluded that the job analysis survey data adequately defined the certified medical interpreter’s job on a national basis. Moreover, the JAAC judged the results to be sufficient for the purpose of delineating the structure and content of a national certification program. Mean Knowledge Ratings and Percent Applicable
To determine which topics of knowledge were most important and most frequently applicable to certified medical interpreters, descriptive data were calculated for each topic (see Appendices H, I, and J). The purpose of these data was to determine which topics of knowledge remain on the final content outline. Respondents’ ratings were coded on a numeric scale, from “Not part of my practice” at 0 and “Critical” at 3. Ratings of 0 (Not part of my practice) were tracked separately from other ratings, and the mean significance rating for a knowledge topic is actually the mean of all non-zero ratings. The decision to not include 0 ratings in the mean rating based on the rationale that only practitioners who actually apply a knowledge area to their practice should judge its significance. For example, Topic 1 (Roles of the Medical Interpreter: Conduit (e.g., interpreting without adding, changing, or omitting)) had a mean significance rating of 2.90. Under one percent (0.14%) of the respondents provided a “Not part of my practice” or “0” rating for the knowledge topic. Appendix H presents the topics of knowledge in the order they appear on the survey. Appendix H also indicates excluded topics of knowledge and the decision rules by which they were excluded. Decision rules are described in a subsequent section of this report. Appendix I presents topics of knowledge in ascending order by the frequency of respondents who provided non-zero ratings. Appendix J provides the same descriptive information as Appendix H and I, but the topics of knowledge are sorted in ascending order by mean significance rating. The significance scale had values ranging from 0 (Not part of my practice) to 3 (Critical). A summary of the ratings for the significance scale is shown in Table 5. All topics of knowledge were rated as at least Moderate or above by the respondents (i.e., mean significance ratings between 1.50 and 2.49).

Certified Medical Interpreter Job Analysis Report
© 2017. NBCMI. All rights reserved. ~ 22 ~
Table 5. Summary of Mean Significance Ratings for Knowledge Topics
Significance Value Label Mean Values Range Frequency Percent
Critical 2.50 – 3.49 66 74.2% Moderate 1.50 – 2.49 23 25.8%
Minor 1.00 – 1.49 0 0.0%
Totals 89 100.0% The JAAC reviewed the data for each topic. They concluded that the ratings obtained from the job analysis survey were in agreement with their judgments about the job. Consequently, the JAAC also concluded that the job analysis survey data adequately defined the certified medical interpreter’s job on a national basis. Moreover, the JAAC judged the results sufficient for the purpose of delineating the structure and content of a national certification program. Appendices F and G show the means, standard errors of measurement, valid number of respondents in each subgroup, and the number of subgroups with a mean rating below 2.0 for each task. Table 6 describes the subgroup analyses, and the data can be found in Appendices F and G. The appendices also indicate how some smaller groups were collapsed to form larger groups for the subgroup analyses. Table 6. Summary of Subgroup Analyses Appendix Subgroups
F Geographic Region Northeast, South, Midwest, West
G Years of Experience 0-5 years, 6-10 years, 11-15 years, 16 or more years
It is critical that the examination content reflect the responsibilities of the broadly defined population who might be eligible to take the examination. Therefore, it was vital to ensure that the examination content and resulting test specifications included tasks and topics of knowledge considered significant to job success by those for whom the examination is intended. The JAAC members used their collective judgment as they interpreted the survey results, to ensure that the content of the examination would be appropriate for a national sample of candidates from a variety of backgrounds. Decision Rules
As indicated previously, Appendices C through E show mean significance ratings for each task and Appendices H through J show mean significance ratings for each topic of knowledge across the full sample. Appendices F and G show mean task significance ratings for relevant subgroups. The JAAC was encouraged to consider how best to limit the content eligible for the test specifications to only broadly performed critical tasks and topics. The JAAC adopted eleven decision rules to identify tasks and topics of knowledge eligible for assessment. Tasks and topics of knowledge would be judged as eligible if they were performed by the majority of practitioners and determined to be significant enough by the total respondent sample and resulting subgroups. Table 7 summarizes these rules.

Certified Medical Interpreter Job Analysis Report
© 2017. NBCMI. All rights reserved. ~ 23 ~
Table 7. Decision Rules for Tasks
1. Keep only tasks performed by at least 70% of the respondents. 2. Keep only tasks rated with a mean significance rating of at least 2.0. 3. Keep only tasks rated with a mean significance rating of at least 2.0 by all
geographic-region subgroups shown in Appendix F. 4. Keep only tasks rated with a mean significance rating of at least 2.0 by all
years-of-experience subgroups shown in Appendix G.
Having determined the respondent sample to be sufficiently representative of the practitioner population, the JAAC applied the following criteria to tasks when implementing its decision rules. Appendix C shows the tasks that were deemed ineligible and the decision rule by which they were excluded. Rule 1 Keep only tasks performed by at least 70% of respondents. Tasks with “Not part of my practice” rating frequencies of 70% or greater were
evaluated by JAAC members on an individual basis to determine whether or not the task should be considered ineligible. Appendix D presents the tasks that became ineligible by this criterion. Applying this rule eliminated nine tasks (T17, T23, T28, T29, T30, T34, T35, T36, T37). One task (T39) fell below the threshold, but was retained based on unanimous committee agreement.
Rule 2 Keep only tasks rated with a mean significance rating of at least 2.0. The JAAC determined that the threshold for significance should be at least “Moderate.”
Applying Rule 2 eliminated one additional task (T03). One task (T46) did not fall below the threshold, but was eliminated based on unanimous committee agreement.
Rule 3 Keep only tasks rated with a mean significance rating of at least 2.0 by all
subgroups in geographic region. Because the content of a national examination should be equally endorsed
geographically, the JAAC examined task ratings by regional subgroups. The JAAC defined a mean significance rating of 2.0 across all geographic region subgroups as the Rule 3 criterion. Applying this subgroup threshold eliminated three additional tasks (T02, T41, T49). One task (T48) did not fall below the threshold, but was eliminated based on unanimous committee agreement. Additionally, one task (T45) fell below the threshold, but was retained based on unanimous committee agreement.
Rule 4 Keep only tasks rated with a mean significance rating of at least 2.0 by all years-
of-experience subgroups. Because practitioners with varying levels of experience in medical interpreting should
endorse the content of a national certification program, the task ratings were examined by years of experience. For years-of-experience subgroups, the JAAC defined a mean significance rating of 2.0 as the Rule 4 criterion. Applying the Rule 4 subgroup threshold eliminated no additional tasks.
Certified Medical Interpreter Job Analysis Report
© 2017. NBCMI. All rights reserved. ~ 24 ~
Having determined the respondent sample to be sufficiently representative of the practitioner population, the JAAC applied the following criteria to knowledge topics to implement its decision rules. Appendix H shows the topics of knowledge that were deemed ineligible and the decision rule by which they were excluded. Table 8 summarizes these rules. Table 8. Decision Rules for Topics of Knowledge
1. Keep only topics of knowledge applicable to at least 70% of the respondents. 2. Keep only topics of knowledge rated with a mean significance rating of at least 2.0.
Rule 1 Keep only topics applicable to at least 70% of respondents. Topics with “Not part of my practice” rating frequencies of 70% or greater were
evaluated by JAAC members on an individual basis to determine whether or not the topic should be considered ineligible. Appendix D presents the knowledge topics that became ineligible by this criterion. Applying this rule eliminated one topic (K83). Additionally, one knowledge topic (K11) was above the threshold, but was removed based on unanimous committee agreement.
Rule 2 Keep only topics rated with a mean significance rating of at least 2.0. The JAAC judged that the threshold for significance should be at least “Moderate.”
Applying Rule 2 eliminated no additional topics of knowledge. Final Committee Review
After applying the decision rules to determine which tasks and topics of knowledge were eligible for inclusion on the detailed content outline, the JAAC reviewed respondent comments (see Appendix K). No additional tasks or topics of knowledge were included in the final content outline on the basis of these comments; however, these comments may be considered by a future advisory committee during the next job analysis study. The original list had 49 tasks and 89 topics of knowledge. The final detailed content outlines are composed of 34 tasks and 87 topics of knowledge that were judged by the JAAC, using the data collected from 1,623 survey respondents, to describe the content suitable for the certified medical interpreter written and oral examinations. Determination of Test Specifications
Table 9 presents information used by the JAAC to determine the number of items to be included within each of the initial five areas of practice. Survey respondents suggested the percent of the exam that should be devoted to each area of practice. The third column in Table 9 presents the mean percent for each area. The allocations in Table 9 served as a starting point for the JAAC to discuss and make recommendations regarding item allocations.

Certified Medical Interpreter Job Analysis Report
© 2017. NBCMI. All rights reserved. ~ 25 ~
Table 9. Respondent Allocation of Examination Items If you were designing a medical interpreter examination, what % of the questions would you assign to each of these content areas?
N Mean Std. Dev. Min Max
1. Consecutive Interpreting 1,289 47.91 21.46 0 100
2. Simultaneous Interpreting 1,289 16.85 12.13 0 100
3. Sight Interpreting 1,289 12.76 7.75 0 60
4. Speaking to the Patient 1,289 15.82 13.83 0 100
5. Additional Activities 1,289 6.66 6.33 0 45
Tables 10-12 present the JAAC recommended Test Specifications. The JAAC reviewed tasks and topics of knowledge that remained eligible for developing the JAAC-recommended Detailed Content Outlines for the written and oral examinations. The JAAC-recommended Detailed Content Outlines are presented in Appendices L and M. Subject to review and approval by the NBCMI, future development of the CMI written and oral certification examinations will be based upon these Test Specifications and Detailed Content Outlines. Table 10. Test Specifications – Written Exam
NBCMI Multiple-Choice Test Specifications
% C
overage
Content Domains
1. Professional Practice 50%
A. Roles and Responsibilities 45%
1. Roles of the Medical Interpreter 10%
2. Medical Interpreter Ethics and Standards of Practice 20%
3. Cultural Competence 15%
B. Legislation and Regulations 5%
2. Medical Knowledge 50%
A. Specialties 20%
B. Terminology 30%
Total 100%

Certified Medical Interpreter Job Analysis Report
© 2017. NBCMI. All rights reserved. ~ 26 ~
Table 11. Test Specifications – Oral Exam
NBCMI Oral Test Specifications
Content Domain # Tasks
%
Coverage
1. Mastery of Linguistic Knowledge of English (Tasks: Interpret consecutively, interpret simultaneously, sight
translate) 30 25%
2. Mastery of Linguistic Knowledge of Non-English Working Language (Tasks: Interpret consecutively, interpret simultaneously, sight translate, speak in-language)
33 25%
3. Interpreting Knowledge and Skills (Tasks: Interpret consecutively, interpret simultaneously, sight
translate, speak in-language) 34 25%
4. Medical Terminology and Specialties in Working Languages (Tasks: Interpret consecutively, interpret simultaneously, sight translate)
33 25%
Totals -- 100% Table 12. Test Specifications – Oral Exam (continued)
Type of Assessment
Num
ber
% C
overage
Sight translation segments 1 English to Non-English and 1 Non-English to English 2 10%
Simultaneous interpreting scenarios 2 10%
Consecutive interpreting scenarios 14 80%
Totals 18 100%

Certified Medical Interpreter Job Analysis Report
© 2017. NBCMI. All rights reserved. ~ 27 ~
Conclusions
The purpose of this job analysis study was to describe the job activities of a certified medical interpreter in sufficient detail to provide a basis for updating professional, job-related written and oral certification examinations. A content validation strategy was implemented to ensure linkages between test specifications and the tasks and knowledge topics requisite for current practice in medical interpreting. The study was conducted to determine and comprehensively describe the certified medical interpreters’ job, to evaluate this description through the ratings of job incumbents, and to define areas that should be assessed in the oral and written certification examinations. The NBCMI formed the JAAC, who prepared a comprehensive list of activities describing the job. A representative sample of job incumbents completed the survey. The JAAC reviewed the survey results and used the survey task and knowledge significance ratings to develop test specifications directly related to the relevant activities and requisite knowledge for medical interpreting practice. Subject to the review and approval by the NBCMI, these test specifications will be used to update the current job-related oral and written certification examinations. Each form of the examination will contain the specified number of items distributed across the content areas. Because each test form will be developed to match these job-related test specifications, valid content-related inferences can be drawn about candidates’ abilities to perform the certified medical interpreter’s job.

Certified Medical Interpreter Job Analysis Report
© 2017. NBCMI. All rights reserved. ~ 28 ~
References
Baxter, S., Campion, M. W., Powell, K., & Zimmerman, H. H. (2010). National Society of Genetic Counselors 2010 Professional Status Survey: Work Environment. Chicago: National Society of Genetic Counselors.
Bloom, B. (Ed.) (1956). Taxonomy of Educational Objectives, Handbook I: The Cognitive Domain. New York: David McKay Company, Inc. Guilford, J. P. (1956). Fundamental Statistics in Psychology and Education. New York: McGraw
Hill. Hopkins, K.D., Stanley, J.C., & Hopkins, B.R. (1990). Educational and psychological
measurement and evaluation, (7th edition). New Jersey: Prentice Hall. Norusis, M. J. (1994). SPSS Professional Statistics 6.1. Chicago: SPSS