A Hypothesis Visualization and Query Systemwongls/psZ/qianjiangwen-fyp...i B.Comp.Dissertation A...
40
B.Comp.Dissertation A Hypothesis Visualization and Query System By Qian Jiangwen U074694M Department of Information System School of Computing National University of Singapore 2010/2011
Transcript of A Hypothesis Visualization and Query Systemwongls/psZ/qianjiangwen-fyp...i B.Comp.Dissertation A...

B.Comp.Dissertation
A Hypothesis
Visualization and Query
System
By
Qian Jiangwen
U074694M
Department of Information System
School of Computing
National University of Singapore
2010/2011
i
B.Comp.Dissertation
A Hypothesis
Visualization and Query
System
By
Qian Jiangwen
U074694M
Department of Information System
School of Computing
National University of Singapore
2010/2011
Project No: H114250
Advisor: Prof Limsoon Wong
Deliverables:
Report: 1 Volume
Program: 1 Diskette
ii
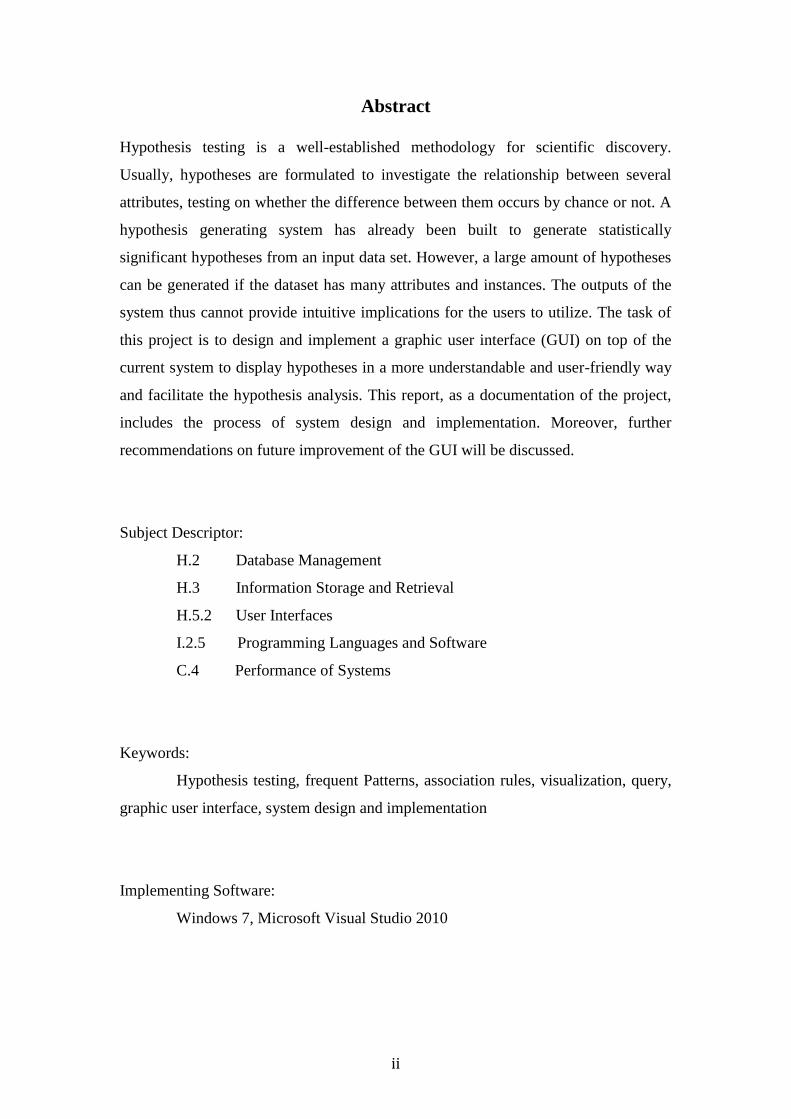
Abstract
Hypothesis testing is a well-established methodology for scientific discovery.
Usually, hypotheses are formulated to investigate the relationship between several
attributes, testing on whether the difference between them occurs by chance or not. A
hypothesis generating system has already been built to generate statistically
significant hypotheses from an input data set. However, a large amount of hypotheses
can be generated if the dataset has many attributes and instances. The outputs of the
system thus cannot provide intuitive implications for the users to utilize. The task of
this project is to design and implement a graphic user interface (GUI) on top of the
current system to display hypotheses in a more understandable and user-friendly way
and facilitate the hypothesis analysis. This report, as a documentation of the project,
includes the process of system design and implementation. Moreover, further
recommendations on future improvement of the GUI will be discussed.
Subject Descriptor:
H.2 Database Management
H.3 Information Storage and Retrieval
H.5.2 User Interfaces
I.2.5 Programming Languages and Software
C.4 Performance of Systems
Keywords:
Hypothesis testing, frequent Patterns, association rules, visualization, query,
graphic user interface, system design and implementation
Implementing Software:
Windows 7, Microsoft Visual Studio 2010

iii
ACKNOWLEDGEMENT
I owe a great many thanks to a great many people who helped and supported me
during the year of my Final Year Project in National University of Singapore.
My deepest thanks to Professor Limsoon Wong, the advisor of the project for guiding
and supervising me through the whole process. He gave me the great opportunity
working on this project proposed by him, even though I may not be the most capable
candidate to complete the tasks.
I express my heartfelt thanks to Dr. Feng Mengling and Dr. Liu Guimei, for patiently
coaching me and correcting various documents of mine with attention and care.
I also extend my thanks to my friends and family who have been continuously
supporting me along the road.

TABLE OF CONTENTS
1
Table of Contents
Title................................................................................................................................. i
Abstract ........................................................................................................................ ii
Acknowledgement ...................................................................................................... iii
I. Introduction .............................................................................................................. 2
II. Project Background ................................................................................................ 4
1. Motivation ............................................................................................................. 4
1.1 Current situation ............................................................................................. 4
1.2 Problems ......................................................................................................... 5
2. Project Scope & Objectives .................................................................................. 6
III. System Overview ................................................................................................... 6
1. Overall System Description .................................................................................. 7
2. Important Definitions & Notations ....................................................................... 7
3. Description of Current System ............................................................................ 11
3.1 Input .............................................................................................................. 11
3.2 Output ........................................................................................................... 11
3.2.1 Information of significant hypotheses .................................................. 11
3.2.2 Further Information of each hypothesis ................................................ 12
4. Graphic User Interface ........................................................................................ 12
IV. System Design and Implementation................................................................... 12
1. User Requirements Study .................................................................................... 13
1.1 Comparing attributes/items related Comparison .......................................... 13
1.2 Context related Comparison ......................................................................... 13
1.3 Filtering ........................................................................................................ 14
1.4. Sorting ......................................................................................................... 14
1.5 Further analysis on each hypothesis ............................................................. 15
2. GUI Functionality Design ................................................................................... 15
2.1 Data Importer................................................................................................ 15
2.2 Hypothesis Browser...................................................................................... 17
2.2.1 Visualization ......................................................................................... 17
2.2.3 Query .................................................................................................... 18

TABLE OF CONTENTS
2
2.3 Further Analysis Browser ............................................................................. 19
2.3.1 Database Construction .......................................................................... 20
2.3.2 Visualization ......................................................................................... 21
2.3.3 Query .................................................................................................... 21
2.4 UML Activity Diagram ................................................................................ 24
3. GUI appearance design ....................................................................................... 24
3.1 Window for Hypothesis Browser ................................................................. 24
3.2 Window for Further Analysis ....................................................................... 24
4. Technical platforms & software tools ................................................................. 25
5. Declaration of open source codes and libraries ................................................... 26
6. Testing ................................................................................................................. 26
V. Project Plan ........................................................................................................... 26
Project Gantt Chart .................................................................................................. 26
VI. Discussion and Future Improvement ................................................................ 28
1. Improvement of Compatibility ............................................................................ 28
2. Integration of Current System and the GUI ........................................................ 28
3. Potential Functionalities for Future Implementation .......................................... 29
3.1 More Functions on Single Hypothesis Analysis .......................................... 29
3.2 Graphic View of Statistics ............................................................................ 29
3.3 Ability to Identify Relationships .................................................................. 30
3.4 Guidance for Operations............................................................................... 31
VII. Conclusion .......................................................................................................... 31
1. Project Summary ................................................................................................. 31
2. Personal Reflection ............................................................................................. 32
References .................................................................................................................... iv
Appendix ....................................................................................................................... v

I. INTRODUCTION
3
I. Introduction
Hypothesis testing is a well-established methodology for scientific discovery.
Usually, hypotheses are formulated to investigate the relationship between several
attributes. Through a test of statistical significance on a difference, we could
determine whether the relationship occurs by chance or not, and thus reject or accept
the hypothesis as a result.
A hypothesis generating system ([4] Liu et al. 2011) has already been built to
generate statistically significant hypotheses from an input data set. However, a large
amount of hypotheses can be generated if the dataset has many attributes and
instances. There can be thousands of hypotheses to be tested and hundreds of them
being significant. The list of hypotheses generated by the current system is often
tedious and cannot provide intuitive implications for the users to utilize. It is usually
difficult for the users to browse a long list of hypotheses and find interesting ones.
The task of this project is to design and implement a graphic user interface (GUI) on
top of the current system to display hypotheses in a more understandable and user-
friendly way. We have designed several functionalities that can be performed by the
GUI to support efficient hypothesis browse and analysis. With the GUI, users can
locate hypotheses that are interesting to them quickly, and do further analysis of
interesting hypotheses conveniently.
In this report, the full process we have gone through to develop the GUI is
documented, including motivations behind the project, user requirement study, system
design and implementation, and project timeline plan. To facilitate explanation, a
sample dataset “mushroom” will be used as examples to elaborate certain terms.
Please refer to the appendix for a detailed description about the sample dataset. To
fully understand the system, it requires some relative knowledge about hypothesis
testing and association rules, which are also described briefly in the report. In
addition, we will also showcase the functionalities and bring you through the flow of
the system during hypothesis analysis by performing it on the sample dataset. At the
end of the report, further discussions and recommendations will be given on
improving the capabilities of the GUI to facilitate hypothesis testing and analysis.

II. PROJECT BACKGROUND
4
II. Project Background
In this part of the report, we are going to explore the current development of a
hypothesis generating and testing system, explain the existing problems we are facing
and propose possible solutions to these problems.
1. Motivation
1.1 Current situation
Hypothesis testing is a well-established methodology for scientific discovery.
Usually, hypotheses are formulated to investigate the relationship between several
attributes. Through a test of statistical significance on a difference, we could
determine whether the relationship occurs by change or not, and thus reject or accept
the hypotheses as a result. Hypothesis testing is widely adopted in all kinds of fields
such as medical care, corporate business and engineering. For example, it can be used
to test whether a new drug is effective or ineffective by formulating a hypothesis on
the responses from people who take the drug and those who do not and testing the
statistical significance on the difference. Other applications can be testing whether
product A is more popular than product B in a particular store, how men differ from
women in term of psychological trait, etc.
Conventional hypothesis testing requires a researcher to first formulate a
hypothesis based on his/her experiences and knowledge, and then conduct a variety of
experiments to test it. However, when the dataset collected grows into a large scale, it
becomes almost impossible for a researcher to manually inspect the dataset to find all
the interesting hypotheses for testing. In contrast to such a traditional hypothesis-
driven manner, a hypothesis generating system ([4] Liu et al. 2011) has been
developed for automatic hypothesis testing in a data-driven manner, transforming data
into knowledge through data mining. Adopt the concept of association, The system
uses the technique of frequent patterns mining ([5] Han and Kamber, 2001) to
generate the association rules, and thus form hypotheses for analysis. The hypotheses
generated in this way are actually comparisons between association rules.
Through these techniques, hypotheses can be generated and tested automatically
in the system on the attributes and their corresponding values in a given dataset. The
statistics for each hypothesis are calculated automatically and displayed, such as p-
value that is used to determine the level of significance of the difference. Then the

II. PROJECT BACKGROUND
5
users can look for significant hypotheses to their interests, and make further analysis
on them. More detailed description on the current system and hypotheses generated
by it will be given in the latter part of the report.
1.2 Problems
However, the current data-driven system generates a large amount of
hypotheses if the dataset has many attributes and instances. Normally there are
hundreds to thousands of them depending on the scale of the dataset as well as the
input parameter settings to the system. For the sample dataset “mushroom” which
contains 23 attributes, with certain parameter settings (please refer to the appendix),
there are 2289 hypothesis tests performed and 803 significant hypotheses generated.
The list of hypotheses generated is often tedious and cannot provide intuitive
implications for the users to utilize. Since the users are shown tremendous statistics
and need to manually search through the list, it is usually complicated and difficult for
the users to do further analysis on the hypotheses to obtain more significant results to
their interests.
In many cases, it is insufficient to just know whether a single hypothesis is
statistically significant; users are also interested in finding out more intrinsic
characteristics about the hypothesis and identifying factors that contribute to the
difference. Another reason for the need of deeper analysis on a hypothesis is that
some of the significant hypotheses generated by the current system may be
misleading due to confounding factors. Comparison and further analysis of different
hypotheses may also be involved; however, since the number of significant
hypotheses generated is usually large, comparison between all of them is
computational challenging.
Besides presenting the results in a user-friendly way, our system can also help
reduce some of the cost for generating hypotheses. After the hypotheses are
generated, if users need to adjust some of the parameters, they have to reset the input
parameters and re-run the current system to generate hypotheses again. It becomes
troublesome if the user want to change only one parameter at one time to test the
difference, since the system will regenerate the list again and again. In cases where
the newly generated list is a subset of the original list, the system does not need to
regenerate a list if we could just eliminate those hypotheses that do not fulfill the new
parameter settings anymore.
II. PROJECT BACKGROUND
6
Lastly, to facilitate better understanding of the hypotheses, users may hope to
view the list of hypotheses in certain order based on some criteria, which cannot be
realized in the output of current system.
2. Project Scope & Objectives
To address above problems, It is desirable to develop a user-friendly interface to
help the users: 1) browse and query the hypotheses; 2) quickly locate hypotheses that
are interesting to them; and 3) do a focused analysis on the hypotheses that are
interesting to them.
In this project, we are going to design and implement such a graphic user
interface (GUI) on top of the current system to display the results of the hypotheses in
a more understandable and user-friendly way. The GUI will visualize the significant
hypotheses and further information for analysis generated from a dataset by the
current system, and also provide several functions, basically filtering and sorting, to
manage the information of large scale.
The objective of this project is to make the displaying of significant hypotheses
more intuitive and flexible to cater specific user needs, and thus to facilitate better
understanding and analysis on individual hypothesis as well as the relationship
between them. The GUI will enable the users to search for and locate those
hypotheses to their interests more easily and compare between them in a more
understandable manner.
With the GUI in addition to the current system, we hope to make hypothesis
analysis more convenient for the users, and thus add more value to the current system
proposed for hypothesis testing in a data-driven manner.
III. System Overview
In this part of the report, we will look further into the system that is developed
to generate and test hypotheses, and thus have an overview on how the proposed GUI
could complement the current system.
To facilitate explanation, a sample dataset “mushroom” will be used as
examples to elaborate certain terms. Some relative knowledge about hypothesis
testing and association rules is also explained briefly in this part.
III. SYSTEM OVERVIEW
7
1. Overall System Description
Due to the complexity of interpretation of comparison between more than two
sub-populations, the hypothesis defined in the project is a comparison between two
sub-populations. Given a dataset and some parameters, the current system will first
find out large sub-populations that fulfill the parameter settings, generate tentative
hypotheses on each pair of two sub-populations and perform statistical test on them.
For each statistically significant hypothesis, the system will provide further
information for its analysis showing how some factors may influence the result of the
hypothesis. The output of the current system is basically a list of significant
hypotheses and their respective information for further analysis.
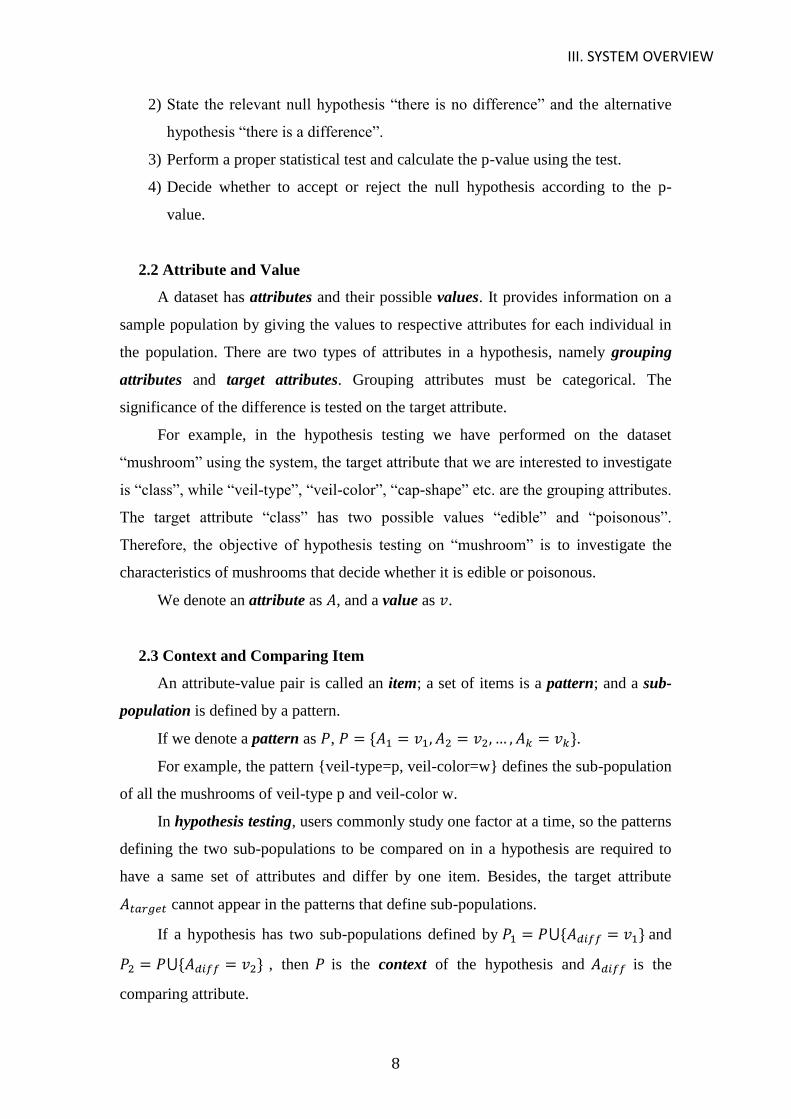
Taking in the output of the current system as its input, the GUI will provide
functions to manage the large amount of lists, enabling the users to handle the
hypotheses and perform analysis easily.
The following diagram shows the workflow of the overall system:
2. Important Definitions & Notations
To fully understand the system, some knowledge on hypothesis testing is
required. In this part, we will briefly go through some important definitions and
process in hypothesis testing.
2.1 Hypothesis Formulation and Testing Process
Hypothesis testing is a test of significance on a difference. A difference is
statistically significant if it is unlikely to have occurred by chance. The steps to
formulate and test a hypothesis are:
1) Define two sub-populations to be compared on.
III. SYSTEM OVERVIEW
8
2) State the relevant null hypothesis “there is no difference” and the alternative
hypothesis “there is a difference”.
3) Perform a proper statistical test and calculate the p-value using the test.
4) Decide whether to accept or reject the null hypothesis according to the p-
value.
2.2 Attribute and Value
A dataset has attributes and their possible values. It provides information on a
sample population by giving the values to respective attributes for each individual in
the population. There are two types of attributes in a hypothesis, namely grouping
attributes and target attributes. Grouping attributes must be categorical. The
significance of the difference is tested on the target attribute.
For example, in the hypothesis testing we have performed on the dataset
“mushroom” using the system, the target attribute that we are interested to investigate
is “class”, while “veil-type”, “veil-color”, “cap-shape” etc. are the grouping attributes.
The target attribute “class” has two possible values “edible” and “poisonous”.
Therefore, the objective of hypothesis testing on “mushroom” is to investigate the
characteristics of mushrooms that decide whether it is edible or poisonous.
We denote an attribute as , and a value as .
2.3 Context and Comparing Item
An attribute-value pair is called an item; a set of items is a pattern; and a sub-
population is defined by a pattern.
If we denote a pattern as , .
For example, the pattern {veil-type=p, veil-color=w} defines the sub-population
of all the mushrooms of veil-type p and veil-color w.
In hypothesis testing, users commonly study one factor at a time, so the patterns
defining the two sub-populations to be compared on in a hypothesis are required to
have a same set of attributes and differ by one item. Besides, the target attribute
cannot appear in the patterns that define sub-populations.
If a hypothesis has two sub-populations defined by and
, then is the context of the hypothesis and is the
comparing attribute.
III. SYSTEM OVERVIEW
9
2.4 Support and Proportion
The support of a pattern is defined as the number of records in the dataset that
have attribute-value pairs containing , denoted as . When the sizes of sub-
populations are too small, statistical tests are not powerful enough to detect the
difference, so that the hypothesis testing becomes futile. Therefore, we will set a
minimum support constraint in the system to eliminate meaningless
hypotheses testing.
The proportion in the system represents the proportion of the target value
under a given pattern , namely
.
2.5 Tentative Hypothesis
Given a context , a comparing attribute , and ,
, the tentative hypothesis on the two sub-populations defined
by and is represented as .
If we denote
, , the null hypothesis is
and the alternative hypothesis is . After statistic testing, a tentative
hypothesis becomes a significant hypothesis if its null hypothesis is rejected due to
small p-value.
Involving the concept of association rules, can be regarded as the
comparison between the association rule and
.
For example, based on the definition, the hypothesis “among all the mushrooms
of veil-type p, those that have odor n is more likely to be poisonous than those of odor
f” can be represented as .
2.6 P-value
A p-value is calculated for each hypothesis H to decide its significance. It is the
probability that the null hypothesis is true but we wrongly reject it. The larger the p-
value is, the more likely that the observed difference occurs by random chance, and
thus the less statistically significant the null hypothesis is. We will reject the null
hypothesis, namely accepting the difference to be significant, if the p-value is small

III. SYSTEM OVERVIEW
10
enough or smaller than a threshold . This p-value threshold,
conventionally of 0.05, indicates the level of statistical significance of the tested
hypothesis.
Since false positives may be generated due to large numbers of testing, the
method of Bonferroni correction ([1] Abdi, 2007) and Benjamini and Hochberg’s
method ([2] Benjamini and Hochberg, 1995) are adopted to control the number of
false positives. Details about the two methods will not be given in this report.
2.7 Difference Lift and Contribution
In many cases, we are not only interested in knowing whether a single
hypothesis is significant or not, we are more interested in discovering the reasons
behind the significance. Difference lift and contribution of items and attributes are
ways to further analyze the impact of each item or attribute on the hypothesis.
Given , , and a hypothesis on the
two sub-populations , if we add to the context
a new item which is not contained in , we get two new sub-populations
and
.
The lift of difference after adding item to is defined as
, where denotes proportion of in and
denotes proportion
of in , . The difference lift of an attribute to , denoted as
, is defined as the average of the absolute difference lift of its attribute
values..
If denotes the number of total records of sub-population , and denotes
the number of total records of sub-population , then the contribution of the new
item to is defined as
. The
contribution of an attribute to , denoted as , is defined as the
average of the absolute contribution of its attribute values.
Details on the rationale how the difference lifts and contributions are interpreted
for hypothesis analysis will not be given in this report.
III. SYSTEM OVERVIEW
11
2.8 Simpson’s Paradox
Given a hypothesis and an attribute not in , if for every value of ,
, then a Simpson’s Paradox appears. ([3] Julious and
Mullee, 1994)
3. Description of Current System
The current system performs hypothesis testing automatically on a given
dataset, eliminating a lot of manual work during hypothesis formulation and testing. It
generates sub-populations using frequent pattern mining techniques, and performs
testing using statistical tools and formulae.
3.1 Input
The current system takes in a dataset in the form of a date file, which contains
the instances and their attribute values. Each row is an instance and each column is an
attribute. It also requires the users to set the following parameters based on their
specifications and domain knowledge:
a. a minimum support threshold ;
b. a maximum p-value threshold ;
c. a minimum proportion difference threshold ;
d. a target attribute and a target value if is categorical;
e. a set of grouping attributes , which if not specified, all the
categorical attributes in the given dataset will be taken.
3.2 Output
3.2.1 Information of significant hypotheses
After the dataset and the parameters are inputted, the system will then perform
hypothesis testing on all possible tentative hypotheses and generate a list of all the
significant hypotheses that satisfies the
following conditions:
a. item in , , and ;
b. , , where ,
;
c. ;
d. ;
III. SYSTEM OVERVIEW
12
The context, support, proportion, comparing items and p-value of each
significant hypothesis will be given as output.
3.2.2 Further Information of each hypothesis
For each significant hypothesis , the following information will also be
generated for further analysis:
a. The set of Simpson’s Paradoxes associated with ;
b. The list of items not in with their difference lifts and contributions to ;
c. The list of attributes not in with their difference lifts and contributions to
.
4. Graphic User Interface
In the end of the project, a GUI is to be implemented on top of the current
system, taking the outputs of the current system as inputs, so that the information
produced by the current system can be presented by the proposed GUI to the users in
a more user-friendly and understandable way. The GUI should visualize the
hypotheses generated and information of each hypothesis for further analysis, and
also provide functions for users to query on that information. It is a tool for the users
better manage the hypotheses and hence assist them towards the findings they are
interested.
IV. System Design and Implementation
In this part of the report, we have documented the process we have gone
through to develop the GUI, including user requirement study, system functionality
design and component implementation. Besides, technical specifications in
programming are also documented. In addition, we will also showcase the
functionalities and bring you through the workflow of the system for hypothesis
analysis.
IV. SYSTEM DESIGN AND IMPLEMENTATION
13
1. User Requirements Study
After investigating the possible needs of the users of such a hypothesis
generating system, we have identified the following user requirements. The reasons
why the users may have these needs are also described briefly.
1.1 Comparing attributes/items related hypothesis comparison
a. Different items:
Display all the hypotheses that are under the same context and
comparing attribute , but with different comparing values.
Motivation:
To investigate the relationship between the comparing attribute and
the target attribute , the users may not only be interested in comparing
two values of , but also other values that are significant to determine
under the same context.
b. Different attributes:
Display all the hypotheses that are under the same context but a
different comparing attribute
Motivation:
Given the same context, the users may want to know whether some other
attributes may lead to significant hypotheses.
1.2 Context related hypothesis comparison
a. Context with more items
Given a significant hypothesis with a context , display all the hypotheses
that have the context formed by adding more items to .
Motivation:
The users may want to investigate how each specific change of items to the
context may affect the significance of a hypothesis.
b. Context with fewer items

IV. SYSTEM DESIGN AND IMPLEMENTATION
14
Given a significant hypothesis with a context , display all the hypotheses
that have the context formed by reducing items from .
Motivation:
The users may want to investigate how each of the items in the context may
affect the significance of a hypothesis.
c. Exclude uninteresting items
Hide all the hypotheses that have the context with specific items.
Motivation:
The users may not be interested in investigating the hypotheses related to
certain items, so those hypotheses are irrelevant to the users.
1.3 Filtering
a. Display significant hypotheses that share the same context P which is
selected/defined by the user
b. Display significant hypotheses that compare the same attribute Adiff which is
selected/defined by the user
c. Display significant hypotheses that compare the same attribute Adiff and the
same pair of values v1, v2 which are selected/defined by the user
d. Allow users to filter uninterested hypotheses by defining max P-value, min
support value, etc.
Motivation:
The users may be only interested in specific hypotheses, so that they would
like to locate them quickly and filter out irrelevant information for a better view.
1.4. Sorting
Allow users to rank the significant hypotheses generated based on different
metrics, such as p-value, support, proportion etc.
Motivation:
With a sorted list based on a selected criterion, the can have a better overview
on the list of hypotheses and locate important information.

IV. SYSTEM DESIGN AND IMPLEMENTATION
15
1.5 Further analysis on each hypothesis
When users choose a hypothesis H=P, Adiff =v1| v2, Atarget, vtarget for further
analysis, they should be able to:
a. Compare with other values of the comparing attribute
b. Identify Simpson’s paradoxes
c. Rank items/attributes in descending order of their Contribution and
Difference Lift.
Motivation:
In many cases, it is not enough for the users to only know the significant
hypotheses; they are more interested in finding out the behind factors affecting
the significance, such as how each of the items or attributes contributes to the
difference and whether there exist confounding factors.
2. GUI Functionality Design
Based on the user requirement study, we have identified several functions for
the GUI to implement to cater the user needs. And there are three functional
components to be implemented to accommodate the designed functions in the GUI: a
data importer, a hypothesis browser and a further analysis browser. In this part of the
report, we are going to explain each component of the GUI as well as the functions it
provided in details.
2.1 Data Importer
Currently, since the GUI has not been integrated with the hypothesis generating
system, it will construct its own database for function implementation. The data
importer, which is an internal component, takes in the output text files and transforms
them into a database for easier utilization in operational functions. There are five sorts
of output files used for GUI implementation: one xxx.attrvalue2item.txt file and one
xxx.hypotheses.txt file for each dataset inputted; a number of sets of Hi.attr-wise.txt,
Hi.contr-item.txt, Hi.contr-attr.txt and Hi.paradox.txt file for each significant
hypothesis, where “xxx” is the name of the input dataset and is the ID of each
hypothesis,

IV. SYSTEM DESIGN AND IMPLEMENTATION
16
These files should be contained in a file folder as the input to the GUI. Each
time the GUI is launched, a window will pop-up asking the input, and the users
should locate the file folder so that the GUI will work properly.
2.2 Hypothesis Browser
This is the first panel shown to the users when the GUI is launched, after which
a window will pop up asking the users to locate the file folders for the data importer
to source for required input files. In this functional component, users are able to
visualize the list of significant hypotheses generated by the system, and subsequently
perform functions on the whole list of significant hypotheses generated.
2.2.1 Database Construction
The files attrvalue2item.txt and hypotheses.txt are taken into the data importer,
generating a database hypotheses.db for further query. When the input folder is
correctly located, the GUI will automatically look for the two files first and generate
hypotheses.db. All the databases generated by the data importer will be placed in the
same folder where input files are located.
In attrvalue2item.txt, each row contains an attribute-value pair, which is of the
form “attribute name=value”. The attribute-value pair on the i-th row is mapped to
item i-1. For example, the attribute-value pair on the first row is mapped to item 0, so
that this item is represented as 0 in subsequent files.
In hypotheses.txt, each row represents a significant hypothesis
, giving the information on:
- Context
- Support of
- Proportion of in the subpopulation defined by
- Comparing items
- Support of , and
- Proportion of in the subpopulation defined by
, and
- P-value

IV. SYSTEM DESIGN AND IMPLEMENTATION
17
2.2.2 Visualization
In the GUI, each row represents a hypothesis, which will be displayed as the
following:
ID Context sup Proportion Comparing
items sup Proportion p-value
1
item1
...
itemL
s p
v1 s1 p1
p-value
v2 s2 p2
where
- item1 ... itemL are numbers representing each item, together forming the
context of the hypothesis
- s is the support of the context
- p is the proportion of the target attribute value in the sub-population defined
by the context
- v1, v2 are the comparing items
- s1, s2 are the support of pattern {item1 ... itemL, vi}, i=1, 2
- p1, p2 are the proportion of the target attribute value in the sub-population
defined by {item1 ... itemL, vi}, i=1, 2
- p-value is the p-value of the hypothesis based on the test score.
For example, the hypotheses generated from dataset “mushroom” are displayed
as the following:
ID Context sup Proportion Comparing
item sup Proportion p-value
1 veil-type=p 8124 0.482029
odor=n 3528 0.034014 1.1778E-
243 odor=f 2160 1.000000
2
veil-type=p,
veil-color=w,
gill-
attachment=f
7906 0.492031
odor=n 3328 0.033654
8.0508E-
267 odor=f 2160 1.000000
3 veil-type=p,
veil-color=w 7924 0.493185
gill-size=b 5612 0.033654 0.0000E+
000 gill-size=n 2512 1.000000

IV. SYSTEM DESIGN AND IMPLEMENTATION
18
4 … … … … … … …
2.2.3 Query
Several functions can be performed on the list of significant hypotheses
displayed in the GUI. This is to help the users quickly locate relevant hypotheses to
their interests or conveniently compare between hypotheses.
a. Display all
All the significant hypotheses generated will be displayed in a table format if
no further operations.
b. Filtering of hypotheses
The users can enter several parameters in the GUI, and only hypotheses that
satisfy the user-defined parameter settings will be displayed. The filtering function
can be based on:
i. Context
If a set of items (attribute-value pair) is specified, the user can choose to
- Display hypotheses which have the exact context as
i.e. for a hypothesis has context , display H if
- Display hypotheses which have the context that are subset of
i.e. display if
- Display hypotheses which have the context that contains
i.e. display if
- Display hypotheses which have the context that doesn’t contain any
attribute values of
i.e. display if =
ii. Support
If a minimum support ( ) is specified, display those hypotheses
which have a larger support than
iii. Based on proportion
If a minimum proportion ( ) is specified, display those
hypotheses which have a larger proportion than
iv. Based on comparing items

IV. SYSTEM DESIGN AND IMPLEMENTATION
19
If an attribute and several of its possible values are
specified, display hypotheses which have the comparing items of all
possible pair of
i.e. for a hypothesis , display if it has comparing items and
, where
v. Based on p-value
If a maximum p-value ( ) is specified, display hypotheses
which have a smaller p-value than
c. Sorting
The users can choose to display any resultant list of hypotheses in
descending or ascending order according to the context, support, proportion and p-
value of hypotheses.
i. For support, proportion and p-value which are numerical values, sorting
based on the magnitude of the value
ii. For context, sorting based on the number of items in the context
d. Summarization
The GUI provides a brief summary on the resultant list of hypotheses after
the filtering operation. The summary includes the total number of hypotheses, the
maximum support and the minimum support of the resultant list.
2.3 Further Analysis Browser
In this functional component, the users are able to look deep into an individual
hypothesis for further information such as the difference lifts and contributions of
other items or attributes, and Simpson’s Paradox if any. When the users choose a
certain hypothesis to look into for further analysis, the GUI will pop up another
window where four tables containing different information can be chosen to display.
2.3.1 Database Construction
The set of attr-wise.txt, contr-item.txt, contr-attr.txt and paradox.txt are taken
into the data importer, generating four database AttrWise.db, ContrItem.db,
ContrAttr.db and Paradox.db, where is the ID of each hypothesis, .
When users choose to further analyze an individual hypothesis requiring more
IV. SYSTEM DESIGN AND IMPLEMENTATION
20
information about it, the data importer will search the input folder for respective set of
files according to the ID of the selected hypothesis.
The file attr-wise.txt gives information of all other hypotheses generated based
on the same context and comparing attribute, but different values of comparing items.
The files contr-item.txt and contr-attr.txt contains difference lifts and contributions of
items and attributes respectively. And paradox.txt points out the attributes that form
Simpson’s Paradox, which may be empty.
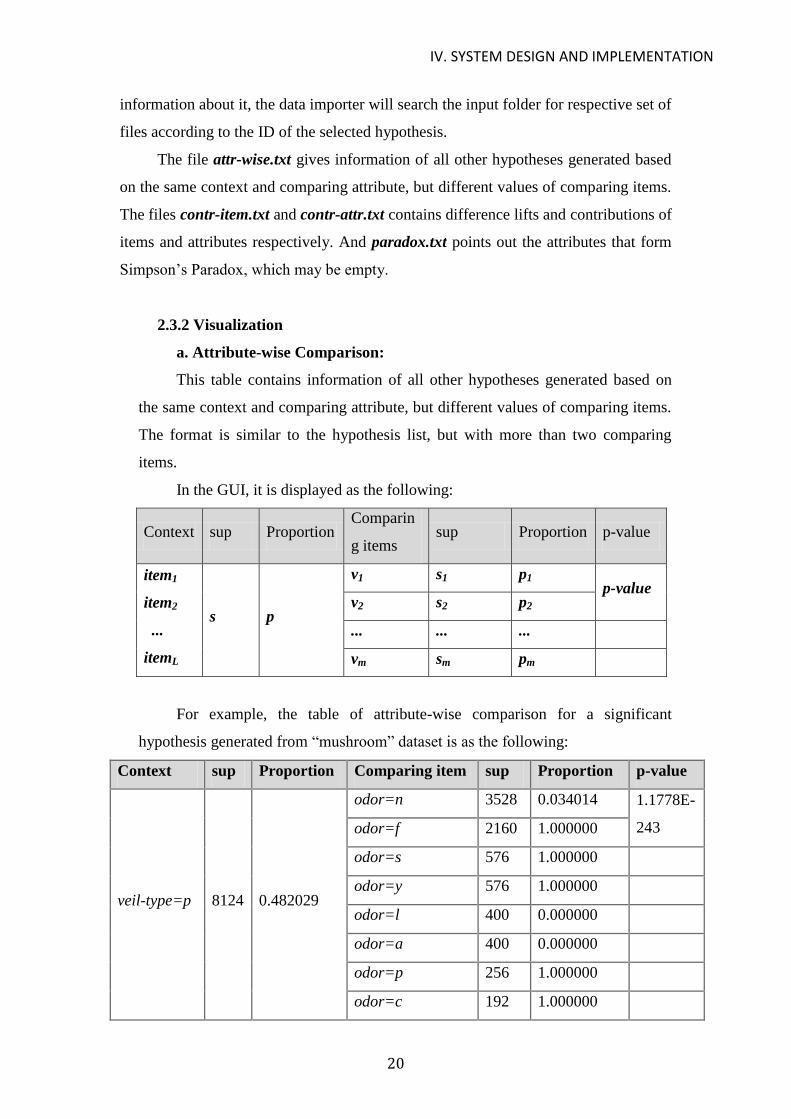
2.3.2 Visualization
a. Attribute-wise Comparison:
This table contains information of all other hypotheses generated based on
the same context and comparing attribute, but different values of comparing items.
The format is similar to the hypothesis list, but with more than two comparing
items.
In the GUI, it is displayed as the following:
Context sup Proportion Comparin
g items sup Proportion p-value
item1
item2
...
itemL
s p
v1 s1 p1 p-value
v2 s2 p2
... ... ...
vm sm pm
For example, the table of attribute-wise comparison for a significant
hypothesis generated from “mushroom” dataset is as the following:
Context sup Proportion Comparing item sup Proportion p-value
veil-type=p 8124 0.482029
odor=n 3528 0.034014 1.1778E-
243 odor=f 2160 1.000000
odor=s 576 1.000000
odor=y 576 1.000000
odor=l 400 0.000000
odor=a 400 0.000000
odor=p 256 1.000000
odor=c 192 1.000000
IV. SYSTEM DESIGN AND IMPLEMENTATION
21
odor=m 36 1.000000
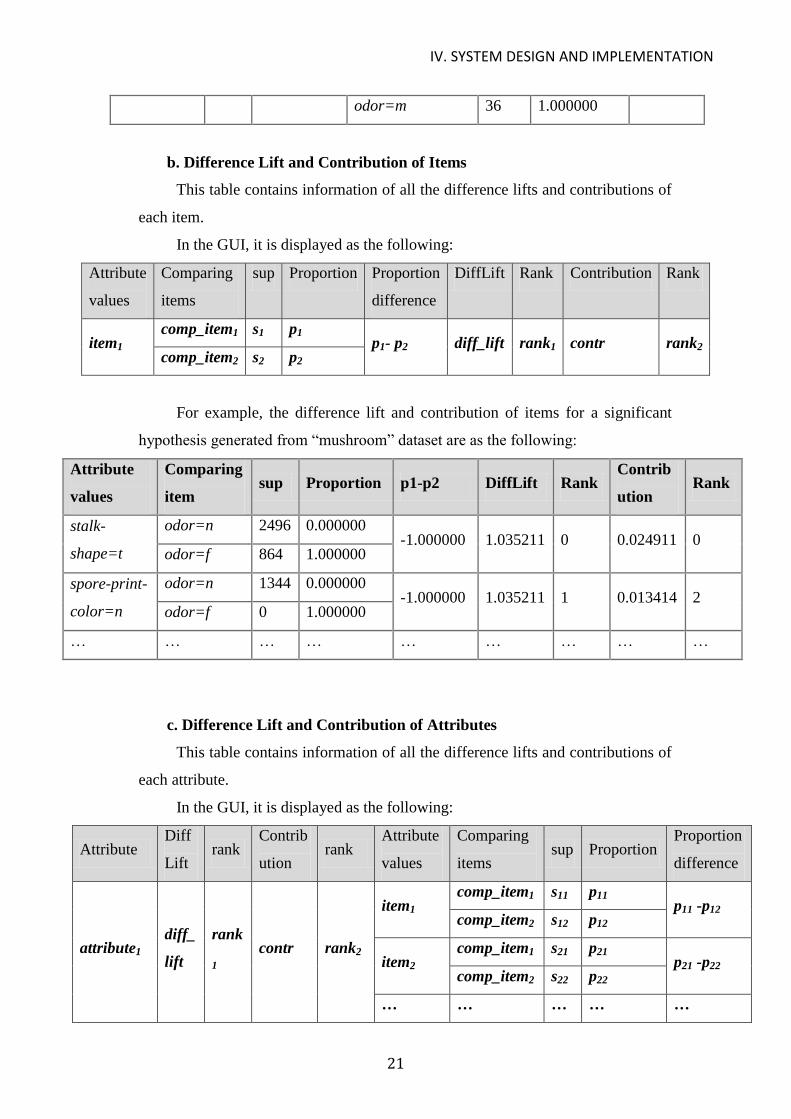
b. Difference Lift and Contribution of Items
This table contains information of all the difference lifts and contributions of
each item.
In the GUI, it is displayed as the following:
Attribute
values
Comparing
items
sup Proportion Proportion
difference
DiffLift Rank Contribution Rank
item1 comp_item1 s1 p1
p1- p2 diff_lift rank1 contr rank2 comp_item2 s2 p2
For example, the difference lift and contribution of items for a significant
hypothesis generated from “mushroom” dataset are as the following:
Attribute
values
Comparing
item sup Proportion p1-p2 DiffLift Rank
Contrib
ution Rank
stalk-
shape=t
odor=n 2496 0.000000 -1.000000 1.035211 0 0.024911 0
odor=f 864 1.000000
spore-print-
color=n
odor=n 1344 0.000000 -1.000000 1.035211 1 0.013414 2
odor=f 0 1.000000
… … … … … … … … …
c. Difference Lift and Contribution of Attributes
This table contains information of all the difference lifts and contributions of
each attribute.
In the GUI, it is displayed as the following:
Attribute Diff
Lift rank
Contrib
ution rank
Attribute
values
Comparing
items sup Proportion
Proportion
difference
attribute1 diff_
lift
rank
1 contr rank2
item1 comp_item1 s11 p11
p11 -p12 comp_item2 s12 p12
item2 comp_item1 s21 p21
p21 -p22 comp_item2 s22 p22
… … … … …

IV. SYSTEM DESIGN AND IMPLEMENTATION
22
… … …
itemm comp_item1 sm1 pm1
pm1 -pm2 comp_item2 sm2 pm2
For example, the difference lifts and contributions of attributes for a
significant hypothesis generated from “mushroom” dataset are as the following:
Attributes DiffLift rank Contribu
tion rank
Attribute
values
Comparing
item sup Proportion p1-p2
gill-
attachment 1.016592 0
0.0019
16 17
gill-
attachment
=f
odor=n 3336 0.035971
-0.964029 odor=f 2160 1.000000
gill-
attachment
=a
odor=n 192 0.000000
-1.000000 odor=f 0 1.000000
ring-type 1.008017 2 0.0006
39 19
ring-
type=p
odor=n 2432 0.032895 -0.967105
odor=f 288 1.000000
ring-
type=e
odor=n 1048 0.038168 -0.961832
odor=f 576 1.000000
ring-type=l odor=n 0 0.034014
-0.965986 odor=f 1296 1.000000
ring-type=f odor=n 48 0.000000
-1.000000 odor=f 0 1.000000
… … … … … … … … … …
d. Simpson’s Paradox
This table contains information of Simpson’s Paradoxes related to the
hypothesis if there is any.
In the GUI, it is displayed as the following:
Attribute Attribute
values
Comparing
items
sup Proportion Proportion
difference
attribute1 item1 comp_item1 s11 p11
p11 -p12 comp_item2 s12 p12

IV. SYSTEM DESIGN AND IMPLEMENTATION
23
item2 comp_item1 s21 p21
p21 -p22 comp_item2 s22 p22
… … … …
… … … …
itemm comp_item1 sm1 pm1
pm1 -pm2 comp_item2 sm2 pm2
For example, the hypothesis
generated from “mushroom”
dataset has Simpson’s Paradox with attribute , since for every value of
it, namely and , the difference lifts are all negative. Then the table for
Simpson’s Paradox is shown as:
Attributes Attribute
values
Comparing
item Support Proportion p1-p2 DiffLift
gill-size
gill-size=b ring-type=p 1372 0.026239
0.026239 -0.034110 ring-type=e 96 0.000000
gill-size=n ring-type=p 132 1.000000
0.026316 -0.034210 ring-type=e 912 0.973684
2.3.3 Query
The users can perform the following functions to the two tables of difference
lifts and contributions of items and attributes.
i. Filtering
The users can filter out irrelevant information based on the attributes they
specified. If an attribute is specified, display the difference lifts and
contributions of the items with attribute .
Several attributes can be chosen at the same time.
ii. Sorting
The users can choose to display any resultant list in descending or
ascending order according to proportion difference ( ), difference lift or
contribution of items.
IV. SYSTEM DESIGN AND IMPLEMENTATION
24
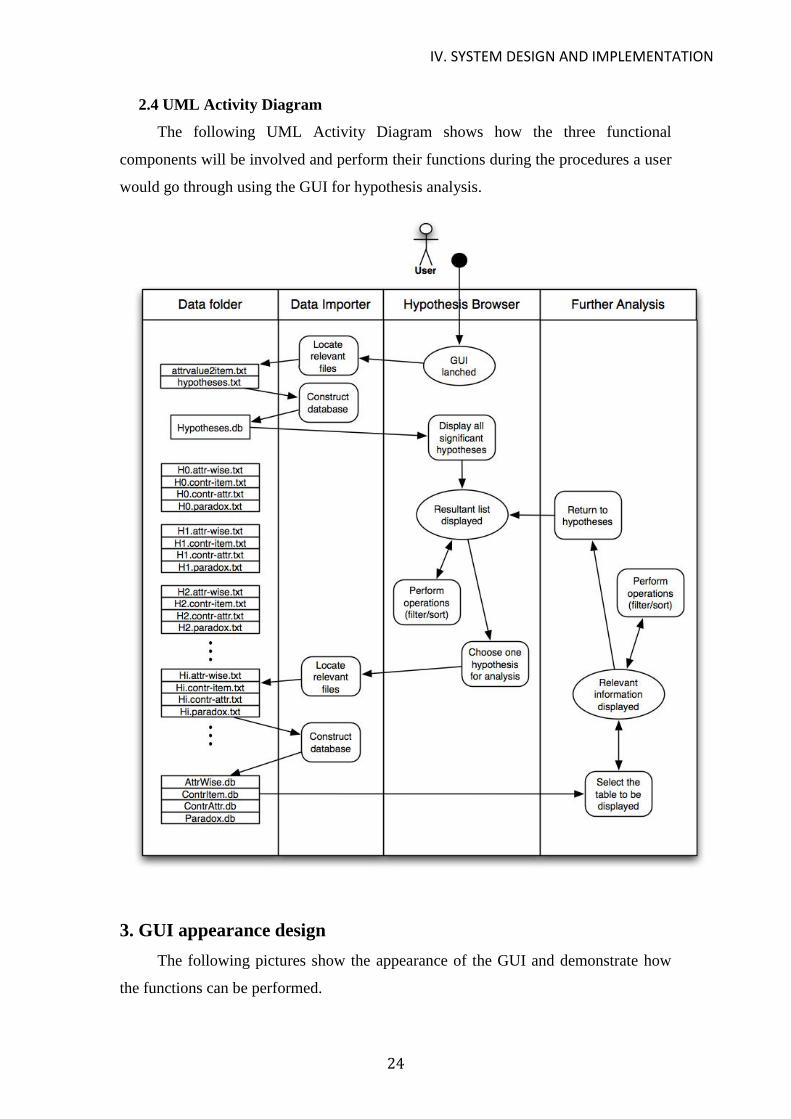
2.4 UML Activity Diagram
The following UML Activity Diagram shows how the three functional
components will be involved and perform their functions during the procedures a user
would go through using the GUI for hypothesis analysis.
3. GUI appearance design
The following pictures show the appearance of the GUI and demonstrate how
the functions can be performed.

IV. SYSTEM DESIGN AND IMPLEMENTATION
25
3.1 Window for Hypothesis Browser
3.2 Window for Further Analysis
4. Technical platforms & software tools
Platform Windows 7
Programming Language C++
IV. SYSTEM DESIGN AND IMPLEMENTATION
26
Integrated Development Environment Microsoft Visual Studio 2010
Database Engine SQLite
Widget Toolkit Qt GUI Framework
5. Declaration of open source codes and libraries
Complete Name with Version Source
C++ Standard Library -
Boost C++ Library v1.45.0 http://www.boost.org/doc/libs/
Qt Framework v4.7 http://doc.qt.nokia.com/4.7/
easySQLite http://www.sqlite.org/c3ref/
6. Testing
The developed GUI is tested on two datasets: “mushroom” and “adult”. With
specific parameter settings, the dataset “mushroom” has 803 significant hypotheses
generated and “adult” has 422. We randomly pick up hypotheses as well as their
further information for analysis and validate them with the original output text files
produced by the hypothesis generating system. The results are free of errors.
Though there are limitations on manual validation, to a certain extent the testing
result still can prove that the GUI can work properly and correctly on hypothesis
visualization and query.
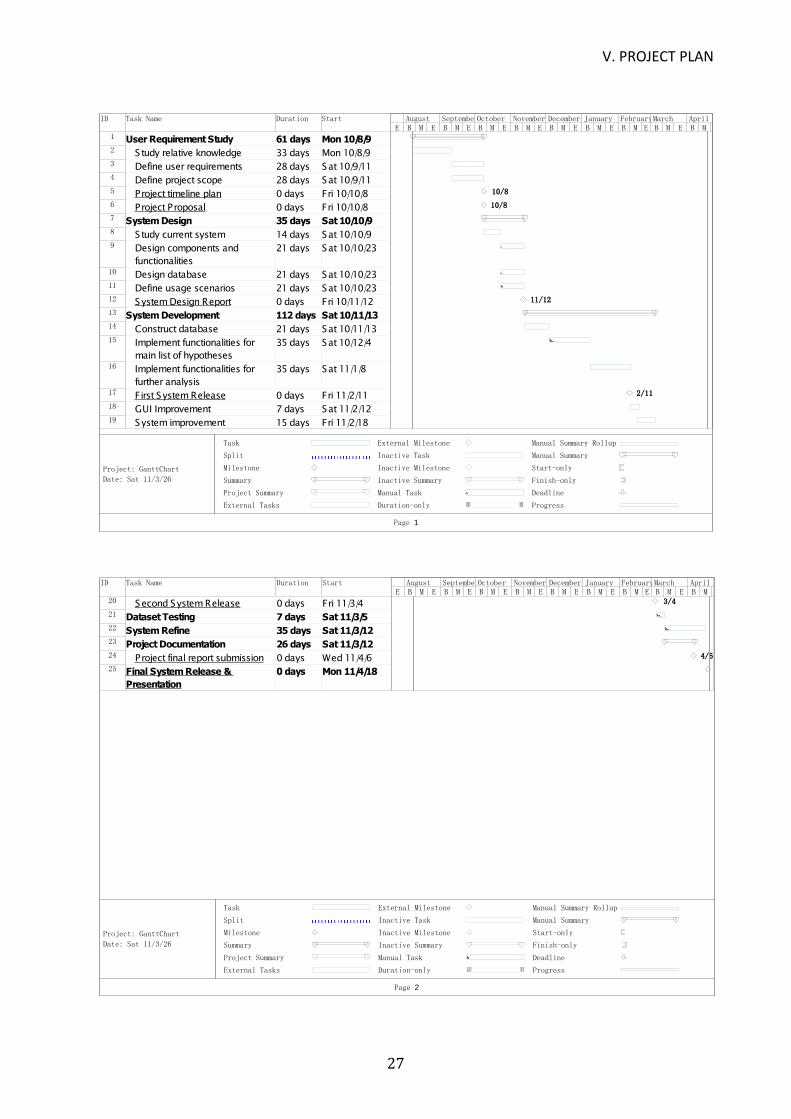
V. Project Plan
Project Gantt Chart
The following Gantt Chart shows how this project has been planned, as well as
the timeline of system development.
V. PROJECT PLAN
27
ID Task Name Duration Start
1 User Requirement Study 61 days Mon 10/8/92 Study relative knowledge 33 days Mon 10/8/93 Define user requirements 28 days Sat 10/9/114 Define project scope 28 days Sat 10/9/115 Project timeline plan 0 days Fri 10/10/86 Project Proposal 0 days Fri 10/10/87 System Design 35 days Sat 10/10/98 Study current system 14 days Sat 10/10/99 Design components and
functionalities
21 days Sat 10/10/23
10 Design database 21 days Sat 10/10/2311 Define usage scenarios 21 days Sat 10/10/2312 System Design Report 0 days Fri 10/11/1213 System Development 112 days Sat 10/11/1314 Construct database 21 days Sat 10/11/1315 Implement functionalities for
main list of hypotheses
35 days Sat 10/12/4
16 Implement functionalities for
further analysis
35 days Sat 11/1/8
17 First System Release 0 days Fri 11/2/1118 GUI Improvement 7 days Sat 11/2/1219 System improvement 15 days Fri 11/2/18
10/8
10/8
11/12
2/11
E B M E B M E B M E B M E B M E B M E B M E B M E B M EJuly August SeptemberOctober November December January FebruaryMarch April
Task
Split
Milestone
Summary
Project Summary
External Tasks
External Milestone
Inactive Task
Inactive Milestone
Inactive Summary
Manual Task
Duration-only
Manual Summary Rollup
Manual Summary
Start-only
Finish-only
Deadline
Progress
Page 1
Project: GanttChart
Date: Sat 11/3/26
ID Task Name Duration Start
20 Second System Release 0 days Fri 11/3/421 Dataset Testing 7 days Sat 11/3/522 System Refine 35 days Sat 11/3/1223 Project Documentation 26 days Sat 11/3/1224 Project final report submission 0 days Wed 11/4/625 Final System Release &
Presentation
0 days Mon 11/4/18
3/4
4/6
4/18
E B M E B M E B M E B M E B M E B M E B M E B M E B M EJuly August SeptemberOctober November December January FebruaryMarch April
Task
Split
Milestone
Summary
Project Summary
External Tasks
External Milestone
Inactive Task
Inactive Milestone
Inactive Summary
Manual Task
Duration-only
Manual Summary Rollup
Manual Summary
Start-only
Finish-only
Deadline
Progress
Page 2
Project: GanttChart
Date: Sat 11/3/26
VI. DISCUSSION AND FUTURE IMPROVEMENT
28
VI. Discussion and Future Improvement
Due to time constraint, the functions implemented in the GUI for the hypothesis
generating system are quite limited. In this part of the repot, we will discuss some of
the possible recommendations for future improvement of the system.
1. Improvement of Compatibility
Currently, the GUI is designed and implemented to handle the hypotheses
generated for a categorical target attribute with specified target value. However, the
hypothesis generating system actually can be used to generate and test hypotheses on
a dataset with continuous target attribute; and it is optional whether to specify a target
value. The system generates the output files in different formats to cater different
input situations.
Since it involves more definitions and interpretations when dealing with
continuous target attribute or absence of target values, it would be more complicated
to design and implement the GUI for analysis. Basically the data importer should be
capable to handle more kinds of files in different formats.
Moreover, the current GUI can only handle the output hypotheses from one
dataset at one time. In the future development, we may hope to have a multi-tasked
GUI that is capable to handle several sets of output hypotheses from different
datasets.
2. Integration of Current System and the GUI
Currently, the GUI works as a stand-alone system that requires input files
produced from the hypothesis generating system. Future integration of the two is
needed to consummate the whole system for hypothesis analysis. Otherwise,
operating two systems will be troublesome and tend to have mistakes during complex
processes.
Since the GUI is separated from the hypothesis generating system, it can only
capture the information in the output text files; and thus the input parameter setting
used to generate significant hypotheses, such as the target attribute-value pair and the
p-value threshold, cannot be shown in the GUI. The users need to remember theses

VI. DISCUSSION AND FUTURE IMPROVEMENT
29
parameter settings or refer back to the hypothesis generating system to get the
information, which is troublesome.
Besides, the GUI currently takes in text files and constructs its own database,
which occupies much more memory spaces to store the information. Many of these
memory spaces can be freed up if the GUI is integrated and displays results
immediately after the computation of the hypothesis generating system.
Integration becomes more important for the functionality on further analysis of
hypotheses. The hypothesis generating system will generate a set of four files for
every significant hypothesis, each containing large amount of information; and thus
there are hundreds to thousands sets of files generated. Currently the GUI takes in
each file to construct a database for the filtering and sorting functions to be performed
on each table. However, many of the files related to uninteresting hypotheses are not
needed. With the GUI integrated, when users want to further analyze a hypothesis, the
GUI will go back to the system and ask it to generate the set of statistics for that
hypothesis only. This will largely reduce redundant operations of producing
information and constructing databases since unwanted information will not be
generated.
3. Potential Functionalities for Future Implementation
The current GUI implemented can only provide basic filtering and sorting
operations on tables. Beside the need to improve it into a more sophisticated system
on the current functions, we would aim to build a more intelligent and comprehensive
system for hypothesis analysis. We hereby propose some ideas on possible
functionalities that the GUI may incorporate in the future.
3.1 More Functions on Single Hypothesis Analysis
If the users choose a significant hypothesis to further analyze, the GUI currently
provides further information of attribute-wise comparison, difference lifts and
contributions and Simpson’s Paradox. However, to further analyze a hypothesis, the
users may want to investigate how a specific change of items to the context may
affect the significance of hypothesis, which may involve the following operations:
a. Pull-down (move to more specific contexts)
VI. DISCUSSION AND FUTURE IMPROVEMENT
30
For every attribute that is not in , add each value of to
respectively. Display the statistics of the resultant hypotheses. Users can also
specify the attribute to be added.
b. Roll-up (move to more general contexts)
For every item x in P, remove x from P. Display the statistics of the
resultant hypotheses. Users can also specify the items to be removed.
c. Parallel (move to sibling contexts)
For an item x in P, replace x with another item x such that x and x are of
the same attribute. Display the resultant hypotheses.
Though comparing between hypotheses with these different contexts may be
implicitly achieved through the current filtering function, more direct functions of
these operations could be implemented to facilitate more convenient analysis.
3.2 Graphic View of Statistics
Apart from the table view of hypotheses and their related statistics, the GUI
could also provide a graphic view of that information, such as pie chart and bar chart.
The GUI would leave flexibility for the users to define the parameters to their
interests, such as x-axis to be defined as comparing items or attributes while y-axis to
be defined as support, proportion, difference lift or contribution. A graphic view may
be helpful when analyzing the factors behind a hypothesis, since it provides a more
intuitive picture of how the difference lifts and contributions fluctuate among
different items or attributes.
Dynamic graphics could also be implemented for better visualization. For
example, for a hypothesis with context , adding, removing or replacing any item
in may result in changes of the support, proportion and p-value. A dynamic graphic
would show the changes in an animated way while the users are performing these
operations on the context .
3.3 Ability to Identify Relationships
After the whole list of significant hypotheses is generated, the GUI could
identify possible relationships between hypotheses. For example, if hypothesis is
significant, hypothesis must also be significant. Then the GUI will either show the
important relationships, or eliminate redundant hypotheses.
VI. DISCUSSION AND FUTURE IMPROVEMENT
31
3.4 Guidance for Operations
It would be even better if the GUI could provide guidance on how to perform
the next operations on the hypotheses so that the users could obtain more meaningful
results. Some of the guidance could be:
a. Providing hints during parameters setting
For example, the GUI could give a reasonable range of minimum
support and maximum p-value, indicate the hypotheses that has Simpson’s
Paradox, etc.
b. Eliminating unuseful or irrelevant options.
For example, when the users adding an item to the context to filter the
hypotheses, if a newly added item would result in an empty list of
hypotheses, this item then would not be shown for the users to add into the
context specification.
c. Summarizing information.
Currently, the GUI provides a brief summary of the resultant list of
hypotheses after filtering operations. This is to help the users determine a
proper parameter settings if further filtering is needed. For example, if the
minimum support in the summary is 5000, the users would not choose to
filter the list setting as a value less than 5000, since the filtering
result will be the same as the previous list.
However, the current GUI only provides the number of hypotheses and
maximum and minimum support. It would be better if more summary
information could be given, such as a list of all the items involved in the
context etc.
These kinds of guidance would eliminate a lot of time used to guess and try out
possible parameter settings towards meaningful results desired by the users.
VII. Conclusion
1. Project Summary
Hypothesis testing is a well-established methodology for scientific discovery.
Instead of the traditional hypothesis-driven manner, a system in a data-driven manner
VII. CONCLUSION
32
has been developed to perform automatic hypothesis testing on a given dataset and
provide information on all the significant hypotheses. The hypothesis defined in the
system is a comparison between two or more sub-populations using frequent pattern
mining techniques. However, for a large data set collected from a sample pool, a huge
amount of hypotheses can be formulated and tested, resulting in a large amount of
statistical significant hypotheses generated from the system. This list is difficult for
users to perform hypothesis analysis.
In this project, we have designed and implemented a graphic user interface
(GUI) to present the results of the hypotheses in a more understandable and user-
friendly way. The GUI provides filtering and sorting functions on all the significant
hypotheses generated as well as on the information for further analysis of a specific
hypothesis. The users are shown only those hypotheses that satisfy the parameter
settings, such as context, comparing items, minimum support and maximum p-value.
Through the GUI, the results of the hypothesis generating system can be better
managed and utilized for hypothesis analysis.
However, due to time constraint of the project, the functionalities implemented
in the GUI are limited, we hope to further improve it into a more intelligent and
comprehensive system that could perform better functions in the future development.
2. Personal Reflection
This project is originally proposed for students majoring in Computer Science
(CS). It has a scientific nature and requires certain knowledge in both data mining and
programming in order to understand user needs and implement such a system. It was
really challenging for me to take it as my Final Year Project, since I am a student
majoring in Information Systems (IS), who may not possess enough knowledge or
experiences in system architecture design and development. Though I have been
facing difficulties and gone through a tough time, I really grew and learnt a lot, and
enjoyed working on this project with my supervisors, who take pains in helping me
with various problems.
Besides the improvement of my programming skills, the even greater takeaway
from this project for me is the experience on user requirement study which is more
relevant to my major. I have had a hands-on experience on how to analyze user needs,
transform them into system requirements and design components and functions to

VII. CONCLUSION
33
cater user needs. The experience in this project would be quite beneficial to me, since
I might have to study a lot of business requirements and provide IT solutions in my
future career. I also adopted and practiced the knowledge learnt in my IS major
courses, such as project management. This knowledge has helped me move towards
the completion of the project to a great extent.
I feel regretful that due to time constraint and limitation of my programming
capability, the final system is not sophisticated enough and many of the conceived
ideas are not implemented into real system. I would leave the arduous but meaningful
task of improving this system to those programming experts, and hope a fabulous
hypotheses generating and visualization system could be achieved in the near future,
and add great value to the field of hypothesis analysis.

REFERENCES
iv
References
[1] Abdi, H. (2007) “Bonferroni and Sidak corrections for multiple comparisons”.
N.J. Salkind (ed.). Encyclopedia of Measurement and Statistics. Thousand Oaks,
CA: Sage, 2007.
[2] Benjamini, Y. and Hochberg, Y. (1995) Controlling the false discovery rate: a
practical and powerful approach to multiple testing. Journal of the Royal
Statistical Society, Vol.57, No.1: 1995, pp.125-133.
[3] Julious, S. A. and Mullee, M. A. (1994). Confounding and Simpson's Paradox.
Britsh Medical Journal, Vol.309, No.6967: 1994, pp.1480–1481.
[4] Liu, G., Feng, M., Wang, Y., Wong, L. S., Ng, S. K., Mah, T. L., Lee, J. D. (2011)
Towards Exploratory Hypothesis Testing and Analysis. In Proceedings of IEEE
ICDE International Conference on Data Engineering, (Hannover, Germany, April
11-16, 2011).
[5] Han, J. and Kamber, M. (2001) Data Mining: Concepts and Techniques. San
Francisco, California, USA: Morgan Kaufmann Publishers, 2001.

APPENDIX
v
Appendix – Description of the Sample Dataset “Mushroom”
Attribute Possible Values (with short form)
class edible=e, poisonous=p
cap-shape bell=b, conical=c, convex=x, flat=f, knobbed=k, sunken=s
cap-surface fibrous=f, grooves=g, scaly=y, smooth=s
cap-color brown=n, buff=b, cinnamon=c, gray=g, green=r, pink=p,
purple=u, red=e, white=w, yellow=y
bruises? bruises=t,no=f
odor almond=a, anise=l, creosote=c, fishy=y, foul=f, musty=m,
none=n, pungent=p, spicy=s
gill-attachment attached=a, descending=d, free=f, notched=n
gill-spacing close=c, crowded=w, distant=d
gill-size broad=b, narrow=n
gill-color black=k, brown=n, buff=b, chocolate=h, gray=g, green=r,
orange=o, pink=p, purple=u, red=e, white=w, yellow=y
stalk-shape enlarging=e, tapering=t
stalk-root bulbous=b, club=c, cup=u, equal=e, rhizomorphs=z,
rooted=r, missing=?
stalk-surface-above-ring fibrous=f, scaly=y, silky=k, smooth=s
stalk-surface-below-ring fibrous=f, scaly=y, silky=k, smooth=s
stalk-color-above-ring brown=n, buff=b, cinnamon=c, gray=g, orange=o, pink=p,
red=e, white=w, yellow=y
stalk-color-below-ring brown=n, buff=b, cinnamon=c, gray=g, orange=o, pink=p,
red=e, white=w, yellow=y
veil-type partial=p, universal=u
veil-color brown=n, orange=o, white=w, yellow=y
ring-number none=n, one=o, two=t
ring-type cobwebby=c, evanescent=e, flaring=f, large=l, none=n,
pendant=p, sheathing=s, zone=z
spore-print-color black=k, brown=n, buff=b, chocolate=h, green=r, orange=o,
purple=u, white=w, yellow=y
population abundant=a, clustered=c, numerous=n, scattered=s,

APPENDIX
vi
several=v, solitary=y
habitat grasses=g, leaves=l, meadows=m, paths=p, urban=u,
waste=w, woods=d
Parameter settings used to generate hypotheses:
1000
0.01
0.5
Target Attribute class
Target Value poisonous=p