A highly ecient cloth facemask - researchsquare.com
37
A highly eィcient cloth facemask Christopher Cappa ( [email protected] ) University of California, Davis https://orcid.org/0000-0002-3528-3368 The San Francisco Opera Costume Department The San Francisco Opera William Ristenpart University of California, Davis Santiago Barreda University of California, Davis Nicole Bouvier Icahn School of Medicine Elad Levintal University of California, Davis Anthony Wexler University of California, Davis https://orcid.org/0000-0003-1565-814X Sanziana Roman University of California, San Francisco Research Article Keywords: face masks, face coverings, respiratory disease, public health, aerosols, airborne Posted Date: July 27th, 2021 DOI: https://doi.org/10.21203/rs.3.rs-322107/v3 License: This work is licensed under a Creative Commons Attribution 4.0 International License. Read Full License
Transcript of A highly ecient cloth facemask - researchsquare.com

A highly e�cient cloth facemaskChristopher Cappa ( [email protected] )
University of California, Davis https://orcid.org/0000-0002-3528-3368The San Francisco Opera Costume Department
The San Francisco OperaWilliam Ristenpart
University of California, DavisSantiago Barreda
University of California, DavisNicole Bouvier
Icahn School of MedicineElad Levintal
University of California, DavisAnthony Wexler
University of California, Davis https://orcid.org/0000-0003-1565-814XSanziana Roman
University of California, San Francisco
Research Article
Keywords: face masks, face coverings, respiratory disease, public health, aerosols, airborne
Posted Date: July 27th, 2021
DOI: https://doi.org/10.21203/rs.3.rs-322107/v3
License: This work is licensed under a Creative Commons Attribution 4.0 International License. Read Full License

Title: A highly efficient cloth facemask design
Authors: Christopher D. Cappa1,*, The San Francisco Opera Costume Department2,†, William D.
Ristenpart,3 Santiago Barreda,4 Nicole M. Bouvier,5 Elad Levintal,6 Anthony S. Wexler,7
Sanziana A. Roman8,*
Affiliations: 1 Dept. of Civil and Environmental Engineering, Univ. of California Davis; 1 Shields Ave., Davis, CA 95616
USA 2 Costume Department, San Francisco Opera; 301 Van Ness Ave, San Francisco, CA 94102, USA 3 Dept. of Chemical Engineering, Univ. of California Davis; 1 Shields Ave., Davis, CA 95616 USA. 4 Dept. of Linguistics, Univ. of California Davis; 1 Shields Ave., Davis, CA 95616 USA. 5 Department of Medicine, Division of Infectious Diseases, Icahn School of Medicine at Mount Sinai, 1 Gustave
L. Levy Place, New York, NY 10029, USA 6 Dept. of Land, Air and Water Resources, University of California, Davis, 1 Shields Ave., CA 95616 USA. 7 Dept. of Mechanical Engineering, Univ. of California Davis; 1 Shields Ave., Davis, CA 95616 USA. 8 Department of Surgery, Univ. of California, San Francisco; 1660 Divisadero St., San Francisco, CA 94143 USA † Includes: Amy Ashton-Keller, Daniele McCartan, Galen Till, Jai Alltizer
*Corresponding authors: [email protected] or [email protected]
Abstract
Wearing masks and face coverings helps reduce transmission of respiratory diseases. Much
prior research on mask filtration efficiency has focused on fabric type, with less consideration
given to mask design and shape. Here, we present evidence that increasing the mouth-mask
separation distance engenders an increase in the mask-fabric filtration efficiency towards
expiratory aerosols emitted via vocalization, which we attribute to a decrease in the expiratory jet
velocity and expansion of the breath-mask contact area. We further assess the performance of a
new reusable cloth facemask design, originally made for, but not exclusive to, professional singers
and having a large mouth-mask separation distance. With proper fitting, these masks achieve
overall filtering efficiencies of >93% for both exhaled expiratory aerosols >0.5 microns in
diameter from singing and speaking and for inhaled ambient aerosols, better than surgical masks
and approaching N95 respirators. Air exchange between the mask deadspace and the ambient
environment limits the extent of CO2 buildup and in inhaled air and maintains O2 levels near
ambient. The mask design also provides for less inhibited mouth and jaw movement and lower
relative humidity, suggesting it may provide a more palatable, high-efficiency alternative to
medical-grade masks for the public.

One Sentence Summary
A new cloth mask design originally made for singing provides high filtration of respiratory
and ambient aerosols.
Short Title
A highly efficient cloth facemask design
1 Introduction
Respirators, face masks, and coverings play important roles in protecting wearers in various
occupational settings and are important public health tools for reducing transmission of respiratory
disease [Brooks and Butler, 2021; Howard et al., 2021]. Masks differ in style, features, materials,
and fit—including their overall level of protection—to account for different exposure conditions
and wearer requirements. Often the most high-efficiency masks, such as N95 respirators, are those
in the least supply, especially in times of critical need such as during the COVID-19 pandemic
[Dai et al., 2020]. When particularly transmissible variants of respiratory diseases arise, as is
currently the case with the SARS-CoV-2 virus [Chand et al., 2021], the need grows for masks for
the public having high efficiency, but that have distinct supply chains from medical-grade masks
and respirators.
Willingness to wear facemasks depends on real and perceived psychological and physiological
drawbacks of mask wearing, which includes increased skin temperature, elevated humidity,
difficulty breathing, and discomfort when speaking [Scheid et al., 2020; Taylor and Asmundson,
2020]. New mask designs that help to mitigate these drawbacks may precipitate greater willingness
of people to wear masks, especially if such masks have high overall filtration efficiencies. Most
prior research has focused on the tradeoff between filtration efficiency and breathability, with less
porous materials providing more filtration and less facile breathing [Bagheri et al., 2021; Drewnick
et al., 2021; Shakya et al., 2017]. Less attention has focused on the overall shape of the mask; the
vast majority of mask designs have the fabric in immediate proximity to the mouth.
A notable exception involves a variety of facemask originally developed by singers. These
masks feature a very large internal space, with the mouth situated several centimeters away from
the fabric (Figure 1). Singing and theater performing require mask designs that generally allow for

much more jaw movement compared to other professions as well as increased space between the
face and the mask material. Thus, any mask appropriate for singing will also be more comfortable
for speech, generally. Additionally, group singing presents a particular challenge for community
transmission of respiratory disease owing to multiple people vocalizing consistently and at the
same time [Miller et al., 2021] (compared to speaking, where people typically take turns) and the
loudness of singing compared to normal speech, as the production of potentially virus-laden
aerosols increases with volume [Alsved et al., 2020; Asadi et al., 2019]. To date, however, there
has been no characterization of the overall filtration efficiency of these masks for either exhaled
respiratory or inhaled ambient aerosols nor to assess the importance of the generally increased
mouth-mask fabric distance for these masks compared to other designs.
Here, we characterize the reduction efficiency towards exhaled respiratory aerosols alongside
CO2 buildup and O2 depletion of one such mask designed originally for singing, but that may be
of use for wearing by the public. We also explicitly characterize the impact of varying the mouth-
mask distance on exhaled respiratory aerosol filtration efficiency. The “singing mask” here (Figure
1a,b) allows for facile jaw movement compared to conventional masks tested to date yet maintains
overall high efficiency towards emission of expiratory aerosols, even after accounting for leakage
flows. The singing mask here shares some similarities with other masks targeting singing that have
been introduced during the COVID-19 pandemic, but differs from these others in terms of fit,
material, and adjustability. We also characterize the mask efficiency for filtration of ambient
particles, demonstrating substantial protection to the infection-naive wearer as well. Although
designed to accommodate singers, the high overall mask efficiency (>93%) suggests that the
singing mask can provide a useful alternative to existing high-efficiency masks (e.g., N95’s) for
the public.
2 Materials and Methods
2.1 Mask Design
The singing mask, shown in Figure 1, uses a two-bone structure to separate the mask material
from the main area of the face by about 6 cm, while still allowing for a good seal. The mask was
developed by co-author S. A. R. in partnership with the San Francisco Opera. A 0.6 cm wide, 10
cm long thin aluminum strip is used around the nose, which the wearer can mold to their face. A
felt strip on the inside runs across the nose area to help with sealing. The sides of the mask extend

over the cheeks, nearly to the ears. Adjustable elastic ear loops keep the sides of the mask in place
and two additional ties fasten the mask around the wearer’s head to further seal the mask against
the face. The mask completely envelops the wearer’s jaw and chin, with an adjustable elastic band
below the jaw that keeps the mask tight against the neck while allowing for free jaw movement.
The mask has two main regions: the upper, boned structure that holds the filtering fabric in front
of but away from the mouth and nose, and an unstructured, expanded volume below the chin. The
upper region is composed of three layers in a cloth-liner-cloth arrangement, with 200 thread count
cloth outer layers and a Pellon® 50 (Pellon Consumer Products, Saint Petersburg, FL) inner layer
attached to the cotton with a fusible webbing material. The Pellon® 50 inner layer helps to stiffen
the mask material but likely provides little filtering. The length of the top region is about 12 cm.
The lower expanded volume is made of two cloth layers and opens at the bottom to allow for
drinking by straw during rehearsals and other situations where drinking occurs (e.g., schools, cafes,
bars), which could lower the risk of exposure compared to removing the mask. The opening is
sealed by folding the mask twice and then securing with embedded Velcro strips. When closed,
the length of the expanded region is about 10 cm. A modified version of the singing mask was also
constructed. The difference from the standard singing mask is that there is no bottom opening; the
modified mask is otherwise identical. During use, the cloth material comprising both the singing
and modified singing masks was observed to deflect inward (for inhalation) and outward (for
exhalation). However, the boning provides support that limits the amount of cloth deflection
associated with inhalation and exhalation. With intentionally loose wearing, the deflection
magnitude decreased. Hence, deflection provides a qualitative indication of good fit. The mask
internal volume is about 0.5 L. This is similar to the tidal volume associated with normal breathing
[Hallett et al., 2020], but about half that for singing [Binazzi et al., 2006]. The mask internal
volume is about 3-5 times larger than that for N95 respirators [Xu et al., 2015]. Given the limited
deflection of the mask material this implies substantial exchange of air, which will help to alleviate
any buildup of CO2 or depletion of O2 (see Section 3.5).
Proper wearing of the singing masks includes: first securing the mask using the ear loops,
molding the aluminum strip around the nose, tightening the ear loops, tightening the neck strap
elastic band, tying the top strap around the users head near the parietal eminence, and then tying
the bottom strap around the users neck while sitting or standing up straight. With proper wearing,
one should see no obvious gaps, especially around the nose; this can be qualitatively assessed by

having the wearer look down towards their nose moving only their eyes. If they can see their nose
below the mask then there is a gap and the mask should be better secured.
Two additional masks were constructed using the same materials as the singing mask. One was
constructed having only two cloth layers and one having three layers (cloth-liner-cloth). Both used
a general pleated surgical mask design, based on the design initially promoted by the U. S. Centers
for Disease Control; the directions and instructional video originally made available by the CDC
are no longer available online. Both used the same ear loops as with the singing mask and included
two head straps. Additional tests for the through-mask efficiency were performed by one
participant using an N95 respirator (3M, Model 8210), two different surgical masks (a medical-
grade ValuMax 5130E-SB and an unknown model), and a non-medical ‘Fashion Dust Preventive
Mask’ (30% cotton, 70% polyester) from YiWu Xuefeng Mask Factory, both without (FDPM) and
with (FDPM(N95)) an N95 insert.
2.2 Human subjects
We recruited 12 volunteers (4 self-identified male and 8 self-identified female), ranging in age
from 18 to 65 years old. The Institutional Review Board of the University of California, Davis
approved this work (IRB# 844369-4), and all research performed followed the Institutional Review
Board guidelines and regulations. Prior to the tests, written informed consent was obtained from
all participants. Information collected from participants included their age and singing range (e.g.,
soprano, alto, baritone). Only self-reported healthy non-smokers were included in the study. All
participants had to take the UC Davis Daily Symptom Survey
(https://campusready.ucdavis.edu/symptom-survey) prior to accessing campus. Participants were
encouraged to obtain a negative COVID-19 test just prior to their participation, although this was
not required or tracked. Informed consent for publication of identifying information was obtained
from the participant shown in Figure 1.
2.3 Expiratory Aerosol Experimental Description
We used an experimental setup similar to that in previous work [Asadi et al., 2020a; Asadi et
al., 2019; 2020c]. In brief, participants were asked to breath, speak, or sing in front of a stainless
steel funnel (7.5 cm diameter) connected by nonconductive tubing to an aerodynamic particle sizer
(APS, TSI Model 3321, 5 L/min) and a condensation particle counter (CPC, TSI Model 3775, 0.3

lpm) that was located in a HEPA-filtered laminar flow hood (Figure S1a). The APS characterizes
particles from 0.3 to 20 microns in aerodynamic diameter in 51 size bins, with a decreased
detection efficiency for particles <0.5 microns and the smallest size reported as 0.54 microns. The
APS total flow is 5 lpm, from which 1 lpm is sub-sampled for characterization of the particle
concentration and with the other 4 lpm used as a sheath flow. The CPC characterizes the number
concentration of all particles sampled, although with a reduced efficiency for particles larger than
about 1 micron owing to impaction losses. We focus primarily on the measurements made using
the APS and, unless otherwise stated, results for expiratory aerosols use the APS data.
Participants donned the singing mask without direct assistance. They were asked to tighten the
ear loops and the neck closure, pinch closed the metal bar in the singing mask around their nose,
and to tie the neck and head straps. They were asked to “tighten everything as much as possible,
but such that you are still comfortable.”
Respiratory emissions with or without a mask were tested with the participant’s head oriented
in one of four positions, relative to the sampling funnel. These orientations were the same as those
described in Cappa et al. [2021] and are shown in Figure S1. These were as follows.
(i) Forward/Through: The participants sat directly facing the APS funnel. This was the
orientation examined in prior studies [Asadi et al., 2020a; Asadi et al., 2019; 2020c]. In this
orientation, the APS samples air that has passed through the mask material.
(ii) Top: The participants tilted their heads downward to have the bridge of the nose
approximately centered on the APS funnel, allowing for sampling of particles that leak from the
mask nose area.
(iii) Side: The participants turned their head 90 degrees to face perpendicular to the APS funnel,
with the side singing mask approximately centered on the funnel
(iv) Bottom: The participants positioned their chin just above the APS funnel with the mask
material from the expanded volume over the top of the funnel. This allowed for sampling of
particles that leak from the mask neck area.
Participants performed the speaking and singing activities while either wearing or not wearing
the singing mask. Measurements without a mask were made only in the forward direction, with
the exception of a few test measurements on one participant to confirm that no particles were

measured above the background level in non-forward directions. Breathing was performed only
with no mask; results are not reported here but were consistent with previous measurements. For
speaking, participants were asked to read the entirety of the Rainbow Passage, both with no mask
and while wearing the mask while oriented in the “forward” direction (Figure S1); the Rainbow
Passage is commonly used in respirator fit tests (albeit, a shortened version [Occupational Safety
and Health Administration, 2004]) and linguistics research [Fairbanks, 1960]. Participants also
performed two singing activities. First, they sang in English Beethoven’s Ode to Joy from his
Ninth Symphony, both wearing and not wearing the mask, with the latter in each of four head
orientations described above (Figure S1). Second, participants sang a song of their choosing of
about two minutes in length. They performed this second activity both without a mask and with
the mask in the forward orientation only.
For all speaking and singing activities, participants were asked to carry out the activity at a
comfortable volume; no effort was made to control for volume differences between participants.
While loudness can influence the emission rate of expiratory aerosols [Asadi et al., 2019], we focus
on the reduction achieved by wearing the mask, and thus loudness differences between participants
will have little effect. All particle emission rates were adjusted to units of particles per second by
accounting for the actual duration of vocalization (tvoc), which excludes pauses between words or
phrases as determined from microphone recordings. One participant repeated the Ode to Joy
activities multiple times on different days. Participants generally performed the tasks in the order
breathing, speaking, singing Ode to Joy, and then singing the participant-selected song. We varied
the order in which the participants performed a given task with or without mask wearing. For
singing Ode to Joy with mask wearing the order of sampling in the different orientations varied
between participants, although typically with the forward direction activity the first performed
(either with or without the mask).
The directly observed particle emission rates (�̇�𝑝𝑜𝑏𝑠) does not necessarily equate to the total
particle emission rate owing to differences between the APS total airflow rate (QAPS,tot = 5 lpm),
sub-sampled airflow rate (QAPS,samp = 1 lpm) in the APS in which particle counts are measured,
and the airflow rate of the expiratory activity (Qexp), as discussed in Cappa et al. [2021]; we refer
readers there for details. In brief, when the sampled expiratory airflow exceeds the APS total
flowrate the �̇�𝑝𝑜𝑏𝑠 underestimates the true particle emission rate (�̇�𝑝) by a factor of Qexp/QAPS,samp,

although the measured particle concentration is correct. When the sampled expiratory airflow is
less than QAPS,tot the �̇�𝑝 is also underestimated owing to dilution, but by a constant ratio
(QAPS,tot/QAPS,samp), while the particle concentration is underestimated by QAPS,tot/Qexp.
This raises certain challenges when combining the measurements from the different
orientations to estimate the overall mask efficiency. Typical airflow rates associated with talking
range from ca. 8-15 lpm [Gupta et al., 2010]. For singing, airflow rates are in the same general
range although skewed perhaps a little higher, especially for louder singing, and females tend to
exhibit slightly smaller values than males [Holmberg et al., 1988; Jiang et al., 2016].
Consequently, the actual particle emission rates associated with talking and singing without a mask
are about a factor of 8-15 times higher than the observed values (the ratio between the actual
expiratory airflow rate and the sub-sampled APS airflow rate).
With mask wearing the airflow during expiration can be split in multiple directions, with the
expiratory airflow in a given direction not known a priori. We previously accounted for this split
for surgical masks while talking or coughing using a Monte Carlo method that accounts for the
above mentioned impact of expiratory airflow rates on the observed emission rates and
concentrations; this procedure allowed for determination of probability distributions of the overall
mask efficiency based on the median values across the population of participants and various
assumptions of how the flows are split [Cappa et al., 2021]. Overall, relatively narrow probability
distributions resulted with only moderate sensitivity to the assumed split between the air that
passed through the mask versus escaped out the top, sides, or bottom and the greatest deviations
found for very low total expiratory airflow rates. We use a similar approach here, but apply the
approach to the observations from each individual, rather than using the medians across
participants. Over 10,000 iterations, we determined the fraction (fx) of air that goes in a particular
direction from a random distribution, but constrained such that the concentration (rather than count
rate) in any direction is less than or equal to that with no mask wearing. We further assumed a log-
normal distribution of expiratory airflow rates centered at 13 lpm with a width of 1.3. In the case
when the airflow rate in a given direction exceeds the APS total airflow the inlet is overflowed
The �̇�𝑝,𝑖𝑜𝑏𝑠 in each orientation (i) for each individual are adjusted to actual particle emission
rates (�̇�𝑝,𝑖) based on the above assumptions. While we present the unadjusted (observed) absolute
particle emission rates to remain consistent with previous studies, when reporting particle emission

rates normalized to the no-mask condition we use the airflow-adjusted values, which are also used
to calculate the overall mask efficiency. The overall mask efficiency, 𝜂, is:
𝜂 = 1 − ∑ �̇�𝑝,𝑖�̇�𝑝,𝑛𝑜𝑚𝑎𝑠𝑘
The average value and standard deviation for each individual were determined from the
distribution of 𝜂 values from the simulations. For comparison, we also determined individual
overall efficiencies for the participants speaking while wearing surgical masks in Cappa et al.
[2021].
In the “bottom” orientation, the participants positioned their chin just above the APS funnel,
with the mask material from the expanded volume draped over the top of the funnel. Some
participants could not completely avoid contact between the mask material and the funnel in this
position; consequently, mask fibers shed by friction between mask and funnel may have
contributed substantially to the particle counts from participants in this orientation [Asadi et al.,
2020a; Clark and Shirley, 1973; Hospodsky et al., 2012]. Shedding of skin or hair can also
contribute non-expiratory particles during the speaking and singing activities (Hospodsky et al.
[2012] and Supplemental Material). Such non-expiratory particles confound the respiratory
emission measurements, but they may still carry pathogens as aerosolized fomites [Asadi et al.,
2020b]. Based on qualitative analysis of the observed particle size distributions (Figure S2)
coupled with a subjective assessment of the extent of mask-funnel contact during singing, a few
participants appeared to generate a significant amount of mask-fiber or, potentially, skin or hair,
particles. For these participants, when assessing the overall mask efficiency, we used the median
value from the other participants in place of the value measured for the individual, although
provide discussion of the impact of using unadulterated measurements.
To address concerns that the directional sampling approach used above might miss some
particles that escape from the mask edges owing to the modest flowrate of the APS, we also made
measurements for one participant using a larger funnel (30 cm diameter) and where an ancillary
flow of 25 lpm was pulled from between the funnel neck and APS inlet such that the total flow
into the funnel exceeded typical expiratory flow rates. The results from these measurements were
consistent with the directional sampling approach and are discussed further in the Supplemental
Material (Figure S3 and Table S1). They also point to potentially important contributions of skin

or hair shedding during all activities, which would lead to an underestimate of the actual filtration
efficiencies towards expiratory particles; thus, the reported values might be reasonably considered
lower limits.
One participant sang Ode to Joy wearing a variety of mask types (see Mask Design) in the
forward (through-mask) position, with three replicates for each mask type.
All data processing analyses were carried out using Igor Pro (v. 8.0.4.2, Wavemetrics).
Differences between the �̇�𝑝,𝑖 values are calculated after log-transformation using a single factor
ANOVA test.
2.4 Inhalation Experimental Description
The concentration of particles inside the singing mask was measured for one participant while
breathing. For comparison, the concentration of particles in the room air was measured just prior
to the measurements of particle concentrations inside the mask. Here, a tube composed of
conductive silicon was inserted below the mask at the neck area and the sampling end of the tube
was positioned to sit in the main mask area in front of the face. The tube was attached to a
condensation particle counter (CPC, TSI Model 3775, 0.3 lpm), which sampled at 0.3 lpm and
measured the total concentration of particles every 1 second. The CPC characterizes the number
concentration of all particles sampled above 4 nm, although with a reduced efficiency for particles
larger than about 1 micron owing to impaction losses. Two experiments were conducted. In both,
the participant was asked to breathe deeply in and out through their nose 10 times at a rate of about
five breaths per minute while the particle concentration inside the mask was continually monitored.
In one experiment, the neck strap was fully tightened, as appropriate for correct fit of the singing
mask. For the second, the neck strap was left slightly loose to intentionally introduce a leak. Prior
to starting the measurement, the participant was asked to breathe three times after the sampling
tube was inserted. The ratio between the room air concentration and the in-mask particle
concentration provides a measure of the mask fit factor and the efficiency towards inhaled ambient
particles.
2.5 Filtration Efficiency versus Distance Experimental Description
The influence of the mask-mouth separation distance on filter efficiency was characterized as
follows. A fibrous filter having moderate efficiency was secured over the APS sampling funnel

using an elastic band. This provided the filtration material, and the “mask”-mouth separation
distance was characterized as the distance between the participants’ mouth and the fibrous filter.
To eliminate the influence of the air from the laminar flow hood on the measurements, a cylindrical
sheath having the same diameter as the APS sampling funnel was constructed out of aluminum
foil. The sheath was secured to the APS sampling funnel using a second elastic band to make a
seal. The distance that the sheath extended from the APS sampling funnel could be adjusted over
the range 1 cm to 10 cm. A schematic is shown in Figure 2a. Background concentrations were
unaffected by the presence of the sheath. Without this sheath, the measured particle concentrations
during speaking the Rainbow Passage, and without the fibrous filter, would decrease as the
participant moved further from the APS sampling funnel. More specifically, without the sheath
the measured concentration was constant within measurement reproducibility when the participant
was within 3 cm of the plane of APS sampling funnel but decreased with further distance. With
the sheath (and without the filter), there was no discernible change in the measured concentration
with distance.
A participant was asked to recite the Rainbow Passage with the sheath set at distances ranging
from 1 to 10 cm. The participant gently placed the bridge of their nose and their chin against the
sheath to maintain a given distance throughout the activity. Because the participant’s mouth
extended ~0.5 cm into the sheath, the reported distances are 0.5 cm less than the length of the
sheath. The participants face did not entirely cover the sheath. Because the sheath was sealed to
the sampling funnel, excess air from speaking (relative to the APS flow) exited by the participants
face. The distances were selected in a random order. At each distance three replicates were
performed with the fibrous filter in place over the APS sampling funnel and compared to the
measurements made with no filter. The expiratory air velocity decreases with distance from the
mouth, while the fraction of the filter area through which the expiratory air passes increases with
distance (see Appendix A). Expiratory air velocities at the mouth exit depend on the airflow rate
and the size of the mouth opening. For reference, Kwon et al. [2012] observed airflow velocities
of 20-40 cm/s over 1-2 cm distance in front of speakers mouths, which will decrease to about 2-4
cm/s at a distance of 10 cm. These values are notably higher than the face velocity associated with
the APS airflow through the filter material (1.06 cm/s).
The particular fibrous filter used necessarily exhibited little fiber shedding and also had a
moderate overall filtration efficiency. The latter condition is necessary because if the filtration

efficiency is too large it is difficult to determine changes with distance quantitatively within the
measurement uncertainty, and working with a fibrous filter having a moderate (~50%) efficiency
allows for access of a greater range of values. To meet these requirements, we used the outer layer
of a 3-layer surgical mask as the fibrous filter, specifically the outer layer of the ValuMax 5130E-
SB mask. (The inner layer of this mask had too high of an efficiency. The singing mask, despite
limited evidence of substantial shedding when worn by the participants, shed particles excessively
when secured over the APS sampling funnel.)
The total filtration efficiency was determined by summing over all particles measured. The
size-dependent filtration efficiency was determined in five size bins: the lower size limit to 0.8
m, 0.8-1.25 m, 1.25-1.9 m, 1.9-3.9 m, and 3.9-10 m. Uncertainties were taken as the 1
standard deviation of the mean over the three replicates.
This method of determining the material filtration efficiency differs from standard methods
that affix the filter material in a holder and vary the airflow rate to control the face velocity [ASTM
International, 2017; Drewnick et al., 2021]. In such tests the face velocity is the same across the
entire filter material, whereas here the velocity and exposed area co-vary.
2.6 Measurement of environmental parameters in the mask deadspace volume
We measured the steady state concentration of CO2 and O2 in the deadspace volume of the
singing mask for one participant using a Sensiron SCD-30 NDIR CO2 sensor and Maxell KE-25
O2 sensor, respectively. The sensors recorded at 2 sec time intervals, although the response times
were 20 s and 15 s, respectively. The CO2 sensor has a specified measurement range up to 40,000
ppmv, although we found that it maxed out above ~32,000 ppmv. The specified accuracy of the
CO2 sensor is +/- (30 ppm + 3%) up to 10,000 ppmv and a repeatability of 10 ppmv, while the O2
sensor accuracy is +/- 1%. We have confirmed linearity of the CO2 sensor response up to 30,000
ppmv via comparison with a gas chromatograph (r2 = 0.999, slope = 0.92; Figure S4). The CO2
and O2 concentrations were measured separately to avoid contact between the sensors. The SCD-
30 sensor also measures relative humidity (RH) and temperature (T), with accuracies of +/-3% and
+/-0.4 °C and repeatabilities of 0.1% and 0.1 °C, respectively.
Two measurements each were made for speaking the Rainbow Passage and singing Ode to Joy
for CO2, along with RH and T. Only one measurement was made for O2 for speaking. However,

we also measured O2 for one participant over a 30 minute period while they sat quietly working at
a computer. The sensors were set inside the singing mask deadspace volume with the wires
arranged to exit at the neck area; the wires were sufficiently thin that they did not perturb the mask
fit in any notable manner. We also measured steady state CO2 in the deadspace of a KN95
respirator worn by one participant while speaking. The smaller deadspace volume led to
unavoidable contact between the sensor and the participants face or the respirator, which caused
occasional false negative signals that quickly recovered; these negative signals have been removed
from the data.
Complementary measurements of the transient response of CO2 to deeper and slower breathing
were also made, where a participant carried out a series of four deep inhalations and three deep
exhalations, with each cycle (inhalation + exhalation) taking about 45 seconds. These
measurements were made after the participant had already been wearing the singing mask for many
minutes. The observed time-varying concentrations during each inhalation and each exhalation
were fit to an exponential function with an offset to determine the asymptotic CO2 concentrations.
3 Results and Discussion
3.1 Through-mask filtration efficiencies for exhaled particles
Consistent with previous findings [Alsved et al., 2020] the observed particle emission rates
using the APS for singing (⟨�̇�𝑝,𝑠𝑖𝑛𝑔⟩ = 11.9 p/s) exceeded those for talking (⟨�̇�𝑝,𝑡𝑎𝑙𝑘⟩ = 3.3 p/s by
about a factor of three when no mask was used (Figure S5), similar also to mass-based results
[Gregson et al., 2021]. The particle size distributions generally resembled each other for speaking
and singing, although singing led to a slight enhancement in the number of particles between about
1 m and 5 m (Figure S6). Singing and talking differ somewhat in their physiological
underpinnings. Singing and 'projecting' the voice typically involve a more rapid closing phase of
the vocal folds, resulting in more high-frequency energy in the voice-source spectrum and a louder
output sound [Lindblom and Sundberg, 2007]. The higher vocal fold velocities, and the higher
degree of vocal fold tension required to produce these higher velocities, could both influence the
particle sizes and numbers produced by singers. Singing also requires different valving strategies
at the larynx to keep subglottal pressure (and loudness) constant throughout a single ‘phrase,’
which could also result in different particle size distributions between speaking and singing [Rubin

et al., 1967]. Regardless of the physiological origin, this small variability in the inherent particle
size distribution between singing and speaking will have little influence on the efficiency with
which the mask reduces emission of particles from expiration to the surrounding environment.
Representative aerosol emission data from one individual singing Ludwig van Beethoven’s
Ode to Joy with no mask or while wearing various facemasks, including the singing mask,
demonstrate that the efficiency of expiratory particle filtration for airflow passing through the mask
material varies with mask type (Figure 3). Notably, this through-mask efficiency for respiratory
particles averaged across all particle sizes (𝜂𝐹) for the singing mask is as high as for an N95 and
higher than that for two different types of surgical masks, as well as for various cloth masks
including two made of the same cloth as the singing mask. Considering multiple participants, the 𝜂𝐹 while speaking the Rainbow Passage [Fairbanks, 1960], singing Ode to Joy, and singing other
user-selected songs was very high for the singing mask, with the average 𝜂𝐹 > 99.5% observed for
all activities and the lowest 𝜂𝐹for a single individual of only 96.5% (Figure 4a). This high through-
mask efficiency exceeds that observed for medical-grade surgical masks (Figure 4b) and for KN95
masks during speaking maneuvers [Asadi et al., 2020a] but is similar to that for an N95 as noted
above (Figure 3). With respect to sound, the mask effectively acts as a low-pass filter (Figure S7),
consistent with previous findings on speech and mask wearing [Saeidi et al., 2016]. The good
aerosol filtering differs notably from a homemade cloth masks made from t-shirts—these had
particle emission rates higher than observed without the mask owing to shedding of mask fibers,
which may act as aerosolized fomites [Asadi et al., 2020a]. The high filtering efficiency of the
singing mask occurs despite considerable shedding when participants intentionally rubbed the
mask against itself, (such as might occur with opening/closing the bottom for potential water
sipping), with a shedding rate greater than for the homemade cloth masks [Asadi et al., 2020a]
(geometric mean = 20 p/s for the singing mask vs. 1 p/s for the homemade mask; Figure S8). Most
likely, this distinct lack of shedding during use for the singing mask results from separation of the
mask material and the wearers face, thus eliminating contact abrasion of the mask material.
The through-mask filtration efficiency for the singing mask, and for a modified singing mask
lacking the opening for drinking, exceeded that for two-layer and three-layer masks made of the
same cloth but having a pleated surgical-mask style (Figure S9). The pleated masks reduced the
through-mask particle emission while singing Ode to Joy by a substantial, but comparably small,

factor of ~14 while the singing masks reduced through-mask emission by >500 fold Figure 3).
This observation suggests that an increase in mask-mouth separation distance for the singing mask
engenders an increase in the 𝜂𝐹 and potentially helps to explain the high filtration efficiency for
the cotton fabric singing mask.
3.2 Influence of mask-face separation distance on filtration efficiency
To assess the impact of this separation distance on 𝜂𝐹 in a controlled manner, we performed
systematic experiments using a non-shedding fibrous filter having moderate efficiency (Figure 2a).
Notably, the observed 𝜂𝐹 increased with the filter-mouth separation distance (Figure 2b),
consistent with the difference between the two- and three-layer masks and the singing mask. This
observation further supports the idea that the larger than typical mask-mouth distance of the
singing mask importantly contributes to its high through-mask filtration efficiency.
The observed dependence of 𝜂𝐹 on distance (x) is well described by the empirical relationship 𝜂𝐹 = 1 − exp(−𝐾∗ ∙ 𝑥𝑝), with p = 0.45 (b). Theory indicates the overall filtration efficiency for
a fibrous filter varies as 𝜂𝐹 = 1 − exp(−𝐾 ∙ 𝜂𝑆𝐹), where the 𝜂𝑆𝐹 is the single-fiber filtration
efficiency accounting for all processes (diffusion, interception, impaction) and K is a constant that
depends on the filter [Flagan and Seinfeld, 1988]. The 𝜂𝑆𝐹 for the different processes vary with
the air velocity through the filter, with 𝜂𝑆𝐹,𝑑𝑖𝑓𝑓 decreasing but 𝜂𝑆𝐹,𝑖𝑛𝑡+𝑖𝑚𝑝 increasing with
increasing velocity. As the expiratory jet expands away from the singer the velocity decreases and
the jet will impinge on a greater area of the filter material [Abkarian et al., 2020]. Thus, we expect
that 𝜂𝐹 should vary with the filter-mouth separation in a manner that depends on whether diffusion
or impaction dominates the particle loss process. The observations are fit equally well as the
empirical equation using an expression in which the 𝜂𝑆𝐹 derive from the theoretical relationships
between velocity and 𝜂𝑆𝐹,𝑑𝑖𝑓𝑓 and 𝜂𝑆𝐹,𝑖𝑛𝑡+𝑖𝑚𝑝, but where the relationship between particle size and
diffusivity or impaction efficiency is not explicitly considered (see Appendix A). Further, the size-
dependent through-filter efficiencies (𝜂𝐹,𝐷𝑝) vary with separation distance and differ by size
regime (Figure 2c,d). Smaller particles correspond to smaller 𝜂𝐹,𝐷𝑝 while exhibiting a stronger
distance dependence. For particles >2 microns the 𝜂𝐹,𝐷𝑝 exhibit minimal dependence on the filter-
mouth separation distance. Both the increase in 𝜂𝐹 with distance and the stronger distance
dependence of 𝜂𝐹,𝐷𝑝 for the smaller particles are somewhat surprising given that diffusion-driven

losses are typically considered minor for particles >0.5 microns and impaction-driven losses
should decrease as velocity decreases [Flagan and Seinfeld, 1988].
Our observations differ from those of Drewnick et al. [2021], who measured size-specific
filtration efficiencies as a function of face velocity for various cloth masks using a standard test
procedure wherein the filter is secured in a sample holder and the airflow rate is varied to change
the velocity. Specifically, for 2.5 micron particles they found that 𝜂𝐹,𝐷𝑝 increased with velocity
and for 0.5 micron particles there was little dependence of 𝜂𝐹,𝐷𝑝 on velocity. The difference in
methodologies used provides a potential explanation for this difference in behavior. In our case,
the air velocity and the jet-impinged area co-vary; velocity decreases with the filter-mouth
separation owing to expansion of the expiratory jet and an increase in the filter area impacted by
the expiratory air. This could potentially lead to differences in how the filter material structurally
responds to changes in velocity compared to the standard test methods, which could in turn impact
filtration efficiency. Perhaps greater deformation of the filter material at close mask-face
separation distances, corresponding to high velocity with small impacted area, occurs and reduces
impaction-driven losses. We note that our methodology better reflects the physical situation that
occurs with actual mask wearing compared to the standard method. While we cannot pinpoint a
specific reason for the observed distance dependence with certainty, our observations indicate that
the increased mask-face distance for the singing mask likely contributes to the particularly high
through-mask filtration efficiency.
3.3 Impact of mask leakage on the overall filtration efficiency for exhaled particles
The overall mask performance additionally depends on the extent to which particles escape
from the edges of the mask; the above discussion only addresses air that passes through the mask
material. Any leakage that results from imperfect sealing between the mask and wearers’ face
reduces all overall mask efficiencies [Cappa et al., 2021; Grinshpun et al., 2009; Oberg and
Brosseau, 2008]. For high-quality filtering materials, the extent of leakage is the primary
determinant of overall mask efficiency (𝜂) [Grinshpun et al., 2009]. Following from our previous
study on surgical mask leakage during speaking [Cappa et al., 2021], we determined the emission
rates of particles from the top, bottom, and side quadrants of the singing mask while participants
sang Ode to Joy (Figure S1). We note that negligible particle emissions from the opening for
drinking (see methods) were observed after it was sealed closed. The observed particle emission

rates from these quadrants exceeded those for the forward, through-the-mask material direction
(Figure 5a). Nonetheless, wearing a mask substantially decreases the observed particle emission
rates from the no-mask condition in all directions.
Figure 5
The greatest between-participant variability in the absolute emission rate occurs for sampling
from the mask top quadrant, near the nose (geometric standard deviation = 0.85). This suggests a
greater sensitivity of emissions in this direction to how well the mask seals around the nose, which
can result from individuals wearing the masks with different tightness. We confirmed this by
having one participant sing Ode to Joy while securing the mask with (i) only the ear loops snug,
but not tight, (ii) only the ear loops tight, and (iii) the ear loops tight plus the two head straps
(Figure S10). With the snug ear loops-only, the observed particle emission rate from the mask top
decreased by only a factor of three over no mask. However, with the tight ear loops-only the
particle emission rate from the top decreased by a factor of 38 over no mask and with the tight ear
loops and the head straps by a factor of 80 over no mask.
Sampling from the bottom quadrant yielded the largest with-mask particle emission rates.
While this could indicate the greatest leakage flow in this quadrant, the associated particle size
distribution differs notably from those observed in the other quadrants (Figure S11). In particular,
a large-diameter mode between ~3-10 microns was observed, which strongly indicates a non-
expiratory source. Owing to the extended volume of the singing mask, most participants could not
avoid having the mask rub against the sampling funnel while sampling from the bottom quadrant.
This strongly implicates shed fibers as a contributing particle source; consequently, the particle
emission rate from the bottom quadrant provides an upper limit to leakage of expired particles.
We estimate the overall mask efficiency for reduction of expiratory aerosol emission for each
individual while singing by combining the observed particle emission rates without a mask to
emission from the various quadrants plus through-mask using the constrained Monte Carlo
approach described in the Methods to account for splitting of the flow in the various directions
(Figure 5b). The median is 98% and the mean 97 ± 3%. If the measurements from the participant
who repeated the activities are combined into a single value the median is 97% and the mean 96% ± 4%. Overall mask efficiencies of greater than 93% were determined for all but two participants
wearing the singing mask. One of these individuals (𝜂 = 88%) had the highest normalized emission
rate for the top quadrant, indicating that leakage around the nose contributed to this low, but still
very good, efficiency. The other individual (𝜂 = 91%) produced a somewhat high normalized
emission rate from the mask top and the second highest from the mask bottom, suggesting that
both leakage and, likely, shed mask fibers contributed. (We note that these values were determined
when using the median values in place of the directly observed values for the few cases for which
particle shedding likely had a major impact; see Methods. When the directly observed values are
used the average 𝜂 = 96 ± 5%%, the median is still 98%, and all but three of the individual 𝜂 were
>90%; see Figure S12). Regardless, the observed high overall efficiencies indicate that with proper
fit, in particular ensuring a good seal around the nose, the singing mask provides substantial
reduction of expiratory particle emission even while singing. Also, no visible spittle (i.e., droplets
much larger than those measured here) was observed with wearing the singing mask, suggesting
efficient elimination of very large droplets.
The above high filtration efficiencies correspond to particles >0.5 microns in diameter, as
characterized by the APS. Comparison between the CPC and APS measured particle
concentrations indicates that the APS characterizes 30% of the total particles on average, meaning
that 70% of the particles are smaller than ~0.5 microns (Figure S13a). Using the CPC
measurements we find the average 𝜂 = 90 ± 7%% and the median 𝜂 = 92%, somewhat lower
compared to the APS but still very high (Figure S13b). This difference between the APS (particles
>0.5 microns) and CPC (all particles) likely results from the fact that material filtration efficiencies
typically exhibit a minimum at diameters between ~0.1 microns and 0.5 microns, dependent on
material [Pan et al., 2021]. The probability that a given respiratory particle might contain an
infectious virion decreases as particle size decreases such that very few particles <0.5 microns are
expected to contain an infectious virion [Anand and Mayya, 2020]. Therefore, the APS
measurements likely provide the most appropriate characterization of the overall filtration
efficiency in the context of respiratory diseases.
The overall efficiency determined here for the singing mask greatly exceeds that found for
surgical masks during speaking [Cappa et al., 2021], and further there is substantially less
individual variation between participants (Figure 5b,c). The singing mask design provides a tighter
fit that reduces, but does not eliminate, variability in the fit quality. This, together with the greater
efficiency for air passing through the mask, leads to the overall improved performance compared
to a surgical mask. Notably, the overall efficiency of the singing mask including leakage exceeds
the efficiency of the surgical mask even if we assume zero leakage flow. While some tools exist
to help improve sealing of cloth and surgical masks [Clapp et al., 2020; Rothamer et al., 2021]
their use during singing is infeasible. Similarly, so-called double masking has been suggested,
including by the U.S. Centers for Disease Control [Brooks et al., 2021], as a way to improve both
filtering ability and fit, and thus overall efficiency [Gandhi and Marr, 2021], but this too would
not be appropriate for singing. Even so, outside of singing contexts (e.g., public adoption), double
masking does not ensure one obtains a good seal and thus the actual benefit is difficult to know—
especially given the wide range of cloth masks available. Also, while qualitative, the participants
generally indicated that greater breathing comfort with the singing mask compared to the mask(s)
each individual typically wore, most likely owing to the increased mask-face separation. We
speculate that the more open design of the singing mask could increase mask wearing compliance.
3.4 Mask filtration efficiency towards ambient particles
While mask wearing plays an important role in reducing emission of expiratory particles,
masks can also reduce inhaled particles concentrations. To address this, we measured for one
participant the time-varying concentration of particles inside the singing mask during breathing
(Figure 6). When leaving the mask neck seal intentionally somewhat loose the peak particle
concentrations inside the mask upon inhalation approximately equaled the room air aerosol
concentration. Upon exhalation the concentration fell to very low values, indicative of the lower
aerosol concentration in exhaled breath compared to most ambient environments and ambient
particle deposition in the respiratory system. However, when the mask was worn as designed, with
the neck seal tight, the inside-mask concentration upon inhalation rose only to about 6% of the
room air concentration, indicative of an effective efficiency of 94% for inhalation, similar to that
found for expiratory particle emission. Mask performance is sometimes characterized by the fit
factor, which in this case is just the ratio between the room air concentration and the concentration
measured in the mask, or ~16.7 [Lindsley et al., 2021]. Distinct from expiratory aerosols, the room
air aerosols were primarily smaller than 0.5 microns, with only ~10% of the particles larger.
Filtration efficiency typically increases with particle size above this range [Cappa et al., 2021;
Drewnick et al., 2021] and thus we expect the efficiency of the singing mask towards expiratory
aerosols emitted by others will be even greater than found here. Similar to exhalation, the singing
mask geometry likely contributes to the high filtration efficiency towards ambient particles during

inhalation. The greater mask-face separation will lead to air being drawn through nearly the
entirety of the mask surface area, with a consequently lower face velocity and increased filtration
efficiency compared to conventional designs. Overall, this demonstrates that wearing of the
singing mask provides major benefits to both the wearer and others.
3.5 Deadspace microclimate
Concentrations of CO2 in the deadspace of filtering facepiece respirators, such as N95
respirators, are substantially elevated above ambient concentrations (~420 ppm), with consequent
concerns over CO2 rebreathing [Smith et al., 2013]. For example, Rhee et al. [2021], found the
steady state [CO2] = 26,000 ppmv inside the respirator deadspace for participants wearing KN95
respirators. This high concentration results from the high [CO2] in exhaled breath of ~5% by
volume, or 50,000 ppmv. The deadspace of the singing mask is about 3-5 times larger than most
facepiece respirators. Thus, there is potential concern over CO2 buildup in the singing mask.
Correspondingly, as the CO2 in exhaled air derives from the inhaled O2, limited exchange of mask
air with ambient air could result in O2 depletion. Our measurements show the steady state [CO2]
~ 19,000 ppmv during speaking and singing, lower than the steady state observed by Rhee et al.
[2021] for an N95 respirator and lower than the steady state measured for this same participant
wearing a KN95 respirator (~25,000 ppmv) (Figure 7a). The steady state [O2] measured in the
singing mask averaged 18.5% by volume during speaking of the Rainbow Passage and 18.0%
during longer wearing (30 min) by one participant (Figure 7b). While lower than the [O2] in
ambient air (20.8%) this concentration exceeds that in exhaled breath (~16%). In terms of oxygen
availability, this decrease in [O2] corresponds to an equivalent change in altitude from sea level to
about 1 km and is consistent with respirator use having no influence on oxygen saturation level
[Kim et al., 2013]. If there were limited mask-ambient air exchange the [CO2] should build up over
time while the [O2] should continually deplete. That this did not occur, even over 30 minutes of
wearing, demonstrates substantial exchange occurs.
Our complementary transient measurements during breathing show that the deadspace [CO2]
asymptotically approaches ~36,000 ppmv during exhalation and ~6,500 ppmv during inhalation
(Figure S14). These observations demonstrate that there is exchange between the deadspace and
ambient environment during both exhalation and inhalation, but with some residual in the
deadspace that is not fully cleared out. If exchange did not occur we would expect that the

deadspace [CO2] would asymptote to the value in exhaled breath during exhalation and if there
were no residual in the deadspace we would expect CO2 to asymptote to ambient values during
inhalation.
To understand the steady state and transient observations we have built a simple model of
ambient-mask air exchange, inhalation and exhalation, and O2 → CO2 conversion upon inhalation
during breathing (see Supplemental Materials). The model indicates that inhaled air comprises
about 85% of ambient air and 15% of deadspace air, leading to an average [CO2] in inhaled air of
~6,000 ppmv. This concentration is slightly higher than the 8 h time-weighted average occupational
exposure limit for CO2 of 5,000 ppmv and well below the short-term exposure limit of 30,000 ppmv
[OSHA, 2021]. During exhalation, about 15% of the air is residual deadspace air, 25% of the air is
exchanged ambient air, and 60% is exhaled air. The model consideration confirms that substantial
mask-ambient air exchange occurs. Overall, given these calculations and the general similarity of
the steady state CO2 for the singing mask and for N95 respirators we can expect that continuous
wearing (for hours) may lead to slightly elevated transcutaneous CO2 levels of wearers, but at
levels that are not clinically important [Scheid et al., 2020].
The relative humidity in the singing mask deadspace averaged ~65% for both speaking and
singing, and the temperature averaged ~31 °C (Figure 7c,d). The temperature in the singing mask
was similar to that measured in the KN95 respirator (~31 °C) whereas the relative humidity was
much lower than that in the KN95 respirator (~90%). Our observations for the KN95 respirator
are consistent with previous measurements for N95 respirators [Roberge et al., 2012]. The higher
relative humidity in the KN95 mask and in N95 masks generally could result from greater water
retention by the KN95 material compared to the singing mask material.
Anecdotally, a few participants noted that the air felt somewhat stale while singing with mask
wearing, indicating some level of discomfort compared with no mask wearing. The participant
who performed numerous repeats indicated that comfort increased with repeated use on multiple
occasions, suggesting that there may be some aspect of acclimatization. That same participant also
wore the singing mask for >1 h while working quietly and did not note any particular physical
discomfort beyond feeling a slightly elevated skin temperature. Further research would be
necessary to quantify mask wearer’s subjective or physiological responses beyond these anecdotal
observations.

4 Summary
In summary, the overall filtering efficiency of the cloth singing mask when fit properly
compares favorably to that expected for N95 respirators both for filtration of exhaled respiratory
particles and inhalation of ambient particles. The higher efficiency results, in part, from the
substantial mask-face distance compared to typical mask designs. Sufficient exchange between air
in the mask deadspace and the ambient environment constrains CO2 buildup below that observed
in N95 respirators and prevents physiologically important O2 depletion. Additionally, the relative
humidity in the singing mask is lower than that in N95 masks (~65% compares to ~90%,
respectively). As the materials comprising the singing mask and N95s differ, the singing mask, or
similarly designed masks, could provide a viable alternative to N95s outside of healthcare or other
specialized occupational settings for situations when greater mask efficiency is necessary or
desired. For singers and other performers, in particular, the singing mask, when fit properly, has
sufficiently high efficiency—maintained throughout the act of singing—that its adoption could
facilitate in-person rehearsals with multiple people as long as other best practices (e.g., good
ventilation) are also adopted.
5 Acknowledgements
The authors greatly appreciate the participation of the various professional and amateur singers
who volunteered their time. We thank Helen Dahlke at UC Davis for use of the CO2 and O2 sensors.
Author contributions: C. D. C. led the measurements and analysis. S. A. R. and A. A-K. of the
San Francisco Opera (SFO) designed the mask. SFO constructed the masks and SFO and C. D. C
provided design suggestions. W. D. R. contributed to experimental design and interpretation. E. L.
facilitated the CO2 and O2 measurements. A. S. W., S. B., and N. M. B. contributed to
interpretation. C. D. C, and S. A. R. led the manuscript writing. All authors reviewed and revised
the manuscript for accuracy and intellectual content. Competing interests: S. A. R. and A. A-K.,
have filed a patent application for the singing mask. All other authors declare no competing
interests. Data and materials availability: All data needed to evaluate the conclusions in the
paper are present in the paper and/or the supplementary materials. Additional data and files related
to this paper will be made publicly available at doi:10.25338/B8GD1B and are available for review
at https://bit.ly/3qUJpiy.
6 Funding
N/A
7 Appendix A
For an expiratory jet, the air velocity, u, decreases with distance as 1/(𝛼 ∙ 𝑥), where 𝛼 is the
divergence angle (~20°) and x is distance [Abkarian et al., 2020]. Overall filtration efficiencies
(𝜂𝑓) for fibrous filters vary as: 𝜂𝑓 = 1 − exp(−𝐾 ∙ 𝜂𝑆𝐹) (E1)
where 𝜂𝑆𝐹 is the single-fiber filtration efficiency accounting for losses by diffusion, interception,
and impaction and K is a constant dependent on the filter packing density, thickness, and fiber size
[Flagan and Seinfeld, 1988]. For diffusion-driven losses,
𝜂𝑆𝐹,𝑑𝑖𝑓𝑓 ∝ 𝑃𝑒−23 ∝ 𝑢−23, (E2)
and where Pe is the Peclet number, which is proportional to velocity (u) through the filter [Flagan
and Seinfeld, 1988]. Loss via interception and impaction has a more complex relationship with
conditions, but can be approximated as
𝜂𝑆𝐹,𝑖𝑛𝑡+𝑖𝑚𝑝~10^ [𝑦0 + 𝑎𝑏𝑠(𝑦0)1+exp((log(𝑆𝑡𝑘0)−log(𝑆𝑡𝑘))𝑟 )], (E3)
where Stk is the Stokes number, which is proportional to velocity and the other terms are constants
that depend on the fiber size and the particle diameter [Flagan and Seinfeld, 1988]. The overall
single-fiber efficiency is then: 𝜂𝑆𝐹 = 𝜂𝑆𝐹,𝑑𝑖𝑓𝑓 + 𝜂𝑆𝐹,𝑖𝑛𝑡+𝑖𝑚𝑝 − 𝜂𝑆𝐹,𝑑𝑖𝑓𝑓 ∙ 𝜂𝑆𝐹,𝑖𝑛𝑡+𝑖𝑚𝑝. (E4)
Rewriting Eqn. S2 and S3 to depend on the mask-face separation distance, x, rather than velocity,
we have: 𝜂𝑆𝐹,𝑑𝑖𝑓𝑓 = 𝐴 ∙ 𝑥23, (E5)
and
𝜂𝑆𝐹,𝑖𝑛𝑡+𝑖𝑚𝑝~10^ [𝑦0 + 𝑎𝑏𝑠(𝑦0)1+exp((− log(𝑥0)−log(𝑥))𝑟 )]. (E6)

Substitution of Eqn. S5 and S6 into Eqn. S4, and the resulting expression into Eqn. S1 yields an
expression for the overall filtration efficiency that depends on the mask-face separation distance,
and which can be fit to observations.
8 References
Abkarian, M., S. Mendez, N. Xue, F. Yang, and H. A. Stone (2020), Speech can produce jet-like
transport relevant to asymptomatic spreading of virus, Proceedings of the National Academy of
Sciences, 117(41), 25237-25245, doi:10.1073/pnas.2012156117.
Alsved, M., A. Matamis, R. Bohlin, M. Richter, P. E. Bengtsson, C. J. Fraenkel, P. Medstrand,
and J. Löndahl (2020), Exhaled respiratory particles during singing and talking, Aerosol Science
and Technology, 54(11), 1245-1248, doi:10.1080/02786826.2020.1812502.
Anand, S., and Y. S. Mayya (2020), Size distribution of virus laden droplets from expiratory
ejecta of infected subjects, Scientific Reports, 10(1), 21174, doi:10.1038/s41598-020-78110-x.
Asadi, S., C. D. Cappa, S. Barreda, A. S. Wexler, N. M. Bouvier, and W. D. Ristenpart (2020a),
Efficacy of masks and face coverings in controlling aerosol particle emission from expiratory
activities, Scientific Reports, 10, 15665, doi:10.1038/s41598-020-72798-7.
Asadi, S., N. Gaaloul ben Hnia, R. S. Barre, A. S. Wexler, W. D. Ristenpart, and N. M. Bouvier
(2020b), Influenza A virus is transmissible via aerosolized fomites, Nature Communications,
11(1), 4062, doi:10.1038/s41467-020-17888-w.
Asadi, S., A. S. Wexler, C. D. Cappa, S. Barreda, N. M. Bouvier, and W. D. Ristenpart (2019),
Aerosol emission and superemission during human speech increase with voice loudness,
Scientific Reports, 9(1), 2348, doi:10.1038/s41598-019-38808-z.
Asadi, S., A. S. Wexler, C. D. Cappa, S. Barreda, N. M. Bouvier, and W. D. Ristenpart (2020c),
Effect of voicing and articulation manner on aerosol particle emission during human speech,
PLoS One, 15(1), e0227699, doi:10.1371/journal.pone.0227699.
ASTM International (2017), ASTM Standard F2299, in Standard Test Method for Determining
the Initial Efficiency of Materials Used in Medical Face Masks to Penetration by Particulates
Using Latex Spheres, edited, West Conshohocken, PA.
Bagheri, M. H., I. Khalaji, A. Azizi, R. T. Loibl, N. Basualdo, S. Manzo, M. L. Gorrepati, S.
Mehendale, C. Mohr, and S. N. Schiffres (2021), Filtration efficiency, breathability, and
reusability of improvised materials for face masks, Aerosol Science and Technology, 1-15,
doi:10.1080/02786826.2021.1898537.
Binazzi, B., B. Lanini, R. Bianchi, I. Romagnoli, M. Nerini, F. Gigliotti, R. Duranti, J. Milic-
Emili, and G. Scano (2006), Breathing pattern and kinematics in normal subjects during speech,
singing and loud whispering, Acta Physiologica, 186(3), 233-246,
doi:https://doi.org/10.1111/j.1748-1716.2006.01529.x.
Brooks, J. T., D. H. Beezhold, J. D. Noti, J. P. Coyle, R. C. Derk, F. M. Blachere, and W. G.
Lindsley (2021), Maximizing Fit for Cloth and Medical Procedure Masks to Improve
Performance and Reduce SARS-CoV-2 Transmission and Exposure, MMWR Morb Mortal Wkly
Rep, doi:http://dx.doi.org/10.15585/mmwr.mm7007e1.

Brooks, J. T., and J. C. Butler (2021), Effectiveness of Mask Wearing to Control Community
Spread of SARS-CoV-2, JAMA, doi:10.1001/jama.2021.1505.
Cappa, C. D., S. Asadi, S. Barreda, A. S. Wexler, N. M. Bouvier, and W. D. Ristenpart (2021),
Expiratory aerosol particle escape from surgical masks due to imperfect sealing, Scientific
Reports, 11, 12110, doi:10.1038/s41598-021-91487-7.
Chand, M., et al. (2021), Investigation of novel SARS-CoV-2 variant, Variant of Concern
202012/01; Technical briefing 2,
https://assets.publishing.service.gov.uk/government/uploads/system/uploads/attachment_data/file
/948152/Technical_Briefing_VOC202012-2_Briefing_2_FINAL.pdf,
Clapp, P. W., E. E. Sickbert-Bennett, J. M. Samet, J. Berntsen, K. L. Zeman, D. J. Anderson, D.
J. Weber, W. D. Bennett, U. C. f. D. Control, and P. E. Program (2020), Evaluation of Cloth
Masks and Modified Procedure Masks as Personal Protective Equipment for the Public During
the COVID-19 Pandemic, JAMA Internal Medicine, doi:10.1001/jamainternmed.2020.8168.
Clark, R. P., and S. G. Shirley (1973), Identification of Skin in Airborne Particulate Matter,
Nature, 246(5427), 39-40, doi:10.1038/246039a0.
Dai, T., G. Bai, and G. F. Anderson (2020), PPE Supply Chain Needs Data Transparency and
Stress Testing, Journal of General Internal Medicine, 35(9), 2748-2749, doi:10.1007/s11606-
020-05987-9.
Drewnick, F., J. Pikmann, F. Fachinger, L. Moormann, F. Sprang, and S. Borrmann (2021),
Aerosol filtration efficiency of household materials for homemade face masks: Influence of
material properties, particle size, particle electrical charge, face velocity, and leaks, Aerosol
Science and Technology, 55(1), 63-79, doi:10.1080/02786826.2020.1817846.
Fairbanks, G. (1960), Voice and Articulation Drillbook, 2nd ed., 234 pp., Harper and Row, New
York.
Flagan, R. C., and J. H. Seinfeld (1988), Removal of particles from gas streams, in
Fundamentals of air pollution engineering, edited, pp. 391-478, Prentice-Hall, Englewood Cliffs,
N.J.
Gandhi, M., and L. C. Marr (2021), Uniting Infectious Disease and Physical Science Principles
on the Importance of Face Masks for COVID-19, Med, 2(1), 29-32,
doi:10.1016/j.medj.2020.12.008.
Gregson, F. K. A., et al. (2021), Comparing aerosol concentrations and particle size distributions
generated by singing, speaking and breathing, Aerosol Science and Technology, 1-15,
doi:10.1080/02786826.2021.1883544.
Grinshpun, S. A., H. Haruta, R. M. Eninger, T. Reponen, R. T. McKay, and S.-A. Lee (2009),
Performance of an N95 Filtering Facepiece Particulate Respirator and a Surgical Mask During
Human Breathing: Two Pathways for Particle Penetration, Journal of Occupational and
Environmental Hygiene, 6(10), 593-603, doi:10.1080/15459620903120086.
Gupta, J. K., C.-H. Lin, and Q. Chen (2010), Characterizing exhaled airflow from breathing and
talking, Indoor Air, 20(1), 31-39, doi:10.1111/j.1600-0668.2009.00623.x.
Hallett, S., F. Toro, and J. V. Ashurst (2020), Physiology, Tidal Volume, in StatPearls
[Internet], edited, p. https://www.ncbi.nlm.nih.gov/books/NBK482502/, StatPearls Publishing,
Treasure Island, FL.
Holmberg, E. B., R. E. Hillman, and J. S. Perkell (1988), Glottal airflow and transglottal air
pressure measurements for male and female speakers in soft, normal, and loud voice, The
Journal of the Acoustical Society of America, 84(2), 511-529, doi:10.1121/1.396829.
Hospodsky, D., J. Qian, W. W. Nazaroff, N. Yamamoto, K. Bibby, H. Rismani-Yazdi, and J.
Peccia (2012), Human Occupancy as a Source of Indoor Airborne Bacteria, PLoS One, 7(4),
e34867, doi:10.1371/journal.pone.0034867.
Howard, J., et al. (2021), An evidence review of face masks against COVID-19, Proceedings of
the National Academy of Sciences, 118(4), e2014564118, doi:10.1073/pnas.2014564118.
Jiang, J. J., R. B. Hanna, M. V. Willey, and A. Rieves (2016), The Measurement of Airflow
Using Singing Helmet That Allows Free Movement of the Jaw, Journal of Voice, 30(6), 641-
648, doi:https://doi.org/10.1016/j.jvoice.2015.07.018.
Kim, J.-H., S. M. Benson, and R. J. Roberge (2013), Pulmonary and heart rate responses to
wearing N95 filtering facepiece respirators, American Journal of Infection Control, 41(1), 24-27,
doi:10.1016/j.ajic.2012.02.037.
Kwon, S.-B., J. Park, J. Jang, Y. Cho, D.-S. Park, C. Kim, G.-N. Bae, and A. Jang (2012), Study
on the initial velocity distribution of exhaled air from coughing and speaking, Chemosphere,
87(11), 1260-1264, doi:10.1016/j.chemosphere.2012.01.032.
Lindblom, B., and J. Sundberg (2007), The Human Voice in Speech and Singing, in Springer
Handbook of Acoustics, edited by T. Rossing, Springer, New York, NY, doi:10.1007/978-0-387-
30425-0_16.
Lindsley, W. G., et al. (2021), A comparison of performance metrics for cloth masks as source
control devices for simulated cough and exhalation aerosols, Aerosol Science and Technology, 1-
18, doi:10.1080/02786826.2021.1933377.
Miller, S. L., W. W. Nazaroff, J. L. Jimenez, A. Boerstra, G. Buonanno, S. J. Dancer, J.
Kurnitski, L. C. Marr, L. Morawska, and C. Noakes (2021), Transmission of SARS-CoV-2 by
inhalation of respiratory aerosol in the Skagit Valley Chorale superspreading event, Indoor Air,
31, 314-323, doi:10.1111/ina.12751.
Oberg, T., and L. M. Brosseau (2008), Surgical mask filter and fit performance, American
Journal of Infection Control, 36(4), 276-282, doi:10.1016/j.ajic.2007.07.008.
Occupational Safety and Health Administration (2004), Fit Testing Procedures (Mandatory), in
Occupational Safety and Health Standards, Personal Protective Equipment, edited.
OSHA (2021), Permissible Exposure Limits – Annotated Tables,
https://www.osha.gov/annotated-pels/table-z-1, Accessed: 8 July 2021.
Pan, J., C. Harb, W. Leng, and L. C. Marr (2021), Inward and outward effectiveness of cloth
masks, a surgical mask, and a face shield, Aerosol Science and Technology, 55(6), 718-733,
doi:10.1080/02786826.2021.1890687.

Rhee, M. S. M., C. D. Lindquist, M. T. Silvestrini, A. C. Chan, J. J. Y. Ong, and V. K. Sharma
(2021), Carbon dioxide increases with face masks but remains below short-term NIOSH limits,
BMC Infectious Diseases, 21(1), 354, doi:10.1186/s12879-021-06056-0.
Roberge, R. J., J.-H. Kim, and S. Benson (2012), N95 Filtering Facepiece Respirator Deadspace
Temperature and Humidity, Journal of Occupational and Environmental Hygiene, 9(3), 166-171,
doi:10.1080/15459624.2012.660428.
Rothamer, D. A., S. Sanders, D. Reindl, and T. H. Bertram (2021), Strategies to minimize
SARS-CoV-2 transmission in classroom settings: Combined impacts of ventilation and mask
effective filtration efficiency, medRxiv, 2020.2012.2031.20249101,
doi:10.1101/2020.12.31.20249101.
Rubin, H. J., M. LeCover, and W. Vennard (1967), Vocal Intensity, Subglottic Pressure and Air
Flow Relationships in Singers, Folia Phoniatrica et Logopaedica, 19(6), 393-413,
doi:10.1159/000263170.
Saeidi, R., I. Huhtakallio, and P. Alku (2016), Analysis of Face Mask Effect on Speaker
Recognition, paper presented at INTERSPEECH 2016, International Speech Communication
Association, San Francisco.
Scheid, J. L., S. P. Lupien, G. S. Ford, and S. L. West (2020), Commentary: Physiological and
Psychological Impact of Face Mask Usage during the COVID-19 Pandemic, International
Journal of Environmental Research and Public Health, 17(18), 6655.
Shakya, K. M., A. Noyes, R. Kallin, and R. E. Peltier (2017), Evaluating the efficacy of cloth
facemasks in reducing particulate matter exposure, Journal of Exposure Science &
Environmental Epidemiology, 27(3), 352-357, doi:10.1038/jes.2016.42.
Smith, C. L., J. L. Whitelaw, and B. Davies (2013), Carbon dioxide rebreathing in respiratory
protective devices: influence of speech and work rate in full-face masks, Ergonomics, 56(5),
781-790, doi:10.1080/00140139.2013.777128.
Taylor, S., and G. J. G. Asmundson (2020), Negative attitudes about facemasks during the
COVID-19 pandemic: The dual importance of perceived ineffectiveness and psychological
reactance, medRxiv, 2020.2011.2017.20233585, doi:10.1101/2020.11.17.20233585.
Xu, M., Z. Lei, and J. Yang (2015), Estimating the Dead Space Volume Between a Headform
and N95 Filtering Facepiece Respirator Using Microsoft Kinect, Journal of Occupational and
Environmental Hygiene, 12(8), 538-546, doi:10.1080/15459624.2015.1019078.

9 Figure Captions
Figure 1. (a) Top and bottom view of the singing mask. (b) (top) Images of one participant
wearing a surgical mask and wearing the singing mask. (bottom) Overlaid images of the
participant with the surgical mask and with a singing mask to illustrate the increased mask-face
material separation in the singing mask. The images in (b) were modified from the originals
using the “glow edges” artistic effect in Microsoft PowerPoint to accentuate the mask edges and
to overlay an image of the participant with no mask. Informed consent was obtained.
Figure 2. (a) Schematic of sampling setup for measuring the influence of the filter-face
separation distance on the filtration efficiency of a fibrous filter. (b) Filtration efficiency
measured as a function of the filter-face distance measured for one participant in triplicate where
the filtration material was the outer-layer of surgical mask #1. Fits correspond to a simple power
law and a full expression that distinguishes particle loss mechanisms. (c) Measured particle size
distributions for no filter (black) and for a fibrous filter (colors) with the participant speaking the
Rainbow Passage at varying distances filter-face separation distances. (d) The size-dependent
filtration efficiency as a function of the filter-face separation distance, for different size bins
indicated with the gray vertical lines in (c).
Figure 3. (left axis) Bars showing the observed particle emission rates for one participant singing
Ode to Joy with no mask, or a homemade cloth two-layer or three-layer pleated mask made of the
same material as the singing mask, a modified singing mask having no bottom opening, the
standard singing mask, a commercial cloth mask either without (FDPM) or with (FDPM(N95)) an
N95 insert, either of two different surgical masks, or an N95 respirator (3M), as measured in the
forward (through-mask) position. Note that jaw movement was substantially restricted with the
non-singing masks, especially the N95 respirator. Three repeats were performed and error bars are
1 geometric standard deviations. The reported emission rates have not been corrected for flow.
(right axis) The associated reduction efficiency for exhaled particles sampled in the forward
(through mask) direction (black points).
Figure 4. (a) The through-mask (forward) particle emission rates normalized to no mask (left
axis) or the corresponding reduction efficiency (right axis) observed for participants while
wearing the singing mask for speaking or singing either the Ode to Joy or a song chosen by the
participant. Closed colored circles in (a) indicate unique individuals while open gray circles
indicate repeats by one individual. (b) Normalized particle emission rates for participants
speaking while wearing a surgical mask (original data from Cappa et al. [2021]). Note that the
participants in (a) differ from those in (b). Box and whisker plots show the median, 25th/75th
percentile, and 10th/90th percentile.
Figure 5. (a) Particle emission rates normalized to no mask wearing for singing Ode to Joy for
the different orientations while wearing the singing mask. (b) The overall mask efficiency while
singing Ode to Joy with the singing mask, accounting for leakage flows, colored by participant
(circles). Uncertainty bars on individual points indicate 1 determined from Monte Carlo
simulations. The red square is the average across all measurements and the blue triangle the

average after combining replicate measurements from one participant. Closed circles in (a) and
(b) indicate unique individuals while open circles indicate repeats by one individual. (c) Overall
efficiency for speaking with a surgical mask including leakage flows (solid points) or assuming
all flow passes through the mask, i.e., zero leakage flows and perfect sealing (open points).
Original data from Cappa et al. [2021], but reprocessed here for individuals. Note that the
participants in (a,b) differ from those in (c). Box and whisker plots show the median, 25th/75th
percentile, and 10th/90th percentile.
Figure 6. Time-series of particle concentrations measured using a CPC for room air (solid black
line), sampled inside the singing mask worn intentionally loose around the neck (blue circles), and
when sampled inside the mask when worn tightly as designed (gold triangles). The right axis shows
the approximate mask efficiency based on comparison with the mean room air concentration.
Figure 7. (a) CO2 and (b) O2 concentrations along with (c) relative humidity and (d) temperature
measured in the deadspace of the singing mask during speaking (red) and singing (blue) and in the
deadspace of a KN95 respirator during speaking (gold), compared with that for room air (black
line) and in typical exhaled air (gray band). Dashed versus solid lines differentiate replicates.

Figures
Figure 1
(a) Top and bottom view of the singing mask. (b) (top) Images of one participant wearing a surgicalmask and wearing the singing mask. (bottom) Overlaid images of the participant with the surgical maskand with a singing mask to illustrate the increased mask-face material separation in the singing mask.The images in (b) were modi�ed from the originals using the “glow edges” artistic effect in MicrosoftPowerPoint to accentuate the mask edges and to overlay an image of the participant with no mask.Informed consent was obtained.

Figure 2
(a) Schematic of sampling setup for measuring the in�uence of the �lter-face separation distance on the�ltration e�ciency of a �brous �lter. (b) Filtration e�ciency measured as a function of the �lter-facedistance measured for one participant in triplicate where the �ltration material was the outer-layer ofsurgical mask #1. Fits correspond to a simple power law and a full expression that distinguishes particleloss mechanisms. (c) Measured particle size distributions for no �lter (black) and for a �brous �lter(colors) with the participant speaking the Rainbow Passage at varying distances �lter-face separationdistances. (d) The size-dependent �ltration e�ciency as a function of the �lter-face separation distance,for different size bins indicated with the gray vertical lines in (c).

Figure 3
(left axis) Bars showing the observed particle emission rates for one participant singing Ode to Joy withno mask, or a homemade cloth two-layer or three-layer pleated mask made of the same material as thesinging mask, a modi�ed singing mask having no bottom opening, the standard singing mask, acommercial cloth mask either without (FDPM) or with (FDPM(N95)) an N95 insert, either of two differentsurgical masks, or an N95 respirator (3M), as measured in the forward (through-mask) position. Note thatjaw movement was substantially restricted with the non-singing masks, especially the N95 respirator.Three repeats were performed and error bars are 1sigma geometric standard deviations. The reportedemission rates have not been corrected for �ow. (right axis) The associated reduction e�ciency forexhaled particles sampled in the forward (through mask) direction (black points).

Figure 4
(a) The through-mask (forward) particle emission rates normalized to no mask (left axis) or thecorresponding reduction e�ciency (right axis) observed for participants while wearing the singing maskfor speaking or singing either the Ode to Joy or a song chosen by the participant. Closed colored circles in(a) indicate unique individuals while open gray circles indicate repeats by one individual. (b) Normalizedparticle emission rates for participants speaking while wearing a surgical mask (original data from Cappaet al. [2021]). Note that the participants in (a) differ from those in (b). Box and whisker plots show themedian, 25th/75th percentile, and 10th/90th percentile.

Figure 5
(a) Particle emission rates normalized to no mask wearing for singing Ode to Joy for the differentorientations while wearing the singing mask. (b) The overall mask e�ciency while singing Ode to Joywith the singing mask, accounting for leakage �ows, colored by participant (circles). Uncertainty bars onindividual points indicate 1 determined from Monte Carlo simulations. The red square is the averageacross all measurements and the blue triangle the average after combining replicate measurements fromone participant. Closed circles in (a) and (b) indicate unique individuals while open circles indicaterepeats by one individual. (c) Overall e�ciency for speaking with a surgical mask including leakage �ows(solid points) or assuming all �ow passes through the mask, i.e., zero leakage �ows and perfect sealing(open points). Original data from Cappa et al. [2021], but reprocessed here for individuals. Note that theparticipants in (a,b) differ from those in (c). Box and whisker plots show the median, 25th/75th percentile,and 10th/90th percentile.
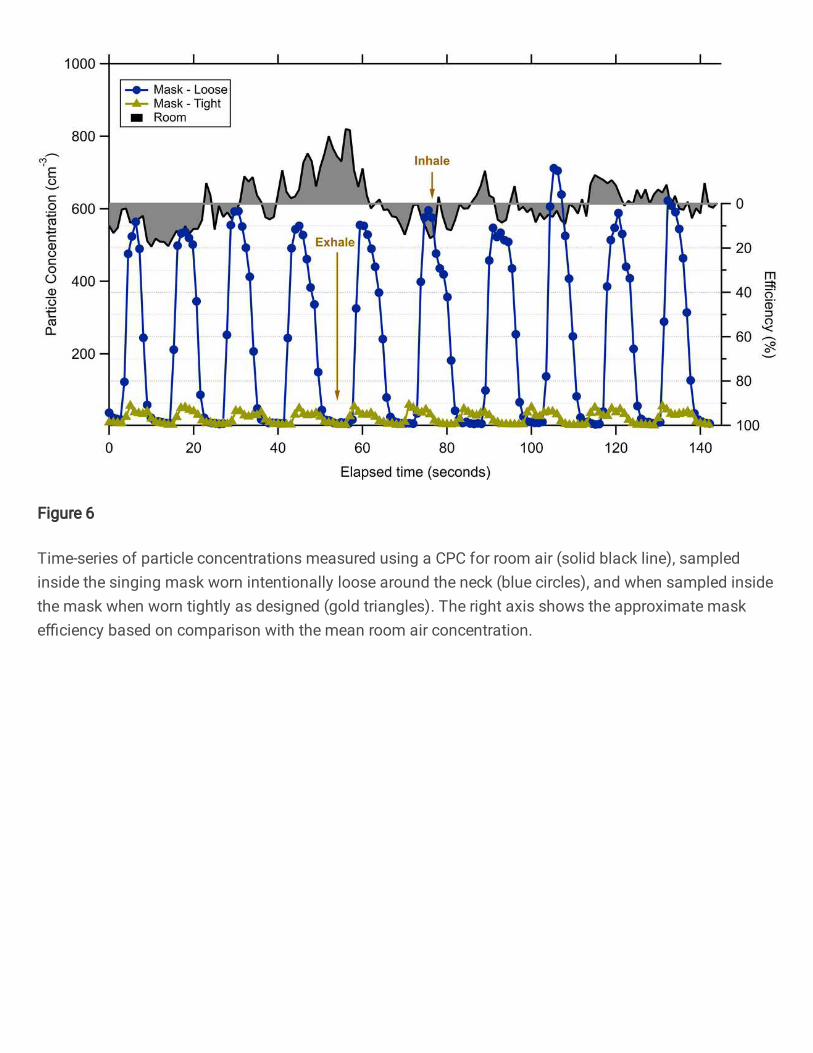
Figure 6
Time-series of particle concentrations measured using a CPC for room air (solid black line), sampledinside the singing mask worn intentionally loose around the neck (blue circles), and when sampled insidethe mask when worn tightly as designed (gold triangles). The right axis shows the approximate maske�ciency based on comparison with the mean room air concentration.

Figure 7
(a) CO2 and (b) O2 concentrations along with (c) relative humidity and (d) temperature measured in thedeadspace of the singing mask during speaking (red) and singing (blue) and in the deadspace of a KN95respirator during speaking (gold), compared with that for room air (black line) and in typical exhaled air(gray band). Dashed versus solid lines differentiate replicates.
Supplementary Files
This is a list of supplementary �les associated with this preprint. Click to download.
OperaMasksR3SuppMatFinal.pdf