A Guide for Ecological Risk Assessment of the Effects of ... · A Guide for Ecological Risk...
79
A Guide for Ecological Risk Assessment of the Effects of Commercial Fishing (ERAEF) SR644 ISBN No. 978-1-906634-50-6
Transcript of A Guide for Ecological Risk Assessment of the Effects of ... · A Guide for Ecological Risk...

A Guide for Ecological Risk Assessment of the Effects of Commercial Fishing (ERAEF)
SR644
ISBN No. 978-1-906634-50-6

1
A Guide for Ecological Risk Assessment of the Effects of Commercial Fishing
(ERAEF)
Prepared
for the
Sea Fish Industry Authority, Grimsby
by
John Cotter1 and William Lart2
Version: 1 March 2011
1. FishWorld Science Ltd, 57 The Avenue, Lowestoft NR33 7LH, United Kingdom
Tel. +44 (0) 1502 564 541, email: [email protected]
2. Sea fish Industry Authority, Origin Way, Europarc, Grimsby DN37 9TZ, United Kingdom
Tel. +44 (0) 1472 252 323, email: [email protected]

Ecological risk assessment for the effects of fishing (ERAEF)
2
Acknowledgements
The early part of this work was carried out through a Seafish staff Bursary, which enabled William Lart to travel to Sri Lanka to investigate the use of risk assessment techniques in fisheries. Prior to departure, Andy Hough of Moody Marine Ltd1 introduced risk assessment methods and Alistair Hobday of CSIRO2, Hobart provided a copy of Hobday et al (2007).
The authors would like to thank Erwin Rathnaweera, his staff and at Practical Action3, Sri Lanka who were invaluable during the early stages of this project. Prasantha Pathinagodage also provided inspiration and translation services.
1 www.moodyint.com/mcs‐marine.htm 2 www.csiro.au 3 www.practicalaction.org

Ecological risk assessment for the effects of fishing (ERAEF)
3
Table of Contents
Summary ....................................................................................................................................................... 8
Introduction ................................................................................................................................................ 11
Background to ERAEF .............................................................................................................................. 12
Ecological risk assessment for effects of fishing (ERAEF)........................................................................... 15
1. Form an ERAEF steering group ........................................................................................................... 15
2. Decide top‐level policy goals .............................................................................................................. 18
2.1 International sources for ecological goals .................................................................................. 19
2.2 Scientific sources for ecological goals ......................................................................................... 20
2.2.1 Foodweb effects .................................................................................................................. 20
2.2.2 Loss of biodiversity .............................................................................................................. 22
2.2.3 Protected Endangered and Threatened species ................................................................. 22
2.2.4 Habitat damage ................................................................................................................... 22
2.2.5 Ghost fishing by lost nets .................................................................................................... 22
2.2.6 Maintenance of size structure of selected species ............................................................. 22
2.2.7 Maintenance of ecological functions and services ............................................................. 23
2.3 Summarised possibilities for ecological goals ............................................................................. 24
3. Define the fishery and any external activities .................................................................................... 26
4. Choose ecosystem components ......................................................................................................... 32
5. Choose attributes of ecosystem components .................................................................................... 38
6. Agree operational objectives (OOs) for all ecosystem components .................................................. 41
7. Identify possible effects of fishing and other agents of change ......................................................... 43
8. Risk screening: Scale, Intensity, and Consequence Analysis (SICA) .................................................... 49
8.1 Precautionary approach .............................................................................................................. 49
8.2 SICA preliminaries ....................................................................................................................... 50
8.3 SICA steps .................................................................................................................................... 51
8.4 Discussion of SICA screening results .......................................................................................... 53
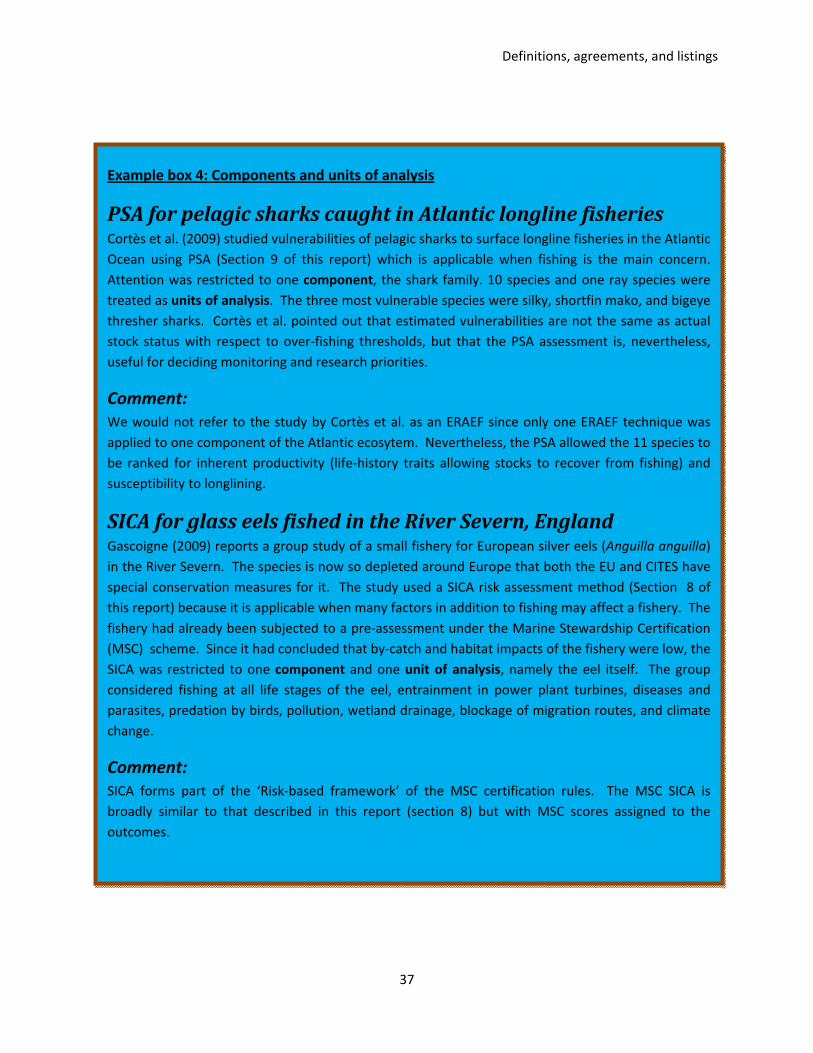
9. Higher risks: Productivity and Susceptibility Analysis (PSA) ............................................................... 55
9.1 PSA for target, non‐target, impacted, discarded, and PET species ............................................ 56

Ecological risk assessment for the effects of fishing (ERAEF)
4
9.1.1 Productivity of species ........................................................................................................ 56
9.1.2 Susceptibility of species ...................................................................................................... 57
9.2 PSA for habitat types ................................................................................................................... 63
9.2.1 Productivity of habitat types ............................................................................................... 63
9.2.2 Susceptibility of habitat types ............................................................................................. 64
9.3 PSA for Community types ........................................................................................................... 67
9.3.1 Productivity of community types ........................................................................................ 67
9.3.2 Susceptibility of community types ...................................................................................... 67
10. Further assessment for the most serious risks ............................................................................... 68
11. Actions following an ERAEF ............................................................................................................. 70
References .................................................................................................................................................. 72
Further files including a prototype spreadsheet for an EREAF can be found on the Seafood Information Network at the following location
http://sin.seafish.org/portal/site/sin/collaboration/index.jsp?epi‐content=COLLAB_HOST&oid=folder‐1.11.39294
You will need to register on the Seafood Information Network to enable access to this location. Registration is free and takes about 24 hours. Please go to
http://sin.seafish.org/portal/site/sin/
to register.
Practical examples of the application of ERAEF processes (or similar) to fisheries of the United Kingdom and elsewhere are given as ‘Example Boxes’ and tables for illustrative purposes. The text and data in these boxes, tables and prototype spreadsheets referred to above, were prepared by the authors and should not be presumed to have any official or approved status.

Ecological risk assessment for the effects of fishing (ERAEF)
5
Example Boxes
Example box 1: A fishery steering group .................................................................................................... 17
Clyde fisheries development group ................................................................................................ 17
Example box 2: Goals for an ERAEF ............................................................................................................ 24
The EAF‐Nansen Project ................................................................................................................. 24
Example box 3: A fishery description .......................................................................................................... 31
Faeroese inshore otter trawl fishery (4T) ....................................................................................... 31
Example box 4: Components and units of analysis ..................................................................................... 37
PSA for pelagic sharks caught in Atlantic longline fisheries ........................................................... 37
SICA for glass eels fished in the River Severn, England .................................................................. 37
Example box 5: Attributes, operational objectives (OOs), and indicators .................................................. 40
English western Channel otter trawl fishery .................................................................................. 40
Example box 6: Identifying possible effects of the activities of fishing and other agents .......................... 48
Longlining for tuna and swordfish species ..................................................................................... 48
Example box 7: Scale, Intensity, and Consequence Analysis (SICA) ........................................................... 54
English western Channel otter trawl fishery .................................................................................. 54
Example box 8: Productivity and Susceptibility Analysis (PSA) for fished species .................................... 61
Sri Lankan shortline fishery ............................................................................................................ 61
Example box 9: Productivity and Susceptibility Analysis (PSA) for a habitat ............................................ 66
English western Channel otter trawl fishery .................................................................................. 66

Ecological risk assessment for the effects of fishing (ERAEF)
6
Tables
Table 1. Check list of items to include when documenting a fishery ........................................................ 28
Table 2. Categories of benthic substrate proposed for classifying benthic habitats ................................. 34
Table 3. Categories of geomorphic form proposed for classifying benthic habitats ................................. 34
Table 4. Categories of non‐mobile benthic life forming physical structure ............................................... 35
Table 5. Attributes of the units (species, or types of habitat or community)............................................ 38
Table 6. Illustrative examples of operational objectives and indicators ................................................... 42
Table 8. Suggested logarithmic (multiplicative) scoring scheme for the spatial scale of an activity. ........ 51
Table 9. Scoring scheme for the temporal scale of an activity. ................................................................. 51
Table 10. Scoring scheme for the intensity of an activity. ......................................................................... 52
Table 11. Scoring scheme for the consequence of an activity ................................................................... 52
Table 15. Attributes of a species that signal a high ability for a population to recover (‘productivity’) ... 56
Table 12. Risk of a species living as isolated subpopulations because of natural barriers to dispersal .... 58
Table 13. Example case of two‐way categorisation of habitats and depth zones ...................................... 59
Table 14. Rough‐and‐ready estimation of the risk of selection .................................................................. 59
Table 15. Examples of sources of information on marine habitats around UK and Europe ...................... 70

Ecological risk assessment for the effects of fishing (ERAEF)
7
Figures
Figure 1. Flow diagram for Ecological Risk Assessment for Effects of Fishing (ERAEF) ............................. 10
Figure 2. Possible membership of the steering group of an ERAEF. .......................................................... 16
Figure 3. Likely sources for forming the top‐level policy goals for an ERAEF. ........................................... 19
Figure 4. The “trophic triangle”. ................................................................................................................ 21
Figure 5. Likely sources of information for describing the fishery ............................................................. 27
Figure 6. Scheme for specifying and identifying the components, units, and attributes .......................... 36
Figure 7. Flow diagram explaining the setting of operational objectives .................................................. 41
Figure 8. Part of a hazard matrix ................................................................................................................ 44
Figure 9. Hierarchical holographic model (HMM) of a fishery. .................................................................. 45
Table 7. Check‐list of possible effects of commercial fishing .................................................................... 46
Figure 10. Setting consequence scores in a scale, intensity, and consequence analysis (SICA). ............... 50
Figure 11. Scheme for carrying out a Productivity and Susceptibility analysis (PSA) on species .............. 56

Summary of ERAEF
8
Summary
Ecological risk assessment for effects of fishing (ERAEF) is a procedure for identifying and prioritising the risks posed to marine ecosystems by commercial fisheries. Available scientific resources can then be focussed on the most pressing ecological problems and the most urgent needs for information. ERAEF can form a stepping stone to full certification of a fishery or, by itself, can benefit sustainability and environmental status, thereby enhancing security of fishery income and making fish products more attractive to environmentally sensitive consumers. The time and effort needed for an ERAEF are flexible, ranging from a quick check of the productivity and susceptibility of principal target species, to a wide‐ranging and systematic review by one or more specialised working groups of all macro species, their habitats and communities. Those controlling the fishery must decide at the outset what sort of a compromise between short‐term income and pristine ecosystem they are aiming for. The decision will affect the amount of work needed to complete the ERAEF, the amount of corrective action needed subsequently, as well as the credibility of the overall process to consumers of fish, green critics of the fishery, and officials seeking compliance with national and international guidance and regulations, particularly those encouraging an ecosystem approach to fisheries management.
A flow diagram for the ERAEF process set out by this document is given in figure 1. Briefly, the stages of a full assessment, with special terms shown bolded at first mention, are:
1. Define and agree: a. the precise nature of the ecosystem, fisheries, and any other agents of change to be
considered; b. the top‐level goals of management; c. the components (i.e. partitioning) of the ecosystem to be considered for the ERAEF, e.g.
as target species, discards, rare species, habitats, and communities; 2. List:
a. all of the possible activities and effects of fishing and other agents of change; b. all species, habitat types, community types, and any other units of analysis for the
agreed ecosystem components; c. the attributes of the units that might be affected by fishing or other agents e.g.
population size, size composition, biodiversity, ecosystem services; d. the operational objectives (OOs) for the attributes of the units. The OOs should flow
from the overall management goals for the fishery, must be amenable to monitoring, and should be attainable within reasonable time periods.
3. For a Scale, intensity and consequence analysis (SICA), find the plausible worst case for each ecosystem component by prioritising:
a. the most sensitive units of the ecosystem components; b. the most relevant activities of the fishery and other agents; c. the attributes and associated OOs most likely to be affected by those activities.
4. Also for the SICA, score from 1 to 6 (i.e. from undetectable to extreme): a. the spatial and temporal scales of the activities;

Summary of ERAEF
9
b. the intensities of the activities based on the spatial and temporal scores of 4(a); c. the likely consequences of the relevant activities on attainment of the critical OOs for
the sensitive units. 5. For a Productivity and Susceptibility analysis (PSA) of all the units of the components scored at 3 or
more by the SICA: a. estimate and score (from 1 to 3) the productivities of the units (meaning their abilities
to recover from fishing) based on life‐history or other appropriate features of the units; b. estimate and score (from 1 to 3) the susceptibilities of the units to the activities based
on knowledge of the fishery; c. plot the scores for productivities and susceptibilities on a graph; d. estimate the Euclidean (Pythagorean) distances from the origin of the graph to the
plotted points to reveal the units at relatively low, medium, and high risks or vulnerabilities from the fishery.
6. For units at above an agreed level of risk, for example high or medium risk, undertake further research to clarify the risks and decide the most appropriate mitigating measures. The research might include new observations, surveys, literature review, stock assessment, modelling, etc.
7. The ERAEF is likely to need repetition at intervals to check whether any risks were wrongly estimated, and to assess new information or circumstances, e.g. changing patterns of fishing effort. There are also ongoing requirements to monitor progress towards operational objectives and, thus, the effectiveness of corrective actions.
If at any stage there is insufficient information to proceed, a high level of risk is assigned by default. This is consistent with the precautionary approach to fisheries management and serves as a stimulus for research where it is needed.
In addition to presenting ERAEF theory, this document also gives very brief reports of practical experiences of ERAEF procedures both in the United Kingdom and elsewhere around the world.

Summary of ERAEF
10
Figure 1. Flow diagram for Ecological Risk Assessment for Effects of Fishing (ERAEF) as described in this guide. The stages bracketed (left) are (1) Definitions, agreements, and listings; (2)
Scale, Intensity, and Consequence Analysis (SICA); and (3) Productivity and Susceptibility Analysis (PSA).

Definitions, agreements, and listings
11
Introduction
Risk assessment involves systematically trying to foresee all the things that can possibly go wrong with a business or task, than planning to minimise the interruptions or damage that they might cause. Risks are prioritised: small but likely problems receive high priority, as do unlikely but potentially catastrophic events, but trivial issues are identified and set aside early without wasting time on them. Risk assessment procedures have been widely applied in finance, commerce, engineering, health, and many other fields including fisheries (Francis and Shotton, 1997). Assessing the risks to ecosystems posed by man’s activities is known as ecological risk assessment (ERA4)(Burgman, 2005).
ERA for effects of fishing (ERAEF) looks at the effects of fishing on marine (or freshwater) ecosystems. It assists focussing of scientific resources on the most pressing ecological problems linked to fishing and, thereby, offers an efficient route towards the ‘ecosystem approach to fisheries management’ (EAFM) (FAO, 2003, Pikitch et al., 2004, FAO, 2005b, Garcia and Cochrane, 2005, FAO, 2008). It could form a stepping stone to full certification of a fishery (Parkes et al., 2009) or, by itself, could benefit sustainability and environmental status, thereby enhancing the security of fishery income and making the fish products more attractive to environmentally sensitive consumers. An ERAEF also offers preparedness for new ecologically motivated regulations, and for critical non‐recommendations of fish products by conservation groups (FAO, 2005a, Parkes et al., 2009, Sainsbury, 2010).
The benefits achieved by an ERAEF will depend partly on who takes part. An ERAEF for a small fishery could be of much‐reduced value if a nearby, large fishery exerting the same types of effects does not collaborate. Similarly, the collaboration of industries undertaking waste disposal, mineral extraction, or other potentially injurious activities in the ecosystem is needed both for information and so that agreement can be sought on which industries are responsible for any effects identified. An ERAEF steering committee could include local businesses dependent on fishing, as well as critics of fishing. Doing so would allow disagreements to be aired and compromises sought at the beginning of the process, rather than later when it may be too late. A broadly representative committee is likely to improve the credibility and acceptability of the ERAEF report. Broad representation has also been found beneficial for fishery co‐management schemes generally (Medley, 2006, Motos and Wilson, 2006).
The time and effort needed for an ERAEF are flexible. For some immediate purposes, a quick check by a scientific individual of the productivity and susceptibility of targeted species may be helpful, e.g. for guidance within a merchant company on which landings to buy. For more formal, public circumstances, a wide ranging and systematic review using all the techniques outlined in this guidance document, perhaps involving one or more specialised working groups, might be needed. The credibility of an ERAEF will depend on its comprehensiveness, transparency, and technical authority.
Despite the presence of the word ‘ecological’ in the name, ERAEF is not a charter for green opponents of fishing. Those controlling the ERAEF must decide (or negotiate) where they want the fishery to be between short‐term cash generator at one end of the scale, and pristine ecosystem at the other.
4 Abbreviations and terms used in this document are shown bolded when introduced or recalled.

Definitions, agreements, and listings
12
Agreement might be reached by, first, finding consensus on generally worded, probably quite vague principles, then translating these into more specific, top‐level, policy ‘goals’. The goals, in turn, permit formulation of detailed, lower‐level operational objectives for the various critical units within the ecosystem. Progress towards attainment of the goals and operational objectives should be verifiable using appropriately designed indicators and monitoring.
The next subsection of this Introduction provides a short, historical perspective on ERAEF. The rest of the document is intended as a guide and a toolkit for ERAEF. First, some preliminary, general remarks are made about the ERAEF process. Then a sequence of tasks, ideas, and methods, mostly derived from the ERAEF system for Australian fisheries described by Hobday et al. (2007), is put forward. Their ideas are summarised, sometimes with modifications and additional information, but omitting detailed material only relevant in Australia. More recent developments of ERAEF exist (e.g. Zhou and Griffiths, 2008, e.g. Patrick et al., 2010) but they are hungrier for assumptions and technicalities, making them less suitable for inclusion in an introductory guide. A flow diagram and summary of the proposed ERAEF process can be found in the Summary above, and in figure 1. Practical examples of the application of ERAEF processes (or similar) to fisheries of the United Kingdom and elsewhere are given as ‘Example Boxes’ for illustrative purposes. The text and data in these boxes were prepared by the authors and should not be presumed to have any official or approved status.
Background to ERAEF
Risk analysis/assessment/management – it goes by various names – has been part of fisheries science since the 1990s (Francis and Shotton, 1997). The emphasis was on the risks to commercial stocks from high levels of fishing effort, and this remains an interest today (Fenichel et al., 2008, Anonymous, 2009, Sethi, 2010). Among the earliest to call for a broader perspective were Lane and Stephenson (1998) who suggested that fisheries be managed by integrating socio‐economic and ecological assessments with single‐species stock modelling using risk management and other analytical decision‐making techniques. The ‘ecosystem approach to fisheries management’ (EAFM) is consistent with this and has been widely accepted (FAO, 2005b, European_Parliament_and_Council, 2008, FAO, 2008, EC, 2009), though concensus on the appropriate decision‐making methods has not yet emerged clearly. The international roots of EAFM can be traced to the earlier and still‐relevant Code of Conduct for Responsible Fisheries (FAO, 1995).
Ecological risk assessment (ERA) attempts to prioritise the full range of risks to an ecosystem posed by an activity. Early applications were to land‐fill sites in the USA (EPA, 1998). A review of the extensive research effort applied to develop ERA in various fields is given by Burgman (2005). Leadership on the practical application of ERA to marine fisheries came from Australia as a response to national legislation (Commonwealth_of_Australia, 1992, Commonwealth_of_Australia, 2001, Smith et al., 2007) calling for “ecologically sustainable development”, meaning “development that meets the needs of the present without compromising the ability of future generations to meet their own needs”. Australian ecological objectives have at the highest level (Fletcher et al., 2005) the protection of biodiversity and the maintenance of essential ecological processes. For marine fisheries, this is interpreted to mean

Definitions, agreements, and listings
13
1. Retained species: what is the impact of the fishery on the species that the fishery wants to capture?
2. Non‐retained species: what is the impact of the fishery on species that are caught or directly impacted by the fishery but are never kept or used?
3. General ecosystem: what are the potential indirect and more general impacts of fishing – including effects on the habitat and trophic dynamics?
Astles (2008) reviewed the development of ERAs for Australian fisheries (ERAEFs) in response to their national legislation. Four approaches arose in connection with: (1) the extensive bycatch associated with prawn fisheries to the north of Australia (Milton, 2001, Stobutzki et al., 2001, Zhou and Griffiths, 2008); (2) ecological, social, and economic issues applicable to Australian wild‐capture fisheries generally (Fletcher, 2005, Fletcher et al., 2005); (3) demonstrating that fisheries are ecologically sustainable before grant of an export licence (Hobday et al., 2007); and (4) the specific requirements of the New South Wales state (Astles et al., 2006). Australian ERAEF methods have been accepted for use in New Zealand (Campbell and Gallagher, 2007), South Africa (Shannon et al., 2006, Anonymous, 2007), the United States (Rosenberg et al., 2007, Simpfendorfer et al., 2008, Patrick et al., 2010), the eastern Pacific (Olson et al., 2006), and the Atlantic (Cortès et al., 2009). However, some of these applications are restricted to the second‐level ‘Productivity and Susceptibility analysis’ (PSA) component of ERAEF which has been used to assess risks to individual species of fish without attempting to assess risks to the wider marine ecosystem. PSA has been developed further by e.g. Patrick et al. (2010), Zhou and Griffiths (2008), and Olson et al. (2006).
ERA is not without critics. Lackey (1997) writing generally, not just about fisheries, makes several points that are worth keeping in mind. They are summarised below.
1. The concept of the risk of an ‘adverse’ consequence of an event is not always definable in an ecological context since ecological change is not necessarily bad. This type of word is therefore best avoided in an ERA and replaced by the concept of ‘failure to meet agreed policy goals’.
2. However, care is needed to prevent ecological risks receiving inappropriate emphasis just because of the way that policy has been formulated, or because the search for risks was focussed where most information existed.
3. Ecological risk is not the only factor to consider when managing a process (such as a fishery); social, political, and economic factors may be important too. 3. ERA is just another management tool to go alongside cost‐benefit analysis, ecosystem modelling, geographic information systems, environmental impact assessment, and other
methods.

Definitions, agreements, and listings
14

Definitions, agreements, and listings
15
Ecological risk assessment for effects of fishing (ERAEF)
The following, numbered sections set out a staged approach for ERAEF. The main issues at each stage are summarised with citations of supporting literature and resources. A prescriptive attitude is intentionally avoided. This is because each fishery takes place in a different ecosystem, is subject to different legislation, and exists in different social, economic, and political circumstances. It is assumed that all fishers and everyone else involved with the ERAEF are willing participants. Additionally:
• Careful, preferably brief documentation (e.g. using tabular forms and cross‐referenced annexes) is essential at all stages for openness, public acceptability, and easy updating. Some of our tables and spreadsheets show examples of this.
• The focus is on ecological risks posed by the activities of fishing vessels. Fish stock assessments, and socio‐economic information, as may be needed for a fishery certification scheme for example, are not necessarily considered in an ERAEF, although they probably would be in follow‐up studies.
• ERAEF is a continuing process, not a one‐off task. Problems discovered have to be responded to and monitored accountably against agreed objectives (Fletcher et al., 2005). ERAEFs should be updated periodically, taking into account altered fishing strategies and new ecological issues that come to light.
• Management need not await completion of an ERAEF before responding to issues arising.
The following numbered sections describe a sequence of tasks for conducting a full ERAEF.
1. Form an ERAEF steering group The ERAEF process must be governed so as to agree decision mechanisms, policy goals, and financial allocations. The wider the representation on a steering group (SG), the more likely it is that the report of the ERAEF will be accepted and credible. The SG might therefore consist of fishers, distributors and retailers from the fishing industry, fishery partnership organisations, anyone else funding the ERAEF, interested non‐government organisations (NGOs) concerned with fisheries and conservation, government officials and/or scientists, and specialist advisors e.g. on gear technology, taxonomy, or ecology. Businesses dependent on maintenance of the fishery and marine ecosystem might also be represented on the SG, e.g. restaurants, hotels, tourism, fish‐processing equipment manufacturers, haulage companies, etc. They may not wish to contribute to the science but they are likely to have strong views on the long‐term yields of fish in terms of quality, weight and value. The ERAEF may cover an aquatic ecosystem that is fished by other fisheries, or is strongly affected by other activities, e.g. waste disposal and mineral extraction. Bringing representatives of those activities into the SG would obviously be the best solution if they will collaborate. They could contribute information about their industries and share responsibility for some of the effects identified. The possible membership and associations envisaged for an ERAEF steering group is diagrammed in figure 2.

Definitions, agreements, and listings
16
Burgman (2005, chapter 4) points out that every member of an ERA SG is likely to have strong incentives to argue one way or the other and, paradoxically, that this is one of the main strengths of ERA: that all issues are fully and personally discussed. This is better than leaving fundamental issues for decision by politicians having little contact with the people and ecosystem affected.
ERAEFs are likely to need specialists for advice on some technical issues. Burgman (2005, chapter 4) argues that technical ‘experts’ are often unreliable. Their qualifications for the job should not be taken for granted, and they should always be subjected to cross‐examination on controversial matters. The ‘Delphi’ method is one way to get the best from a group of specialists. The gist of it is that they first advise individually and privately. Then the group is shown the aggregated view and each differing individual is invited to revise his/her view towards the mean or concensus. Private, individual views can also be collected beneficially after a collective ‘brainstorming’ discussion. A simple method (cited by Burgman) for testing an over‐assertive expert is to ask them to explain ‘the reasons why they may be wrong’.
Meetings of the SG and any lower‐level workshops should always be minuted with disagreements explained if they cannot be resolved. The interests and skills of all those taking part should be declared.
Figure 2. Possible membership of the steering group of an ERAEF. Blue: Businesses and fisheries partnership organisations directly related to the fishery(‐ies) being assessed. Pink: political and legal representatives, mostly local. Green: scientists and special‐interest groups. Grey: other ecosystem users.
Fishers
Buyers
Retailers
Govt. officials
Advisers
Trans‐porters
Local businesses
NGOs
Other fishers
Other sea users
Mineral extractors
Conserv‐ationists
Waste disposers
Politicians
Partner‐ships

Definitions, agreements, and listings
17
Example box 1: A fishery steering group
Clyde fisheries development group This group, formed in 2004, consisted of three fishermen’s associations, a food producer’s federation, both statutory and non‐statutory nature conservation organisations, Seafish, and a university department. Its general aim was “to facilitate a brighter future for Clyde fisheries by encouraging fishermen, scientists, and organisations concerned with the environment to work together to develop the local fishery in a sustainable way.” Terms of reference included:
“………The Group’s purpose is to facilitate the sustainable development of the Clyde marine fisheries
The Group will promote research, development and extension activities in order to meet the goals of a profitable seafood industry, exploiting resources in a sustainable manner.”
The group has successfully undertaken an environmental review, and an assessment of the Nephrops fishery as part of Marine Stewardship Council certification, among other activities. See website www.gla.ac.uk/marinestation/CFDP/ for details.
Comment: The review was not called ‘ecological risk assessment’ but has been similar in
approach and purpose.

Definitions, agreements, and listings
18
2. Decide toplevel policy goals The initial focus of the SG should be on the outcomes wanted for the fishery (Fletcher et al., 2005). Since ecosystems are changing all of the time whether fished or not, it is necessary to decide in advance which ecological changes, reasonably attributable to activities of the fishery, are adverse and which are beneficial. It is also necessary to decide how much importance is to be attached to maintaining or improving financial income and employment from the fishery. A concensus on the general principles for, or purposes of the fishery must be sought by discussion and negotiation, remembering (if a reminder is needed) that everyone needs food and employment, no natural fish stocks can exist without a viable ecosystem, and that future generations also have rights to benefit from the same fishery and ecosystem in their lifetimes.
The agreed principles may be quite vague but, to create an effective ERAEF, they must be translated into a workable and agreed set of top‐level management objectives, or ‘goals’ as they are referred to here. Finding agreements may be helped if the goals do not completely address all of the general principles initially, but they should suffice to provide policy directions for the immediate future. Future goals can be decided later in the light of experience. The intention of having top‐level, policy goals is so that they can be interpreted by scientists as operational objectives (OOs) for every detailed component of the ecosystem without further, repetitious discussions of the basic principles in each case. Detail is not needed in the early discussions of goals. Nevertheless, goals should be worded so that progress towards them can be monitored and verified.
Ecological policy goals may follow automatically from national or international legislation or from other official guidance documents. Worthwhile goals may also be found in scientific papers and reports, or simply inferred from the attitudes of fish consumers. The generation of policy goals is illustrated diagrammatically in figure 3. The two subsections below make more detailed suggestions. A third subsection summarises options.

Definitions, agreements, and listings
19
Figure 3. Likely sources for forming the toplevel policy goals for an ERAEF. Abbreviations: FAO – Food and Agriculture Organization of the United Nations; RFMO – Regional fisheries
management organizations; MSY – Maximum sustainable yield; PET – Protected, endangered and threatened species.
2.1 International sources for ecological goals As already mentioned, Australian legislation calls for
• the protection of biodiversity and
• maintenance of essential ecological processes.
In Europe, the Marine Strategy Framework Directive (2008) states “The marine environment . . . . must be protected. . . . with the ultimate aim of maintaining biodiversity and providing diverse and dynamic oceans and seas which are clean, healthy and productive.” Paragraph 11 requires each European Member State “to develop a marine strategy for its own waters . . . designed to achieve or maintain good environmental status”, meaning among other things (from Annex 1 of that document) maintenance of biodiversity, habitats, safe biological limits, age, and size distributions for commercial fish stocks.
In the United States, the Magnuson‐Stevens Fishery Conservation and Management Act (1996) refers to the need for fishery management plans to assess and specify the maximum sustainable yield (MSY) for a

Definitions, agreements, and listings
20
stock, and to ensure the conservation and enhancement of essential fish habitat. As a comment on this, there are scientific reservations about MSY as a valid goal for an EAFM (Walters et al., 2005).
Documents prepared by the Food and Agriculture Organization of the United Nations (FAO) are relevant for setting ecological goals for fisheries in any part of the world. As examples, the Code of Conduct for Responsible Fisheries (FAO, 1995) states that “Recognizing that long‐term sustainable use of fisheries resources is the overriding objective of conservation and management,” (7.2.1)
• “(Fisheries) Management measures should not only ensure the conservation of target species but also of species belonging to the same ecosystem or associated with or dependent upon the target species.” (6.2)
• “Selective and environmentally safe fishing gear and practices should be further developed and applied, to the extent practicable, in order to maintain biodiversity and to conserve the population structure and aquatic ecosystems.” (6.6)
• “All critical fisheries habitats in marine and fresh water ecosystems, such as wetlands, mangroves, reefs, lagoons, nursery and spawning areas, should be protected and rehabilitated as far as possible and where necessary.” (6.8)
• Additionally, vessel operators should (among many practical measures) “fit energy optimization devices to their vessels” (8.6.2), fit “appropriate equipment as required by MARPOL5” (8.7.2), “minimize the taking aboard of potential garbage” (8.7.3), “reduce emissions of ozone depleting substances” (8.8.2), “refit existing vessels with alternative refrigerants to CFCs and HCFCs and alternatives to Halon in fire fighting installations” (8.8.4).
Other, later FAO documents enlarge on these ideas and confirm the international impetus for ecologically sustainable fishing with the minimum of discharges, lost gear, and pollution (FAO, 2003, FAO, 2005b, FAO, 2008). See also related papers (NRC, 1999, Garcia and Cochrane, 2005, Grieve and Short, 2007).
International sources for biodiversity‐related goals are the Rio Convention on Biological Diversity,
http://www.cbd.int/, and the International Union for the Conservation of Nature (IUCN, http://www.iucn.org/). See also related papers (Musick, 1999, Dulvy et al., 2004, Butchart et al., 2005, Dulvy et al., 2005, Reynolds et al., 2005).
2.2 Scientific sources for ecological goals Scientists have linked several changes in marine ecosystems with commercial fishing in its various forms. Aiming to restrict or minimise effects, such as the following, could provide politically acceptable ecological goals for management.
2.2.1 Foodweb effects One goal could be to restrict or minimise distortion of trophic 6 structure in the marine ecosystem. Many fisheries have the effect of reducing the numbers of predatory fish (Pauly et al., 1998, Myers and
5 MARPOL 73/78; The International Convention for the Prevention of Pollution from Ships, 1973 as modified by the protocol of 1978. 6 The trophic structure describes the feeding relationships within an ecosystem, such as predator prey

Worm, 20triangle’ wlower‐levof the triadown arepredated ‘trophic cfishing anFrank et Möllmannharvestedcommercoverwhel
Figure 4happentrianglealso redu
003, Pauly anwith top preel predators aangle. Remov released froand decline
cascades’, as nd are an actial., 2006, Dn et al., 2008)d at all levels ially, control med, resultin
. The “trophs when fishine is a speculatucing nutrien
d Watson, 20dators at theand grazers, aval of top prem predation e in abundanthey are calive research tDaskalov et a). Figure 4, bwithout distof nutrient inng in algal blo
hic triangle”ng removes aptive suggestiot inputs so th
005). Marine e apex (figurand so on dowedators flatteand tend to ince, with furtlled, have betopic (Pinnegal., 2007, Myottom right, storting trophinputs is implieoms.
”. Diagram opex predatorson of the conshat plants (=p
21
ecosystems re 4). They ewn to the verns the top ofincrease in abther, similar een identifiedgar et al., 200yers et al., 2suggests specic relationshied so that red
of a highly sims and causes sequences of phytoplankton
Defin
can be thougeat mid‐levelry simplest plf the triangle.bundance, spalternations
d in many se02, Pinnegar2007, Casiniculatively howps. Since phduced popula
mplified marina trophic casfishing all tron) are kept in
nitions, agreem
ght of simplistl predators wanktonic orga. Then speciepecies below ts down the feas and oceaet al., 2003, et al., 2008w a marine echytoplankton ations of grazi
ne foodweb scade. The lowophic levels sucheck by “bo
ments, and lis
tically as a ‘trwhich, in turnanisms at thees at the nextthat become food chain. ans in responFrank et al., 8, Daskalov, cosystem migare not harving species ar
tructure and wer right tropustainably whottom‐up” for
stings
rophic n, eat e base t level over‐Such
nse to 2005, 2008, ght be vested re not
what phic hilst rces.

Definitions, agreements, and listings
22
2.2.2 Loss of biodiversity Fishery managers may wish to limit any loss of biodiversity caused by fishing, in accordance with the Rio Convention on Biological Diversity (Anonymous, 1993). Loss of biodiversity through fishing is likely to result from the catch of untargeted species, many of which are discarded because of low market value. Most do not survive. Losses may also occur, possibly more seriously, as a result of damage to sea floor habitats.
2.2.3 Protected Endangered and Threatened species Protected, endangered, and threatened (PET, also known as TEP) species can be an issue for some fisheries. A classification of endangered, ‘red‐listed’ species is prepared by the International Union for the Conservation of Nature (IUCN, www.iucnredlist.org). Many seabirds are red‐listed partly because of their vulnerability to longlining (Bergin, 1997, Tasker et al., 2000, Onley and Scofield, 2007) though litter at sea can be lethal, and there can be other reasons for changing numbers of seabirds (Furness, 2003). Sea turtles are red‐listed partly because of vulnerability to various fishing gears and to litter. However, the IUCN is conservative about redlisting species for which there is inadequate information so as to prevent repeated false alarms. This is the case for many, now‐rare sharks, skates and rays (Dulvy and Forrest, 2010). Marine mammals (Shirihai and Jarrett, 2006), sea snakes (Milton, 2001) and, of course, some teleosts (bony fish) and invertebrates are also substantially reduced in numbers by commercial fishing in different ways. Consideration of any rare species encountered by a fishery could form an important part of an ERAEF.
2.2.4 Habitat damage Heavy fishing gear can damage the structure of the sea floor and the fauna attached to it (Watling, 2005). Aside from the loss of biodiversity, commercial fish species may also suffer through loss of shelter and food resources, and increased exposure to predators, particularly for juveniles.
2.2.5 Ghost fishing by lost nets Ghost fishing by lost and abandoned fishing nets can be a serious problem particularly for fixed nets (Breen, 1990, Kaiser et al., 1996, Erzini et al., 1997, MacMullen et al., 2003, Pawson, 2003, Sancho et al., 2003, Tschernij and Larsson, 2003, Brown and Macfadyen, 2007). A goal of reducing or preventing contamination of the sea by fishing nets, warps, and other heavy equipment may be achievable and worthwhile.
2.2.6 Maintenance of size structure of selected species Changing size structure of fish communities is a well‐known response to fishing (Jennings et al., 1999a, Bianchi et al., 2000, Daan et al., 2005, Piet and Jennings, 2005, Shin et al., 2005). Reducing average sizes of fish in a community can be linked with reducing trophic levels because large predators tend to be higher in the food chain than small. Also, a good age structure among target species assists sustainability of fishing by buffering poor recruitments. These are good reasons for providing some protection of the size structures of ecological communities as a goal for ERAEF.

Definitions, agreements, and listings
23
2.2.7 Maintenance of ecological functions and services Every marine ecosystem merits careful consideration to discover whether it is delivering any direct or indirect functions or services to man. They can be quite diverse, subtle, and extremely important (Worm et al., 2006). For examples: (i) Mangroves protect coasts from storm damage. (ii) Grazer species may be serving effectively to control algal blooms, themselves possibly a consequence of excessive nutrients in the water. (iii) Shellfish purify and clarify water, thereby creating a habitable environment for many other species, e.g. Chesapeake Bay (Breitburg and Riedel, 2005). (iv) Fishing, nature watching, and diving may provide a valuable magnet for tourists. Protection of ecosystem services could be an agreeable goal for an ERAEF.

Definitions, agreements, and listings
24
2.3 Summarised possibilities for ecological goals A check list of possible ecological goals for an ERAEF is:
• Comply with legislation applicable to marine ecology
• Maintain target stocks, possibly achieving MSY
• Protect/enhance biodiversity
• Protect PET species including birds, turtles, mammals
• Preserve/diversify trophic structure
• Preserve or increase the proportions of large fish
• Maintain ecological processes/services
• Minimise destruction of habitat
• Minimise discarding
• Minimise gear losses, ghost fishing
Example box 2: Goals for an ERAEF
The EAFNansen Project The subtitle of this project, see www.eaf‐nansen.org/nansen/en , explains its main purpose:
“Strengthening the Knowledge Base for and Implementing an Ecosystem Approach to Marine Fisheries in Developing Countries”
The agreed goals (our term) flowing from this were: 1. Fisheries should be managed to limit their impact on the ecosystem to an acceptable
level. 2. Ecological relationships between species should be maintained. 3. Management measures should be compatible across the entire distribution of the
resource. 4. Precaution in decision‐making and action is needed because the knowledge on
ecosystems is incomplete. 5. Governance should ensure both human and ecosystem well‐being and equity.
Comment: These goals appear fairly easy to agree but there could be much argument over whether or not they are being attained because the wording does not permit verification of progress towards achieving them. Nevertheless, they could support specific operational objectives (OOs). For example, goal 2 could spawn OOs referring to the demonstrable presence of named species, e.g. predator‐prey pairs forming part of the trophic structure of the ecosystem.

Definitions, agreements, and listings
25

Definitions, agreements, and listings
26
3. Define the fishery and any external activities The vessels, ports, markets, companies, Total Allowable Catches or other legal restrictions on the fishery, and distribution of landed fish should all be carefully described in an ERAEF report. Sources of information include the fishers themselves, fishery observers, official records, scientific reports, enforcement officers, etc. Information is also needed on other agents of change that are external to the fishery being assessed for risk, e.g. other fishing, mineral extraction, aquaculture, discharging of wastes.
The designs and methods of deployment of fishing gears should be described since some aspects may impact the ecosystem (Currie and Parry, 1996, Eleftheriou, 2000). Trawls are not the only gears needing documentation in this way. For example, leaders, hook types and baits can affect ecological effects of longlines (Kerstetter et al., 2007, Mejuto et al., 2008, Oldenberg et al., 2008, García‐Cortés et al., 2009, Ward et al., 2009), as may design features of set nets and traps. With any gear, special measures taken to avoid catching seabirds, turtles, mammals or other non‐target species should be described, citing references to tests of their effectiveness where possible.
Current or projected levels of effort should be specified as accurately as possible, preferably with maps, and showing seasonal variations. The ‘probability of fishing’ does not enter into an ERAEF. Instead all risks are estimated on the assumption that fishing will take place. It follows that readers of the ERAEF need to be told what the activities of the fishery actually are. A historical account of development of the fishery including time series of capacity and effort, and variations in the species targeted and gears used, would be of additional assistance for considering how ecological effects may have changed over time.
The task of defining the fishery and external activities is illustrated schematically in figure 5. The SG should decide whether the fishery is to be treated as one unit, or should be broken into sub‐fisheries with separate replication of all the ERAEF processes. Treating a heterogeneous fishery as one unit to save time could greatly reduce the reliability of the levels of risk estimated by an ERAEF. A check list for documenting a fishery is given in table 1. It is based on one given by Hobday et al. (2007, p. 13).

Definitions, agreements, and listings
27
Figure 5. Likely sources of information for describing the fishery and other agents of change (externalities) in the ecosystem.
Fishers
InterviewsRecordsCapacityGearsEffortHistory
ScientificDocumentsObserversFish surveysExternalities
Other factorsSocial factorsEconomics
etc.

Definitions, agreements, and listings
28
Table 1. Check list of items to include when documenting a fishery or subfishery for an ecological risk assessment, modified from Hobday et al. (2007). The need to have separate forms for subfisheries should be decided by the ERAEF steering group.
Fishery name: Total vessels and size range: Total geographic extent of fishery: Principal ports serving the fishery: Companies involved in catching, processing, and distributing fish: Estimated number of directly dependent jobs: Companies indirectly dependent on the fishery or marine ecosystem: Estimated number of indirectly dependent jobs: Other, unassessed fisheries in same region: Subfishery name:
Item Notes Vessels and size range: For the subfishery if different from the whole
fishery Geographic extent Identify region within total fishery region Effort Give annual fishing effort. Refer to separate charts
and tables if necessary to describe history of effort Seasons of operation Indicate spread of effort over the year Landed quantities of fish and 1st sale values Give recent and historical landed quantities and
values using charts or tables if necessary Gear Gear type Describe with drawings if necessary to show
details. Give, size, weight, number of hooks, etc Selectivity Describe size and species selectivity of gear and
method of fishing Fishing grounds Describe habitat where fishing takes place, e.g.
smooth/hard ground, pelagic. Fishing depths Give depth range in which gear is fished Fishing method Describe how gear is set/towed/hauled. Also
typical soak times. Lost gear Estimate losses of gear, success of retrievals,
effects of permanently lost gear, including warps and line

Definitions, agreements, and listings
29
Table 1 continued
Ecological effects Target species Give local and scientific names Biology of target species Describe what is known about the life cycles, size
and age structures, migrations, recruitment, nursery areas, etc., of target species
Retained bycatch species
Give local and scientific names
Biology of retained bycatch species
Describe what is known about the life cycles, size and age structures, migrations, recruitment, nursery areas, etc., of retained bycatch species
Discarded bycatch species
Give local and scientific names
Biology of discarded bycatch species
Describe what is known about the life cycles, size and age structures, migrations, recruitment, nursery areas, etc., of discarded bycatch species
PET species Give local and scientific names of protected, endangered, or threatened (PET) species impacted by the subfishery.
Biology of PET species Describe what is known about the life cycles, size and age structures, migrations, recruitment, nursery areas, etc., of PET species. How do they interact with the fishery?
Habitat Describe modifications to marine habitats caused by fishing currently or historically
Communities Describe modifications to marine communities (e.g. epibenthic, demersal fish) caused by fishing currently or historically
Discarding and offal Summarise quantities, species, and size structures of fish discarded at sea. Estimate quantities of offal discarded. When and where do these processes occur?
Definitions, agreements, and listings
30
Table 1 continued
Management Identity of management Who is responsible for the control of the
(sub)fishery? How are controls decided? Management objectives What are management currently trying to
achieve? Input controls Summarise controls on entry to the fishery, vessel
fishing capacities, fishing effort. Give history. Output controls Summarise controls on quota, bycatch, and
discarding, size limits, other catch restrictions. Give history.
Technical measures Summarise controls on gear, fishing methods, closed areas, closed times
Bycatch mitigation measures Summarise measures taken to reduce bycatch and to assist survival of discards.
Other controls on vessel activities Describe controls on steaming, garbage and offal disposal, and gaseous emissions
Enforcement Describe enforcement of the above controls. How effective is it?
Data Logbook data Describe how they are collected, transmitted and
used Observer data Describe observer programmes; cite reports Landings and survey data Summarise and cite reports Other studies Cite reports

Definitions, agreements, and listings
31
Example box 3: A fishery description
Faeroese inshore otter trawl fishery (4T) The table below illustrates table 1 (almost) completed for a seasonal, near‐shore fishery of the Faeroe Islands. Authoritative information on Faeroese fisheries can be found from the internet, e.g. from http://www.hagstova.fo/portal/page/portal/HAGSTOVAN/Statistics_%20Faroe_Islands , www.hav.fo, http://www.faroe.com/files/FO%20fisheries%20and%20aquaculture_0.pdf.
Fishery name: Faeroese otter trawl fisheriesSubfishery name: Lemon sole fishery, 4T
Item Responses Vessels and size range: 2010: 15 vessels up to 15 tonnes GRT
2008/9: 11 vessels 2007/8: 17 vessels . . . . . . .
Geographic extent 6 – 12 nm off the Faroe Islands Effort 2008/9: 1400 vessel‐days
2007/8: 1900 vessel‐days . . . . . . .
Seasons of operation June – August Landed quantities of fish and 1st sale values 2009: 280 t Mean 1993‐2009: 460 t
2008: 350 t . . . . . . .
Gear Gear type Otter trawl; see drawings (not available here) Selectivity 120 mm mesh Fishing grounds 6 – 12 nm offshore Fishing depths 100 – 200 m Fishing method Demersal otter trawling Lost gear Few trawls are lost Ecological effects Target species Lemon sole Biology of target species See references . . . . (not available here) Retained bycatch species Plaice, wolf fish, angler fish, cod, haddock, saithe,
redfish, . . . . . . . Biology of retained bycatch species See references . . . . (not available here) Discarded bycatch species Discarding is illegal, large mesh sizes, use of closed
areas where juveniles occur, and strong enforcement
Biology of discarded bycatch species Not needed PET species Common Skate, Dipturus batis,'crit. endangered' Biology of PET species Not available here Habitat . . . . . . . . Communities . . . . . . . . Discarding and offal Not needed
Continued on next page

Definitions, agreements, and listings
32
4. Choose ecosystem components The scientific tasks of the next two sections are illustrated schematically in figure 6. The SG should decide how the ecosystem will be partitioned into ‘components’ for the ERAEF. The recommended components are (Fletcher et al., 2005, Hobday et al., 2007)
• Target species
• Other retained species
• Discarded species
• Species impacted by the gear but not caught
• PET species
• Habitats impacted by the gear
• Ecological communities, e.g. pelagic, demersal, epibenthic and benthic (on and within the seafloor, respectively), planktonic, birds, reptiles, and mammals
Example box 3: A fishery description (Panel 2 of 2)
Faeroese inshore otter trawl fishery (4T) Continued
Item Responses Management Identity of management Faeroese national government Management objectives Safeguarding the marine environment and using
its resources sustainably Input controls Effort controls Output controls No minimum landing size or TAC Technical measures Fishing is seasonal in defined region. Trawl grid
controls selectivity Bycatch mitigation measures Trawl grid; most species caught are marketable Other controls on vessel activities MARPOL, . . . Enforcement This is the main industry in the Faeroes; strict
enforcement is important Data Logbook data Gross effort by time period Observer data Landings and survey data http://viewer.uuuq.com/ & www.hav.fo Other studies Various in Faeroese

Definitions, agreements, and listings
33
Another possible component could be the fishery itself since fisheries are part of the ecosystem and can affect themselves, e.g. lost gear on the seafloor snagging trawls.
Lists of species, types of habitats, and communities are needed. These are the basic units of analysis (or just ‘units’) of the components. All should be considered initially because any of them may have an important role in the ecosystem. Concern about the potential work load need not be high because the risk screening stage, described below, is likely quickly to eliminate many units from further consideration. The choice of components in the inventory should be documented, giving the reasons for any that are omitted.
Identification of species can be a skilled technical task that sometimes requires specialised taxonomists. Observer reports, if available, will be useful for listing non‐target and discarded species, including PET fish and elasmobranchs. Special observations may be required to record interactions of the fishery with seabirds, turtles, seasnakes, and marine mammals, some of which may also be PET species. Authoritative species identification texts are now available for most parts of the world either as commercially published field guides or as free resources from the FAO.
Habitats in fished areas can be divided into pelagic (the water column) and benthic (the sea floor). Habitat types are important because they provide the physical environments needed by species at different life stages for food, reproduction, shelter from predators, strong currents, wave action, etc. Diverse habitats also sustain species diversity. Even relatively robust species of fish can benefit from benthic nursery areas and other special localities.
Depending on the size and extent of the fished region, the pelagic habitat might be left as a single component or divided into depth bands or geographic zones distinguished by different currents or temperatures, etc. Spaulding et al. (2007) present ideas for this.
Benthic habitats tend to be more heterogeneous and harder to classify. Experienced marine sedimentologists, ecologists and, possibly, new field work may be required to report in reasonable detail on the benthic habitats in a fished region. Imaging data, e.g. using acoustic (Medwin and Clay, 1998, Gray, 2010a) and video (Gray, 2010b) methods are helpful for delineating different habitats, as are epifaunal7 surveys using a small beam trawl (Jennings et al., 1999b, Callaway et al., 2002, Reiss et al., 2006), for example. Without them, the ERAEF will have to use whatever geophysical and sea floor observations are available. Sometimes, nautical and specialised fishing charts provide information about the nature of the seafloor.
Having obtained the information about benthic habitats, however, there remains the problem of how to classify them for the purposes of an ERAEF. Hobday et al. (2007, citing unpublished data by Althaus and Barker) demonstrated how benthic habitats all around Australia can be easily classified using three variables: substrate type, geomorphology, and structural fauna – the latter excluding mobile species (which are considered under Communities, below) but including some plants if shallow enough. The scheme is well‐worth considering because it summarises the types of physical structuring that foster
7 Epifauna grow on the seafloor; infauna or benthos grow in the sediment.

Definitions, agreements, and listings
34
species diversity in benthic environments, yet it is simple, communicable, and generally applicable. Categories of the three variables are listed in tables 2, 3, and 4. ERAEFs for comparatively small regions would not need all of the categories but might, instead, benefit by subdivision of some. A precautionary approach to the ERAEF implies that, where information is lacking, heterogeneity rather than homogeneity of habitats should be assumed (Hobday et al., 2007).
Table 2. Categories of benthic substrate proposed for classifying benthic habitats for an ERAEF. Modified from Hobday et al. (2007). For fuller descriptions see their table 2.
Substrate category Short description Soft mud The finest mud or ooze; easily disturbed Fine sediments Fine and very fine particles Sandy sediments Sand and shells in high proportions Gravelly sediments Small pebbles and shells throughout Cobbles and boulders Large stones and rocks evident Sedimentary rock Consolidated, hard sedimentary rock Solid rock Consolidated rock lacking sedimentary structure Biogenic reef Biologically deposited rock, e.g. coral
Table 3. Categories of geomorphic form proposed for classifying benthic habitats for an ERAEF. Modified from Hobday et al. (2007). For fuller descriptions see their table 2.
Geomorphic category Short description Flat, unrippled Sediments lacking ripples due to currents, waves Current‐rippled Sediments with directional rippling due to currents Wave‐rippled Sediments symmetrically rippled by wave action Irregular, low Irregularities, < 10cm approx, often biogenic Irregular, medium Irregularities < 100cm approx Subcrops Dispersed, low protrusions of hard rock with
sediment between Low outcrops Low outcrops, < 100cm approx, lacking holes or
cracks Craggy low outcrops Low outcrops,< 100cm approx, with rough surfacesHigh outcrops High outcrops, >100cm approx, lacking holes or
cracks Craggy high outcrops High outcrops,>100cm approx, with rough surfaces
The last component of the marine ecosystem to consider for an ERAEF consists of the marine communities that may be affected by fishing. For this purpose, a community can be identified as the best available list of species inhabiting (or likely to inhabit at some time in their life cycle) each identified

Definitions, agreements, and listings
35
habitat. Hobday et al. (2007) recommend that only mobile species be included in the community species lists since the sessile fauna are already taken into account in the biological classification of habitats and need not be considered twice. Species lists for ecological communities in the fished area can often be found in local marine research publications. Otherwise, special sampling with a small‐mesh beam trawl or benthic grab is desirable to fill the inventory of species present in the region. Demersal fishing trawls are seldom satisfactory for inventories of benthic species because many species are poorly caught by them. Specialised sampling devices are likely to be better (Reiss et al., 2006), though none is guaranteed to catch all species present.
Table 4. Categories of nonmobile benthic life forming physical structure on the seafloor proposed for classifying benthic habitats for an ERAEF. Modified from Hobday et al. (2007). For fuller descriptions see their table 2.
Biological category Short description Unencrusted No physical structure attributable to life Encrusted Low encrustations, mostly <3cm approx, of
sponges, low bryozoa, serpulids, barnacles, etc. Overgrown Medium height species, mostly 3 – 10cm approx,
dominate physically, e.g. anemones, branching bryozoa, sponges
Highly overgrown High species, >10cm approx, in sufficient density to reduce benthic visibility and current flows, e.g. soft corals, crinoids
Bioturbated Burrowing animals affecting quality of superficial sediments
Echinoderm beds Dominated physically by asteroids, ophiuroids Bivalve beds Dominated physically by epifaunal bivalve species Other named faunal type Dominant structural epifauna (living on seafloor)
that has linked epibenthic fauna, e.g. coral Macroalgal Macroalgae (seaweed) growth dominates
physically; shallow, illuminated waters Seagrass Seagrass growth dominates physically; shallow,
illuminated waters

Definitions, agreements, and listings
36
Figure 6. Scheme for specifying and identifying the components, units, and attributes to be considered under an ERAEF. Scientists should also design indicators (right) that will measure changes in
the attributes of each critical unit.
Categorise species
Component“units”
Categorise communities
Categorise habitat types
Chooses from:Target spp.
Other retained spp.Discarded spp.
Other impacted spp.PET spp.Habitats
Communities
Ecosystem “components”
Unit“attributes”
populationrangesize‐agegenetic, etc.
physicalstructuresubstrate, etc.
species comp.trophic struct.size comp., etc.
Indicators
Definitions, agreements, and listings
37
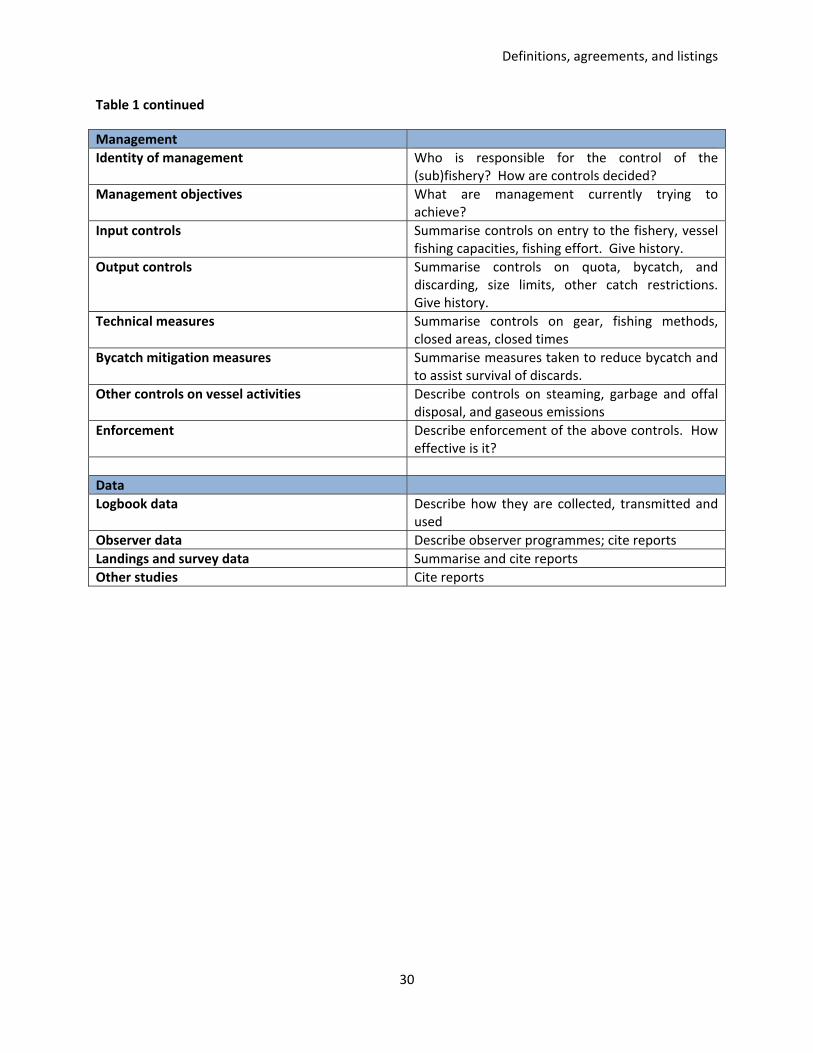
Example box 4: Components and units of analysis
PSA for pelagic sharks caught in Atlantic longline fisheries Cortès et al. (2009) studied vulnerabilities of pelagic sharks to surface longline fisheries in the Atlantic Ocean using PSA (Section 9 of this report) which is applicable when fishing is the main concern. Attention was restricted to one component, the shark family. 10 species and one ray species were treated as units of analysis. The three most vulnerable species were silky, shortfin mako, and bigeye thresher sharks. Cortès et al. pointed out that estimated vulnerabilities are not the same as actual stock status with respect to over‐fishing thresholds, but that the PSA assessment is, nevertheless, useful for deciding monitoring and research priorities.
Comment: We would not refer to the study by Cortès et al. as an ERAEF since only one ERAEF technique was applied to one component of the Atlantic ecosytem. Nevertheless, the PSA allowed the 11 species to be ranked for inherent productivity (life‐history traits allowing stocks to recover from fishing) and susceptibility to longlining.
SICA for glass eels fished in the River Severn, England Gascoigne (2009) reports a group study of a small fishery for European silver eels (Anguilla anguilla) in the River Severn. The species is now so depleted around Europe that both the EU and CITES have special conservation measures for it. The study used a SICA risk assessment method (Section 8 of this report) because it is applicable when many factors in addition to fishing may affect a fishery. The fishery had already been subjected to a pre‐assessment under the Marine Stewardship Certification (MSC) scheme. Since it had concluded that by‐catch and habitat impacts of the fishery were low, the SICA was restricted to one component and one unit of analysis, namely the eel itself. The group considered fishing at all life stages of the eel, entrainment in power plant turbines, diseases and parasites, predation by birds, pollution, wetland drainage, blockage of migration routes, and climate change.
Comment: SICA forms part of the ‘Risk‐based framework’ of the MSC certification rules. The MSC SICA is broadly similar to that described in this report (section 8) but with MSC scores assigned to the outcomes.

Definitions, agreements, and listings
38
5. Choose attributes of ecosystem components Units in each of the ecosystem components have attributes that may be affected by fishing. This is illustrated diagrammatically in figure 6 (above). Lists of significant attributes provided by Hobday et al. (2007) are likely to suffice for many ERAEFs. [They call them ‘sub‐components’ which seems less explicit than ‘attributes’ as prefered here and by other writers.] Lists are shown in table 5. Some will be more relevant than others depending on the situation. The choices made should be documented.
Table 5. Attributes of the units (species, or types of habitat or community) of the main components of a marine ecosystem (see section 2.6) proposed for consideration in an ERAEF. Modified from Hobday et al. (2007).
Ecosystem component Attributes of units that may be affected by fishing Species, i.e.
Target species Other retained species Discarded species Impacted species PET species
• Population size • Geographic range • Length/age/gender compositions1 • Fecundities • Genetic compositions2 • Migrations/interactions with fishery
Habitats • Physical structure and function3 • Substrate quality3 • Water quality4 • Niche diversity within the habitat • Air quality
Communities • Species composition • Trophic or functional structure5 • Size composition6 • Geographic distribution • Bio/geochemical cycling of materials • Ecosystem services7
Notes on table 5:
1. The size and age compositions of a species measure the proportions of breeding adults in the population. Fecundities are also important but are likely to be harder to estimate (Kjesbu et al., 2003).
2. Fishing is known to cause genetic changes in fish populations affecting growth and reproduction (Law and Stokes, 2005)
3. The physical structure of sea floors is often significantly altered by fishing (Watling, 2005). 4. The water quality of marine habitats is affected by man’s activities, e.g. increased sedimentation,
nutrient concentrations, etc. Heavy fishing effort can reduce an ecosystem’s ability to deal with these influences (Breitburg and Riedel, 2005). Geochemical cycles for carbon and nutrients may also be affected.

Definitions, agreements, and listings
39
5. ‘Trophic or functional composition’ refers to the integrity of the food chain in the community. Are there sufficient higher predators to keep lower predators in check? Is there a danger of siltation and de‐oxygenation following from loss of suspension feeders as occurred in Chesapeake Bay (Breitburg and Riedel, 2005), for example? Could a trophic cascade deplete zooplankton grazers so that harmful algal blooms occur (Daskalov et al., 2007, Daskalov, 2008)?
6. Size composition of a community can sometimes be used as a proxy for detailed ecological studies of trophic structure because top predators tend to have large body size, and large individuals of many fish species predate at a higher trophic level than small individuals (Jennings et al., 2002, Pinnegar et al., 2002).
7. Ecosystem services (section 2) can be considered as a property of either communities or habitats.

Definitions, agreements, and listings
40
Example box 5: Attributes, operational objectives (OOs), and indicators
English western Channel otter trawl fishery Attributes, OOs, and indicators were set for ecosystem components possibly affected by this fishery as follows:
Component Unit of analysis Attribute Operational objective Indicator Retained fish Species subject to stock
assessments Abundance Spawning stock biomass >
biological limits Stock assessment results
Length/age composition No further depletion of size/age distributions
Measurements of landings at market
Species without stock assessments
Abundance Catch/ unit effort (CPUE) level or increasing
Commercial CPUE data
Discarded fish Individual species Abundance CPUE level or increasing Observer data Length composition No further depletion of
size/age distributions Observer data
PET species Smooth hound (IUCN: vulnerable)
Expected survival of discarded individuals
Maintain or improve survival rates
Observer data
Cephalopods (cuttlefish, squid)
Individual species Population size to spawn at end of year
CPUE > or = previous years
Commercial CPUE at end of annual breeding cycle
Sea floor habitats Sandy sediment Granulariy and structure No marked changes from trawling disturbances
Inspection of sediment samples
Rocky reefs Physical structure Maintenance official conservation status (SAC)
Underwater video, diving observations
Niche diversity Maintain as required for conservation status (SAC)
Underwater video, diving observations
Ecological communities Demersal fish Species and size compositions
No further depletion of ‘larger core species’
As described by Genner et al. (2010)
Epibenthic reef communities
Species composition Continuing acceptability for conservation function
Monitoring in relation to SAC function
Epibenthic communities on sandy sediments
Species composition Continued presence of sessile epibenthos
Underwater video, diving observations
Comments: For the future, higher frequencies of large/old fish, enhanced biodiversity, and lower dependence on commercial fishing for basic data could be considered. Past years or periods refered to in OOs should be dated for specificity.

Definitions, agreements, and listings
41
6. Agree operational objectives (OOs) for all ecosystem components
Hobday et al. (2007) state that operational objectives (OOs) should be identified for each sub‐fishery (if any are delineated, see section 3), each ecosystem component (section 4), and each attribute of the units of the components (section 5). A draft list of OOs may be prepared by scientific advisors prior to involvement of stake holders in order to speed up discussions. Figure 7 shows the formation of OOs diagrammatically. The OOs have to be
• agreeable by concensus,
• consistent with the overall policy goals (section 2),
• responsive to fishing activities, and
• measurable to verify progress towards attainment.
Unfortunately, unavoidable sampling variation arising when indicators are measured from samples of fish etc. is likely to hinder the last requirement. This is a matter for a statistician.
The list of OOs developed may become dauntingly long when all of the ecosystem components and unit attributes have been considered. However, many of the OOs will quickly be found to be of low importance by the ERAEF process. Example suggestions for the OOs based on proposals by Hobday et al. (2007) are given in table 6. See also Example box 5, above, for real examples of OOs.
Figure 7. Flow diagram explaining the setting of operational objectives (OOs) for the different units of the various ecosystem components for an ERAEF. OOs must be consistent with management
goals, relevant, and demonstrably attainable.

Definitions, agreements, and listings
42
Table 6. Illustrative examples of operational objectives and indicators for an ERAEF (not recommendations). Modified from Hobday et al. (2007).
Ecosystem component
Attributes of units Operational objective Indicators
Target species, Other retained species, Discarded species, Impacted species, PET species1
• Population size
Abundance/biomass in 2015 is 1.5 x that in 2010
CPUE
• Geographic range
Return to the area reported occupied in 2005
Recurring presence in hauls/samples at the periphery of area2
• Length/age/gender compositions
>50% of population is sexually mature
7 out of 10 catch samples show >50% maturity3
• Fecundities
GSI > X during month Y4 7 out of 10 catch samples show GSI > X3, 4
• Genetic compositions
Genetic diversity > X CPUE of spawners > Y at spawning time5
• Migrations/interactions with fishery
Stock migrations continue as usual
Arrival of fish at the usual time of year
Habitats • Physical structure and function
Geomorphology remains as charted in 2010
New charts of trawl effects on sea floor
• Substrate quality
1. Mean particle size > X microns
2. Oxidised surface > 2 cm thick
1. Particle size analysis 2. Black horizon in core
samples
• Water quality
1. O2 saturation > X% 2. Total N < Y ppm
Water samples and chemical analysis
• Niche diversity within the habitat
Continued presence of structural fauna
Underwater mapping of faunal presence
• Air quality Vessel exhausts not unnecessarily polluting
Measures by engine specialists
Communities • Species composition Species richness > X; Continuing presence of species Y, Z, etc
Appropriate systematic sampling with nets, grabs, etc.
• Trophic or functional structure5
Continuing presence of species X, Y, Z at known trophic levels
CPUE of X > A CPUE of Y > B CPUE of Z > C
• Size composition6 Large species, e.g. X, and large individuals are present
CPUE of X > A Median length of X > B cm
• Geographic distribution Community occupies region charted in 2010, or larger
Most community species found in hauls/samples throughout the area
• Bio/geochemical cycling of materials
No build‐up of sedimentary organic matter
Depth of black horizon in core samples
• Ecosystem services Hotel bookings in summer > X
Occupancy of hotels in tourist season

Definitions, agreements, and listings
43
Notes on table 6:
1. Five ecosystem components consisting of species and their associated attributes are shown together to save space in the table; in practice, each type of species component is likely to have different operational objectives and indicators. PET species can have special monitoring problems because of their rarity; objectives may have to be simpler.
2. Spatial indicators may be useful for monitoring geographic ranges when sampling is consistent over space and time (Woillez et al., 2009).
3. ‘7 out of 10 catch samples’ is an arbitrary suggestion, not a statistically derived sampling result. Catches might be commercial catches (landings + discards) sampled by observers, or trawl survey catches for example. They all have different qualities for scientific inferences.
4. The index of fecundity suggested is the gonado‐somatic index (GSI) which is the weight of gonad/weight of fish. GSI is easily measured in the month just prior to spawning (Cotter et al., 2009) but other fecundity indices are available and may be more suitable (Kjesbu et al., 2003).
5. The presumption here is that genetic diversity is related positively to the number of spawners. 6. Community size composition should be measured across species and individuals of a species.
7. Identify possible effects of fishing and other agents of change
Fishing can affect a marine ecosystem in many ways (Jennings and Kaiser, 1998, Norse and Crowder, 2005), not necessarily adversely. Usually in a risk assessment, the activities that have potential to cause effects are referred to as ‘hazards’. However, in the case of ERAEFs, this term seems to prejudge harmfulness, so ‘effects’ will be the term used here.
Identifying all the potential effects of fishing and other agents of change in the regional ecosystem, e.g. mineral extraction, is fundamental to risk assessment. Several different techniques exist to help risk assessment committees achieve this (Burgman, 2005). A facilitator – someone who is neutral but familiar with risk assessment techniques and, preferably, fisheries – may be helpful for getting the best out of specialists in a ERAEF committee. We will describe three techniques: checklists, hazard matrices, and hierarchical holographic modelling (HHM).
Hobday et al. (2007) provide a simple checklist of fishing effects, with the various fishing activities that cause them nested within each. Fletcher et al. (2005) refer to ‘component trees’ that contain similar ideas. The purpose of these systems is to stimulate a committee ‘brainstorm’ to find all the effects that might happen. Several effects may seem trivial for certain fisheries but they are, nevertheless, worth considering briefly just in case a relevant effect comes forward. Possible effects of agents of change other than the fishery but in the same region or ecosystem should also be considered at this stage. A check‐list of effects based on the Australian classifications is given in table 7. A fishery that is divided into heterogeneous sub‐fisheries will need a separate list of effects for each. Later, all lists are

Definitions, agreements, and listings
44
examined systematically by the ERAEF committee, ticking only those that are expected to be feasible for each ecosystem component in turn. Only the ticked effects flow through to the next stage of the ERAEF.
Burgman (2005) states that structured checklists and brainstorming can “encourage uniformity” and describes other methods to stimulate discovery of unforeseen effects and risks. One is the hazard matrix. The idea is to draw up a table with components and units of the ecosystem along one side, and effects and activities along the other. The row‐column intersections suggest pairings that might not yet have been thought about. Figure 8 illustrates a hazard matrix for a hypothetical fishery.
Figure 8. Part of a hazard matrix: illustration for an imaginary fishery. Xs mark unit‐activity pairs that may possibly be relevant to the ecosystem.
One other method described by Burgman for discovering possible effects and risks that seems readily applicable to fisheries is the grandly named hierarchical holographic modelling or (HHM). This method exploits different ways of looking at an ecosystem as a means of finding new risks associated with the fishery. Thus a fished ecosystem may be thought of as a biological hierarchy, as sets of biological components, biological processes, physical and chemical processes, and as a human community. Figure
Effects and activities
Capture Contact with gear Movement of biological materials
Etc.. . . .
Compo
nent s & units
Ret‐
entio
n
Discard:
dead
Discard:
alive
Etc . . . .
Mesh
Rollers
Otter
boards
Warps
Etc . . . .
Discards
offal
Living
spp.
Waste
food
Etc. . . .
Target spp.
Sp. T1 X XSp. T2 X X XEtc. . . . X
Discard spp.
Sp. D1 X XSp. D2 X X XEtc. . . .
PET spp.
Sp. P1 X XEtc

Definitions, agreements, and listings
45
9 illustrates these ideas. Having agreed such a sketch of the ecosystem, the ERAEF committee can consider pairing the boxes (perhaps using a matrix) in order to investigate what kind of links there may be to the fishery or other agents of change. For example, an unlikely pair of items from figure 9, viruses and sediment chemistry, might prompt consideration of disease risks to fish and humans, and whether there could feasibly be any link to fishing activities.
Figure 9. Hierarchical holographic model (HMM) of a fishery. Pairing boxes in a diagram like this may stimulate ideas about possible effects of fishing and other agents of change on the ecosystem.
BIOLOGICAL HIERARCHY
BIOLOGICAL COMPONENTS
BIOLOGICAL PROCESSES
PHYS/CHEM PROCESSES
HUMAN COMMUNITY
FISHED ECOSYSTEM
Genes
Species
Individuals
Populations
Foodwebs
Habitats
Communities
Viruses
Bacteria
Plankton
Benthos
Fish
Birds
Bioregions Reptiles
Mammals
Nekton
Reproduction
Larvae
Feeding
Growth
Predation
Parasitism
Competition
Migration
Mortality
Sediment movement
Sediment chemistry
Tidal currents
Wave action
Storms
Water chemistry
Water clarity
Algal blooms
Toxins
Fishers
Would‐be fishers
Anglers
Fish processors
Fish transporters
Markets, Retailers
Tourism
Hotels, Restaurants
Ships, Harbours

Definitions, agreements, and listings
46
Table 7. Checklist of possible effects of commercial fishing and the particular activities that cause them. Modified from Hobday et al. (2007).
Effect of fishery or other agents
of change
Activities causing effect Notes and examples
Capture Collection of bait Bait is retained Commercial fishing and retention of species
The main fishing process of a voyage
Commercial fishing and discarding of species
Unwanted bycatch/discards
Other fishing Shell collecting, spearfishing by crew as off‐duty hobbies
Other damage or mortality through contact with gear
Collection of bait Unretained bait organisms damaged by the collection process
Towing of gear Crushing and tearing of benthic and demersal organisms; damage to substrates; contact damage of pelagic species through scale loss or abrasion.
Other fishing Damage to coral or other habitat during hobby fishing
Gear loss Contact damage and ghost fishing Anchoring & mooring Habitat damage caused by the anchor or mooring
ropes Steaming Collisions with marine animals; unsuitable landings
by migrating birds
Movement of biological materials
Unintended transport of species
As fouling organisms, in discharged ballast or deck washings; may cause bio‐invasions
On‐board processing Discharge of guts, heads, etc.; boosts scavenging in the ecosystem
Discarding Discarding whole organisms may lead to translocation of species
Stock enhancement Addition of juveniles or adults of commercial species to improve fishing yields; may spread deseases
Baiting hooks Translocation of bait organisms and their parasites Organic waste disposal Discharge of galley waste, sewage
Addition of non‐biological materials
Discharge of debris Solid waste from the fishing process or galley, as regulated by MARPOL
Discharge of chemicals Oil spills, leakages, detergents, cleaning fluids, etc. Exhaust fumes Excessive? Gear loss Refers to addition of waste materials associated
with lost nets, lines, weights, etc. Steaming Leaching of antifouling materials, leaks of oil from
stern gland

Definitions, agreements, and listings
47
Table 7 continued.
Effect of fishery or other agents
of change
Activities causing effect Notes and examples
Interference with physical processes, ambient sound
Trawling Redistributes fine sediments. Marks seafloor Boat launching, berthing Disturbance of intertidal regions. Dredging of
harbours needed for fishing vessels. Propellor wash may disturb contaminated harbour sediments
Steaming Disturbance of seafloor caused by propellor wash and wake. Vessel noise.
Externally caused effects
Other fishing Consider all the above effects comparatively and additively
Aquaculture Capture of feed species, physical effects of cages, chemical effects of uneaten feed, medicines and chemical treatments
Coastal development Sewage discharges, road and agricultural runoff, construction noise, port developments
Mineral extraction Oil, gas, sand, gravel extraction, pipelines, drilling, mineral exploration using active acoustic systems
Non‐extractive industrial activities
Shipping, defence manoeuvres, waste dumping, ordnance disposal, wind farms, sea‐floor cables
Other anthropogenic activities
Power boating, SCUBA diving, spear fishing

Definitions, agreements, and listings
48
Example box 6: Identifying possible effects of the activities of fishing and other agents
Longlining for tuna and swordfish species List of some effects of these oceanic fisheries, the particular activities causing them, mitigating measures, and introductory references:
Effect Activity causing effect Notes Possible mitigating measures
Lead‐in references
Capture and death Retention of target species
The main fishing process Reduce fishing effort
Discarding of target species
Usually due to damage during soaking or hauling
Shorter soak times; precautions during hauling; crew training
Discarding of non‐target and PET species
Depends on type of bait, fishing technique, hook design
Nylon, not steel leaders; circular not J hooks; fishing depth; crew training to release PETs
Ward et al., 2008, Ward et al., 2009, Yokota et al., 2009, Dulvy and Forrest, 2010, Echwikhi et al., 2010
Collection of bait Bait (e.g. squid, mackerel) is often collected by special fisheries
Assess and regulate bait‐collecting fisheries.
Damage through contact with gear
Shooting and hauling Seabirds attracted to visible bait
Shoot in darkness; rapid sinking hooks; bird‐scaring lines; discarding at night
(Anonymous, 2010b, Anonymous, 2010a)
Soaking of captured fish Dolphins, mammals, sharks attracted
Shorter soak times
Movement of biological materials
Baiting hooks Translocation of parasites Get bait from different source
Discharge of galley waste, sewage
Attracts birds Cause to sink quickly; discharge at night;
MARPOL
Addition of non‐biological materials
Littering Regulated by MARPOL; plastics banned
Crew training and supervision
MARPOL
Interference with physical processes
Steaming Vessel noise spreads widely underwater
(Cotter, 2008)

Scale, intensity, and consequence analysis (SICA)
49
8. Risk screening: Scale, Intensity, and Consequence Analysis (SICA)
All effects of the fishery and external factors that were ticked as ‘feasible’ in section 7 are put through to the next stage of the ERAEF to identify any possibly detectable consequences on ecosystem components, i.e. on the different categories of species, habitats, and communities discussed in section 4. Hobday et al. (2007) recommend a ‘Scale, Intensity, and Consequence Analysis’ (SICA) for this purpose. Their method appears to be the most advanced, and systematically organised risk‐screening method available for fisheries. It is summarised below.
8.1 Precautionary approach
A SICA is applied with the assumption that all feasible effects are identifiable and, similarly, that all affected ecosystem components are sensitive to them in the “plausible worst case” (Smith et al., 2007). Consequently, even when information is poor, there is high confidence that effects and components screened out because risks are deemed negligible are screened out correctly. A SICA is applied to each component of the ecosystem in turn. For each component, one or more triplets must be identified, each consisting of
1. a vulnerable unit of the component (section 4), 2. the attribute (section 5) and associated operational objective (OO, section 6) that is most
critical for the unit, and 3. the activity of the fishery or other agent of change that poses most risk.
For each triplet, the risk of not attaining the OO is scored from 1 to 6 (negligible to extremely high) by concensus. The scheme is shown in figure 10. This prioritised approach is intended to minimise the time spent on effects that are clearly trivial for many units and attributes.
Documentation of decisions made at each step is crucial for the acceptability of the ERAEF.
The documentation should be brief. It could take the form of a spreadsheet table with cross references to supporting information and publications. Bearing in mind that there might be about 7 ecosystem components and 10 to 20 feasible activities to consider, the SICA steps (below) will have to be repeated around 100 times. This sounds a lot, but many of these SICAs will create little discussion or work and will be rapidly dropped from further consideration. The value of going through all of the SICAs is that everyone involved can have a say, and a moment or two’s thought given to each risk will sometimes reveal issues that, otherwise, would have been overlooked even though they could cause trouble later.

Scale, intensity, and consequence analysis (SICA)
50
Figure 10. Setting consequence scores in a scale, intensity, and consequence analysis (SICA). The (component unit – operational objective – activity) are refered to as a SICA triplet.
8.2 SICA preliminaries
A SICA has several steps, to be repeated for each subfishery if the main fishery has been subdivided.
Terminology can become confusing. Recall that, as named here,
• An ‘activity’ is an activity of the fishery or an external agent (table 7, centre column).
• An ‘effect’ is a general process caused by any member of a group of activities (table 7, left column).
• A ‘feasible effect’ is one that may affect the ecosystem (‘ticked’ in section 7).
• A ‘component’ (of the ecosystem) is one of the following categories: target species, retained non‐target species, discarded species, impacted species, PET species, habitats, communities (section 4).
• A ‘unit’ (of analysis) is a member of a component, e.g. a species, a habitat type, or a community type (section 4).
• An ‘attribute’ is a feature of the units of a component (table 5).
Consequence of activity
Score Description
Negligible 1 OO unlikely to be affected detectably Minor 2 Minimal but detectable effect on OO Moderate 3 Attainment of OO affected but still feasible within 2
years Major 4 Attainment of OO unlikely in 2 years Severe 5 OO clearly unrealistic until activity is curtailed Extreme 6 Widespread and permanent change. OO will not be
attained for more than a human generation.

Scale, intensity, and consequence analysis (SICA)
51
• An ‘operational objective’ (OO) is the detailed managerial objective chosen for a particular property (table 6). It should be consistent with the overall goals of ecosystem management (section 2).
In addition:
• ‘Intensity’ of an activity is defined in step (vi) below.
• ‘Consequence’ of an activity is defined in step (vii) below.
• A ‘triplet’ is a combination of a unit, an OO, and an activity. Selected triplets are what is scored in a SICA.
8.3 SICA steps
For each activity: i) Score the spatial scale of the activity, erring towards the higher score when wavering between two.
A logarithmic scheme with regular, multiplicative spacing of scores is shown in table 8. It may be useful for coastal ecosystems. For larger and oceanic systems, improvisation may be needed. However, note that the spatial scores (and temporal scores, vi below) are only used to assist objective scoring of the intensity which is an important part of the SICA (vi below).
Table 8. Suggested logarithmic (multiplicative) scoring scheme for the spatial scale of an activity.
Area, sq. nautical miles Log score <1 1
1 – 3.3 2 3.3 ‐ 10 3 10 ‐ 330 4
330 – 1000 5 >1000 6
ii) Score the temporal scale of the activity, erring towards the higher score when wavering between
two . The scoring scheme proposed by Hobday et al. (2007, p60) is shown in table 9. It contributes to the intensity score (vi below).
Table 9. Scoring scheme for the temporal scale of an activity. After Hobday et al. (2007, p60).
Time period Score Daily 6 Weekly 5 Quarterly 4 Annual 3 Every several years 2 Every 10 years or so 1

Scale, intensity, and consequence analysis (SICA)
52
iii) For each ecosystem component, choose the attribute thought to be most at risk from the activity. iv) For each ecosystem component, choose the unit thought to be most at risk from the activity. v) Select the operational objective, attainment of which is most likely to be at risk from the activity. vi) Using the temporal and spatial scores for objective guidance, score the ‘intensity’ of the activity
with respect to the component, attribute, and unit chosen at (iii) and (iv). A scoring scheme is given in table 10.
Table 10. Scoring scheme for the intensity of an activity. Modified from Hobday et al. (2007, p62).
Intensity of activity Score Description Negligible 1 Rare occurrences at any spatial or temporal scaleMinor 2 Occurs occasionally at restricted locations Moderate 3 Evenly spread at low intensity; or widely
separated, locally intense occurrences Major 4 Evenly spread and obvious; or frequent patchy
occurrences of moderate intensity Severe 5 Intense everywhere; or frequent patchy
occurrences of high intensity Extreme 6 Extremely intense everywhere
vii) For each triplet, score the consequence ofthe activity at the intensity scored at step vi. A scoring scheme is suggested in table 11. Hobday et al. (2007) offer detailed descriptions of the 6 consequence scores as they apply to attributes of each component in their 14‐page table 5.
viii) Score confidence in the consequence scores. This is important to allow the ERAEF SG to decide how much weight to put on the results for each component. Hobday et al. (2007) propose a 2‐rank confidence score: Low and High. Having an even number forces a choice between them and prevents over‐use of the easy, middle option. Points to consider in scoring confidence are the amount of data or information, whether or not all sources are in agreement, and whether or not those involved in making the consequence scores were in concensus or not.
Table 11. Scoring scheme for the consequence of an activity at known intensity on an operational objective (OO) for the most sensitive unit of an ecosystem component. Modified from Hobday et al. (2007, p62) citing Fletcher et al. (2002).
Consequence of activity
Score Description
Negligible 1 OO unlikely to be affected detectably Minor 2 Minimal but detectable effect on OO Moderate 3 Attainment of OO affected but still feasible within 2
years Major 4 Attainment of OO unlikely in 2 years Severe 5 OO clearly unrealistic until activity is curtailed Extreme 6 Widespread and permanent change. OO will not be
attained for more than a human generation.

Scale, intensity, and consequence analysis (SICA)
53
ix) Document all scores, decisions made, and the reasons for them in a suitable table or spreadsheet before moving on to the next activity and ecosystem component. Table 2.3.1 of Hobday et al. (2007) is a form for doing this concisely with one form for each component. The first columns list the effects and activities, the ticks marking feasible effects, scores for spatial and temporal scales; the property, unit, and OO considered; the scores for intensity, consequence, and confidence and, finally, a wide column for explanations. Another, summarising form crosses components with effects and activities. Consequence scores of 3 or higher are marked in the boxes, using bold script for those delivered with high confidence (viii).
8.4 Discussion of SICA screening results
The SG should discuss the output from the SICA. The risk‐screening results should firstly be considered collectively to make sure that they are coherent and balanced with regard to scoring of consequence and reliability. Next, the SG can go through them to decide which risks can be ignored, which can be mitigated quickly by management of the fishery, and which should be subjected to further risk assessment. Hobday et al. (2007) propose that component‐OO‐activity triplets (our wording) scoring 3 or higher are candidates for the next level of risk assessment. There may also be needs for additional information when little is known about certain potentially risky activities. The SG will wish to consider how the risks posed by the fishery compare with risks posed by external activities such as other fishing, and other anthropogenic activities.

Scale, intensity, and consequence analysis (SICA)
54
9.
Example box 7: Scale, Intensity, and Consequence Analysis (SICA)
English western Channel otter trawl fishery Sample of SICA lines for target and a PET species for illustration only. Abbreviations: SSB = spawning stock biomass; SBL = safe biological limits (ICES); CPUE = catch/unit effort.
Unit Attribute Operational objective
(abbreviated)
Effect of fishing or other agent
Activity Rel‐ev‐ant ?
Spatial score (1 – 6)
Time score (1 – 6)
Inten‐sity
(1 – 6)
Con‐sequence
(1 – 6)
Confid‐ence (Lo‐Hi)
Explanation
Capture Bait Not for trawling Lemon soles
Spawning stock size
SSB > safe biol. limits
Fishing, retain � 3 6 3 4 Hi Fishery local; stock
widespread Lemon soles
Size distribution
More large fish Fishing, retain �
3 6 2 4 Hi Fishery local; stock widespread
Whiting Spawning stock size
SSB > safe biol. limits
Fishing, discard �
3 6 4 4 Hi Fishery local; stock widespread; disc. dead
Smooth hound
Abundance More abundant, discarded alive
Fishing, discard �
4 6 4 4 Lo Need info on survival of discards
Damage by contact with gear
Bait Not for trawling Whiting Abundance CPUE level or
increasing Towing of net �
4 6 3 3 Lo Need info on escapes
All targ. species
Abundance CPUE level or increasing
Other fishing
Other fisheries not present locally
All targ. species
Abundance CPUE level or increasing
Gear loss �
1 1 1 1 Hi Lost trawls do not catch fish
All targ. species
Abundance CPUE level or increasing
Anchor‐ing
Trawlers always moving
All targ. species
Abundance CPUE level or increasing
Steam‐ing �
1 6 1 1 Hi Small displacement of fish by vessel noise
Productivity and susceptibility analysis (PSA)
55
9. Higher risks: Productivity and Susceptibility Analysis (PSA)
Fishing activities found by SICA to be of moderate or higher risk with certain ecosystem components, i.e. with SICA scores ≥ 3, and for which no immediate attempt is being made to mitigate the risk, can be subjected to a procedure known as Productivity and Susceptibility analysis (PSA) (Milton, 2001, Stobutzki et al., 2001, Hobday et al., 2007) to clarify the level of ecological risk further. PSA is especially useful if there is low confidence in the assigned SICA consequence scores, but note that PSA applies specifically to the effects of fishing, and is thus narrower in scope than SICA. This is not a problem when fishing is expected to be the main agent of change in the ecosystem. Note also that PSA differs from SICA because it is applied to all the units of each component, not just to the most sensitive.
PSA scores (i) the productivity of ecosystem components based on life‐history or other attributes and (ii) the susceptibility of those components to the acknowledged effects of fishing. ‘Productivity’ is the capacity of a population to rebuild itself after fishing. [It is not the same as ecological productivity which concerns measurable production of biomass.] ‘Susceptibility’ represents the vulnerability of a species to a particular type of fishing gear. The idea behind PSA is that these two attributes of a species form a useful measure of its capacity to sustain that type of fishing (Stobutzki et al., 2001). When plotted on a PSA graph (with productivities ranging from high to low, rather than the usual way from low to high) the overall risk to a species is indicated by its Euclidean distance from the origin, obtainable by Pythagoras’ theorum. Productivity and susceptibility scores are based on intrinsic attributes of the units and, therefore, are neither related to fishing effort past or present, nor to the current size of the population. They are therefore not a substitute for stock assessments. PSA should, however, be consistent across species in a relative sense within a single analysis. PSA may be thought of as a ‘data‐poor’ method, and scores should be checked for credibility with appropriate observations if available, e.g. time series of CPUE. The scheme for PSA is illustrated diagrammatically in figure 11.
Generally, attributes are scored as 1, 2, or 3 meaning Low, Medium, and High risk. The attribute scores contributing to a PSA have to be averaged in some way to estimate productivity and susceptibility scores. Smith et al. (2007) recommend taking the arithmetic mean (AM) of productivity attributes, and the geometric mean (GM, i.e. the n’th root of the product of n attribute scores) of the susceptibility attributes. Trial calculations may indicate which method gives the most convincing scores, or whether some other method of summarising attributes is needed, e.g. taking the minimum or maximum value. Stobutzki (2001) additionally used a weighting system (range: 1, 2, 3) for the different attributes depending on their perceived relevance to productivity or susceptibility. Weighting adds a complication that is only justifiable if it definitely reduces the subjectivity of scoring.

Productivity and susceptibility analysis (PSA)
56
Figure 11. Scheme for carrying out a Productivity and Susceptibility analysis (PSA) on species deemed to be most at risk by the preceding Scale, Intensity and Consequence analysis (SICA) of
an ERAEF.
9.1 PSA for target, nontarget, impacted, discarded, and PET species
9.1.1 Productivity of species Seven intrinsic attributes of a species are proposed for estimating productivity of species in line with recommendations of Hobday et al. (2007). They are shown in table 15. The Marine Stewardship Council tabulate a 3‐level scoring linked to absolute values of these seven attributes (MSC, 2010, Table B4.2). Others have used more attributes (Olson et al., 2006, Patrick et al., 2010) or fewer (Milton, 2001, Stobutzki et al., 2001).
Table 15. Attributes of a species that signal a high ability for a population to recover (‘productivity’) when fishing effort is reduced.
Attribute High productivity signalled by
age at maturity Low age size at maturity Small size maximum age Low age maximum size Small size fecundity High fecundity reproductive strategy Broadcast spawning trophic level Low trophic level
Life‐history featuresTrophic levelfecundity, etc.
AvailabilityEncounterabilitySelectivityPost‐capture mortality

Productivity and susceptibility analysis (PSA)
57
Information on these quantities can often be obtained from www.fishbase.org , other technical sources, e.g. (Denny et al., 2002, Patrick et al., 2009), or locally collected information.
9.1.2 Susceptibility of species Some species must be omitted from the PSA because too little is known about them, or their taxonomic identity is too vague. Such omissions and the reasons for them should all be documented. Four attributes of a species are suggested here for scoring its susceptibility to fishing, though, there could be other options (Stobutzki et al., 2001, Olson et al., 2006, Patrick et al., 2010). The four are:
• Availability; the fished proportion of the area occupied by the species; possibly taking into account sub populations (see below) and other fisheries.
• Encounterability; the likelihood of encountering gear if it is fished in the occupied area)
• Selectivity; the likelihood of capture if the gear is encountered
• post‐capture mortality; the likelihood of death after capture and discarding.
Statistically, these attributes seem reasonably independent and, if any one is low, the overall susceptibility is low. The following notes suggest how to score the four attributes as L, M, or H.
9.1.2.1 Availability
The availability of a species can be simply scored in terms of the size of the area it occupies if little is known about its distribution or if the species is highly migratory like tunas. For example,
• Low risk for a global distribution,
• Medium risk if distributed widely beyond the fishery, and
• High risk if distribution is mostly restricted to the fished area or if distributed more widely with heavy fishing elsewhere.
Some species, though widely distributed, live only in restricted localities within the total distribution, e.g. the breeding islands of some seabirds. These are here called ‘subpopulations’. Isolated subpopulations can also occur underwater without obvious signs but, nevertheless, make the species vulnerable to directed fishing. Hobday et al. (2007) point out that separation of subpopulations can arise because of natural barriers to dispersal. If so, the most appropriate availability score taken from table 12 might be more appropriate, erring on the high‐risk side when wavering between two categories.

Productivity and susceptibility analysis (PSA)
58
Table 12. Risk of a species living as isolated subpopulations because of natural barriers to dispersal and therefore vulnerable to directed fishing. The table is used to find the most important barrier if no better information on separation of subpopulations is available. Modified from Hobday et al. (2007, table 6).
Type of barrier Low risk Medium risk High risk Geographic, e.g. land
Deep or oceanic species.
Shelf species with depth or temperature barriers
Restricted to bays, estuaries, special places
Temporal No seasonal aggregations
Small or irregular aggregations occur
Concentrated aggregations occur for breeding, etc.
Ecological (for feeding or other requirements)
Occupiable habitat is dispersed throughout range of species
Prefers a certain habitat but it is widespread
Occupiable habitat is rare
Behavioural No behavioural movements
Swims dispersed or in loose shoals
Predictable migrations
Early life history Pelagic larvae Early development occurs in diffuse patches
Highly localised spawning or nursery areas
When reliable maps of the distribution of a species exist, it can be scored for availability directly by estimating the proportion of the occupied area that is fished, the latter being taken from logbook or observer data. Hobday et al. (2007) and the Marine Stewardship Council (2010, table B4.3) suggest scoring overlaps as follows:
• Low risk is < 10% overlap
• Medium risk is 10 – 30% overlap
• High risk is > 30% overlap
The risk category should be increased when the species is known to aggregate at times and to attract (or be in the presence of) focussed fisheries. On the other hand, the category might be decreased when the species and the fishery are very widely dispersed. All of these theoretical scores for availability could reasonably be adjusted when reliable observations of distributions are available, e.g. by observers who know the species.
9.1.2.2 Encounterability
Encounterability has a ‘High’ risk score when the adult habitat and usual depth range of a species match the localities and typical depths of fishing, or there are interactions between the species and the gear during shooting and hauling. It gets a ‘Low’ score when neither of these situations occur, and a ‘Medium’ score for intermediate cases. Habitats and depth ranges can be categorised, as for the example case shown in table 13. Like other attributes of susceptibility, these theoretical scores

Productivity and susceptibility analysis (PSA)
59
could be adjusted when reliable observations are available. Observations of encounterability are likely to be particularly valuable for PET species: do they interact with the fishing gear?
Table 13. Example case of twoway categorisation of habitats and depth zones preferred by a species showing levels of risk (Low, Medium, and High). The table is filled for an imaginary, shallow‐water, sand‐preferring species encountering an imaginary demersal trawl that tends to fish between 50 and 600m. Modified from Hobday et al. (2007, tables 7 and 8).
Depth zone Habitat
0 – 100m 100 – 250m 250 – 500m 500 – 800m 800 – 1200m
Hard bottom L L L L L Soft bottom H H H M L Pelagic, top L L L L L Pelagic, mid L L L L L Bathypelagic L L L L L
9.1.2.3 Selectivity
Selectivity is the risk of being caught or damaged when encountering the fishing gear. Actual measurements of selectivity are impracticable for many species. Instead, Hobday et al. (2007) propose for nets that fish length‐at‐maturity should be compared with mesh size as a rough‐and‐ready estimate of the risk of selection, as shown in table 14. The Marine Stewardship Council (MSC, 2010, table B4.3) propose the same values for set gillnets. Selectivity scores should be adjusted for fish that are large and powerful enough to avoid the net, for certain long and thin, or wide and spiny species that are especially catchable for their size, or where reliable observations of catch rates are available. The Marine Stewardship Council describe a risk scoring system (MSC, 2010, table B4.4) for hook fisheries.
Table 14. Roughandready estimation of the risk of selection when a species encounters a net of known mesh size M cms. Measurement of M with a wedge gauge is suggested. Large fish are at less risk if they are strong enough to avoid or escape from the net. Small fish are at more risk if they are wide or spiny.
Fish length at maturity
Selectivity score
< M Low 1 – 2M Medium >2M High Large fish Medium/Low

Productivity and susceptibility analysis (PSA)
60
9.1.2.4 Post‐capture mortality (PCM)
Some species can survive the capture and discarding process. If reliably known, this may justify reducing their overall score for susceptibility. The Marine Stewardship Council (MSC, 2010, table B4.3) propose ‘Low’ risk for a species when there is evidence of post‐capture release and survival, ‘Medium’ for species released alive, and ‘high’’ for species that are usually retained or discarded dead.

Productivity and susceptibility analysis (PSA)
61
Example box 8: Productivity and Susceptibility Analysis (PSA) for fished species
Sri Lankan shortline fishery Short lines are used in this Indian Ocean fishery to reduce soak times and reduce spoilage of the catch in the tropical waters. The table below shows illustrative PSA scoring for 12 target species. Abbreviations: AM = arithmetic mean; GM = geometric mean; ED = Euclidean distance
Target species Productivity Susceptibility PSA resultName Species Age at
mat‐urity
Max age
Fecun‐dity
Avge max size
Avgesize at matur‐ity
Repro‐duc‐tive
strategy
Tro‐phic level
Productivity
score (AM)
Avail‐ability
En‐count‐era‐bility
Selec‐tivity
Post cap‐ture
morta‐lity
Suscep‐tibility score (GM)
PSAscore (ED)
Overall risk
Swordfish Xiphias gladius 3 3 1 2 2 1 3 2.14 2 3 3 3 2.71 3.45 HighBarracuda Sphyraena jello 3 3 2 2 2 2 3 2.43 2 2 3 3 2.45 3.45 HighFlying fishes
Exocetus volitans
3 3 2 1 1 1 2 1.86 2 2 3 3 2.45 3.08 High
Kingfish Scombero‐morus commerson
1 3 2 2 2 1 3 2.00 2 2 3 3 2.45 3.16 High
Sailfish Histiophorus gladius
3 2 2 2 2 1 3 2.14 1 2 3 3 2.06 2.97 Mid
Sea barra‐mundi
Lates calcarifer 3 3 1 2 2 1 3 2.14 2 1 3 3 2.06 2.97 Mid
Travelly/ Jackfish
Caranax stellatus
3 1 2 1 1 1 3 1.71 2 2 3 3 2.45 2.99 Mid
Bream Argyrops spinifer
3 3 1 1 2 1 3 2.00 2 1 3 3 2.06 2.87 Mid
Flying fishes
Hirundichthys oxycephalus
1 1 2 1 1 1 2 1.29 2 2 3 3 2.45 2.77 Mid
Skipjack tuna
Katsuwonus pelamis
1 2 2 1 2 1 3 1.71 1 3 2 3 2.06 2.68 Mid
Yellow fin tuna
Thunnus albacares
1 1 1 2 2 1 3 1.57 1 3 2 3 2.06 2.59 Mid
Dolphin fishes
Coryphaena hippurus
1 1 2 2 2 1 3 1.71 1 1 3 3 1.73 2.43 Low
Continued on next page

Productivity and susceptibility analysis (PSA)
62
Example box 8: Productivity and Susceptibility Analysis (PSA) (Panel 2 of 2)
Sri Lankan shortline fishery (Continued) PSA plot for target species results in table above. Coloured lines are boundaries between arbitrary risk levels (Low, Mid, High). The Swordfish, Barracuda, Flying fishes (Exocetus volitans), and Kingfish were found to be most at risk from the fishery.
0
0.5
1
1.5
2
2.5
3
3.5
0 0.5 1 1.5 2 2.5 3 3.5
Suscep
tibility
Productivity
Swordfish
Barracuda
Kingfish
Flyingfish (E. volitans)
Travally
Sailfish
Flyingfish (H. oxycephalus)
Yellowfin tuna
Dolphin fishBream
Skipjack tuna
LOW RISK
MID RISK
HIGH RISK

Productivity and susceptibility analysis (PSA)
63
9.2 PSA for habitat types
Consider next the productivity and susceptibility of the component units that are habitat types. Hobday et al. (2007) appear to be among the first and only authors to include habitat types in a PSA. Nevertheless, they are clearly important for an ERAEF when mobile demersal gears are being used by the fishery, so their ideas are summarised below. Some habitat types will have to be omitted from the PSA because too little is known about them. This and the reasons for omissions should be documented. Habitat scores are specific for a type of fishing gear. For a different approach that has been used to map the sensitivity of Welsh demersal habitats to demersal fisheries, see Hall et al. (2008) who also provide an instructive literature review on recoveries after fishing disturbances. For a comprehensive classification of global marine habitats, see Spaulding et al. (2007).
9.2.1 Productivity of habitat types Habitat productivity is defined as the capacity to regenerate following disturbance by fishing. Two attributes of habitat types are suggested to estimate this:
• The ability to regenerate structural fauna.
• Exposure to natural disturbances which imply a regenerative habitat.
Other attributes may be relevant to productivity, e.g. connections between habitats of the same type, but proposals for scoring them consistently are not known.
9.2.1.1 Regeneration of structural fauna
Depth is relevant in scoring this attribute because habitats in deep water (e.g. >50m) tend to be slower to recover than those in shallow water. The type of structural fauna is also relevant because some, such as corals, crinoids, and large sponges, grow very slowly whereas others, such as common encrusting species, grow much more quickly. Video imaging or trawling with a light, 2m beam trawl (Jennings et al., 1999b) are two ways to find out what is growing on the sea floor. Given their taxonomic identity and depth, an estimate of the likely regeneration times after fishing should be available. The suggested scores for regeneration of fauna when fishing stops in the vicinity are
(1) for those carrying fauna likely to regenerate within a year, (2) if up to a decade will be required, and (3) if recovery is unlikely in under a decade.
9.2.1.2 Natural disturbances
Natural disturbances are usually caused by wave action or strong currents, but the effects of temperature changes (e.g. on coral), invasive species, freshwater flows, ice, and so on should also be considered. Usually, deeper habitats experience fewer natural disturbances. The suggested scores for natural disturbances are

Productivity and susceptibility analysis (PSA)
64
(1) for multi‐annual, severe natural disturbances; usually applicable to habitats less than 60 m deep,
(2) for irregular or moderate natural disturbance, e.g. approximately annual, and (3) for undisturbed habitat types.
9.2.2 Susceptibility of habitat types Susceptibility as applied to habitats measures the relative area affected and the seriousness of interactions with the fishing gear. The following ideas are simplified from Hobday et al. (2007). The suggested attributes contributing to a measure of susceptibility are
• availability (the proportion of the area of habitat type that is covered by the fishery),
• encounterability (degree to which habitat type is protected by ruggedness of the habitat type),
• Level of disturbance (the number of contacts by the gear needed to cause damage),
• Heterogeneity (ratio of hard and soft areas within a habitat type)
• Topographic stability (proneness to flattening by demersal fishing gear)
• Slope (possible landslide effects)
9.2.2.1 Availability
This attribute measures the general spatial overlap with the fishery where gear could theoretically contact the habitat because the depth ranges match. The suggested scores for habitat availability are
(1) gear could contact < 10% of the area of the habitat type, LOW RISK (2) gear could contact 10 ‐ 30% of the area of the habitat type, and (3) gear could contact > 30% of the area of the habitat type. HIGH RISK
9.2.2.2 Encounterability or ruggedness
The degree to which a habitat in an accessible depth range is at risk from fishing depends partly on its ruggedness. Rocks and other structure affect the degree of contact of the gear with the substrate. The suggested scores are
(1) Large boulders, rugged surface structure, LOW RISK (2) Less rugged, irregularities < 1 m, and (3) Smooth. HIGH RISK
The scores should be adjusted up or down for extreme features by judgement.

Productivity and susceptibility analysis (PSA)
65
9.2.2.3 Level of disturbance
This attribute measures the number of encounters of a specific gear needed to adversely affect the epifauna of the habitat type. Its value reflects the delicacy of the epifauna and the weight of the gear. Suggested scores are
(1) Many encounters needed to cause significant effects, LOW RISK (2) Only a few encounters are needed, and (3) Just one encounter causes obvious and lasting damage. HIGH RISK
9.2.2.4 Heterogeneity
The heterogeneity of the habitat type, particularly if hard and soft areas are mixed, implies high species diversity including, possibly, rare species. Consequently, physical damage or transport of material by demersal gears could be more ecologically damaging. Suggested scoring is
(1) Habitat type is homogeneous almost everywhere, LOW RISK (2) Habitat type includes a significant proportion (say 5 ‐ 20%) of hard ground, and (3) Habitat type is an approximately even mix of hard and soft ground. HIGH RISK
9.2.2.5 Topographic stability
A topographically diverse habitat type is likely to provide better shelter from currents and predators than one that is flat. Yet bumps and hollows built from soft rock or sand waves can easily be flattened out by heavy demersal fishing gear. Suggested scoring is
(1) Stable flat, cobbled, or hard rock sea floor, LOW RISK (2) Seafloor prone to some abrasive flattening by heavy demersal gear, (3) Fragile topography, e.g. coral reefs, soft sedimentary structures. HIGH RISK
9.2.2.6 Slope
Steeply sloping seafloors are more prone to landslide damage caused by dragged demersal fishing gears. Suggested scores are
(1) Generally < 1 degree (2) 1 – 10 degrees (3) > 10 degrees

Productivity and susceptibility analysis (PSA)
66
Example box 9: Productivity and Susceptibility Analysis (PSA) for a habitat
English western Channel otter trawl fishery A PSA is carried out below for the mostly sandy habitat of Plymouth Bay where fishing with light otter trawls occurs. Depth ranges from 20 to 70 metres. A SICA was illustrated for the same fishery in example box 7.
PSA variable Risk assessment Score (1= Low, 3 = High)
Explanation
Productivity Regeneration Existing fauna could regenerate in
< 1 year 1 Possibility of a richer fauna being present in the
absence of trawling is being ignored. Natural disturbances Multi‐annual storms, long fetch 1 Affected by Atlantic waves Average 1 Arithmetic average of Regeneration and Natural
disturbances scores Susceptibility Availability Gear contacts > 30% of area 3 Regularly trawled over Encounterability‐ruggedness Smooth ground 3 Level of disturbance Many encounters needed to
affect existing fauna 1 Possibility of a richer fauna being present in the
absence of trawling is being ignored. Heterogeneity Habitat is homogeneous 1 Predominantly sandy ground Topographic stability Stable, flat 1 Predominantly sandy ground Slope Generally < 1 degree 1 Average 1.44 Geometric average of Availability . . . Slope scores PSA habitat score 1.75 Euclidean distance from Productivity and
Susceptibility average scores

Productivity and susceptibility analysis (PSA)
67
9.3 PSA for Community types
Smith et al. (2007) reported that PSA for communities was still under development in 2007. Meanwhile, Hobday et al. (2007) provide extensive discussion of PSAs for communities (of mobile species only), noting that this is a daunting task even in data‐rich situations. Common problems that arise with community analyses are that:
• The list of known species is seldom complete.
• In the absence of sharp discontinuities in habitat types, communities tend to blend from one type to another without clear boundaries; this makes communities hard to define.
• Understanding of community functions (predation, grazing, filter feeding, etc.) may require extensive biological knowledge.
• Community metrics tend to require extensive sampling for precise estimation; incomplete knowledge of species present can cause biases.
• Communities may already be significantly changed following decades of fishing and other influences.
Nevertheless, communities are vital components of ecosystems and are vulnerable to fishing in various ways, e.g. disruption of the food web (figure 4), loss of a function such as water clarification (as in Chesapeake Bay (Breitburg and Riedel, 2005), or loss of dominant or keystone species with repercussions for many others (Hobday et al., 2007). Loss of biodiversity, particularly when PET species are lost, is another major concern. Hobday et al. (2007) offer some interesting ideas that ecologists may wish to explore. Here, we merely repeat some of the simplest from their table 1, p. 119. A possible way around some of the difficulties of working with communities would be to consider the productivities and susceptibilities of functional groups directly, rather than trying to estimate the effects of disruption on the parent communities.
9.3.1 Productivity of community types • High mean growth rate implies high productivity and therefore faster recovery from fishing, i.e.
low risk. The average might be taken across the mobile species most important for maintaining essential ecosystem functions.
• Low mean length at maturity similarly implies fast re‐growth and low risk.
• Low mean trophic level suggests species of small size and high growth and reproductive rates, i.e. low risk, though this could already be a response to a long history of fishing (Pauly and Watson, 2005).
9.3.2 Susceptibility of community types • High overlap of the fishery with the community implies high risk.
• High encounterability of the fishery with the community implies high risk.
• Low biodiversity may imply low functional redundancy and therefore a higher risk of losing a vital ecosystem function. The lowest biodiversity within any functional group, if known, might provide a better risk score.
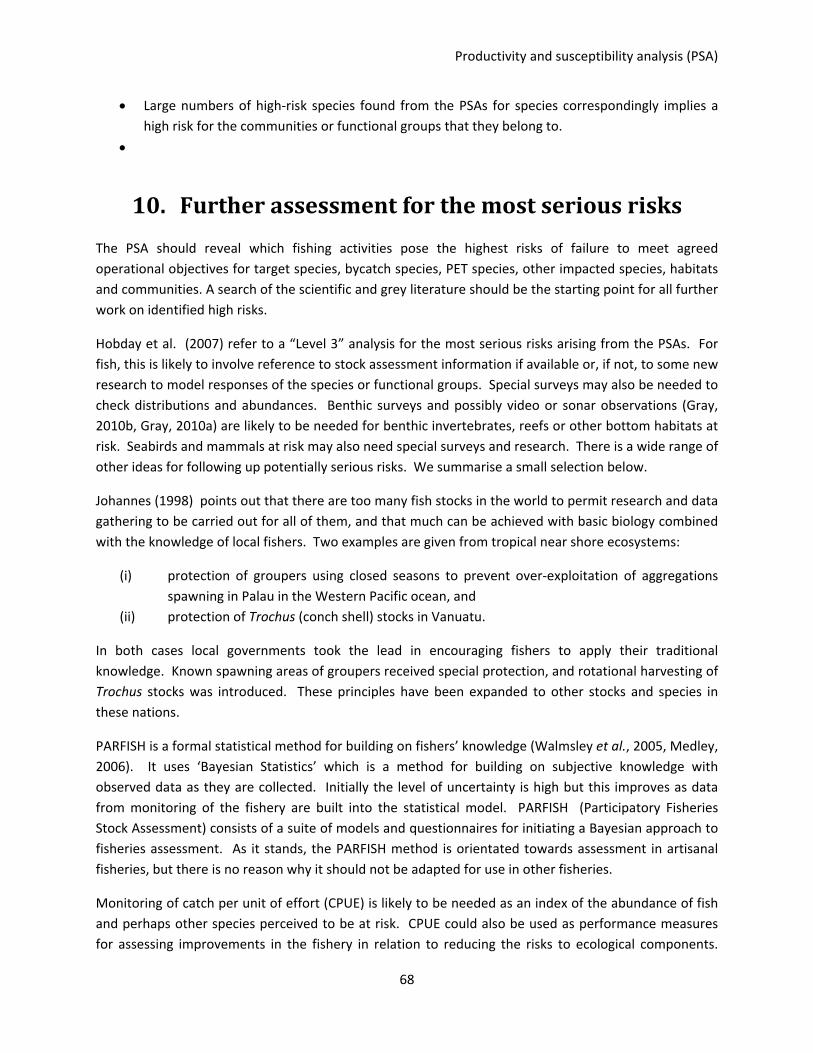
Productivity and susceptibility analysis (PSA)
68
• Large numbers of high‐risk species found from the PSAs for species correspondingly implies a high risk for the communities or functional groups that they belong to.
•
10. Further assessment for the most serious risks The PSA should reveal which fishing activities pose the highest risks of failure to meet agreed operational objectives for target species, bycatch species, PET species, other impacted species, habitats and communities. A search of the scientific and grey literature should be the starting point for all further work on identified high risks.
Hobday et al. (2007) refer to a “Level 3” analysis for the most serious risks arising from the PSAs. For fish, this is likely to involve reference to stock assessment information if available or, if not, to some new research to model responses of the species or functional groups. Special surveys may also be needed to check distributions and abundances. Benthic surveys and possibly video or sonar observations (Gray, 2010b, Gray, 2010a) are likely to be needed for benthic invertebrates, reefs or other bottom habitats at risk. Seabirds and mammals at risk may also need special surveys and research. There is a wide range of other ideas for following up potentially serious risks. We summarise a small selection below.
Johannes (1998) points out that there are too many fish stocks in the world to permit research and data gathering to be carried out for all of them, and that much can be achieved with basic biology combined with the knowledge of local fishers. Two examples are given from tropical near shore ecosystems:
(i) protection of groupers using closed seasons to prevent over‐exploitation of aggregations spawning in Palau in the Western Pacific ocean, and
(ii) protection of Trochus (conch shell) stocks in Vanuatu.
In both cases local governments took the lead in encouraging fishers to apply their traditional knowledge. Known spawning areas of groupers received special protection, and rotational harvesting of Trochus stocks was introduced. These principles have been expanded to other stocks and species in these nations.
PARFISH is a formal statistical method for building on fishers’ knowledge (Walmsley et al., 2005, Medley, 2006). It uses ‘Bayesian Statistics’ which is a method for building on subjective knowledge with observed data as they are collected. Initially the level of uncertainty is high but this improves as data from monitoring of the fishery are built into the statistical model. PARFISH (Participatory Fisheries Stock Assessment) consists of a suite of models and questionnaires for initiating a Bayesian approach to fisheries assessment. As it stands, the PARFISH method is orientated towards assessment in artisanal fisheries, but there is no reason why it should not be adapted for use in other fisheries.
Monitoring of catch per unit of effort (CPUE) is likely to be needed as an index of the abundance of fish and perhaps other species perceived to be at risk. CPUE could also be used as performance measures for assessing improvements in the fishery in relation to reducing the risks to ecological components.

Further assessment
69
The volume of landed catch, by itself, is generally a poor indicator of the sustainability of a fishery because it can be affected by both fishing effort or technique, and abundance of the species, though sudden increases or decreases in landings should warrant further investigations. Of more use, if landings are the only regular source of data about a fishery, are the size distributions of the fish. They indicate the relative abundance of breeding fish (if maturity with size is known), and the resilience of the stock to heavy fishing. They will probably say little about small fish and recruitments unless it is known that small fish are caught and landed.
CPUE data derived from effort and landings of commercial fishing vessels is more useful than just landings data but can be seriously biased by changing fishing efficiencies (Marchal et al., 2007), different targeting or fishing strategies over time, and, if sampling resources are tight, by patchy sampling (Cotter et al., 2004). CPUEs from standardised research vessel surveys provide a more controlled index of the abundance of fish species provided that they are effectively caught by the gear in use at the fishing stations visited. There can, nevertheless, be problems with bias and variability (Trenkel and Cotter, 2009). Much biological information – in addition to CPUEs – can be gained from research vessel surveys if resources are available on board for sampling the appropriate indicators (Petitgas et al., 2009).
Monitoring of trophic level (TL) can help to assess the sustainability of a fishery (Pilling et al., 2008). TL relates to the position of a species in the foodweb. See figure 4. The approximate TL of individual species can usually be obtained from Fishbase at www.fishbase.org, then multiplied by landings data to examine the mean trophic index (MTI) of the landings (Pauly and Watson, 2005). The MTI is one of the eight indicators identified by the Convention on biodiversity http://www.cbd.int/. However, interpretation of MTIs depends on changing fishing strategies (Caddy et al., 1998), temperature and climatic effects (Kirby and Beaugrand, 2009), and other factors (Branch et al., 2010). Another way to investigate trophic relationships is by modelling. Ecopath with Ecosim (www.ecopath.org) is a free ecological modeling system which enables the construction of a computer model of an ecosystem which can be used to simulate ecosystem changes, evaluate ecosystem effects of fishing and management policy options. There are around 200 models of different ecosystems published. Ecopath models can be constructed without full knowledge of all trophic parameters and are particularly useful for understanding the structuring of the food web of an ecosystem. An extensively documented example for the North Sea was prepared by Mackinson et al. (2007).
Further studies of habitats and their relation to the spatial distribution of fishing will probably require mapping. It is an evolving field. Some examples of sources of habitat and geological information are shown in table 15 below. In European waters vessels over 15 m are subject to obligatory satellite tracking so it is possible to superimpose steaming routes onto geological and habitat maps. The resolutions of both sources of information should be carefully assessed before attempting interpretations. Currently these satellite data are collected from reports at two‐hourly intervals. For inshore areas, methods based on mobile phone technology can achieve higher resolution; these approaches are being developed for use on smaller vessels (Caslake, 2009).
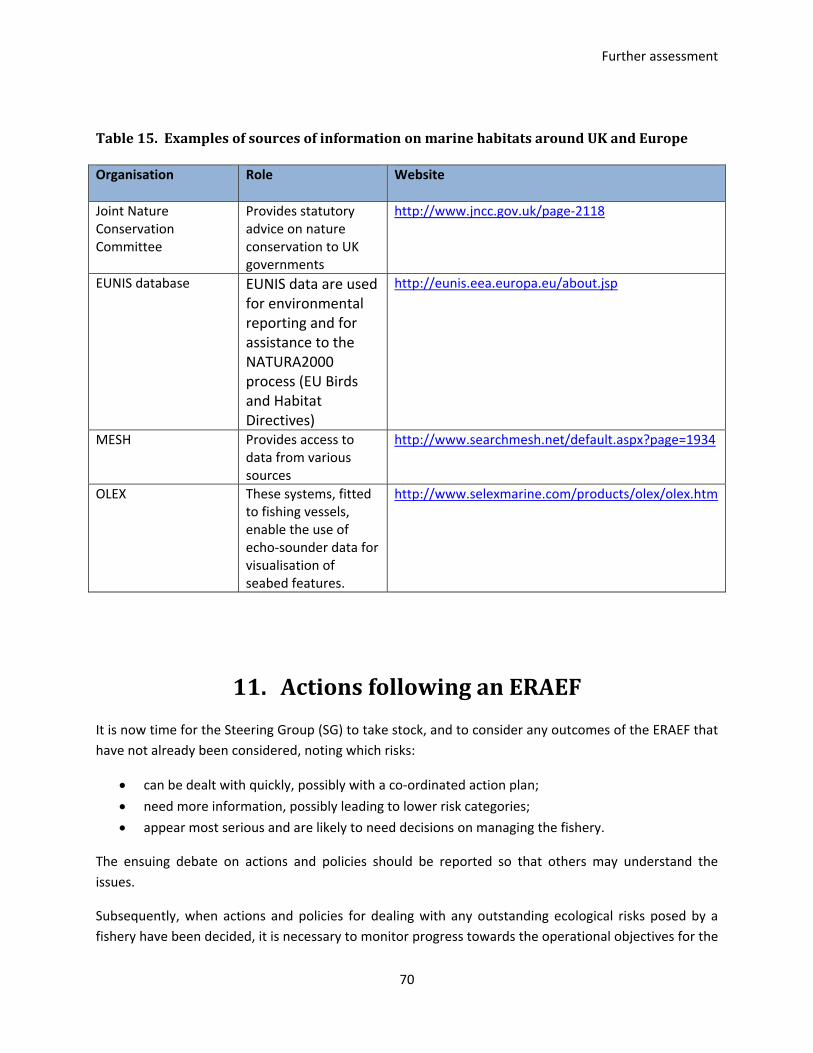
Further assessment
70
Table 15. Examples of sources of information on marine habitats around UK and Europe
Organisation
Role Website
Joint Nature Conservation Committee
Provides statutory advice on nature conservation to UK governments
http://www.jncc.gov.uk/page‐2118
EUNIS database EUNIS data are used for environmental reporting and for assistance to the NATURA2000 process (EU Birds and Habitat Directives)
http://eunis.eea.europa.eu/about.jsp
MESH Provides access to data from various sources
http://www.searchmesh.net/default.aspx?page=1934
OLEX These systems, fitted to fishing vessels, enable the use of echo‐sounder data for visualisation of seabed features.
http://www.selexmarine.com/products/olex/olex.htm
11. Actions following an ERAEF It is now time for the Steering Group (SG) to take stock, and to consider any outcomes of the ERAEF that have not already been considered, noting which risks:
• can be dealt with quickly, possibly with a co‐ordinated action plan;
• need more information, possibly leading to lower risk categories;
• appear most serious and are likely to need decisions on managing the fishery.
The ensuing debate on actions and policies should be reported so that others may understand the issues.
Subsequently, when actions and policies for dealing with any outstanding ecological risks posed by a fishery have been decided, it is necessary to monitor progress towards the operational objectives for the

Further assessment
71
ecosystem components and units most at risk from fishing activities. A ‘performance measure’ is needed that provides a clear statement of what is acceptable performance and what is not or, in other words, ‘the operational objective, indicator and performance measure are a package. All three are needed before any one of them is useful’ (Fletcher et al., 2005). Subsequently, the ERAEF steering group should meet occasionally with the following agenda:
• To supervise monitoring and the publishing of results,
• To ensure that any new information requested to improve risk assessments is being collected satisfactorily,
• To go over the ERAEF again in the light of new information and experience. Some risks may have been over‐emphasised previously, some under‐emphasised; others may not have been thought of. The known risks may have changed substantially if the levels and distribution of fishing effort has changed.
• To revise performance measures, operational objectives and, perhaps, the top‐level management goals if this seems necessary, e.g. in response to changing legislation.

References
72
References
Anonymous (1993) Convention on Biological Diversity. United Nations Environment Programme. Anonymous (2007) Report of the study group on risk assessment and management advice (SGRAMA).
ICES Resource Management Committee International Council for the Exploration of the Sea, Cape Town, South Africa, No. ICES CM 2007/RMC:02, 68pp.
Anonymous (2009) Report of the study group on risk assessment and management advice (SGRAMA). International Council for the Exploration of the Sea, Copenhagen, No. ICES CM 2009/RMC:09.
Anonymous (2010a) Review of seabird bycatch mitigation measures for pelagic longline fisheries. ICCAT Standing Committee on Research and Statistics 2010/051.
Anonymous (2010b) Summary advice for reducing the impact of pelagic longline gear on seabirds. ICCAT Standing Committee on Research and Statistics 2010/052.
Astles, K.L. (2008) A systematic approach to estimating ecological risks in marine fisheries. CABI Reviews: Perspectives in Agriculture, Veterinary Science, Nutrition and Natural Resources 3, 16pp.
Astles, K.L., Holloway, M.G., Steffe, A., Green, M., Ganassin, C., Gibbs, P.J. (2006) An ecological method for qualitative risk assessment and its use in the management of Fisheries in New South Wales, Australia. Fisheries Research 82, 290‐303.
Bergin, A. (1997) Albatross and longlining ‐ managing seabird bycatch. Marine Policy 21, 63‐72. Bianchi, G., Gislason, H., Graham, K., et al. (2000) Impact of fishing on size composition and diversity of
demersal fish communities. ICES Journal of Marine Science 57, 558‐571. Branch, T.A., Watson, R., Fulton, E.A., et al. (2010) The trophic fingerprint of marine fisheries. Nature
468, 431‐435. Breen, P.A. (1990) A review of ghost fishing by traps and gillnets. NOAA Technical Memorandum MAFF
Research Centre, Wellington, New Zealand, No. NOAA‐TM‐NMFS‐SWFSC‐154, 571‐599. Breitburg, D.L., Riedel, G.F. (2005) Multiple stressors in marine systems. In: Marine Conservation Biology;
the science of maintaining the sea's biodiversity. (Eds. E.A. Norse, L.B. Crowder), Island Press, Washington, pp 167‐182.
Brown, J., Macfadyen, G. (2007) Ghost fishing in European waters: impacts and management responses. Marine Policy 31, 488‐504.
Burgman, M. (2005) Risks and decisions for conservation and environmental management (ecology, biodiversity and conservation). Cambridge Univ. Press
Butchart, S.H.M., Stattersfield, A.J., Baillie, J., et al. (2005) Using Red List indices to measure progress towards the 2010 target and beyond. Philosophical Transactions of the Royal Society, B‐Biological Sciences. 360, 255‐268.
Caddy, J.F., Csirke, J., Garcia, S.M., Grainger, R.J.L. (1998) How pervasive is "fishing down marine food webs"? Science 282, 1383.
Callaway, R., Alsvåg, J., de Boois, I., et al. (2002) Diversity and community structure of epibenthic invertebrates and fish in the North Sea. ICES Journal of Marine Science 59, 1199‐1214.
Campbell, M.L., Gallagher, C. (2007) Assessing the relative effects of fishing on the New Zealand marine environment through risk analysis. ICES Journal of Marine Science 64, 256‐270.
Casini, M., Lövgren, J., Hjelm, J., Cardinale, M., Molinero, J.‐C., Kornilovs, G. (2008) Multi‐level trophic cascades in a heavily exploited open marine ecosystem. Proceedings of the Royal Society ‐ Biological Sciences (Series B) 275, 1793‐1801.
Caslake, R. (2009) Report of Seafish VMS project. Sea Fish Industry Authority, Grimsby, No. SFA003, 18. Commonwealth_of_Australia (1992) National strategy for ecologically sustainable development.,
Australian Government Publishing Service, Canberra, 128pp.

References
73
Commonwealth_of_Australia (2001) Guidelines for the ecologically sustainable management of fisheries., Department of Environment and Heritage, Canberra, 16pp.
Cortès, E., Arocha, F., Beerkircher, L., et al. (2009) Ecological risk assessment of pelagic sharks caught in Atlantic pelagic longline fisheries. Aquatic Living Resources 22, 1‐10.
Cotter, A.J.R. (2008) The "soundscape" of the sea, underwater navigation, and why we should be listening more. In: Advances in fisheries science; 50 years on from Beverton and Holt. (Eds. A.I.L. Payne, J. Cotter, T. Potter), Blackwell Publishing Ltd, Oxford, pp. 451‐471.
Cotter, A.J.R., Burt, L., Paxton, C.G.M., Fernandez, C., Buckland, S.T., Pan, J.‐X. (2004) Are stock assessment methods too complicated? Fish and Fisheries 5, 235‐254.
Cotter, J., Mesnil, B., Witthames, P., Parker‐Humphreys, M. (2009) Notes on nine biological indicators estimable from trawl surveys with an illustrative assessment for North Sea cod. Aquatic Living Resources 22, 135‐154.
Currie, D.R., Parry, G.D. (1996) Effects of scallop dredging on a soft sediment community: a large‐scale experimental study. Marine Ecology Progress Series 134, 131‐150.
Daan, N., Gislason, H., Pope, J.G., Rice, J.C. (2005) Changes in the North Sea fish community: evidence of indirect effects of fishing? ICES Journal of Marine Science 62, 177‐188.
Daskalov, G.M. (2008) Overfishing affects more than fish populations: a case of trophic cascades and regime shifts in the Black Sea. In: Advances in fisheries science 50 years on from Beverton and Holt. (Eds. A.I.L. Payne, A.J.R. Cotter, T. Potter), Blackwell Publishing, Oxford, UK., pp. 418‐433.
Daskalov, G.M., Grishin, A., Rodionov, S., Mihneva, V. (2007) Trophic cascades triggered by overfishing reveal possible mechanisms of ecosystem regime shifts. Proceedings of the National Academy of Sciences 104, 10518‐10523.
Denny, N.H., Jennings, S., Reynolds, J.D. (2002) Life‐history correlates of maximum population growth rates in marine fishes. Proceedings of the Royal Society ‐ Biological Sciences (Series B) 269, 2229‐2237.
Dulvy, N.K., Ellis, J.R., Goodwin, N.B., Grant, A., Reynolds, J.D., Jennings, S. (2004) Methods of assessing extinction risk in marine fishes. Fish and Fisheries 5, 255‐276.
Dulvy, N.K., Forrest, R.E. (2010) Life histories, population dynamics and extinction risks in chondrichthyans. In: Biology of sharks and their relatives. (Eds. J.C. Carrier, J.A. Musick, M.R. Heithaus), CRC Press, Washington, D.C., pp. 635‐675.
Dulvy, N.K., Jennings, S., Goodwin, N.B., Grant, A., Reynolds, J.D. (2005) Comparison of threat and exploitation status in North‐East Atlantic marine populations. Journal of Applied Ecology 42, 883‐891.
EC (2009) Green paper: Reform of the Common Fisheries Policy. Commission of the European Communities, Brussels, No. COM(2009)163, 27pp.
Eleftheriou, A. (2000) Marine benthos dynamics: environmental and fisheries impacts. In: ICES Journal of Marine Science. Vol. 57(5). pp. 1299‐1523.
EPA (1998) Guidelines for ecological risk assessment. US Environmental Protection Agency., Washington, DC, 188pp.
Erzini, K., Monteiro, C.C., Ribeiro, J., et al. (1997) An experimental study of gill net and trammel net 'ghost fishing' off the Algarve (southern Portugal). Marine Ecology Progress Series 158, 257‐265.
European_Parliament_and_Council (2008) Marine Strategy Framework Directive. Vol. Directive 2008/56/EC. European Commission, Brussels.
FAO (1995) Code of conduct for responsible fisheries. Food and Agriculture Organization of the United Nations, Rome, 40 pp. file:///C:/End%20Note.common/Papers/FAO_ResponsibleFisheries.pdf
FAO (2003) Fisheries management: 2. the ecosystem approach to fisheries. FAO Technical Guidelines for Responsible Fisheries. 4, 112pp.

References
74
FAO (2005a) Guidelines for the ecolabelling of fish and fishery products from marine capture fisheries. Food and Agriculture Organization of the United Nations, Rome, 90pp.
FAO (2005b) Putting into practice the ecosystem approach to fisheries. Food and Agriculture Organization, Rome, No. ISBN 9789251053966, 82pp.
FAO (2008) Fisheries management. 2. The ecosystem approach to fisheries. 2.1 Best practices in ecosystem modelling for informing an ecosystem approach to fisheries. Fisheries Technical Guidelines for Responsible Fisheries. Food and Agriculture Organization, Rome, No. 4, Suppl. 2, Add. 1, 78pp.
Fenichel, E.P., Tsao, J.I., Jones, M.L., Hickling, G.J. (2008) Real options for precautionary fisheries management. Fish and Fisheries 9, 121‐137.
Fletcher, W.J. (2005) The application of qualitative risk assessment methodology to prioritize issues for fisheries management. ICES Journal of Marine Science 62, 1576‐1587.
Fletcher, W.J., Chesson, J., Fisher, M., et al. (2002) National ESD reporting framework for Australian fisheries: the how to guide for wild capture fisheries. Canberra, No. FRDC Report 2000/145.
Fletcher, W.J., Chesson, J., Sainsbury, K., Hundloe, T.J., Fisher, M. (2005) A flexible and practical framework for reporting on ecologically sustainable development for wild capture fisheries. Fisheries Research 71, 175‐183.
Francis, R.I.C.C., Shotton, R. (1997) "Risk" in fisheries management: a review. Canadian Journal of Fisheries & Aquatic Sciences 54, 1699‐1715.
Frank, K.T., Petrie, B., Choi, J.S., Legget, W.C. (2005) Trophic cascades in a formerly cod‐dominated ecosystem. Science 308, 1621‐1623.
Frank, K.T., Petrie, B., Shackell, N.L., Choi, J.S. (2006) Reconciling differences in trophic control in mid‐latitude marine ecosystems. Ecology Letters 9, 1096‐1105.
Furness, R.W. (2003) Impacts of fisheries on seabird communities. Scientia Marina 67, 33‐45. García‐Cortés, B., Ortiz de Urbina, J., Others (2009) Trials with different hook and bait types in the
configuration of the surface longline gear used by the Spanish swordfish (Xiphias gladius) fishery in the Pacific Ocean. Collective Volume of Scientific Papers, ICCAT 64, 2469‐2498.
Garcia, M., Cochrane, K.L. (2005) Ecosystem approach to fisheries: a review of implementation guidelines. ICES Journal of Marine Science 62, 311‐318.
Gascoigne, J. (2009) UK Glass Eels MSC Assessment Dry‐Run SICA Workshop Report and Conclusions. MacAlister, Elliott & Partners Ltd., Lymington, Hampshire SO41 9AH, UK.
Genner, M.J., Sims, D.W., Southward, A.J., et al. (2010) Body size‐dependent responses of a marine fish assemblage to climate change and fishing over a century‐long scale. Global Change Biology 16, 517‐527.
Gray, M. (2010a) Environmental data gathering for environmental assessments ‐ basic seabed habitat mapping using acoustic ground discrimation sonar and underwater video. Sea Fish Industry Authority, Grimsby, UK., No. SR637, 32pp.
Gray, M. (2010b) Seafish standard sampling operating procedure: basic video mapping seabed habitat. Sea Fish Industry Authority, Grimsby, UK., No. SR639.
Grieve, C., Short, K. (2007) Implementation of Ecosystem‐Based Management in marine capture fisheries. Global Marine Programme, WWF International, Av. du Mont‐Blanc, 1196 Gland, Switzerland, 76pp.
Hall, K., Paramor, O.A.L., Robinson, L.A., et al. (2008) Mapping the sensitivity of benthic habitats to fishing in Welsh waters ‐ development of a protocol. Countryside Council for Wales, No. CCW [Policy Research] Report No. 8/12, 85 pp.
Hobday, A.J., Smith, A., Webb, H., et al. (2007) Ecological risk assessment for the effects of fishing: methodology. Australian Fisheries Management Authority, Canberra, Report R04/1072, 174 pp.

References
75
Jennings, S., Greenstreet, S.P.R., Hill, L., Piet, G.J., Pinnegar, J.K., Warr, K.J. (2002) Long‐term trends in the trophic structure of the North Sea fish community: evidence from stable‐isotope analysis, size‐spectra and community metrics. Marine Biology 141, 1085‐1097.
Jennings, S., Greenstreet, S.P.R., Reynolds, J.D. (1999a) Structural change in an exploited fish community: a consequence of differential fishing effects on species with constrasting life histories. Journal of Animal Ecology 68, 617‐627.
Jennings, S., Kaiser, M.J. (1998) The effects of fishing on marine ecosystems. Advances in Marine Biology 34, 201‐352.
Jennings, S., Lancaster, J., Woolmer, A., Cotter, J. (1999b) Distribution, diversity and abundance of epibenthic fauna in the North Sea. Journal of the Marine Biological Association of the United Kingdom 79, 385‐399.
Johannes, R.E. (1998) The case for data‐less marine resource management: examples from tropical nearshore finfisheries. TREE 13, 243‐246.
Kaiser, M.J., Bullimore, B., Newman, P., Lock, K., Gilbert, S. (1996) Catches in 'ghost fishing' set nets. Marine Ecology Progress Series 145, 11‐16.
Kerstetter, D.W., Pacheco, J.C., Others (2007) Preliminary results of circle and J‐style hook comparisons in the Brazilian pelagic longline fishery. Collective Volume of Scientific Papers, ICCAT 60, 2140‐2147.
Kirby, R.R., Beaugrand, G. (2009) Trophic amplification of climate warming. Proceedings of the Royal Society ‐ Biological Sciences (Series B) 276, 4095‐4103.
Kjesbu, O.S., Hunter, J.R., Witthames, P.R. (2003) Report of the working group on modern approaches to assess maturity and fecundity of warm‐ and cold‐water fish and squids. Institute of Marine Research, Bergen, Norway, No. Fisken og havet, 12, 140 pp.
Lackey, R.T. (1997) Ecological risk assessment: use, abuse, and alternatives. Environmental Management 21, 808‐812.
Lane, D.E., Stephenson, R.L. (1998) A framework for risk analysis in fisheries decision‐making. ICES Journal of Marine Science 55, 1‐13.
Law, R., Stokes, K. (2005) Evolutionary impacts of fishing on target populations. In: Marine conservation: the science of maintaining the sea's biodiversity. (Eds. E.A. Norse, L.B. Crowder), Island Press, Washington, pp. pp. 232‐246.
Mackinson, S., Daskalov, G.M. (2007) An ecosystem model of the North Sea to support an ecosystem approach to fisheries management: description and parameterisation. Cefas Science Series Technical Report Cefas, Lowestoft, No. 142, 195pp. file:///C:/End%20Note.common/Papers/North%20Sea%20ecosystem%20model_tech142.pdf
MacMullen, P., Hareide, N.‐R., Furevik, D.M., et al. (2003) FANTARED 2: A study to identify, quantify and ameliorate the impacts of static gear lost at sea. Sea Fish Industry Authority, Grimsby, No. Final report, EU Study Contract FAIR CT98‐4338.
Marchal, P., Andersen, B., Caillart, B., et al. (2007) Impact of technological creep on fishing effort and fishing mortality, for a selection of European fleets. ICES Journal of Marine Science 64, 192‐209.
Medley, P. (2006) ParFish ‐ participatory fisheries stock assessment. In: Stock assessment for fishery management. Vol. 487. FAO Fisheries Technical Paper, Food and Agriculture Organization of the United Nations, Rome, pp. 149‐162.
Medwin, H., Clay, C.S. (1998) Fundamentals of acoustical oceanography., Vol., Academic Press, Boston. Mejuto, J., García‐Cortés, B., Others (2008) Trials using different hook and bait types in the configuration
of the surface longline gear used by the Spanish swordfish (Xiphias gladius) fishery in the Atlantic Ocean. Collective Volume of Scientific Papers, ICCAT 62, 1793‐1830.
Milton, D.A. (2001) Assessing the susceptibility to fishing of rare trawl bycatch: sea snakes caught by Australia's northern prawn fishery. Biological Conservation 101, 281‐290.

References
76
Möllmann, C., Müller‐Karulis, B., Kornilovs, G., St. John, M.A. (2008) Effects of climate and overfishing on zooplankton dynamics and ecosystem structure: regime shifts, trophic cascade, and feedback loops in a simple system. ICES Journal of Marine Science 65, 302‐310.
Motos, L., Wilson, D.C. (2006) The knowledge base for fisheries management., (Developments in Aquaculture and Fisheries Science ‐ 36, Elsevier, Amsterdam.
MSC (2010) Fisheries assessment methodology and guidance to certification bodies including default assessment tree and risk‐based framework. Marine Stewardship Council, 122pp.
Musick, J.A. (1999) Criteria to define extinction risk in marine fishes. Fisheries 24, 6‐14. Myers, R.A., Baum, J.K., Shepherd, T.D., Powers, S.P., Peterson, C.H. (2007) Cascading effects of the loss
of apex predatory sharks from a coastal ocean. Science 315, 1846‐1850. Myers, R.A., Worm, B. (2003) Rapid worldwide depletion of predatory fish communities. Nature 423,
280‐283. Norse, E.A., Crowder, L.B. (2005) Marine Conservation Biology. Island Press, Washington, p. 470 pp. NRC (1999) Sustaining marine fisheries., (Committee on Ecosystem Management for Sustatinable
Marine Fisheries, Vol., National Research Council, National Academy Press, Washington, DC20418.
Oldenberg, L., Gilman, E., Others (2008) New longline gear technology reduces sea turtle interactions in the Hawaii‐based longline fishery. NOAA Technical memorandum NMFS SEFSC 569, 185pp.
Olson, R., Duffy, L., Maunder, M., et al. (2006) Use of productivity and susceptibility indices to evaluate vulnerability in the purse‐seine fishery of the eastern Pacific Ocean. In: Scientific Advisory Committee, 1st meeting. CIAT‐IATTC.
Onley, D., Scofield, P. (2007) Albatrosses, petrels and shearwaters of the world., Helm Field Guides, London.
Parkes, G., Walmsley, S.A., Cambridge, T., et al. (2009) Review of fish sustainability information schemes ‐ final report. Marine Resources Assessment Group Report Fish Sustainability Information Group, 194pp.
Patrick, W.S., Spencer, P., Link, J., et al. (2010) Using productivity and susceptibility indices to assess the vulnerability of United States fish stocks to overfishing. Fishery Bulletin NOAA/NMFS 108, 305‐322.
Patrick, W.S., Spencer, P., Ormseth, O., et al. (2009) Use of Productivity and Susceptibility Indices to Determine Stock Vulnerability, with Example Applications to Six U.S. Fisheries. NOAA Technical Memorandum National Marine Fisheries Service, No. NMFS‐F/SPO‐101, 90pp.
Pauly, D., Christensen, V., Dalsgaard, J., Froese, R., Torres, F.J. (1998) Fishing down marine food webs. Science 279, 860‐863.
Pauly, D., Watson, R. (2005) Background and interpretation of the ‘Marine Trophic Index’ as a measure of biodiversity. Philosophical Transactions of the Royal Society, B‐Biological Sciences. 360, 415‐423.
Pawson, M.G. (2003) The catching capacity of lost static fishing gears: introduction. Fisheries Research 64, 101‐105.
Petitgas, P., Cotter, J., Trenkel, V.M., Mesnil, B. (2009) Fish stock assessments using surveys and indicators. In: Aquatic Living Resources. Vol. 22(2). pp. 119‐253.
Piet, G., Jennings, S. (2005) Response of potential fish community indicators to fishing. ICES Journal of Marine Science 62, 214‐225.
Pikitch, E.K., Santora, C., Babcock, E.A., et al. (2004) Ecosystem based fishery management. Science 305, 346‐347.
Pilling, G.M., Apostolaki, P., Failler, P., et al. (2008) Assessment and management of data poor fisheries. In: Advances in Fisheries Science 50 years on from Beverton and Holt. (Eds. A.I.L. Payne, A.J.R. Cotter, T. Potter), Blackwell Publishing, Oxford, pp. 281‐305.

References
77
Pinnegar, J.K., Jennings, S., O'Brien, C.M., Polunin, N.V.C. (2002) Long‐term changes in the trophic level of the Celtic Sea fish community and fish market price distribution. Journal of Applied Ecology 39, 377‐390.
Pinnegar, J.K., Polunin, N.V.C., Badalamenti, F. (2003) Long‐term changes in the trophic level of western Mediterranean fishery and aquaculture landings. Canadian Journal of Fisheries & Aquatic Sciences 60, 220‐235.
Reiss, H., Kroncke, I., Ehrich, S. (2006) Estimating the catching efficiency of a 2‐m beam trawl for sampling epifauna by removal experiments. ICES J. Mar. Sci. 63, 1453‐1464.
Reynolds, J.D., Dulvy, N.K., Goodwin, N.B., Hutchings, J.A. (2005) Biology of extinction risk in marine fishes. Proceedings of the Royal Society ‐ Biological Sciences (Series B) 272, 2337‐2344.
Rosenberg, A., Agnew, D., Babcock, E., et al. (2007) Setting annual catch limits for US fisheries. An expert working group report. MRAG Americas, Washington DC.
Sainsbury, K. (2010) Review of ecolabelling schemes for fish and fishery products from capture fisheries. FAO Fisheries and Aquaculture Technical Paper Food and Agriculture Organization of the United Nations, Rome, No. No. 533, 102pp.
Sancho, G., Puente, E., Bilbao, A., Gomez, E., Arregi, L. (2003) Catch rates of monkfish (Lophius spp.) by lost tangle nets in the Cantabrian Sea (northern Spain). Fisheries Research 64, 129‐139.
Sethi, S. (2010) Risk management for fisheries. Fish and Fisheries 11, 341‐365. Shannon, L., Cury, P.M., Nel, D., et al. (2006) How can science contribute to an ecosystem approach to
pelagic, demersal and rock lobster fisheries in South Africa? African Journal of marine science 28, 115‐157.
Shin, Y.‐J., Rochet, M.‐J., Jennings, S., Field, J.G., Gislason, H. (2005) Using size‐based indicators to evaluate the ecosystem effects of fishing. ICES Journal of Marine Science 62, 384‐396.
Shirihai, H., Jarrett, B. (2006) Whales, dolphins and seals. A field guide to the marine mammals of the world., Vol., A & C Black, London.
Simpfendorfer, C., Cortès, E., Heupel, M., et al. (2008) An integrated approach to determining the risk of over‐exploitation for data‐poor pelagic Atlantic sharks. An expert working group report. Lenfest Ocean Program, 20pp.
Smith, A.D.M., Fulton, E.J., Hobday, A.J., Smith, D.C., Shoulder, P. (2007) Scientific tools to support the practical implementation of ecosystem‐based fisheries management. ICES Journal of Marine Science 64, 633‐639.
Spaulding, M.D., Fox, H.E., Allen, G.R., et al. (2007) Marine Ecoregions of the World: A Bioregionalization of Coastal and Shelf Areas. Bioscience 57, 573‐583.
Stobutzki, I., Miller, M., Brewer, D. (2001) Sustainability of fishery bycatch: a process for assessing highly diverse and numerous bycatch. Environmental Conservation 28, 167‐181.
Tasker, M.L., Camphuysen, K.C.J., Cooper, J., Garthe, S., Montevecchi, W.A., Blaber, S.J.M. (2000) The impacts of fishing on marine birds. ICES Journal of Marine Science 57, 531‐547.
Trenkel, V.M., Cotter, A.J.R. (2009) Choosing survey time series for populations as part of an ecosystem approach to fishery management. Aquatic Living Resources 22, 121‐126.
Tschernij, V., Larsson, P.‐O. (2003) Ghost fishing by lost cod gill nets in the Baltic Sea. Fisheries Research 64, 151‐162.
Walmsley, S.A., Howard, C., Medley, P. (2005) Participatory fisheries stock assessment (ParFish) guidelines. Marine Resources Assessment Group Ltd., London, UK. http://goo.gl/MqCEK
Walters, C.J., Christensen, V., Martell, S.J.D., Kitchell, J.F. (2005) Possible ecosystem impacts of applying MSY policies from single‐species assessment. ICES Journal of Marine Science 62, 558‐568.
Ward, P., Epe, S., Others (2009) The effects of circle hooks on bycatch and target catches in Australia's pelagic longline fishery. Fisheries Research 97, 253‐262.

References
78
Ward, P., Lawrence, E., others (2008) Large‐scale experiment shows that nylon leaders reduce shark bycatch and benefit pelagic longline fishers. Fisheries Research 90, 100‐108.
Watling, L. (2005) The global destruction of bottom habitats by mobile fishing gear. In: Marine conservation biology. The science of maintaining the sea's biodiversity. (Eds. E.A. Norse, L.B. Crowder), Island Press, Washington, p. 470 pp.
Woillez, M., Rivoirard, J., Petigas, P. (2009) Notes on survey‐based spatial indicators for monitoring fish populations. Aquatic Living Resources 22.
Worm, B., Barbier, E.B., Beaumont, N., et al. (2006) Impacts of biodiversity loss on ocean ecosystem services. Science 314, 787‐790.
Yokota, K., Kiyota, M., al., e. (2009) Effect of bait species and color on sea turtle bycatch and fish catch in a pelagic longline fishery. Fisheries Research 97, 53‐58.
Zhou, S., Griffiths, S.P. (2008) Sustainability assessment for fishing effects (SAFE): a new quantitative ecological risk assessment method and its application to elasmobranch bycatch in an Australian trawl fishery. Fisheries Research 91, 56‐68.