Unraveling The Impacts of Meteorological and Anthropogenic ...

U.S. Department of the InteriorU.S. Geological Survey
Open-File Report 2015–1017
Prepared in cooperation with the California Landscape Conservation Cooperative, California Department of Fish and Wildlife, and U.S. Fish and Wildlife Service
A Framework for Modeling Anthropogenic Impacts on Waterbird Habitats—Addressing Future Uncertainty in Conservation Planning


A Framework for Modeling Anthropogenic Impacts on Waterbird Habitats—Addressing Future Uncertainty in Conservation Planning
By Elliott L. Matchett, Joseph P. Fleskes, Charles A. Young, and David R. Purkey
Prepared in cooperation with the California Landscape Conservation Cooperative, California Department of Fish and Wildlife, and U.S. Fish and Wildlife Service
Open-File Report 2015–1017
U.S. Department of the Interior U.S. Geological Survey

U.S. Department of the Interior SALLY JEWELL, Secretary
U.S. Geological Survey Suzette M. Kimball, Acting Director
U.S. Geological Survey, Reston, Virginia: 2015
For more information on the USGS—the Federal source for science about the Earth, its natural and living resources, natural hazards, and the environment—visit http://www.usgs.gov or call 1–888–ASK–USGS (1–888–275–8747)
For an overview of USGS information products, including maps, imagery, and publications, visit http://www.usgs.gov/pubprod
To order this and other USGS information products, visit http://store.usgs.gov
Any use of trade, firm, or product names is for descriptive purposes only and does not imply endorsement by the U.S. Government.
Although this information product, for the most part, is in the public domain, it also may contain copyrighted materials as noted in the text. Permission to reproduce copyrighted items must be secured from the copyright owner.
Suggested citation: Matchett, E.L., Fleskes, J.P., Young, C.A., and Purkey, D.R., 2015, A framework for modeling anthropogenic impacts on waterbird habits—Addressing future uncertainty in conservation planning: U.S. Geological Survey Open-File Report 2015-1017, 40 p., http://dx.doi.org/10.3133/ofr20151017. ISSN 2331-1258 (online)

Contents Abstract ...................................................................................................................................................................... 1 Introduction ................................................................................................................................................................. 2
Water Evaluation and Planning System (WEAP) Software ..................................................................................... 5 Waterbird Habitats and Water Resources in the Central Valley .............................................................................. 6
Implications of Climate Change for Central Valley Waterbird Habitats ................................................................ 6 Water Supply Management for Central Valley Waterbird Habitats ...................................................................... 6
Methods ...................................................................................................................................................................... 7 Tool Development ................................................................................................................................................... 7
Model Development and Parameterization.......................................................................................................... 7 Basin Drainage and Water Supply Systems ...................................................................................................... 10
Valley Drainage Systems ............................................................................................................................... 10 Water Supply and Delivery Constraints ......................................................................................................... 10
Classification and Management of Central Valley Habitats ............................................................................... 11 Wetland Habitats ........................................................................................................................................... 11 Agricultural Habitats ....................................................................................................................................... 13
Model Calibration .............................................................................................................................................. 14 Calculating Area of Each Habitat Supported by Available Water Supplies ........................................................... 17 Scenario Development and Evaluation ................................................................................................................. 18
Climate Change Projections .............................................................................................................................. 18 Urban Growth Projections ................................................................................................................................. 19 Water Management: Streamflow Requirements ................................................................................................ 19 Water Management: Rice Land Idling ............................................................................................................... 20 Evaluating Scenarios ......................................................................................................................................... 20
Results ...................................................................................................................................................................... 21 Discussion ................................................................................................................................................................ 24
Challenges to Adapting the WEAP-CV Model for Waterbird Habitats ................................................................... 24 Modeling Lessons ................................................................................................................................................. 25 Applications of Modeling Approach ....................................................................................................................... 26
Conclusions .............................................................................................................................................................. 27 Acknowledgments .................................................................................................................................................... 28 References Cited ...................................................................................................................................................... 29 Appendix A. Description of Water Evaluation and Planning System Model for the Central Valley (WEAP-CV) and Adapted for Waterbird Habitats (WEAP-CVwh) Used in Scenario Modeling ....................................................... 32 Appendix B. Information Used in Producing Water Evaluation and Planning System Model for the Central Valley of California Adapted for Waterbird Habitat (WEAP-CVwh) for the Scenario Modeling Approach ...... 36

iv
Figures Figure 1. Modeling approach used to project future available waterbird habitats under various climate, land use, and water supply management scenarios ............................................................................................................................ 3 Figure 2. Central Valley Joint Venture (CVJV) hydrologic basins comprising the Central Valley of California .............. 4 Figure 3. As part of Water Evaluation and Planning System model for the Central Valley adapted for waterbird habitat (WEAP-CVwh), water supplies, demands, and delivery in part of Butte Basin, California, which the WEAP software represents as a system of links and node ............................................................................................ 9 Figure 4. Comparison of performance (modeled minus observed values [zero represents no difference]) of Water Evaluation and Planning system model for the Central Valley of California (WEAP-CV) with WEAP-CV adapted for waterbird habitat (WEAP-CVwh) for (A) Oroville Reservoir storage, (B) Shasta Reservoir storage, (C) Feather River streamflow at flow gage near Gridley, California, and (D) Sacramento River streamflow at flow gage near Colusa, California ................................................................................................................................ 15 Figure 5. Proportion of existing waterbird habitat in Butte Basin, Central Valley of California, projected under each modeling scenario evaluating impacts of climate, urbanization, and two changes in water supply management (a series of enhanced instream flow requirements [IFRs] on major Sacramento Valley streams include a 14 cubic meters per second [m3/s] requirement on Lower Butte Creek during October–June, and an additional year-round 142 m3/s requirement on each of the Sacramento and Feather Rivers; and Butte Basin rice-idling to meet urban water demands of Planning Areas 606 and 702) .................................................................. 22 Figure 6. Areas of Butte Basin, Central Valley of California, habitats used by waterbirds through the wintering period that are supported during the most severe drought period under each modeling scenario evaluated .............. 23
Tables Table 1. Management characteristics of habitats (excluding basin hydrologic unit [HU] geography and irrigation schedule) used by wintering waterbirds in the Water Evaluation and Planning system model for the Central Valley of California adapted for waterbird habitat (WEAP-CVwh) ............................................................................................ 12 Table 2. Water supply deliveries (in thousands of cubic meters per hectare) required for optimal management of winter-flooded rice and wetland habitats in the Butte Basin, California, as modeled in Water Evaluation and Planning system model for the Central Valley of California adapted for waterbird habitat (WEAP-CVwh) and reported in the literature ............................................................................................................................................... 16

v
Conversion Factors Inch/Pound to International System of Units
Multiply By To obtain
Area
acre 4,047 square meter (m2)
acre 0.4047 hectare (ha)
acre 0.4047 square hectometer (hm2)
acre 0.004047 square kilometer (km2)
Volume
cubic foot (ft3) 28.32 cubic decimeter (dm3)
cubic foot (ft3) 0.02832 cubic meter (m3)
acre-foot (acre-ft) 1,233 cubic meter (m3)
acre-foot (acre-ft) 0.001233 cubic hectometer (hm3)
Water application rate per unit area
acre-foot per acre (acre-ft/acre) 3,048 cubic meter per hectare (m3/ha)
International System of Units to Inch/Pound Multiply By To obtain
Length
meter (m) 3.281 foot (ft)
meter (m) 1.094 yard (yd)
kilometer (km) 0.6214 mile (mi)
Area
hectare (ha) 2.471 acre
hectare (ha) 0.003861 square mile (mi2)
square hectometer (hm2) 2.471 acre
square kilometer (km2) 247.1 acre
square kilometer (km2) 0.3861 square mile (mi2)
Volume
cubic meter (m3) 1.308 cubic yard (yd3)
cubic meter (m3) 0.0008107 acre-foot (acre-ft)
Flow rate
cubic meter per second (m3/s) 70.07 acre-foot per day (acre-ft/d)
cubic meter per second (m3/s) 35.31 cubic foot per second (ft3/s)
Water application rate per unit area
cubic meter per hectare (m3/ha) 0.0003281 acre-foot per acre (acre-ft/acre)
vi
Acronyms and Abbreviations CNRM-CM3 B1 Centre National de Recherches Météorologiques Coupled global climate Model, version 3, IPCC emissions scenario
based on a global human population peaking mid-century and declining thereafter
CVJV Central Valley Joint Venture
CVPIA Central Valley Project Improvement Act
DWR California Department of Water Resources
DU Ducks Unlimited, Inc.
EU expansive urbanization
GFDL-CM2.1 A2 Geophysical Fluid Dynamics Laboratory Coupled Model, version 2.1, IPCC emissions scenario based on a continuously increasing population
GCM global climate model
GIS geographic information system.
HU hydrologic unit
IFR instream flow requirement
IPCC Intergovernmental Panel on Climate Change
NCAR-CCSM3 A2 National Center for Atmospheric Research Community Climate System Model, version 3, IPCC emissions scenario based on a continuously increasing population
Seas. Wetl. Seasonal Wetland
Semip. Wetl. Semipermanent Wetland
SEI Stockholm Environment Institute
SU strategic urbanization
WEAP software Water Evaluation and Planning system software
WEAP-CV WEAP model for the Central Valley
WEAP-CVwh WEAP-CV model adapted for waterbird habitat
WF Rice Winter-flooded Rice
1
A Framework for Modeling Anthropogenic Impacts on Waterbird Habitats—Addressing Future Uncertainty in Conservation Planning
By Elliott L. Matchett1, Joseph P. Fleskes1, Charles A. Young2, David R. Purkey2
Abstract The amount and quality of natural resources available for terrestrial and aquatic wildlife habitats
are expected to decrease throughout the world in areas that are intensively managed for urban and agricultural uses. Changes in climate and management of increasingly limited water supplies may further impact water resources essential for sustaining habitats. In this report, we document adapting a Water Evaluation and Planning (WEAP) system model for the Central Valley of California. We demonstrate using this adapted model (WEAP-CVwh) to evaluate impacts produced from plausible future scenarios on agricultural and wetland habitats used by waterbirds and other wildlife. Processed output from WEAP-CVwh indicated varying levels of impact caused by projected climate, urbanization, and water supply management in scenarios used to exemplify this approach. Among scenarios, the NCAR-CCSM3 A2 climate projection had a greater impact than the CNRM-CM3 B1 climate projection, whereas expansive urbanization had a greater impact than strategic urbanization, on annual availability of waterbird habitat. Scenarios including extensive rice-idling or substantial instream flow requirements on important water supply sources produced large impacts on annual availability of waterbird habitat. In the year corresponding with the greatest habitat reduction for each scenario, the scenario including instream flow requirements resulted in the greatest decrease in habitats throughout all months of the wintering period relative to other scenarios. This approach provides a new and useful tool for habitat conservation planning in the Central Valley and a model to guide similar research investigations aiming to inform conservation, management, and restoration of important wildlife habitats. 1U.S. Geological Survey. 2Stockholm Environment Institute.

2
Introduction In many regions throughout the world, the future sustainability of many terrestrial and wetland
habitats and the ecology they support is in question (Myers, 1996; Hoekstra and others, 2005; Baldassarre and Bolen, 2006). In regions that are intensively managed for urban and agricultural uses, the amount and quality of land and water resources currently (2014) available for habitats are expected to decrease through time (Tilman and others, 2001; Brinson and Malvárez, 2002; Jetz and others, 2007). In addition to pressures from growing human populations and intensive agricultural production, changing climate and efforts to manage decreasing water supplies are likely to further impact water resources essential for sustaining habitats (Meyer, 1999; Jetz and others, 2007). It is the job of habitat conservation planning to provide a framework that can be feasibly implemented, and when implemented, ensures meeting habitat sustainability goals through time.
Projecting into the indefinite future, cumulative impacts of anthropogenic stressors on the natural resources, ecosystems, and habitats they support is highly uncertain (Pilkey-Jarvis and Pilkey, 2008). Unless accounted for, uncertainty in the future trajectory of impacts across regional and local scales confounds efforts by natural resource specialists to conserve, manage, and restore ecosystems and their habitats (Holling and Meffe, 1996; Peterson and others, 2003). For any given region, uncertain future change in climatic, demographic, socioeconomic, and institutional factors confers indefinite future conditions influencing habitat sustainability. Thus, given such inherent uncertainty, additional habitat management and conservation tools are needed to better understand and address the future potential impacts collectively caused by anthropogenic stressors.
In this report, we document a specific modeling approach useful for understanding impacts of a range of potential future climate, landscape management, and water supply management conditions on wildlife habitats (fig. 1). The approach first required producing a tool for modeling impacts of multiple combinations of factors on water and land resources supporting wildlife habitats. Scenario-based models commonly are used by practitioners in environmental and natural resource disciplines for addressing uncertainty in future conditions (for example, related to climate change). Using such a scenario modeling tool would enable the evaluation of impacts produced across a range of plausible future conditions to identify scenarios presenting the greatest threat to wildlife habitats. Thus, for a part of the Central Valley of California (an archetype of regional land use, water management, and climate change stressors on the local habitats; Fleskes, 2012; fig. 2), we document the development of a scenario analysis tool based on the Water Evaluation and Planning software (Yates and others, 2005a, 2005b).

3
Figure 1. Modeling approach used to project future available waterbird habitats under various climate, land use, and water supply management scenarios.

4
Figure 2. Central Valley Joint Venture (CVJV) hydrologic basins comprising the Central Valley of California.

5
This analysis tool was developed for evaluating future sustainability of habitats supporting waterbirds (but applying to other wildlife species as well) during the wintering period. (Waterbirds include many taxa that forage extensively, although not exclusively, in wetlands and other flooded habitats. Wintering period is defined to include months August–March.) To develop the tool, a Water Evaluation and Planning system (WEAP) model (hereafter referred to as WEAP model for the Central Valley of California or “WEAP-CV”) was adapted to more accurately model habitats for wintering waterbirds. The WEAP-CV model had been developed for, and represents, the watershed hydrology and water demands of the Central Valley region (Joyce and others, 2011). To adapt a WEAP-CV model for waterbirds, we:
1. Added winter-flooded agricultural habitats that had not been represented, 2. Updated and corrected the area of wetland habitats, 3. Distinguished certain water supply sources not specifically represented, 4. Combined multiple land cover datasets in a geographic information system (GIS)
(Environmental Systems Resource Institute, Inc., 2012) to calculate areas of various land cover classes, and
5. Made other changes while accommodating a variety of scenarios we wanted to examine. The resulting CV model adapted for waterbird habitat (that is, WEAP-CVwh) produces accurate estimates of projected available water supplies supporting agricultural and wetland habitats important for wintering waterbirds and water demands of all uses including for habitats. In modeling, WEAP-CVwh achieves this objective while also accounting for projected changes in land resources (for example, urbanization of agricultural land) upon which habitats depend. Subsequent to modeling, a methodology for calculating availability of each habitat was developed as a function of modeled water supplies and demands pertaining to habitats.
In combination, changing climate, urbanization, and changes in water supply management have the potential to greatly impact the amount and distribution of waterbird habitats on the Central Valley landscape. We are unaware of any other method that can be used to evaluate the combined and potentially synergistic effects of these factors on waterbird habitats in the Central Valley. Using this comprehensive accounting approach described herein, projections of climate (recent historical [years 1971–2000] climate and from global climate model results that were spatially-downscaled), land, and water resources management are varied to evaluate multiple scenarios reflecting different futures. Following a description of its development, we demonstrate the use of WEAP-CVwh for modeling habitat landscape conditions based on a range of scenarios. Finally, we describe lessons learned through this model-building and scenario-planning process. This report provides a new approach using a scenario-based water resources model for habitat conservation planning and protection. This research also may be informative in identifying specific software and its application for similar projects, or an additional application of the software for other WEAP users.
Water Evaluation and Planning System (WEAP) Software
Our approach allowed us to model surface water and groundwater supplies and water demands completely within a single framework using the commercial WEAP software developed by the Stockholm Environment Institute (SEI). A primary asset of the WEAP software is the ability to flexibly construct scenarios. Conditions representing any given scenario are projected into the future from a “Current Accounts” year representing existing conditions. The WEAP-CV was obtained from the State of California and SEI. WEAP-CV has undergone peer review, its use has been published, and it is being used by the State of California and others for water supply management and planning in the

6
Central Valley (for example, Yates and others, 2009; Joyce and others, 2010). In addition to modeling watershed hydrology, WEAP-CV contains the major components of water supply management and delivery systems, and water demands defined for California Department of Water Resources (DWR) “Planning Areas” (Joyce and others, 2010; figs. 2 and 3; appendix A). Thus, we determined that the WEAP-CV was a sufficiently representative model that could be adapted to develop a scenario analysis tool for evaluating concurrent impacts on water and land resources supporting Central Valley habitats.
Waterbird Habitats and Water Resources in the Central Valley
The Central Valley of California is one of the most important regions for waterbirds in North America (Fleskes, 2012). Waterbird habitats in the Central Valley (table 1; fig. 2) that are critical to waterfowl and other wetland birds are dependent on snow pack and other precipitation for water supplies. Surface water supplies entering hydrologic basins are either (1) produced at high elevation a great distance from valley habitats and generally are stored in reservoirs, or (2) available as rainfall and rainfall runoff. The hydrology of most waterbird habitats in the Central Valley, which include wetlands, flooded rice fields, and other flooded agricultural lands, has been greatly modified. Natural overflow flooding from snowmelt and rain mostly has been replaced by managed flooding with controlled diversions and pumped water delivery from ditches, rivers, sloughs, and wells. Thus, the amount of water stored in reservoirs is crucial to determining the amount of waterbird habitat in the Central Valley. During years with average or above-average reservoir levels, water is available to allow summer irrigations and normal fall flooding, and winter maintenance of managed habitats; winter rains provide additional winter habitat. Dry-to-extreme drought conditions can restrict summer irrigations, reducing wetland production of seeds, and reducing or delaying fall and winter flooding of wetlands, harvested rice fields, and other agricultural lands. Dry winters also produce little or no lowland or bypass (constructed floodplain designed for flood-control and contains waterbird habitats) flooding.
Implications of Climate Change for Central Valley Waterbird Habitats
Global climate models indicate substantial changes in the temperature and timing and amounts of precipitation in watersheds of the Central Valley (Cayan and others, 2009, 2012), which would cause temporal and spatial variations in many of the driving forces that define the availability and productivity of habitats. Changes in timing, amounts, and distribution of precipitation can have major impacts on waterbirds and their habitats. For instance, lack of adequate water supplies in the Central Valley could reduce productivity of wetland habitats, and the area of wetlands and post-harvest flooded crop fields, changing waterbird distribution in the valley (Fleskes and others, 2005; Ackerman and others, 2006). Climate-induced changes in water demand and soil moisture that impact vegetation and associated fauna and insects surrounding wetlands may reduce the ecosystem diversity and impact wetland habitats. Thus, climate change could alter when and where critical resources are available and needed for migratory birds.
Water Supply Management for Central Valley Waterbird Habitats
Statewide or regional changes in water supply management also can alter the timing and amount of water that is supplied to Central Valley waterbird habitats. In situations where water supplies become limited (for example, drought), water management entities prioritize allocation of supplies for various competing water uses. Certain water management practices may result in a reduction of water delivered to Central Valley habitats, thereby reducing the amount or productivity of habitats. Examples of changes

7
in water supply management in the Central Valley that may reduce the amount of water delivered to habitats include intensified idling of rice land to allow interregional water transfers, increased streamflow protection measures for fisheries, and urban expansion requiring water that would otherwise support habitats.
Methods First, we developed a tool for modeling potential effects of climate, urbanization, and water
supply management scenarios on water and land resources supporting habitats. Second, we developed a method to calculate the area of each habitat supported by available water supplies under each scenario evaluated. Finally, we developed and evaluated scenarios, which included identifying climate and land and water management factors potentially affecting water supply reliability, translating these factors into meaningful WEAP-CVwh scenarios, and evaluating scenarios using our approach.
Tool Development
Considerable work was required to adapt WEAP-CV to accurately model habitats for wintering waterbirds in the Central Valley, while accommodating a variety of scenarios we intended to evaluate. Initially, we researched land and water resource information and assessed regional and statewide water supply management policies (appendix B). Based on this research, we:
Identified important waterbird habitats and obtained pertinent habitat data, 1. Identified important supply sources for habitats, 2. Analyzed timing and amount of habitat water requirements, 3. Identified valley urban and agricultural drainage areas and managed drainage systems, 4. Analyzed water supply and delivery constraints pertaining to agriculture and wetlands, 5. Obtained urbanization projections and calculated projections of corresponding reductions in crop 6.
areas, Analyzed current and hypothetical supply prioritization of various wetland and crop types, 7. Identified proposed streamflow requirements dedicated for fisheries protection, and 8. Identified possible future rice land idling and water transfer scenarios that may impact habitats. 9.
Model Development and Parameterization
To accurately represent wintering waterbird habitat area and water needs, to facilitate model development, and to accommodate scenarios of interest, we used the above research information to develop WEAP-CVwh in finer temporal and spatial detail of hydrologic and land management characteristics than existed in WEAP-CV. This included adding winter-flooded agricultural habitats not represented in WEAP-CV, modifying land cover represented in WEAP-CV to also include wetland habitats identified in the Central Valley Joint Venture (CVJV) Plan (Central Valley Joint Venture, 2006), and distinguishing certain water supply sources not specifically represented in WEAP-CV. For each hydrologic unit (HU), drainage systems and water delivery constraints within basins also were characterized.

8
To model land cover and hydrology in finer temporal and spatial detail required for WEAP-CVwh, we created fine-scale HUs within CVJV basins and intersecting DWR Planning Areas and calculated land-cover areas of HUs (fig. 2). HUs were created using a GIS to intersect multiple datasets characterizing waterbird habitat conservation goals, water supplies and demands, and management of water supplies and drainage. Polygons produced from the intersections of these data represented basin HUs. Tabular data of total areas represented in WEAP-CV for wetlands (adjusted based on Central Valley Joint Venture [2006]) and other land cover types were apportioned among HUs in WEAP-CVwh using a GIS and multiple land cover datasets (appendix B). Using Butte Basin as an example, a GIS was used to create the boundaries of each area of intersecting CVJV subbasin (“Upper Butte” and “Butte Sink”), DWR Planning Area, Butte Creek Watershed boundary area, Upper watershed of West Branch of Feather River, and 500-m elevation contours related to Butte Basin hydrology and water demands. The resulting GIS layer delineating HUs then was intersected with GIS land cover data for various agricultural crops, wetlands, urban areas, and other non-irrigated areas. The final layer combining HU and land cover information was used to calculate proportions of each cover class among HUs. Corresponding with calculated proportions of crops, total crop areas already present in WEAP-CV were divided among HUs. Similarly, using calculated wetland proportions, we divided seasonal, semipermanent, and permanent wetland areas summarized in CVJV (2006), and based on additional information (Central Valley Joint Venture, 2000; Mark Petrie, Ducks Unlimited, Inc., unpub. data, October 2010), we reclassified wetland areas for each HU. Based on HUs delineating the Butte Creek watershed in WEAP-CVwh, we distinguished hydrology of Butte Creek from other sources that in the WEAP-CV were aggregated with Butte Creek. Natural and irrigation runoff and groundwater infiltration also were distinguished and modeled for each HU in Butte Basin.
In WEAP, basin characteristics are represented as a system of links and nodes (fig. 3). We developed and parameterized links and nodes characterizing land cover and hydrology for each HU. Using WEAP “catchment” nodes (appendix A) for each HU, we characterized (1) irrigated agriculture and public and private wetlands; (2) non-irrigated forest, non-forest, and barren land; and (3) urban cover types and hydrology. WEAP-CVwh catchment climate variables (appendix A, table A1) generally were populated with values used in WEAP-CV catchment nodes characteristic of the DWR Planning Area spatial scale. In a few situations requiring finer spatial detail of climate effects, such as disaggregating surface water streams across an expansive elevation gradient (represented in WEAP-CV as a single combined source), location-specific temperature and precipitation climate data were obtained (U.S. Department of the Interior and others, 2013). In WEAP-CVwh, Butte Creek was represented as a “river” link (table A1) with tributary inflow into the existing WEAP-CV Sutter Bypass “diversion” link (table A1). Catchments representing the upper watershed of Butte Creek were parameterized using an existing WEAP model of the Butte Creek system as a template (Thompson and others, 2012). We also added a Butte Creek “flow requirement” node (table A1) and minimum flow information reflecting historical regulatory constraints in the upper-middle reaches of Butte Creek (appendix B). In addition to specifying Butte Creek, we used river links to account for natural, agricultural, and urban-related drainage produced and available for use and reuse within and downstream of respective valley HUs. Supply prioritization of surface-water reservoirs and competing water uses already present in WEAP-CV generally were adopted in WEAP-CVwh (appendix A, table A2).

9
Figure 3. As part of Water Evaluation and Planning System model for the Central Valley adapted for waterbird habitat (WEAP-CVwh), water supplies, demands, and delivery in part of Butte Basin, California, which the WEAP software represents as a system of links and nodes. Links are defined as follows: water transmission to demand sites (green arrows), rivers (blue arrows), diversions (orange arrows). Nodes are defined as follows: surface storage reservoirs (green triangles), catchments (green circles), streamflow requirements (purple circles with cross-hairs), streamflow gages (blue circles with arrows). For illustrative purposes, runoff and infiltration links and urban demand site nodes are not shown.

10
Basin Drainage and Water Supply Systems
Valley Drainage Systems
The spatial relationships between drainage systems on the valley floor and waterbird habitats influence availability of drainage water usable by waterbird habitats. The amount of drainage water available to habitats depends on the location and size of drainage systems and associated area of local urban, agricultural, or other land cover. Habitats within and downstream of drainage systems have greater access to water collected within and draining from these systems. Return flows (for example, unconsumed irrigation tailwater inputs during the agricultural growing season) and local natural runoff are important water sources for many habitats, especially certain wetlands supplied entirely with return flows and local natural runoff. Therefore, we conducted additional research to identify the spatial extents and points of outflow (into major tributaries specified in the model) of local drainage systems. Because topography on the valley floor has been greatly altered for agricultural and urban development, it varies little and cannot be used reliably to identify valley drainage areas. Therefore, we reviewed the literature and compared literature references of drainage systems with spatially explicit GIS data (appendix B) to identify drainage areas and points of outflow. In a GIS, we combined existing GIS datasets and maps we digitized of drainage areas and points of outflow to produce a dataset delineating drainage areas. The drainage area dataset was intersected with other layers related to groundwater, DWR Planning Areas, and CVJV basin boundaries. The resulting layer characterized HUs based on variation in drainage areas, water supply sources, water and land management, and waterbird conservation goals for each basin. Thus, natural, agricultural, and urban-related drainage available for use and reuse within and downstream of each basin HU can be accounted for in WEAP-CVwh.
Water Supply and Delivery Constraints
Maximum limits on the amount of water delivered from individual water sources to meet water demands in WEAP-CV reflect physical limits of supply and delivery systems at the spatial scale of DWR Planning Areas. However, spatial detail of HUs is much higher than DWR Planning Areas, and water sources and the extent that each source is used varies substantially among basin HUs. Therefore, based on available information, we assessed water sources used for meeting basin water demands. In the assessment, we identified sources of information (appendix B) that delineated agencies, companies, and individuals that managed Central Valley water supplies for agricultural and managed wetland habitats within each HU. Based on this information, we conducted research on each water supplier to determine the surface streams, groundwater, or return flows that are diverted from or pumped as supply sources. Using multiple GIS datasets delineating land cover, water agency boundaries, water supply sources, and HUs (appendix B), we quantified the area of each land cover (classified as agriculture, private wetland, public wetland, or urban) in each HU by water source used. For each HU, the quantified area of a cover class receiving water from a given supply source was assumed to be proportional to the water demand of the respective cover class supported by that source. The fraction of a cover class’s water demand supported by each source was estimated as the cover class’s area receiving each source divided by the total area of the cover class. In a few specific situations, water source fractions were adjusted based on information that we believed to be more accurate than calculations. Calculated water source fractions were included in the model as constraints on the maximum amount of water supplied by each available source. Additionally, if research indicated limits in physical or operational capacity of major water delivery infrastructure, this information was included as additional constraints in WEAP-CVwh.

11
Classification and Management of Central Valley Habitats
Central Valley habitats important for waterbirds during the wintering period include wetlands and certain harvested crop fields (Central Valley Joint Venture 2006). In Colusa, Butte, Sutter, Yolo, American, and Delta Basins, rice and corn fields and wetlands are the predominant foraging habitats. In Suisun and San Joaquin Basins, wetlands are the predominant foraging habitats, and in Tulare Basin, wetlands and a variety of fields flooded after harvest or before planting provide waterbird habitat (Fleskes and others, 2012). Seasonal wetlands are the primary wetland type that provides food for wintering waterbirds, whereas semipermanent and permanent wetlands are important mainly as roosting habitat (Central Valley Joint Venture, 2006).
Wetland Habitats
Within a given basin, managed wetlands were classified in as many groups as current information would allow, which should better aid future refinement and accuracy of WEAP-CVwh as new information becomes available. Central Valley Joint Venture (2000) provided detailed information about privately owned wetlands by basin. Based on this and other information (appendix B), we were able to distinguish several wetland habitat types providing food for waterbirds (table 1). Wetland classifications were based on ownership, water supply source, water supply reliability, hydroperiod, and supply priority (table 1). We also accounted for the flooding schedule of managed wetlands in the Central Valley, where all such wetlands are not initially flooded at the same time and an increasing amount becomes inundated throughout much of the wintering period. Wetland flooding schedules (Central Valley Joint Venture, 2006; Mark Petrie, Ducks Unlimited, Inc., written commun., March 15, 2012) indicating the relative fractions of seasonal wetland areas that are flooded on biweekly intervals were used to interpolate inundated wetland areas from the middle of each month during the flooding period through the remaining season. Resulting seasonal wetlands included as land cover classes within catchments were divided into wetlands flooded initially by middle of August, September, October, and November (a small proportion of wetlands flooded initially in December were included in November). In our modeling, we assumed that hydroperiods of the few permanent wetlands in the Central Valley (Mark Petrie, Ducks Unlimited, Inc., written commun., October 7, 2010) were the same as semipermanent wetlands (i.e., flooded all months except August and September; Central Valley Joint Venture, 2000; Fleskes, 2012). We represented wetlands (table 1) within each HU using three catchments identifying publicly owned wetlands, privately owned wetlands with highly reliable supplies, and privately owned wetlands with less reliable supplies that rely on local natural and agricultural drainage water.

12
Table 1. Management characteristics of habitats (excluding basin hydrologic unit [HU] geography and irrigation schedule) used by wintering waterbirds in the Water Evaluation and Planning system model for the Central Valley of California adapted for waterbird habitat (WEAP-CVwh). [Water supply reliability: Adapted from Central Valley Joint Venture (2000). Reported “High” and “Moderate” reliability were classified herein as “High-reliability.” (We also classified as “High-reliability” certain atypical wetlands reported as “Low-reliability” using supplies in addition to return flows.) Supply priority: 1, highest; 3, equivalent to agriculture; RF, basically relies on agricultural return flows and generally consistent with “Low-reliability” water supply classification. Public wetlands with Central Valley Project Improvement Act (CVPIA) contracts have water supplies that are more secure than other public wetlands; thus, the difference in supply priority]
Habitat Ownership Water supply reliability Hydroperiod Supply priority
Wetland Public (CVPIA) High-reliability Seasonal 1 Wetland Public (CVPIA) High-reliability Semipermanent 1
Wetland Public High-reliability Seasonal 3
Wetland Public High-reliability Semipermanent 3
Wetland Private High-reliability Seasonal 3
Wetland Private High-reliability Semipermanent 3
Wetland Private Low-reliability Seasonal RF
Wetland Private Low-reliability Semipermanent RF
Winter-flooded rice Private 3
Unplowed winter-dry rice Private 3
Winter-flooded corn Private 3
Unplowed winter-dry corn Private 3
In addition to classifying and calculating areas for managed wetlands (see section, “Model Development and Parameterization,” for details), we specified model catchment parameter values for wetlands in WEAP-CVwh. Catchment soil and land-use variables (appendix A, table A1) initially were populated with values characteristic of managed wetland nodes already implemented in WEAP-CV; some parameter values were further adjusted during model calibration (see section, “Model Calibration,” for details). Catchment irrigation and pond-depth variables (appendix A, table A1) were parameterized and calibrated based on wetland management information (Central Valley Joint Venture, 2000, 2006). We considered our information on continuous flow through wetlands and winter-flooded rice fields for maintaining water quality and reducing disease risk in them to be inadequate to model this management practice; consequently, the ponding release requirement parameter was not used in WEAP. The supply prioritization of wetlands (table 1) was based on wetland water supply and delivery operations (appendix B).
13
Agricultural Habitats
Agricultural foraging habitats for wintering waterbirds in Sacramento Valley basins were classified as winter-flooded rice, unplowed winter-dry rice, and unplowed winter-dry corn based on habitats identified in Central Valley Joint Venture (2006) (table 1). Other agricultural waterbird habitats exist elsewhere in the Central Valley (for example, flooded corn and wheat in the Delta Basin). The estimated fraction of post-harvested rice that is flooded in fall/winter varies among CVJV basins (Fleskes and others, 2005; estimates provided by Kevin Petrik, formerly of Ducks Unlimited, Inc., written commun., June 13, 2012). We calculated the total area of winter-flooded rice within each HU as the product of basin-specific fractions of flooded rice and the total rice area within each HU previously calculated using a GIS (see section, “Model Development and Parameterization,” for details). As with seasonal wetlands, the total area of winter-flooded rice was divided into mid-monthly amounts for October–March, equating to four land cover classes, according to timing of initial flooding (Central Valley Joint Venture, 2006). Winter-flooded rice land cover classes were added to HU catchments containing the suite of crop classes calculated in the GIS by dividing “rice” into winter-flooded and winter-dry classes. (Note: Some winter-dry rice is deep-plowed and, thus, is not waterbird habitat; this rice was excluded as habitat in later processing steps [see section, “Calculating Area of Each Habitat Supported by Available Water Supplies,” for details].) We also produced additional habitat catchments representing winter-flooded rice, dry rice, corn, pasture, and alfalfa. Depending on the scenario, these additional catchments allow flexibility in allocating a certain fraction of respective agricultural habitats to a separate supply priority from the rest of agriculture.
We specified WEAP-CVwh catchment parameter values for agricultural habitats similarly as for wetlands. To model winter flooding of rice in WEAP-CVwh, a capability not in WEAP-CV, we adopted catchment parameter values from rice in WEAP-CV to parameterize crop coefficient, soil water capacity, root zone conductivity, and preferred flow direction variables. Similarly, we adopted from fallow land in WEAP-CV values for the runoff resistance factor variable (appendix A, table A1). Irrigation and pond-depth variables could not be populated with WEAP-CV parameter values. Therefore, these variables were parameterized from information on post-harvest management of rice ( California Department of Water Resources, 2003; Central Valley Joint Venture, 2006). Irrigation and pond-depth parameters were further adjusted during model calibration (see section, “Model Calibration,” for details).

14
Model Calibration
After WEAP-CV was revised to include additional habitats, water supplies, and water delivery constraints, WEAP-CVwh was calibrated by evaluating model performance and adjusting model parameters where necessary to improve accuracy. Model performance was evaluated by comparing modeled water supplies and habitat demands with observed water supplies and habitat demands under recent historical (years 1971-2000) climate and water demands. We compared differences in model output and stream gage and reservoir storage measurements between the WEAP-CV and WEAP-CVwh to assess their relative performance.
WEAP-CVwh generally performed slightly better in tracking patterns and magnitudes of observed streamflow and reservoir storage of major water bodies than WEAP-CV (fig. 4). Model parameters that determined operations of the Round Valley and Philbrook Reservoirs were obtained from an earlier WEAP study of the Butte Creek system (Thompson and others, 2012). In calibrating wetland soil, irrigation, and pond-depth parameters, modeled monthly and annual water deliveries (in thousands of cubic meters per hectare) were compared to wetlands with water application rates reported for optimal management of wetlands (Central Valley Joint Venture, 2000). In calibrating irrigation and pond-depth parameters for winter-flooded rice, we compared modeled water deliveries (in thousands of cubic meters per hectare) during October–February to reported deliveries over the same months (California Department of Water Resources, 2003). Modeled delivery amounts used in this comparison are based on a model simulation producing full supply allocation to wetlands and rice (that is, modeled optimal supply delivery). During calibration, irrigation and pond-depth parameters were adjusted within a range of values characteristic of water management for wetlands and winter-flooded rice (Central Valley Joint Venture, 2000; California Department of Water Resources, 2003). One additional wetland catchment soil and land-use parameter (root zone hydraulic conductivity) was adjusted during calibration to improve modeling performance of seasonal and semipermanent wetland water demands. Calibration of habitat parameters generally resulted in close agreement between modeled and reported deliveries (table 2).

15
Figure 4. Comparison of performance (modeled minus observed values [zero represents no difference]) of Water Evaluation and Planning system model for the Central Valley of California (WEAP-CV) with WEAP-CV adapted for waterbird habitat (WEAP-CVwh) for (A) Oroville Reservoir storage, (B) Shasta Reservoir storage, (C) Feather River streamflow at flow gage near Gridley, California, and (D) Sacramento River streamflow at flow gage near Colusa, California.

16
Table 2. Water supply deliveries (in thousands of cubic meters per hectare) required for optimal management of winter-flooded rice and wetland habitats in the Butte Basin, California, as modeled in Water Evaluation and Planning system model for the Central Valley of California adapted for waterbird habitat (WEAP-CVwh) and reported in the literature. [Habitat: WF Rice, Winter-flooded rice; Seas. Wetl., Seasonal Wetland; Semip. Wetl., Semipermanent Wetland. Year: Reported values for winter flooding of rice occurring during October–February are based on California Department of Water Resources (2003); annual, but not monthly (blank cells), reported values were available in the literature. Reported values for wetlands were based on Central Valley Joint Venture (2006). "Wet", "Normal”, and "Dry" water-year classifications are based on the Sacramento Valley Hydrologic Index. Percent difference (Perc. diff.): Defined as (Modeled Annual Total - Reported Annual Total)/Reported Annual Total × 100. Reported Annual Total used in this calculation for Winter-flooded rice is the median (5.5)]
Habitat Year Oct Nov Dec Jan Feb Mar Apr May June July Aug Sept Annual
total Perc. diff.
WF Rice 1998 (Wet) 4.9 0.3 0.3 0.0 0.0 0.0 0.0 0.0 0.0 0.0 0.0 0.0 5.5 0 2000 (Normal) 4.9 0.9 0.6 0.0 0.0 0.0 0.0 0.0 0.0 0.0 0.0 0.0 6.4 22
2001 (Dry) 4.3 1.2 0.6 0.0 0.0 0.0 0.0 0.0 0.0 0.0 0.0 0.0 6.1 15
Reported 3.0–7.6
Seas. Wetl. 1998 (Wet) 1.5 0.0 0.6 0.0 0.0 0.6 0.0 2.1 0.0 0.0 3.0 7.3 14.9 -12
2000 (Normal) 1.5 0.6 0.9 0.0 0.0 0.9 0.0 3.0 0.0 0.0 3.4 7.3 17.7 4
2001 (Dry) 0.9 0.9 0.9 0.0 0.3 1.2 0.0 3.4 0.0 0.0 3.4 7.3 18.3 7
Reported 1.5 1.2 0.6 0.6 0.6 0.6 0.0 3.0 0.0 0.0 2.7 6.1 17.1
Semip. Wetl. 1998 (Wet) 9.8 0.0 0.6 0.0 0.0 0.6 1.2 0.6 2.4 3.0 0.0 0.0 18.6 -18
2000 (Normal) 10.1 0.6 0.9 0.0 0.0 0.9 1.2 1.8 2.7 3.0 0.0 0.0 21.9 -3
2001 (Dry) 9.4 0.9 0.9 0.0 0.3 1.2 1.2 2.4 2.7 3.0 0.0 0.0 22.6 0
Reported 9.1 1.2 0.6 0.6 0.6 1.2 1.5 1.5 3.0 3.0 0.0 0.0 22.6

17
Calculating Area of Each Habitat Supported by Available Water Supplies
This scenario modeling approach required translating land and water resources output produced from the scenario modeling tool (WEAP-CVwh) into habitat areas supported by projected water supplies. To achieve this objective, WEAP-CVwh output was post-processed in spreadsheets to translate amount and timing of water available compared to water needed to support optimal management of habitats. Modeling scenarios of interest provided output on water availability for each scenario. However, two additional steps were needed to calculate the water requirement for optimal habitat management to compare with water available based on scenarios. First, we made changes to the model to ensure that habitats received full supply in every month. Second, we modeled the delivery of the full water requirement to habitats under each climate projection and historical climate because water demand varies with climate. Calculations initially were performed for each habitat type that combined land cover, hydroperiod, irrigation schedule (for example, October–March), ownership (for example,, private), water reliability (for example, low reliability), supply priority (for example, 1), and geography (generally reflected in HUs). WEAP-CVwh output on monthly amount of water supply delivered (in thousands of cubic meters) and total area of each habitat (in hectares) was used to calculate monthly volume per area rates of water delivery (in thousands of cubic meters per hectare). Calculating volume per area rates allowed us to broadly compare water availability in each scenario with water required in situations for which projected habitat areas change (for example, scenarios having different rates of urbanization). Because water supplied to users generally is based on annual (not monthly) water allocations that depend on environmental conditions (for example, dryness of year), we further calculated annual unit area rates of water deliveries. For each habitat, the ratio of available water to required amount of water (both in thousands of cubic meters per hectare) represents the fraction of total annually available area of habitat.
Subsequent to water supply modeling, the availability of each habitat under each scenario was calculated as a function of modeled water supplies and demands pertaining to habitats. Because the wintering period includes two water years, two sets of annual (water-year) fractions of habitat areas were used to multiply with the annual areas of respective years to calculate habitat areas for both years within a season. To calculate monthly available habitat areas, we adjusted the calculated annual habitat areas to reflect temporal variation in harvest of rice (U.S. Department of Agriculture, 2011) and corn (U.S. Department of Agriculture, 2010), and timing of normal flooding of wetlands and harvested fields (Central Valley Joint Venture, 2006) through the wintering period. In years for which water required for the winter flooding of rice (October–February) is insufficient for optimal flooding, we generalized allocation of available water for winter flooding in later months. For example, the rice area estimated to be normally available as winter-flooded rice habitat in October, under supply limitation, is alternatively calculated as winter-dry rice habitat until flooding is possible in November or later, depending on severity of water limitation. We assumed based on observations that when water supplies are limited, many managers delay winter flooding until the start of waterfowl hunting season in late October, after which runoff from precipitation generally is available to help maintain habitats until the end of hunting season in late January. Ultimately, we produced projections of the amount of habitat available during each month of the wintering period from August through March under each scenario.

18
Scenario Development and Evaluation
We reviewed literature and contacted researchers and managers to identify climate and land and water management potentially affecting water supply reliability (appendix B). We then modified structural elements (links and nodes) and specified related parameters in WEAP-CVwh to translate these factors into meaningful WEAP-CVwh scenarios and to develop the model structure needed for efficient and flexible evaluation of scenarios. Minor differences in model design can effectively result in different scenarios being evaluated, or result in more or less flexibility to evaluate similar scenarios. We define elements of model specification in more detail below for selected scenarios we are using to demonstrate our scenario modeling approach.
Climate Change Projections
Recent historical (years 1971–2000) climate and a range of downscaled climate change projections, including projections of key interest, already are represented in WEAP-CV. As climate change models improve, updated projections may be included in future scenarios. The three climate change projections that we evaluated (Salas-Mélia and others, 2005; Collins and others, 2006; Delworth and others, 2006; Stouffer and others, 2006; Cayan and others, 2009) were:
1. CNRM-CM3 B1 (Centre National de Recherches Météorologiques Coupled global climate Model, version 3, Intergovernmental Panel on Climate Change [IPCC] emissions scenario based on a global human population peaking mid-century and declining thereafter),
2. NCAR-CCSM3 A2 (National Center for Atmospheric Research Community Climate System Model, version 3, IPCC emissions scenario based on a continuously increasing population), and
3. GFDL-CM2.1 A2 (Geophysical Fluid Dynamics Laboratory Coupled Model, version 2.1, IPCC emissions scenario based on a continuously increasing population).
These climate projections were selected because they are a subset of projections previously
selected to investigate climate change impacts on California and they represent a broad range of potential future climate conditions (Cayan and others, 2009). Temperature and precipitation data for 12 climate change projections (Nakicenovic and others, 2000; Cayan and others, 2009) through year 2099, including these 3 projections, can be identified by geographic location, downloaded, and stored in comma-seperated values format (U.S. Department of the Interior and others, 2013) that can be read in WEAP. These climate projections have been bias-corrected and further scaled down to 0.125 degree (12 × 12 km2) resolution from the 2.5-degree (275 × 275 km2) resolution of antecedent global climate models (GCMs).

19
Urban Growth Projections
California has one of the most rapidly increasing human populations (in total residents) in the United States (American Farmland Trust, 1995; U.S. Census Bureau, 2014), and resulting urbanization impacts waterbirds by replacing their agriculture and wetland habitats with urban areas and by reducing water available for habitat management (Hathaway and Welch, 2002; Fleskes, 2012). We evaluated “strategic” and “expansive” urban growth scenarios developed for the California Water Plan Update 2013 (California Department of Water Resources, 2013) that differed substantially in terms of projected growth. Depending on region (that is, DWR Planning Area) within the Central Valley and Sacramento-San Joaquin Delta, total irrigated crop area was projected to decrease by 0–29 percent under strategic growth rates and 18–86 percent under expansive growth rates by year 2100. Crop projections that we calculated through year 2099 produce uniform decreases in areas of all crop types by the proportion of projected total crop area decreases in respective DWR Planning Areas. We produced corresponding projections of increases in urban outdoor areas specific to each DWR Planning Area to represent crop land conversion into urban area. We produced projections of urban indoor demands for each growth scenario by scaling urban indoor household (single- and multi-family), industrial, and commercial demand units to appropriately correspond with urban outdoor demand projections.
Water Management: Streamflow Requirements
Streamflow requirements can impact waterbirds by restricting the timing and amount of water that can be diverted for waterbird habitat management. Numerous environmental flow requirements exist in WEAP-CV, and other flow requirements have been proposed for streams throughout the Central Valley (for example, reduced diversions to augment flows in Butte Creek for spring-run Chinook salmon and steelhead trout migration and rearing [California Department of Fish and Game, 2005]). For demonstration purposes, we modeled a hypothetical scenario reflecting greater fisheries protection by requiring that minimum instream flow requirements (IFRs) during October–June be increased by 142 m3/s year-round in the Sacramento and Feather Rivers and by 14 m3/s during October–June in Butte Creek and the Sutter Bypass. Modeling Butte Creek and Sutter Bypass flow requirements in WEAP-CVwh involved adding flow requirement nodes on Butte Creek upstream of the Butte Slough-Sutter Bypass confluence and on the Sutter Bypass downstream of Sacramento Slough.
The streamflow requirements modeled for Sacramento and Feather Rivers, respectively, represent mean annual increases of 118 and 465 percent in minimum flow compared to flow requirements already existing in the model. The flow requirements modeled for Butte Creek and Sutter Bypass represent a mean annual increase of 1,022 percent in minimum flow compared to an existing flow requirement on Butte Creek that is upstream of the modeled flow requirements. Modeled flow requirements were for demonstration; scenario flow requirements were not intended to model (and would likely exceed) proposed or future flow requirements for these tributaries.

20
Water Management: Rice Land Idling
Rice fields provide a large proportion of the food habitat for many waterfowl and other waterbird species (Elphick and Oring, 1998). To demonstrate how water supply management potentially could impact the amount of rice habitat, we modeled scenarios for which unmet urban water demands (indoor and outdoor) in and west of the San Joaquin and Tulare Basins (that is, WEAP-CVwh Planning Areas 606 and 702) were fulfilled by allowing through-Delta transfer of water supplies made available by increased fallowing of rice land in Butte Basin (fig. 2). For scenarios combining rice land idling with projected urbanization, urban water demand was projected through year 2065 based on projected urban growth throughout the Central Valley. Thus, unmet urban demand for water in Planning Areas 606 and 702 also changed through time with projected urbanization.
This scenario allowed for unlimited fallowing of rice land in Butte Basin necessary to meet any unmet water needs in Planning Areas 606 and 702, assuming that the use of water transferred from the Sacramento River system would be preferable to other available water supplies (that is., groundwater and San Joaquin River water), and that development of any required new local water distribution facilities would be cost-effective. In this scenario, all water was transferred solely during July–September (when allowed by current transfer policy) directly to WEAP-CVwh Planning Areas 606 and 702 for urban demands, and no additional water was transferred to storage in the San Luis Reservoir throughout the year. Specific changes were made to the model structural components and model constraints to appropriately model the amount of supply that could be transferred based on scenario assumptions (appendix A, table A3).
Evaluating Scenarios
For demonstration purposes, we present modeling results of four of the scenarios that we developed, representing a range of conditions, and combine the three climate change projections (and recent historical [years 1971–2000] climate for comparison), two urban growth projections, and two water supply management scenarios. Modeling results indicated impacts of monthly historical (1971–2000) and projected (2006–2065) changes in climate and urbanization and changes in water management on waterbird habitats within basins. For evaluating climate change impacts, modeling results were further divided for each scenario into “projection” periods 2006–2035 (30 years) and 2036–2065 (30 years). To demonstrate using our modeling approach, results were provided for the following scenarios 1-4, representing a range of land and water resource conditions in Butte Basin through year 2065:
• Scenario 1. CNRM-CM3, B1 projected climate + Strategic urban growth projection; • Scenario 2. NCAR-CCSM3, A2 projected climate + Expansive urban growth projection; • Scenario 3. Historical climate + Strategic urban growth projection + Sacramento River, Feather
River, and Butte Creek IFRs; and • Scenario 4. GFDL-CM2.1, A2 projected climate + Expansive urban growth projection +
Unlimited Butte Basin rice-idling to meet urban water demands of Planning Areas 606 and 702.
21
Results
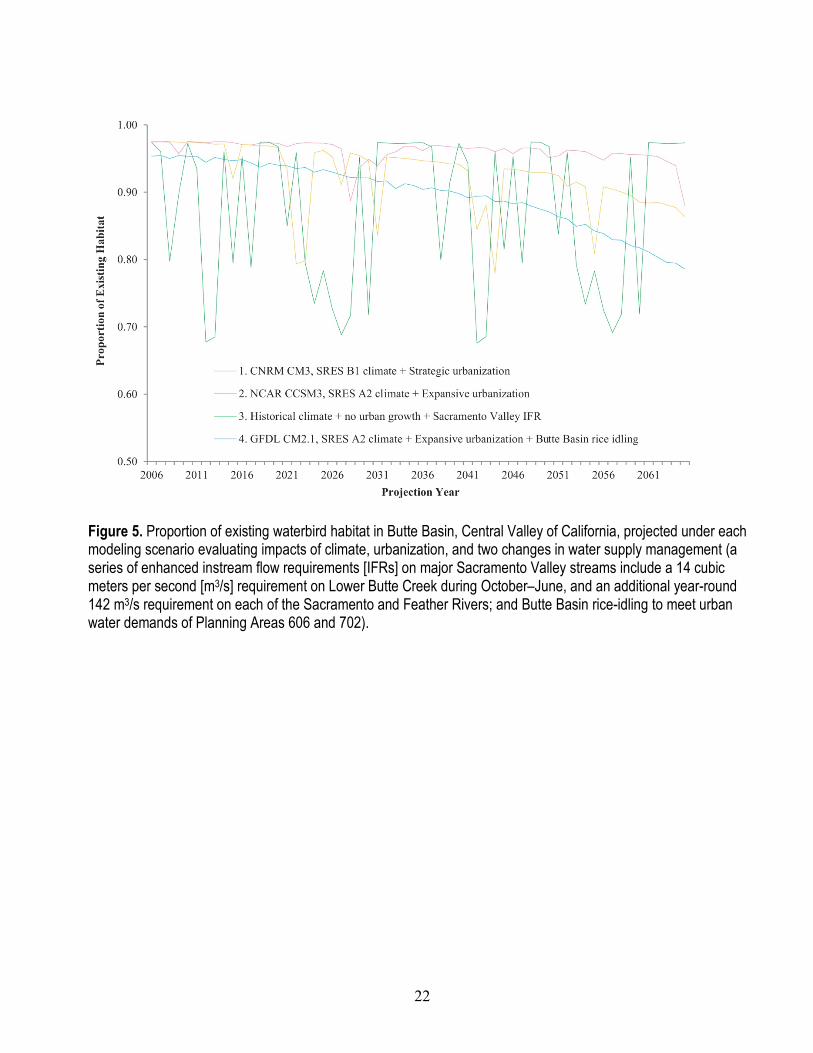
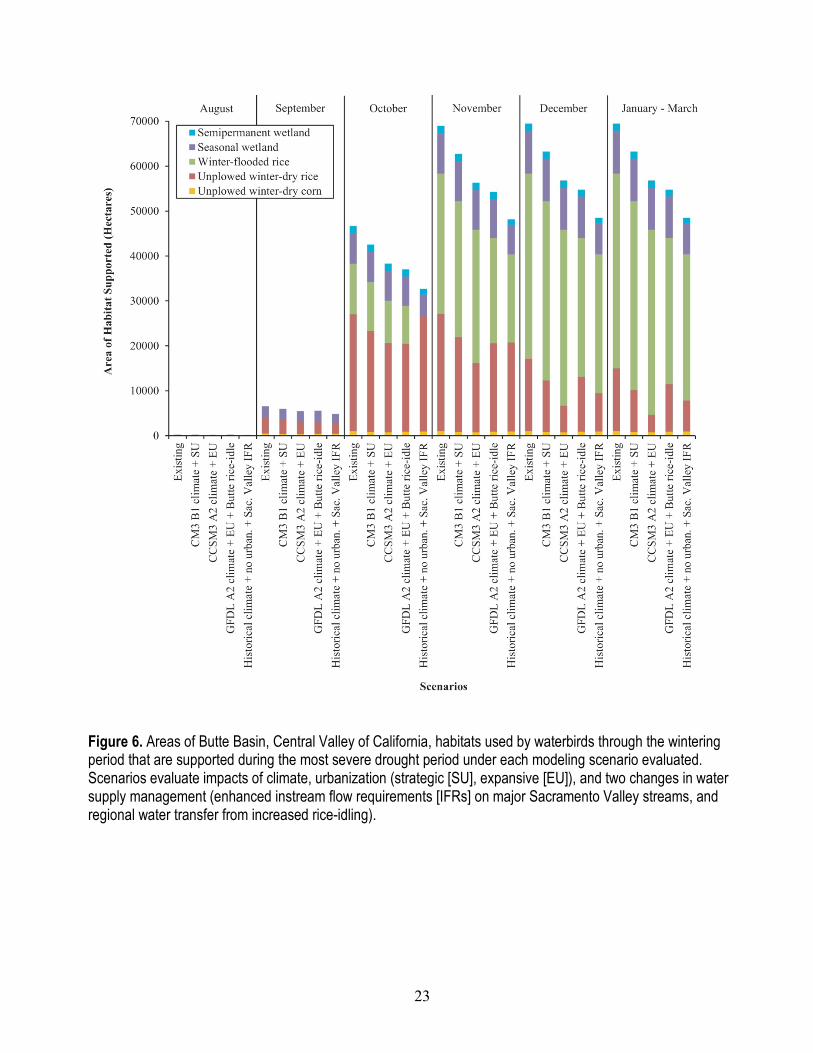
Results of the four climate-urbanization-water management scenarios through year 2065 demonstrate potential marked decreases in availability of Central Valley waterbird habitats. The climate impacts on waterbird habitats of scenario 2 (including the NCAR-CCSM3 A2 climate projection) were more frequent and generally more severe than the impacts of scenario 1 with the CNRM-CM3 B1 climate projection (fig. 5). Relative to NCAR-CCSM3 A2 and CNRM-CM3 projections and to each other, projected impacts of historical and GFDL-CM2.1 A2 climates could not be easily interpreted because of interactions with water management also included in these scenarios. Among scenarios 1 and 2 that did not include water management, projected impacts of urbanization on habitat were cumulative and greater for expansive urbanization than for strategic urbanization (fig. 5). Water management change scenarios 3 and 4 produced substantial decreases in waterbird habitats (fig. 5). In scenario 3, which included the IFRs, the greater fraction of the water required to remain in streams for fisheries greatly decreased diversions in historically dry years and, thus, waterbird habitat availability (fig. 5). Scenario 4, which included rice-idling, resulted in the greatest cumulative decrease in habitat, showing impacts of the increasing demand for transferred water as the populations in Planning Areas 606 and 702 grow (fig. 5). Impacts varied among types of waterbird habitats and months. In periods of severe drought, winter-dry rice was projected to be most impacted (fig. 6). Among the four example future scenarios modeled, scenario 3 including the IFRs caused the greatest decrease in habitats throughout all months of the wintering period, and no rice was winter-flooded in October because limited water supplies were allocated for rice in later months (fig. 6). However, scenario 4, including water transfer-rice idling, also produced similarly substantial reductions in winter-flooded rice habitat during November–March (fig. 6).
22
Figure 5. Proportion of existing waterbird habitat in Butte Basin, Central Valley of California, projected under each modeling scenario evaluating impacts of climate, urbanization, and two changes in water supply management (a series of enhanced instream flow requirements [IFRs] on major Sacramento Valley streams include a 14 cubic meters per second [m3/s] requirement on Lower Butte Creek during October–June, and an additional year-round 142 m3/s requirement on each of the Sacramento and Feather Rivers; and Butte Basin rice-idling to meet urban water demands of Planning Areas 606 and 702).
23
Figure 6. Areas of Butte Basin, Central Valley of California, habitats used by waterbirds through the wintering period that are supported during the most severe drought period under each modeling scenario evaluated. Scenarios evaluate impacts of climate, urbanization (strategic [SU], expansive [EU]), and two changes in water supply management (enhanced instream flow requirements [IFRs] on major Sacramento Valley streams, and regional water transfer from increased rice-idling).

24
Discussion Although we focused our efforts on providing a tool for guiding habitat conservation for
waterbirds, a similar scenario modeling tool and process could be used to address future uncertainty in habitat sustainability for other species as well. Our results were provided as instructive examples of the general types of scenarios that are of interest for resource management in the Central Valley and perhaps similar regions. Results demonstrate large annual variation and patterns in habitat response among different climate, and land and water management scenarios, illustrating the complexity and uncertainty in projected future habitat conditions. Monthly variation in the response of individual habitats also was relatively substantial among scenarios, similarly indicating the complexity and uncertainty in future conditions. Collectively, these findings support the value of using an approach similar to this one to evaluate uncertain future impacts. Additional subsequent “informed” steps in conservation planning to address such uncertainty then could be implemented. In the process of developing a tool for our use, several challenges were encountered, as discussed in section “Challenges to Adapting the WEAP-CV Model for Waterbird Habitats.” We also elucidate “lessons learned” through this model- and scenario-building process that are especially applicable to other investigations of impacts on habitats in regions where land and water resources are intensively managed. Finally, we describe specific applications of linking modeling output from this approach to the ecology and conservation of wildlife.
Challenges to Adapting the WEAP-CV Model for Waterbird Habitats
Numerous challenges were encountered in the process of adapting WEAP-CV for waterbird habitats and identifying and evaluating an appropriate array of scenarios. Representing diversity in habitats and water supplies and possible future scenarios impacting certain important water supplies and habitats required substantial effort in adapting WEAP-CV. Examples of water supplies and habitats subject to substantial potential risk included Butte Creek runoff and agricultural return flows in the Sacramento Valley and low-priority agriculture and wetlands. Challenges included:
Researching available GIS data for characterizing habitats and HUs. 1. Extensive pre-processing to disaggregate and import land cover data into WEAP-CVwh. 2. Model development and calibration of Butte Creek streamflow. 3. Researching model parameterization and calibration of habitat water demands and supplies, 4.
including instream flow requirements on Butte Creek. Researching and model parameterization of water drainage, supply distribution systems, and 5.
delivery constraints. Researching operational and regulatory restrictions applying to through-delta water transfers and 6.
developing link-node complex for modeling rice land idling scenario. Parameterizing projections for conversion of crop areas to urban landscape through year 2065. 7. Parameterizing projections of urban indoor water use consistent with increases in urban 8.
landscape through year 2065.

25
Modeling Lessons
Although evaluating future impacts on habitats within a highly managed ecosystem such as the California Central Valley would seem to be more tractable than in less controlled environments, the scope and complexity of even heavily managed systems can pose numerous challenges. This is especially true for geographically large areas containing numerous heterogeneous interacting land and water resources, management entities, water supply operational rules, and regulations. Researching available options and identifying an impact-analysis tool that requires the least amount of effort to implement necessary changes is essential for success. Optimally, a tool (for example, a water resources model) representing the study system already would be available. However, even when an evaluation tool is available (that is, WEAP-CV for this Central Valley evaluation), much effort and staff time may be required to adapt and implement the tool to address the target conservation issues. In this study, the WEAP-CV framework was available as a template for our own model, but considerable effort was needed to overcome differences in spatial and temporal detail already in WEAP-CV and that which was required for our water resources model. Prior to disaggregating the less detailed model, it was important to fully understand the spatial scale of influence for all water supply management options. Research was required to represent water supply and delivery constraints at a high level of spatial and temporal detail. Substantial variation in supply sourcing and drainage network also needed to be represented in the more detailed model.
Through literature research and extensive GIS resources, the necessary information was obtained to develop a sufficient understanding of the habitat landscape and optimal water management practices for habitats. However, we discovered the difficulty of obtaining detailed information on and developing a robust understanding of “on-farm” water management for habitats when environmental and regulatory conditions precluded optimal water management for habitats. For example, what are the water conservation or best-management practices and resulting changes in timing and amounts of water applied under extreme drought and water allocation curtailment? The better the understanding of current decision making under a range of historical adverse conditions prohibiting optimal on-farm management of water supplies, the better we will be able to realistically account for water management decisions in scenarios of future conditions. One way to address this uncertainty in water management is to include plausible management practices in scenario modeling. One disadvantage of producing new scenarios based on water management is a corresponding increase in the modeling effort. Further improvement of understanding of water management decisions may prevent unnecessarily modeling some scenarios and may help reduce the number of future candidate scenarios.

26
Applications of Modeling Approach
This general modeling approach would be useful for conservation planning of wetlands and other habitats both inside and outside of the Central Valley. This approach will become increasingly appropriate as information about responses of environmental and ecological conditions to anthropogenic factors is enhanced through time. As more and better data on ecological-anthropogenic relationships become available with time, these data can be used to inform new modeling scenarios. For example, impacts of exotic species on native habitats continue to be one of the most critical wildlife conservation concerns and are a source of great uncertainty in future sustainability of habitats in many regions, including the Central Valley (Fleskes, 2012), suggesting a great need and opportunity for scenario analysis. While relationships between anthropogenic factors (for example, between water supply management restrictions and climate change) and their resulting cumulative impacts may vary considerably, so may relationships between exotic species invasion and expansion and anthropogenic factors. Corresponding with progressive anthropogenic changes in natural resources, adaptive advantages of native species relative to exotic species generally may decrease through time (Byers, 2002). Therefore, varying levels and types of anthropogenic changes to environmental conditions may cause differing rates of impact by exotic species on habitats through time. In modeling scenarios, researchers could vary projections of exotic species invasion and expansion with levels of other factors to reflect studied relationships between them. For example, issues of climate change exacerbating exotic species invasions have received increasing attention by researchers and conservationists alike (for example, Bellard and others, 2013; Vicente and others, 2013).
A key component of wildlife conservation is understanding how various factors can impact the ability to sustain wildlife species at goal population levels. Some conservation efforts (for example, CVJV) have focused on a bioenergetics modeling approach of comparing food energy supplies with bioenergetic demands of organisms to assess food deficits under varying habitat conditions (Central Valley Joint Venture, 2006). To evaluate whether a set of environmental or habitat conditions supports goal wildlife populations, information on the projected amount of habitat is needed as an input variable for the bioenergetics model. We are using our habitat scenario modeling approach to effectively provide such habitat information to inform bioenergetics models, including an agent-based avian foraging model (Miller and others, 2013), for waterbirds in the Central Valley. Integrating these models, the sustainability of goal wintering waterbird populations can be evaluated based on available waterbird food supplies supported under each scenario combining projected anthropogenic impacts. Similarly, scenario impacts on goal breeding productivity can be evaluated by relating projected habitat conditions to waterbird reproduction and recruitment using different biological models. Combined analyses for wintering and breeding periods would provide critical information about the timing and extent of potential habitat limitations for each CVJV basin across a range of projected futures. With this information, habitat conservation and management goals can be adjusted and strategies robust to scenario impacts ultimately produced.

27
A further advancement in integrating habitat scenario and bioenergetics models would involve a modeling effort linking them with other resource, demand, and socioeconomics models. The result would be a cross-disciplinary analytical platform assisting policy makers in determining strategies that are most supportive of the common good and robust to future uncertainty. We are pursuing collaborations to develop such a water resources decision support tool that can be used to balance the needs of competing California water users while also reducing conflict among them. In this proposed work, we would link our waterbird scenario and bioenergetics models with agricultural, socioeconomics, fisheries, urban, and energy models. The goal is to simultaneously compare socioeconomic and ecological costs and benefits among each water demand sector in response to potential policy-based strategies. Stakeholder engagement and a deliberative “robust decision making” process (Lempert and others, 2003) will guide strategies to be modeled for addressing uncertainty in climate change, water management, and other factors.
Because of distinct regional differences in biotic and abiotic characteristics among study systems and often limited time and financial resources, researchers adopting this approach should prioritize scenario factors based on greatest potential impact or likelihood of impact. Researchers also should carefully consider the level of spatial and temporal detail required by the tool to correspond with the biology of target species. For example, animal migration or bioenergetic cost related to migration may be affected by the spatial distribution and contiguity of habitats, implying need for relatively greater spatial disaggregation.
Conclusions The goal of this report is to present a new scenario modeling approach to wildlife research and
conservation fields for evaluating future potential impacts of various factors on wildlife habitats. We successfully implemented the use of this approach and integrated output from the approach with biological models. Using this type of integrated modeling, wildlife researchers and conservationists can ultimately translate scenario impacts on water and land resources into impacts on the ecology of wildlife species to assess future sustainability of goal populations. A key feature of this approach is the ability to project and account for interactions and the collective impacts of multiple anthropogenic stressors on habitats. For the last 3 decades, a growing focus of conservation planning studies has been climate change impacts on habitats and biodiversity. However, increasingly more landscapes are intensively managed by humans, and research that projects the effects of groups of multiple anthropogenic stressors (in conjunction with climate change) would provide useful information for habitat conservation and management. In places such as the Central Valley, where water supplies supporting most habitats are intensively managed, adaptation or development of a water supply and allocation model with scenario-projection capabilities may be an essential part of the process. Regardless of the initial framework for tool development, results from this study suggest that an approach accommodating uncertainty would benefit future natural resource management and policy.

28
We are hopeful that research based on our approach will help bridge the gap between science and policy. Because this approach provides a framework for concurrently evaluating impacts and mitigating strategies resulting from future policy decisions, we believe that it succeeds as a guidance tool for decision makers. However, the value of information provided through this approach, like other modeling approaches, will be limited by the availability and quality of input data. The development of this model and these scenarios relied on multiple disparate data sources of mixed or unknown quality, so understanding effects of data quality on results would be difficult.
Despite the facilitation that this general modeling approach can provide for future conservation, management, and policy of wildlife habitats, specific capabilities could further enhance its usefulness for decision making. Through our current efforts with collaborators, we are working to expand capability in modeling habitat restoration and management actions to evaluate the robustness of proposed strategies to future uncertainty. One additional enhancement, not discussed earlier in this report, would include estimating uncertainty in future habitat areas that are projected based on a given scenario (for example, through year 2099). Using our approach, this would involve propagating uncertainty across all factor projections, in turn, requiring data on uncertainty for each projection in a given scenario. Results from this study indicate that development of this functionality would be worthwhile for informing future land and resource management processes, and that substantial additional resources would be needed to support such an effort.
Acknowledgments We thank the numerous individuals and organizations that helped make this study possible.
Operational funding was provided by the California Landscape Conservation Cooperative, California Department of Fish and Wildlife, Delta Waterfowl Foundation, U.S. Fish and Wildlife Service, and Central Valley Joint Venture (CVJV), with in-kind salaries and computing equipment and logistical support provided by all project partners including U.S. Geological Survey-Western Ecological Research Center (USGS-WERC), Ducks Unlimited, Inc. (DU), Stockholm, Environmental Institute (SEI), Point Blue Conservation Science, and University of California-Davis. Ben Gustafson and Bill Perry (both of USGS-WERC) provided geographic information system (GIS) support. Mark Petrie (DU) provided substantial background information helping to inform WEAP-CVwh model development and data post-processing. We thank Kevin Petrik (formerly of DU) for providing GIS datasets for land cover and management of wetlands, and CVJV basin boundaries, and for information on water management on harvested rice fields. Jack Sieber (SEI) provided WEAP technical support. We thank the California Department of Water Resources and affiliate contractors for providing the WEAP-CV model and supporting documentation. We also acknowledge the modeling groups, the Program for Climate Model Diagnosis and Intercomparison (PCMDI) and the World Climate Research Programme (WCRP) Working Group on Coupled Modelling (WGCM) for their roles in making available the WCRP CMIP3 multi-model dataset. Support of this dataset is provided by the Office of Science, U.S. Department of Energy.

29
References Cited Ackerman, J., Takekawa, J.Y., Orthmeyer, D.L., Fleskes, J.P., Yee, J.L., and Kruse, K.L., 2006, Spatial use
by wintering greater white-fronted geese relative to a decade of habitat change in California’s Central Valley: Journal of Wildlife Management, v. 70, no. 4, p. 965–976.
American Farmland Trust, 1995, Alternatives for future urban growth in California’s Central Valley—The bottom line for agriculture and taxpayers: Washington, D.C., and Davis, Calif., American Farmland Trust, 129 p.
Baldassarre, G.A., and Bolen, E.G., 2006, Waterfowl ecology and management (2d ed.): Malabar, Fla., Krieger Publishing Company, 567 p.
Bellard, C., Thuiller, W., Leroy, B., Genovesi, P., Bakkenes, M., and Courchamp, F., 2013, Will climate change promote future invasions?: Global Change Biology, v. 19, no. 12, p. 3,740–3,748.
Brinson, M.M., and Malvárez, A.I., 2002, Temperate freshwater wetlands: types, status, and threats: Environmental Conservation, v. 29, no. 2, p. 115–133.
Byers, J. E., 2002, Impact of non‐indigenous species on natives enhanced by anthropogenic alteration of selection regimes: Oikos, v. 97, no. 3, p. 449–458.
Cayan, D., Tyree, M., Pierce, D., and Das, T., 2012, Climate change and sea level rise scenarios for California vulnerability and adaptation assessment: California Climate Change Center, no. CEC‐500‐2012‐008, 28 p.
Cayan, D.R., Tyree, M., Dettinger, M.D., Hidalgo, H., Das, T., Maurer, E.P., Bromirski, P., Graham, N., and Flick, R., 2009, Climate change scenarios and sea level rise estimates for the California 2009 climate change scenarios assessment: California Climate Change Center, no. CEC-500-2009-014-F, 50 p.
Central Valley Joint Venture, 2006, Central Valley Joint Venture implementation plan—Conserving bird habitat: Sacramento, Calif., U.S. Fish and Wildlife Service, 261 p.
Central Valley Joint Venture, 2000, Central Valley wetlands water supply investigations—CVPIA 3406 (d)(6)(A,B) —A report to Congress: U.S. Fish and Wildlife Service and Bureau of Reclamation, 296 p.
Collins, W.D., and others, 2006, The community climate system model version 3 (CCSM3): Journal of Climate, v. 19, no. 11, p. 2,122–2,143.
Dawson, T.P., Jackson, S.T., House, J.I., Prentice, I.C., and Mace, G.M., 2011, Beyond predictions—Biodiversity conservation in a changing climate: Science, v. 332, p. 53–58.
California Department of Fish and Game, 2005, Butte Creek, California Department of Fish and Game Anadromous Fish Restoration and Calfed Progams: California Department of Fish and Game, accessed June 17, 2013, at http://www.buttecreek.org/documents/ButteCreekAnadromousFishRestoration.pdf.
California Department of Water Resources, 2003, Rice straw decomposition and water use: California Department of Water Resources draft memorandum, 7 p.
California Department of Water Resources, 2013, State Water Analysis Network Workshop, Statewide WEAP Demand Model CWP 2013 Preliminary Results, February 2013: California Department of Water Resources, accessed January 5, 2015, at http://www.waterplan.water.ca.gov/docs/meeting_materials/swan/2013.02.13/6-WEAP_Statewide_9scenarios_2013_copy.pdf.
California Department of Water Resources, 2013, California Water Plan Update 2013: California Department of Water Resources, accessed May 15, 2013, at http://www.waterplan.water.ca.gov/cwpu2013/index.cfm.
Delworth, T., and others, 2006, GFDL’s CM2 global coupled climate models—Part 1—Formulation and simulation characteristics: Journal of Climate, v. 19, no. 5, p. 643–674.
Elphick, C.S., and Oring, L.W., 1998, Winter management of California rice fields for waterbirds: Journal of Applied Ecology, v. 35, no. 1, p. 95–108.

30
Environmental Systems Resource Institute, Inc., 2012, ArcMap™ 10.1: Redlands, Calif., Environmental Systems Resource Institute, Inc.
Fleskes, J.P., 2012, Wetlands of the Central Valley of California and Klamath Basin, in Batzer, D. and Baldwin, A., eds., Wetland habitats of North America: ecology and conservation concerns: Berkeley, Calif., University of California Press, p. 357–370.
Fleskes, J.P., Perry, W.M., Petrik, K.L., Spell, R., and Reid, F., 2005, Change in area of winter-flooded and dry rice in the northern Central Valley of California determined by satellite imagery: California Fish and Game, v. 91, no. 3, p. 207–215.
Fleskes, J.P., Skalos, D.S., and Farinha, M.A., 2012, Bird use of fields treated postharvest with two types of flooding in Tulare Basin, California: Journal of Fish and Wildlife Management, v. 3, no. 1, p. 164–174.
Hathaway, R., and Welch, T., 2002, Background, in Braunworth, W.S., Jr., Hathaway, R., and Carlson, H., eds., Water allocation in the Klamath Reclamation Project, 2001—An assessment of natural resource, economic, social, and institutional issues with a focus on Upper Klamath Basin: Corvallis, Oregon, Oregon State University Extension Service, p. 31–43.
Heller, N.E., and Zavaleta, E.S., 2009, Biodiversity management in the face of climate change—A review of 22 years of recommendations: Biological Conservation, v. 142, no. 1, p. 14–32.
Hoekstra, J.M., Boucher, T.M., Ricketts, T.H., and Roberts, C., 2005, Confronting a biome crisis—Global disparities of habitat loss and protection: Ecology Letters, v. 8, no. 1, p. 23–29.
Holling, C.S., and Meffe, G.K., 1996, Command and control and the pathology of natural resource management: Conservation Biology, v.10, no. 2, p. 328–337.
Jetz, W., Wilcove, D.S., and Dobson, A.P., 2007, Projected impacts of climate and land-use change on the global diversity of birds: PLoS Biology, v. 5, no. 6, p. 1,211–1,219.
Joyce, B., Purkey, D., Yates, D., Groves, D., and Draper, A., 2010, Integrated scenario analysis for the 2009 California Water Plan update: California Department of Water Resources technical memorandum, 97 p.
Joyce, B.A., Mehta, V., Purkey, D., Dale, L., and Hannemann, M., 2011, Modifying agricultural water management to adapt to climate change in California's Central Valley: Climatic Change, v. 109, no. 1, p. 299–316.
Lempert, R.J., Popper, S.W., and Bankes, S.C., 2003, Shaping the next one hundred years—New methods for quantitative, long-term policy analysis: Santa Monica, Calif., RAND Corporation, accessed July 17, 2013, at http://www.rand.org/pubs/monograph_reports/MR1626.
Meyer, J.L., Sale, M.J., Mulholland, P.J., and Poff, N.L., 1999, Impacts of climate change on aquatic ecosystem functioning and health: Journal of the American Water Resources Association, v. 35, no. 6, p. 1,373–1,386.
Miller, M.L., Ringelman, K.M., Schank, J.C., and Eadie, J.M., 2013, SWAMP—An agent-based model for wetland and waterfowl conservation management: Simulation, v. 90, no. 1, p. 52–68.
Myers, N., 1996, The rich diversity of biodiversity issues, in Reaka-Kudla, M.L., Wilson, D.E., Wilson, E.O., and Keener, C.S., eds., Biodiversity II—Understanding and protecting our biological resources: Washington, D.C., Joseph Henry Press, p. 125–138.
Nakicenovic, N., and others, 2000, Special report on emissions scenarios—A special report of Working Group III of the Intergovernmental Panel on Climate Change: Cambridge, United Kingdom, Cambridge University Press, 599 p.
Peterson, G.D., Cumming, G.S., and Carpenter, S.R., 2003, Scenario planning—A tool for conservation in an uncertain world: Conservation Biology, v. 17, no. 2, p. 358–366.
Pilkey‐Jarvis, L., and Pilkey, O.H., 2008, Useless arithmetic—Ten points to ponder when using mathematical models in environmental decision making: Public Administration Review, v. 68, no. 3, p. 470–479.

31
Salas-Mélia, D., Chauvin, F., Déqué, M., Douville, H., Gueremy, J.F., Marquet, P., Planton, S., Royer, J.F., and Tyteca, S., 2005, Description and validation of the CNRM-CM3 global coupled model: Manuscript draft submitted to Climate Dynamics (in 2005), accessed May 15, 2013, at http://www.cnrm.meteo.fr/scenario2004/paper_cm3.pdf.
Stockholm Environment Institute, 2011, The WEAP User Guide, May 2011: Stockholm Environment Institute, accessed December 5, 2013, at http://www.weap21.org/downloads/WEAP_User_Guide.pdf.
Stouffer, R.J., and others, 2006, GFDL’s CM2 global coupled climate models—Part 4—Idealized climate response: Journal of Climate, v. 19, no. 5, p. 723–740.
Thompson, L.C., Escobar, M.I., Mosser, C.M., Purkey, D.R., Yates, D., and Moyle, P.B., 2012, Water management adaptations to prevent loss of spring-run Chinook salmon in California under climate change: Journal of Water Resources Planning and Management, v.138, no. 5, p. 465–478.
Tilman, D., Fargoine, J., Wolff, B., D’Antonio, C., Dobson, A., Howarth, R., Schindler, D., Schlesinger, W.H., Simberloff, D., and Swackhamer, D., 2001, Forecasting agriculturally driven global environmental change: Science, v. 292, p. 281–284.
U.S. Census Bureau, 2014, Cumulative Estimates of the Resident Population Change for the United States, Regions, States, and Puerto Rico: April 1, 2010 to July 1, 2014 (NST-EST2014-02): U.S. Census Bureau, accessed December 30, 2014, at http://www.census.gov/popest/data/state/totals/2014/index.html.
U.S. Department of Agriculture, 2010, Field crops usual planting and harvesting dates: U.S. Department of Agriculture, National Agricultural Statistics Service, accessed May 10, 2013, at http://usda01.library.cornell.edu/usda/current/planting/planting-10-29-2010.pdf.
U.S. Department of Agriculture, 2011, Quick stats: U.S. Department of Agriculture, National Agricultural Statistics Service database, accessed August 2, 2012, at http://quickstats.nass.usda.gov/.
U.S. Department of the Interior and others, 2013, Downscaled CMIP3 and CMIP5 Climate and Hydrology Projections, accessed May 15, 2013, at http://gdo-dcp.ucllnl.org/downscaled_cmip3_projections/.
Vicente, J.R., Fernandes, R.F., Randin, C.F., Broennimann, O., Gonçalves, J., Marcos, B., Pôças, I., Alves, P., Guisan, A., and Honrado, J.P., 2013, Will climate change drive alien invasive plants into areas of high protection value?—An improved model-based regional assessment to prioritise the management of invasions: Journal of Environmental Management, v. 131, p. 185–195.
Stockholm Environment Institute, Water Evaluation and Planning (WEAP) system model: Stockholm Environment Institute Web site, accessed November 6, 2013, at http://www.weap21.org/.
Yates, D., Purkey, D., Sieber, J., Huber-Lee, A., Galbraith, H., West, J., Herrod-Julius, S., Young, C., Joyce, B., and Raye, M., 2009, Climate driven water resources model of Sacramento Basin, California: Journal of Water Resources Planning and Management, v. 135, no. 5, p. 303–313.
Yates, D., Sieber, J., Purkey, D., and Huber-Lee, A., 2005a, WEAP21—A demand, priority, and preference driven water planning model—Part 1—Model characteristics: Journal of Water International, v. 30, no. 4, p. 487–500.
Yates, D., Sieber, J., Purkey, D., and Huber-Lee, A., 2005b, WEAP21—A demand, priority, and preference driven water planning model—Part 2—Aiding freshwater ecosystem service evaluation: Journal of Water International, v. 30, no. 4, p. 501–512.

32
Appendix A. Description of Water Evaluation and Planning System Model for the Central Valley (WEAP-CV) and Adapted for Waterbird Habitats (WEAP-CVwh) Used in Scenario Modeling
Watershed characteristics represented in WEAP-CV are State, Federal, and private water supply and delivery projects, groundwater, major surface streams, and estimated demands for water by agricultural and urban users. WEAP-CV additionally includes physical (for example, reservoir capacity), operational (for example, reservoir storage rules), and regulatory constraints (for example, various streamflow requirements and priority of water use among users) on water use. Water delivery system constraints are reflected in model variables including supply priority, water supply preferences, and maximum flow limits. Supply priority (referred to as “Demand priority” in WEAP software) represents the priority of water allocation among all types of competing water demands (table A2). Water supply preference represents the relative preferences of potential supplies used by a particular demand site (for example, greater preference for water from Feather River than Sacramento River or groundwater). Maximum flow rate of a potential supply is represented as the maximum amount (percentage) of demand site water demand that can be supported by a particular water supply, or as maximum flow rate (for example, cubic meters per second). The model evaluates three population growth scenarios—“Current Trends”, “Strategic Growth”, and “Expansive Growth”—representing various population growth and urban land-use projections (Joyce and others, 2010), although more recently six more demographic projections have been added (California Department of Water Resources, 2013). In 2011, WEAP-CV developers also included in the model 12 climate change scenarios projecting to year 2099. (Stockholm Environment Institute, 2011, provides greater technical detail about WEAP software used to develop WEAP models for the Central Valley.)

33
Table A1. Key model components in WEAP-CVwh used to represent watershed characteristics. 1. Catchment nodes (referred to as “catchments”): Using catchments in WEAP-CVwh was consistent with the existing structure of
WEAP-CV, reducing required structural changes. Although multiple land cover types can be included in a single catchment, each catchment can be assigned solely one set of water supply sources and supply preferences, and one supply priority. Therefore, within a catchment, land covers cannot differ in water supplies, supply preferences, or priorities. This is a factor influencing the number of habitat catchments defined for each hydrologic unit represented in WEAP-CVwh. Using catchments in WEAP in contrast with “demand sites” is a more efficient and flexible way to model both hydrology and water demand for a region. Directly modeling hydrology using catchments, and not manually specifying surface runoff and infiltration to groundwater, generally allows more efficient and accurate modeling of temporally and spatially varying available water supplies. Water demands modeled using catchments will automatically respond to projected changes in climate, and no additional manual adjustment for climatic effects on demands are required.
2. Catchment climate variables: Precipitation1 (monthly total), air temperature1 (weighted mean of monthly high and low temperature), wind (average monthly wind speed), humidity (average monthly relative humidity), cloudiness fraction (fraction of daytime hours with no clouds), initial snow (value for snow accumulation at beginning of simulation), melting point (liquid water threshold for snow melt), freezing point (solid water threshold for snow accumulation), latitude (latitude in degrees), albedo (fraction of solar radiation reflected by a land class), snow accumulation gage (historical snow accumulation data used in calibration).
3. Catchment soil and land-use variables: Area (land area, by land cover class), Kc (crop coefficient, by land class), root zone water capacity (effective water-holding capacity of top soil layer, by land class), runoff resistance factor (controls surface runoff response, by land class), root zone conductivity2 (root zone water conductivity rate [length/time] at full saturation, by land class), preferred flow direction (partitions flow of water in root zone between horizontal and vertical directions, by land class), initial z1 (percentage of total root zone water capacity at beginning of simulation, by land class).
4. Catchment irrigation variables: Irrigated area2 (percentage of area irrigated, by land class), lower threshold2 (soil moisture percentage less than this level initiates irrigation, by land class), upper threshold2 (soil moisture percentage at this level ceases irrigation, by land class).
5. Catchment pond-depth variables: Target depth2 (target water elevation in wetland pond or rice field), minimum depth (minimum water elevation in wetland pond or rice field), maximum depth (maximum water elevation in wetland pond or rice field corresponding with the depth of the wetland or field basins), release requirement (amount of water released and replaced with new supply in a timestep).
6. Runoff and infiltration links: Represents natural runoff and irrigation return flow from catchments to surface water and groundwater, respectively.
7. Demand site nodes: Are in contrast with catchments and do not model water demand as a function of climate, but, rather, require demand as an input.
8. Return flow links: Represents return flows from demand sites and wastewater treatment plants to rivers and diversions. In WEAP-CV and WEAP-CVwh, they generally represent return flows from urban demand site nodes (in contrast with catchment nodes).
9. River links: Represents aggregate watershed runoff and baseflow that can be stored in reservoirs, diverted by users, or remain instream for fisheries or other non-consumptive uses.
10. Diversion links: Represents large water delivery canals with maximum monthly diversion limits.
11. Transmission links: Represents water delivery to catchments and demand sites and related physical or other constraints in delivering water from a source.
12. Flow requirement node: Defines the minimum instream flow required at a point on a river or diversion link to serve fisheries or other modeled requirements.
13. Reservoir nodes: Represents reservoir sites on rivers and are conditioned on operating rules and demand priorities to release water
for use downstream and for hydropower generation.
14. Groundwater nodes: Represents aquifers that receive and store infiltration from catchments and other sources, and provide groundwater supply for overlying demands.
1Climate projection data were used as input for the variable. 2Variables used to calibrate water demands of wetlands and winter-flooded rice.

34
Table A2. Water supply demand priorities in WEAP-CV and WEAP-CVwh Models.
Demand sector WEAP-CV priority WEAP-CVwh priority
Urban indoor 1 (highest priority) 1
Public wetland (CVPIA) 11 1
Public wetland (other) NR1 3
Private wetland (High-reliability) NR1 3
Private wetland (Low-reliability) NR1 3
Instream flow 2 2
Agriculture 3 3
Urban outdoor 3 3
Hydropower 4 4
Reservoirs 14–20 14–20
Flood control outside of bypasses 98 98
Sutter and Yolo flood bypass systems 99 99 1WEAP-CV Model only defines managed public wetlands receiving water through Central Valley Project Improvement Act (CVPIA) contracts; other wetlands were not represented (NR) in the model.

35
Table A3. Documentation of additional processing steps for developing WEAP-CVwh and modeling-specific scenarios.
1. Classification of agricultural crops: Some California Department of Water Resources (DWR) Planning Areas in WEAP-CV intersecting Central Valley Joint
Venture (CVJV) basin boundaries lacked detail in crop classifications required for WEAP-CVwh. Where Planning Areas and basins intersected, we used DWR geographic information system crop land cover data to calculate crop areas and to classify crops in greater detail. In WEAP-CVwh, we added the more detailed crop information where it was lacking.
2. Classification of wetlands: Areas of wetlands estimated in Central Valley Joint Venture (2000) were less than more recent estimates (i.e., years 2003–
04) of seasonal and semipermanent wetlands on private land provided in Central Valley Joint Venture (2006). Consequently, we applied proportions of private wetland area distinguished by water supply reliability in Central Valley Joint Venture (2000) to updated wetland areas based on Central Valley Joint Venture (2006) to classify private wetland areas used in WEAP-CVwh.
3. Model adjustments required for water management-rice land idling scenario: State Water Project and the Federal Central Valley Project diversions were disconnected from the Sacramento-San Joaquin
Delta. We replaced delta-diversion connections with two demand site nodes and related return flow links. The indicated links and nodes were used to represent the total flow into project diversions under selected climate-urbanization conditions. We added a complex of transmission links and nodes, demand site node, return flow links and nodes, and diversion link to represent additional water transferred from the Sacramento River system to Planning Areas 606 and 702 indoor and outdoor urban demands. Before modeling a south-of-delta transfer, initial model output from a selected combination of climate and urbanization projections was exported to data files that then were used in adding new constraints to the model in subsequent simulation. Output from the climate-urbanization scenario simulation (in the absence of additional transfer of rice irrigation water modeled in the subsequent simulation) was (1) projected amounts of water conveyed through State and Federal project facilities to south-of-delta users, (2) water delivered to Planning Areas 606 and 702 urban from the Delta compared to all other sources, and (3) the relative fraction of water from each surface water source (Sacramento River, Butte Creek-Sutter Bypass, and Feather River) delivered to irrigate rice land in Butte Basin. The scenario was further evaluated in a separate subsequent model simulation. In this simulation, we constrained water transfer amounts: (1) conveyed through the State and Federal project pumping facilities in the delta to the remaining operational capacity of the projects, (2) to Planning Areas 606 and 702 urban demands based on their remaining water requirement not supported through any projected contracted delta deliveries each month, and (3) transferred from each of the three Sacramento River system sources to reflect the proportion of water from each source typically allocated to rice in Butte Basin. Additionally, we limited the transfer of water to an annual maximum limit of 623,188.3 thousand cubic meters) based on 61,957 rice hectares in Butte Basin at 3.3 acre-foot credit per acre (or about 10 thousand cubic meter credit per hectare) rice fallowed under current DWR transfer policy. We accounted for assessed 20 percent carriage water loss of water transferred through the delta (Nancy Quan, oral commun., May 9, 2012) by adjusting model return flow link routing accordingly. Although the modeled transfers were limited solely to July–September, water deliveries to rice catchment nodes from the three Sacramento River system sources were deactivated in the model and rice could solely receive water from groundwater and some local natural runoff and return flows throughout the time series. In this scenario, we assume no substitution of groundwater for the surface water that was transferred through rice land idling, as might occur under strict local groundwater ordinances. However, farmers are allowed to substitute groundwater for transferred surface water under current law. To calculate the rice area supported under a similar scenario that includes groundwater substitution, we could reduce the amount of calculated rice area fallowed proportionally with the fraction of the water demand for growing rice maximally supported through groundwater pumping. This groundwater fraction may be based on the literature or the maximum flow (percent of demand) catchment data used in WEAP-CVwh (see section, “Water Supply and Delivery Constraints,” for details) weighted by respective catchment areas and averaged.
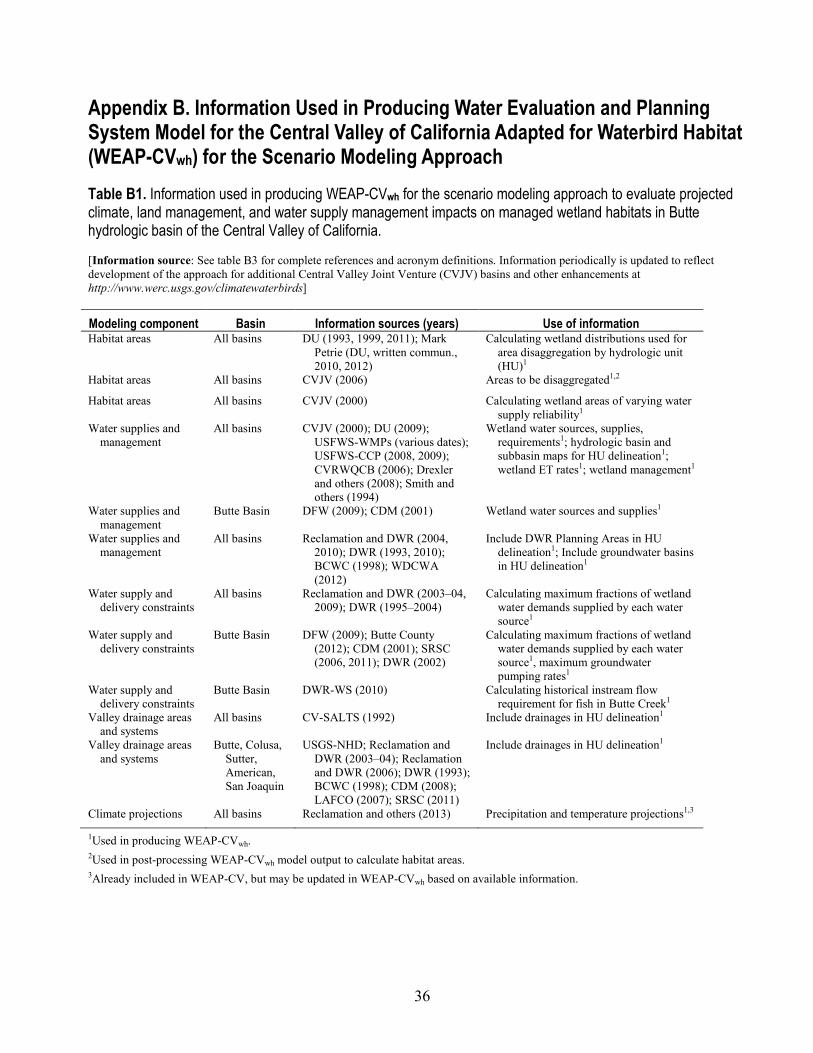
36
Appendix B. Information Used in Producing Water Evaluation and Planning System Model for the Central Valley of California Adapted for Waterbird Habitat (WEAP-CVwh) for the Scenario Modeling Approach Table B1. Information used in producing WEAP-CVwh for the scenario modeling approach to evaluate projected climate, land management, and water supply management impacts on managed wetland habitats in Butte hydrologic basin of the Central Valley of California. [Information source: See table B3 for complete references and acronym definitions. Information periodically is updated to reflect development of the approach for additional Central Valley Joint Venture (CVJV) basins and other enhancements at http://www.werc.usgs.gov/climatewaterbirds]
Modeling component Basin Information sources (years) Use of information Habitat areas All basins DU (1993, 1999, 2011); Mark
Petrie (DU, written commun., 2010, 2012)
Calculating wetland distributions used for area disaggregation by hydrologic unit (HU)1
Habitat areas All basins CVJV (2006) Areas to be disaggregated1,2
Habitat areas All basins CVJV (2000) Calculating wetland areas of varying water supply reliability1
Water supplies and management
All basins CVJV (2000); DU (2009); USFWS-WMPs (various dates); USFWS-CCP (2008, 2009); CVRWQCB (2006); Drexler and others (2008); Smith and others (1994)
Wetland water sources, supplies, requirements1; hydrologic basin and subbasin maps for HU delineation1; wetland ET rates1; wetland management1
Water supplies and management
Butte Basin DFW (2009); CDM (2001) Wetland water sources and supplies1
Water supplies and management
All basins Reclamation and DWR (2004, 2010); DWR (1993, 2010); BCWC (1998); WDCWA (2012)
Include DWR Planning Areas in HU delineation1; Include groundwater basins in HU delineation1
Water supply and delivery constraints
All basins Reclamation and DWR (2003–04, 2009); DWR (1995–2004)
Calculating maximum fractions of wetland water demands supplied by each water source1
Water supply and delivery constraints
Butte Basin DFW (2009); Butte County (2012); CDM (2001); SRSC (2006, 2011); DWR (2002)
Calculating maximum fractions of wetland water demands supplied by each water source1, maximum groundwater pumping rates1
Water supply and delivery constraints
Butte Basin DWR-WS (2010) Calculating historical instream flow requirement for fish in Butte Creek1
Valley drainage areas and systems
All basins CV-SALTS (1992) Include drainages in HU delineation1
Valley drainage areas and systems
Butte, Colusa, Sutter, American, San Joaquin
USGS-NHD; Reclamation and DWR (2003–04); Reclamation and DWR (2006); DWR (1993); BCWC (1998); CDM (2008); LAFCO (2007); SRSC (2011)
Include drainages in HU delineation1
Climate projections All basins Reclamation and others (2013) Precipitation and temperature projections1,3
1Used in producing WEAP-CVwh. 2Used in post-processing WEAP-CVwh model output to calculate habitat areas. 3Already included in WEAP-CV, but may be updated in WEAP-CVwh based on available information.
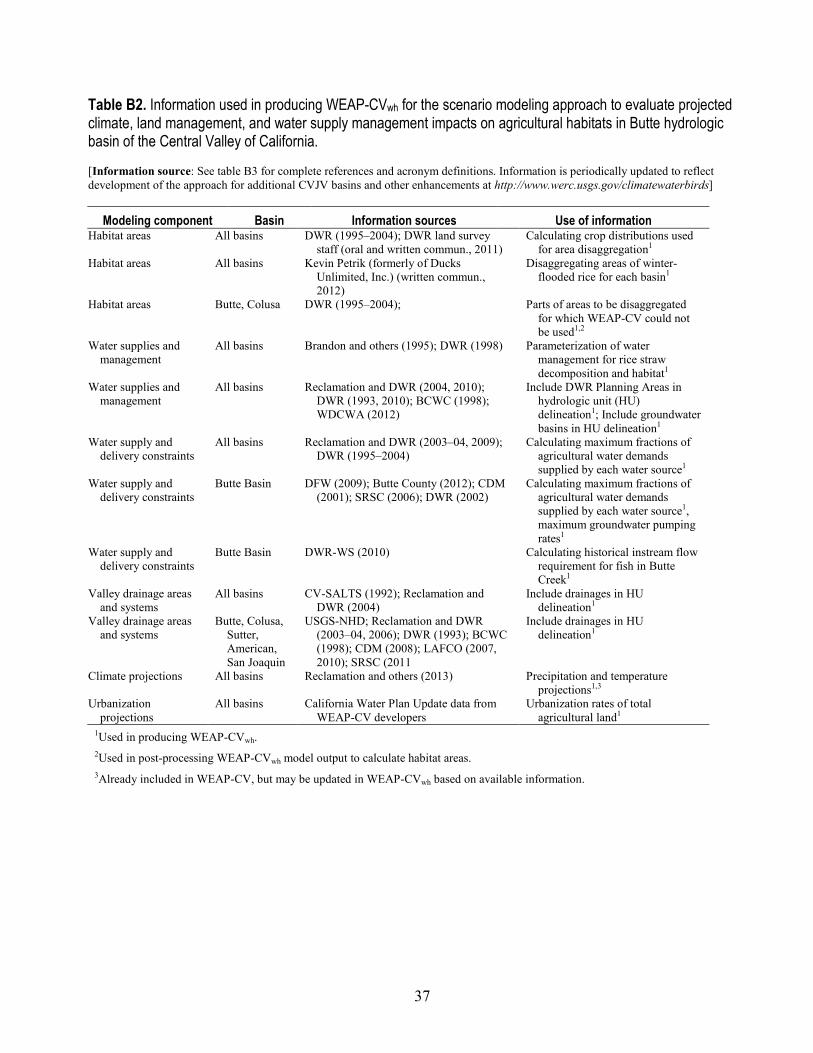
37
Table B2. Information used in producing WEAP-CVwh for the scenario modeling approach to evaluate projected climate, land management, and water supply management impacts on agricultural habitats in Butte hydrologic basin of the Central Valley of California. [Information source: See table B3 for complete references and acronym definitions. Information is periodically updated to reflect development of the approach for additional CVJV basins and other enhancements at http://www.werc.usgs.gov/climatewaterbirds]
Modeling component Basin Information sources Use of information
Habitat areas All basins DWR (1995–2004); DWR land survey staff (oral and written commun., 2011)
Calculating crop distributions used for area disaggregation1
Habitat areas All basins Kevin Petrik (formerly of Ducks Unlimited, Inc.) (written commun., 2012)
Disaggregating areas of winter-flooded rice for each basin1
Habitat areas Butte, Colusa DWR (1995–2004); Parts of areas to be disaggregated for which WEAP-CV could not be used1,2
Water supplies and management
All basins Brandon and others (1995); DWR (1998) Parameterization of water management for rice straw decomposition and habitat1
Water supplies and management
All basins Reclamation and DWR (2004, 2010); DWR (1993, 2010); BCWC (1998); WDCWA (2012)
Include DWR Planning Areas in hydrologic unit (HU) delineation1; Include groundwater basins in HU delineation1
Water supply and delivery constraints
All basins Reclamation and DWR (2003–04, 2009); DWR (1995–2004)
Calculating maximum fractions of agricultural water demands supplied by each water source1
Water supply and delivery constraints
Butte Basin DFW (2009); Butte County (2012); CDM (2001); SRSC (2006); DWR (2002)
Calculating maximum fractions of agricultural water demands supplied by each water source1, maximum groundwater pumping rates1
Water supply and delivery constraints
Butte Basin DWR-WS (2010) Calculating historical instream flow requirement for fish in Butte Creek1
Valley drainage areas and systems
All basins CV-SALTS (1992); Reclamation and DWR (2004)
Include drainages in HU delineation1
Valley drainage areas and systems
Butte, Colusa, Sutter, American, San Joaquin
USGS-NHD; Reclamation and DWR (2003–04, 2006); DWR (1993); BCWC (1998); CDM (2008); LAFCO (2007, 2010); SRSC (2011
Include drainages in HU delineation1
Climate projections All basins Reclamation and others (2013) Precipitation and temperature projections1,3
Urbanization projections
All basins California Water Plan Update data from WEAP-CV developers
Urbanization rates of total agricultural land1
1Used in producing WEAP-CVwh.
2Used in post-processing WEAP-CVwh model output to calculate habitat areas.
3Already included in WEAP-CV, but may be updated in WEAP-CVwh based on available information.

38
Table B3. References for information sources in appendix B, tables B1 and B2. [Information is periodically updated to reflect development of the approach for additional Central Valley Joint Venture (CVJV) basins and other enhancements at http://www.werc.usgs.gov/climatewaterbirds]
Information source Reference
BCWC Butte Creek Watershed Conservancy, 1998, Butte Creek Watershed Project, Existing conditions report: Butte Creek Watershed Conservancy, accessed January 6, 2015, at http://buttecreekwatershed.org/Watershed/ECR.htm.
Brandon and others Brandon, D.M., Brouder, S., Chaney, D., Hill, J.E., Payne, J.M., Scardaci, S.C., Williams, J.F., Wrysinski, J.E., 1995, Rice straw management today and tomorrow: Davis, University of California Cooperative Extension Publication.
Butte County Butte County, 2012, Butte Basin management objectives: Butte County Department of Water and Resource Conservation, accessed January 6, 2015, at http://www.buttecounty.net/waterresourceconservation/BasinManagementObjectives.aspx.
CDM Camp Dresser and McKee, Inc., 2008, Butte Basin Integrated Water Flow Model (IWFM), IWFM User’s Group, Presentation : Camp Dresser and McKee, Inc., accessed January 6, 2015, at http://www.cwemf.org/workshops/GWWorkshop/2008/ Heywood_Butte_County_IWFM.pdf.
CDM Camp Dresser and McKee, Inc., 2001, Butte County water inventory and analysis report; Camp Dresser and McKee, Inc., accessed January 6, 2015, at http://www.buttecounty.net/Portals/26/Reports/2001/WaterInvetoryAnalysis2001CompleteReportOptimized.pdf.
CVJV Central Valley Joint Venture, 2006, Central Valley Joint Venture implementation plan—Conserving bird habitat: Sacramento, Calif., U.S. Fish and Wildlife Service, 261 p.
CVJV Central Valley Joint Venture, 2000, Central Valley wetlands water supply investigations—CVPIA 3406 (d)(6)(A,B) —A report to Congress: U.S. Fish and Wildlife Service and Bureau of Reclamation, 296 p.
CVRWQCB Central Valley Regional Water Quality Control Board, 2006, Irrigated lands management practices, chap. 5 of Irrigated Lands Discharge Program—Draft existing conditions report: Central Valley Regional Water Quality Control Board, accessed January 7, 2015, at http://www.waterboards.ca.gov/centralvalley/water_issues/irrigated_lands/new_waste_discharge_requirements/exist_cond_rpt/draft_existing_conditions_rpt/ch05.pdf.
CV-SALTS Central Valley Salinity Alternatives for Long-term Sustainability, 1992, California inland surface water plan documents: Central Valley Salinity Alternatives for Long-term Sustainability, accessed January 7, 2015, at http://www.cvsalinity.org/index.php/docs/documents-and-presentations/iswp-docs.html.
DFW California Department of Fish and Wildlife, 2009, Property description and management setting, chap. 2 of Upper Butte Basin Wildlife Area draft land management plan: California Department of Fish and Wildife.
Drexler and others Drexler, J.Z., Anderson, F.E., and Snyder, R.L., 2008, Evapotranspiration rates and crop coefficients for a restored marsh in the Sacramento–San Joaquin Delta, California, USA: Hydrological Processes, v. 22, no. 6, p. 725–735.
DU Ducks Unlimited, Inc., 2011, CVJV protected areas–Publicly and privately-owned upland and wetland habitat units, Vector polygon (geographic information system [GIS] dataset): Sacramento, Calif., U.S. Fish and Wildlife Service.
DU Ducks Unlimited, Inc. (DU), 2009, CVJV hydrologic basins, Vector polygon (GIS dataset): Sacramento, Calif., U.S. Fish and Wildlife Service.
DU Ducks Unlimited, Inc. (DU), 1999, Sacramento Valley, Seasonal and permanent palustrine wetlands in the Sacramento Valley, Raster (GIS dataset): Sacramento, Calif., U.S. Fish and Wildlife Service.
DU Ducks Unlimited, Inc. (DU), and California Department of Fish and Game, 1993. Wetland and riparian—Seasonal and permanent palustrine wetlands in the Sacramento Valley, Raster (GIS dataset): Sacramento, Calif., U.S. Fish and Wildlife Service.
DWR California Department of Water Resources, 2010, B118_v3_BasinBoundaries_NAD83_unprojected—California groundwater basins, Vector polygon (GIS dataset): California Department of Water Resources.
DWR California Department of Water Resources, 2002, Project 12B Sutter Extension Water District Sutter-Butte Main Canal Lining Project: California Department of Water Resources.
DWR California Department of Water Resources, 1998, Rice straw decomposition and water use—Draft report: California Department of Water Resources.
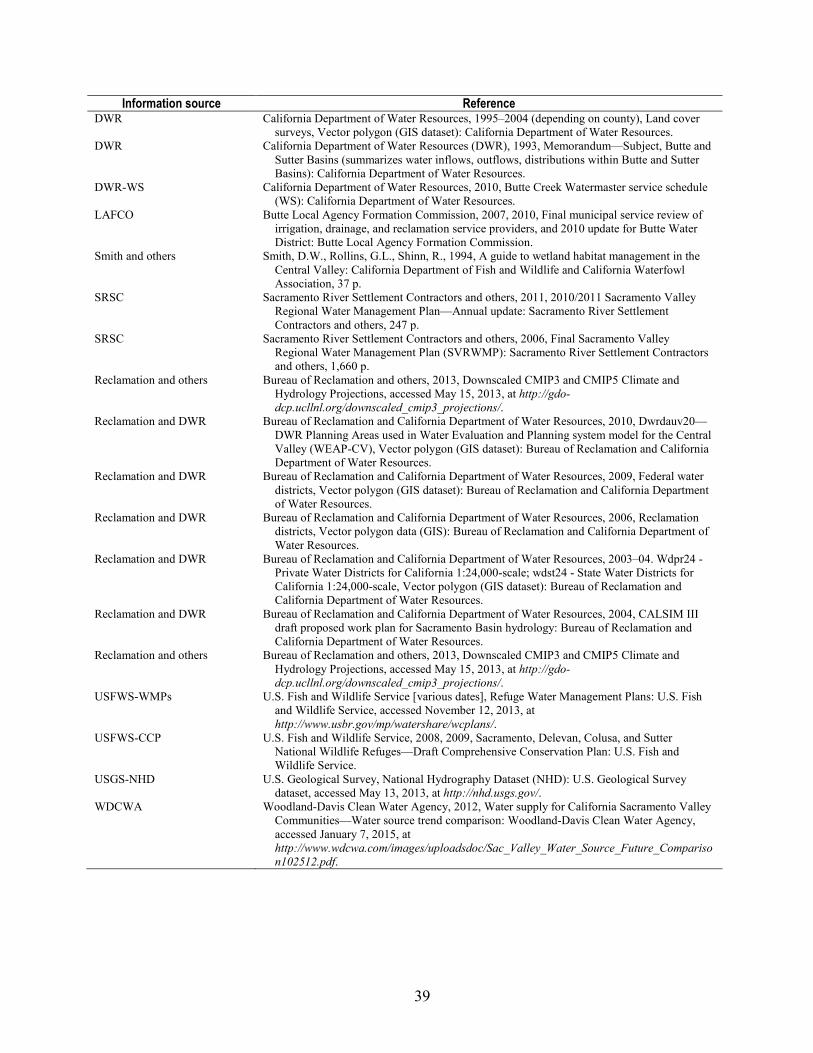
39
Information source Reference DWR California Department of Water Resources, 1995–2004 (depending on county), Land cover
surveys, Vector polygon (GIS dataset): California Department of Water Resources. DWR California Department of Water Resources (DWR), 1993, Memorandum—Subject, Butte and
Sutter Basins (summarizes water inflows, outflows, distributions within Butte and Sutter Basins): California Department of Water Resources.
DWR-WS California Department of Water Resources, 2010, Butte Creek Watermaster service schedule (WS): California Department of Water Resources.
LAFCO Butte Local Agency Formation Commission, 2007, 2010, Final municipal service review of irrigation, drainage, and reclamation service providers, and 2010 update for Butte Water District: Butte Local Agency Formation Commission.
Smith and others Smith, D.W., Rollins, G.L., Shinn, R., 1994, A guide to wetland habitat management in the Central Valley: California Department of Fish and Wildlife and California Waterfowl Association, 37 p.
SRSC Sacramento River Settlement Contractors and others, 2011, 2010/2011 Sacramento Valley Regional Water Management Plan—Annual update: Sacramento River Settlement Contractors and others, 247 p.
SRSC Sacramento River Settlement Contractors and others, 2006, Final Sacramento Valley Regional Water Management Plan (SVRWMP): Sacramento River Settlement Contractors and others, 1,660 p.
Reclamation and others Bureau of Reclamation and others, 2013, Downscaled CMIP3 and CMIP5 Climate and Hydrology Projections, accessed May 15, 2013, at http://gdo-dcp.ucllnl.org/downscaled_cmip3_projections/.
Reclamation and DWR Bureau of Reclamation and California Department of Water Resources, 2010, Dwrdauv20—DWR Planning Areas used in Water Evaluation and Planning system model for the Central Valley (WEAP-CV), Vector polygon (GIS dataset): Bureau of Reclamation and California Department of Water Resources.
Reclamation and DWR Bureau of Reclamation and California Department of Water Resources, 2009, Federal water districts, Vector polygon (GIS dataset): Bureau of Reclamation and California Department of Water Resources.
Reclamation and DWR Bureau of Reclamation and California Department of Water Resources, 2006, Reclamation districts, Vector polygon data (GIS): Bureau of Reclamation and California Department of Water Resources.
Reclamation and DWR Bureau of Reclamation and California Department of Water Resources, 2003–04. Wdpr24 - Private Water Districts for California 1:24,000-scale; wdst24 - State Water Districts for California 1:24,000-scale, Vector polygon (GIS dataset): Bureau of Reclamation and California Department of Water Resources.
Reclamation and DWR Bureau of Reclamation and California Department of Water Resources, 2004, CALSIM III draft proposed work plan for Sacramento Basin hydrology: Bureau of Reclamation and California Department of Water Resources.
Reclamation and others Bureau of Reclamation and others, 2013, Downscaled CMIP3 and CMIP5 Climate and Hydrology Projections, accessed May 15, 2013, at http://gdo-dcp.ucllnl.org/downscaled_cmip3_projections/.
USFWS-WMPs U.S. Fish and Wildlife Service [various dates], Refuge Water Management Plans: U.S. Fish and Wildlife Service, accessed November 12, 2013, at http://www.usbr.gov/mp/watershare/wcplans/.
USFWS-CCP U.S. Fish and Wildlife Service, 2008, 2009, Sacramento, Delevan, Colusa, and Sutter National Wildlife Refuges—Draft Comprehensive Conservation Plan: U.S. Fish and Wildlife Service.
USGS-NHD U.S. Geological Survey, National Hydrography Dataset (NHD): U.S. Geological Survey dataset, accessed May 13, 2013, at http://nhd.usgs.gov/.
WDCWA Woodland-Davis Clean Water Agency, 2012, Water supply for California Sacramento Valley Communities—Water source trend comparison: Woodland-Davis Clean Water Agency, accessed January 7, 2015, at http://www.wdcwa.com/images/uploadsdoc/Sac_Valley_Water_Source_Future_Comparison102512.pdf.

40
This page left intentionally blank

Publishing support provided by the U.S. Geological SurveyScience Publishing Network, Tacoma Publishing Service Center
For more information concerning the research in this report, contact the Director, Western Ecological Research Center
U.S. Geological Survey 3020 State University Drive East Sacramento, California 95819 http://werc.usgs.gov/

Matchett and others—
Framew
ork for Modeling Im
pacts on Waterbird H
abitats—A
ddressing Future Uncertainy in Conservation Planning
Open-File Report 2015-1017—
ISSN 2331-1258 (online)http://dx.doi.org/10.3133/ofr20151017