atrributing physical and biological impacts to anthropogenic climate change
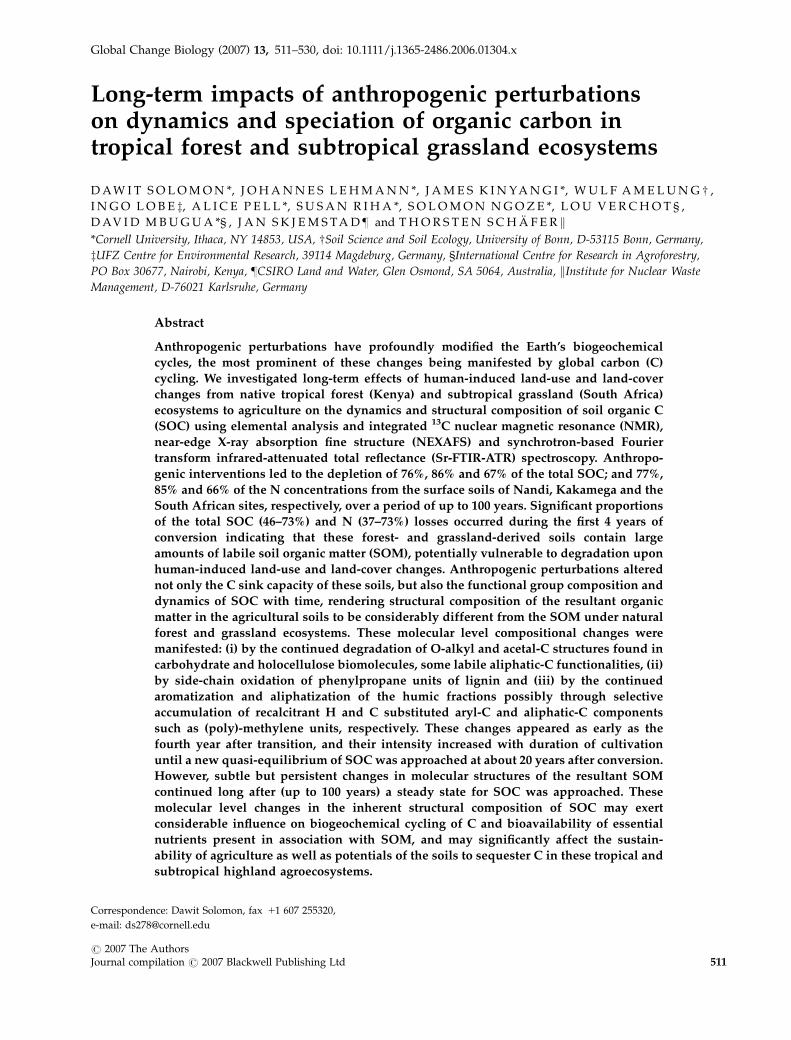
Long-term impacts of anthropogenic perturbationson dynamics and speciation of organic carbon intropical forest and subtropical grassland ecosystems
D A W I T S O L O M O N *, J O H A N N E S L E H M A N N *, J A M E S K I N YA N G I *, W U L F A M E L U N G w ,
I N G O L O B E z, A L I C E P E L L *, S U S A N R I H A *, S O L O M O N N G O Z E *, L O U V E R C H O T § ,
D AV I D M B U G U A *§ , J A N S K J E M S T A D } and T H O R S T E N S C H A F E R k*Cornell University, Ithaca, NY 14853, USA, wSoil Science and Soil Ecology, University of Bonn, D-53115 Bonn, Germany,
zUFZ Centre for Environmental Research, 39114 Magdeburg, Germany, §International Centre for Research in Agroforestry,
PO Box 30677, Nairobi, Kenya, }CSIRO Land and Water, Glen Osmond, SA 5064, Australia, kInstitute for Nuclear Waste
Management, D-76021 Karlsruhe, Germany
Abstract
Anthropogenic perturbations have profoundly modified the Earth’s biogeochemical
cycles, the most prominent of these changes being manifested by global carbon (C)
cycling. We investigated long-term effects of human-induced land-use and land-cover
changes from native tropical forest (Kenya) and subtropical grassland (South Africa)
ecosystems to agriculture on the dynamics and structural composition of soil organic C
(SOC) using elemental analysis and integrated 13C nuclear magnetic resonance (NMR),
near-edge X-ray absorption fine structure (NEXAFS) and synchrotron-based Fourier
transform infrared-attenuated total reflectance (Sr-FTIR-ATR) spectroscopy. Anthropo-
genic interventions led to the depletion of 76%, 86% and 67% of the total SOC; and 77%,
85% and 66% of the N concentrations from the surface soils of Nandi, Kakamega and the
South African sites, respectively, over a period of up to 100 years. Significant proportions
of the total SOC (46–73%) and N (37–73%) losses occurred during the first 4 years of
conversion indicating that these forest- and grassland-derived soils contain large
amounts of labile soil organic matter (SOM), potentially vulnerable to degradation upon
human-induced land-use and land-cover changes. Anthropogenic perturbations altered
not only the C sink capacity of these soils, but also the functional group composition and
dynamics of SOC with time, rendering structural composition of the resultant organic
matter in the agricultural soils to be considerably different from the SOM under natural
forest and grassland ecosystems. These molecular level compositional changes were
manifested: (i) by the continued degradation of O-alkyl and acetal-C structures found in
carbohydrate and holocellulose biomolecules, some labile aliphatic-C functionalities, (ii)
by side-chain oxidation of phenylpropane units of lignin and (iii) by the continued
aromatization and aliphatization of the humic fractions possibly through selective
accumulation of recalcitrant H and C substituted aryl-C and aliphatic-C components
such as (poly)-methylene units, respectively. These changes appeared as early as the
fourth year after transition, and their intensity increased with duration of cultivation
until a new quasi-equilibrium of SOC was approached at about 20 years after conversion.
However, subtle but persistent changes in molecular structures of the resultant SOM
continued long after (up to 100 years) a steady state for SOC was approached. These
molecular level changes in the inherent structural composition of SOC may exert
considerable influence on biogeochemical cycling of C and bioavailability of essential
nutrients present in association with SOM, and may significantly affect the sustain-
ability of agriculture as well as potentials of the soils to sequester C in these tropical and
subtropical highland agroecosystems.
Correspondence: Dawit Solomon, fax 11 607 255320,
e-mail: [email protected]
Global Change Biology (2007) 13, 511–530, doi: 10.1111/j.1365-2486.2006.01304.x
r 2007 The AuthorsJournal compilation r 2007 Blackwell Publishing Ltd 511

Keywords: carbon sequestration, 13C NMR, deforestation, land-use change, NEXAFS, organic matter
composition, Sr-FTIR-ATR, synchrotron radiation
Received 13 March 2006; revised version received 20 September 2006 and accepted 3 October 2006
Introduction
Human activities have fundamentally altered many of
the Earth’s biogeochemical cycles, the most prominent
of these changes being manifested by modification of
the global C cycle. Over the past two centuries alone,
anthropogenic perturbations have led to a 31% increase
in atmospheric CO2 concentration from a preindustrial
level of about 280 ppmv in 1800 to 368 ppmv in 2000
(IPCC, 2001). Most of this anthropogenic CO2 enrich-
ment came from burning of fossil fuel (270 Pg C), fol-
lowed by emissions from activities related to land-use
and land-cover changes (136 Pg C; Houghton, 1999; Lal,
2003). Of the emissions from land-use and land-cover
changes, about 78 Pg C originated from depletion of soil
organic matter (SOM; Lal, 2003).
Soil contains the largest pool of terrestrial organic C
(1500 Pg C) in the biosphere storing more C than is
contained in the biotic (560 Pg C) and atmospheric
(760 Pg C) pools combined (Batjes, 1996; Schlesinger,
1997). In undisturbed terrestrial ecosystems, each soil
has a C carrying capacity [i.e. equilibrium soil organic C
(SOC) content] depending on the climate, vegetation,
topography, parent material and time. In such ecosys-
tems, the biogeochemical cycling of C is essentially in
balance with minimal short-term losses or gains. The
steady state attained in such ecosystems and thereby
the amount, structural composition and stability of
SOC pools, however, can be dramatically influenced
by anthropogenic land-use and land-cover changes
that reduce organic matter inputs and affect rates and
processes underlying the equilibrium state until a new
steady state is eventually established in the new eco-
system (Guo & Gifford, 2002; Solomon et al., 2005a).
The principal types of these land-use and land-cover
changes involve clearing of natural forest and grassland
ecosystems for agricultural purposes. Current estimates
indicate that these practices have led to a global increase
in the total area of cultivated land by more than 425%
since 1850, with the most rapid changes occurring in
tropical and subtropical regions especially after the
1950s (Houghton, 1999). Given that one-third of the
global SOC pool is in the tropics (Eswaran et al., 1993),
these anthropogenic disturbances feedback on the glo-
bal C cycle by increasing CO2 flux from the soil to the
atmosphere, and are expected to have consequences on
the Earth’s climate and biogeochemical cycling of other
elements. SOM is also an important determinant of soil
fertility in tropical and subtropical agroecosystems and
its loss will have profound implications on soil produc-
tivity and sustainability of agriculture in these ecosys-
tems. Hence, there is an urgent need to improve our
understanding of the effects of these anthropogenic
perturbations on the reactivity, fate and chemical spe-
ciation of SOC, as well as the mechanisms and processes
that control its stability and determine the potentials of
soils to sequester C in tropical and subtropical ecosys-
tems. As the dynamics of SOC are included in global C
cycle scenarios using different, but generally arbitrarily
defined kinetic pools (Gleixner et al., 2002), detailed
studies about structural chemistry and kinetic pools
of SOM following net C losses due to land-use changes
in different ecosystems across the globe may help to
register changes in soil quality and land degradation, as
well as to improve global C cycling and ecosystem
models.
The impacts of land-use and land-cover changes on
SOC in the tropics and subtropics have been the focus
of substantial research in the past. Various studies
indicated that land conversion from natural forest
or grassland to agriculture is pervasive and leads to
a reduction of up to 58% of SOC pool in the tropics
(Nye & Greenland, 1964; Dalal & Mayer, 1986a; Davidson
& Ackerman, 1993). Although the processes of SOC
sequestration and destabilization may be controlled at
the molecular level, most of these studies focused only
on the absolute amounts of SOC without much recourse
to the subtle changes that occur in the structural com-
position of SOM at the molecular level, as well as the
long-term ecological significance of these changes in the
tropics and subtropics (Martens et al., 2003; Piccolo et al.,
2004). Moreover, among the available studies, the im-
pact of land-use changes on SOM composition were
often not clear; some studies suggested anthropogenic
management imparts little impact, while others have
indicated significant changes in the structural composi-
tion of SOM (Skjemstad & Dalal, 1987; Zech et al., 1997;
Solomon et al., 2000, 2002; Lobe et al., 2002; Perez et al.,
2004). Gleixner et al. (2002) and Kogel-Knabner (2000)
stated that most of the discrepancy is related to the
complex nature of SOM and to analytical limitations
of the methods employed to effectively characterize
SOM and follow its dynamics in soils.
SOM is a heterogeneous mixture composed of organic
molecules representing both compounds released from
living plant and microbial cells (e.g. extracellular en-
512 D . S O L O M O N et al.
r 2007 The AuthorsJournal compilation r 2007 Blackwell Publishing Ltd, Global Change Biology, 13, 511–530

zymes, surface-active proteins, chelating compounds,
etc.) to complex plant, animal and microbial residues
ranging in size and complexity from simple monomers
or organic acids to mixtures of complex biopolymers
that differ in stability. Such variations along the decom-
position and size continuum create significant analyti-
cal problems and thus have made studies on SOM
composition and its implications for the global bio-
geochemical cycling of C very challenging. These
challenges have led to recent advances in analytical
techniques that advanced our understanding of the
processes underlying its transformations forcing us to
re-examine some of the long-held theories about SOM
(Hatcher et al., 2001). Despite these advances, Kogel-
Knabner (2000, 2002) emphasized that SOM character-
ization could further benefit from the progress made in
nondestructive microscopic and microscale X-ray spec-
troscopy techniques to gain new insights about the
reactivity, composition, microheterogenity and physical
location of organic materials in soils. Recent investi-
gations using synchrotron-based scanning transmission
X-ray microscopy (STXM), C (1s) near-edge X-ray ab-
sorption fine structure (NEXAFS) and synchrotron-
based Fourier transform infrared-attenuated total
reflectance (Sr-FTIR-ATR) spectroscopy have indicated
that these techniques are powerful, noninvasive techni-
ques methods, which can be used to identify and
fingerprint the complex structural characteristics of
SOC, as well as to investigate the impact of manage-
ment on the composition and biogeochemical cycling of
organic C at the molecular level in terrestrial ecosys-
tems (Scheinost et al., 2001; Jokic et al., 2003; Schafer
et al., 2003; Lehmann et al., 2005; Solomon et al., 2005b).
Therefore, the objectives of this study were: (i) to
identify and fingerprint the functional group composi-
tion of SOC using C K-edge NEXAFS and Sr-FTIR-ATR
spectroscopic techniques, and (ii) to investigate the
long-term impact of anthropogenic land-use and land-
cover changes on the amount and molecular level
speciation of SOM in up to 100 years old agricultural
fields converted from native tropical forest and subtro-
pical grassland ecosystems of Kenya and South Africa,
respectively. The results from C (1s) NEXAFS and Sr-
FTIR-ATR spectroscopy were evaluated against the
results obtained from 13C nuclear magnetic resonance
(NMR) spectroscopy, which is a more established SOC
characterization technique.
Materials and methods
Site description
The study was conducted using soil samples collected
from the Kakamega (0011401900N, 3415701300E) and South
Nandi (0010403000N, 3415803400E) forests of western
Kenya and from the grassland ecosystems near Harri-
smith (291706000E, 2811606000S), Kroonstad (2711306000E,
2713806000S) and Tweespruit (261100000E, 291460000S) in
South Africa. The Kakamega forest is the eastern-most
remnant of Guineo-Congolian rainforest, which in the
past millennium stretched across the entire expanse of
West and central Africa to East African highlands. It is
one of the last remnants of virgin tropical rainforests
currently existing in this intensely cultivated region.
The Kakamega forest was a contiguous forest until 1895;
since then, the forested area has been constantly de-
creasing through deforestation to a number of periph-
eral fragments among which the Nandi highland forests
are the largest ones. The altitude of the Kakamega and
Nandi sites ranges from 1700 to 1800 m above sea level
(a.s.l.). Mean annual temperature (MAT) is about 19 1C
with mean annual precipitation (MAP) of 2000 mm. The
soils of Kakamega forest are well-drained, deep red to
yellowish red, friable sandy clay to sandy loam texture.
They are developed from undifferentiated Basement
System rocks and are classified as Ferralo-Chromic
Acrisols (FAO-UNESCO, 1997). The southern Nandi
forest is composed of well-drained, extremely deep
and dark to reddish brown soils with friable clay and
thick humic top layer principally developed on biotite-
gneiss parent material. They are classified as Humic
Nitosols (FAO-UNESCO, 1997). The natural vegetation
of these two sites is composed of tropical rainforest of
Guineo-Congolian species, including Aningeria altissima
(A. Chev.), Milicia excelsa (Welw., C. C. Berg), Antiaris
toxicaria (Lesch) and Chrysophyllum albidum (G. Don).
There are also species of montane forest including Olea
capensis (L.) and Croton megalocarpus (Hutchinson). The
agricultural fields at the Kakamega and Nandi sites
were plowed to 10–12 cm depth, and maize (Zea mays
L.) was grown as the main crop without fertilizer inputs
with an occasional inclusion of finger millet (Eleusine
coracana Gaertn.) or sorghum [Sorghum bicolor (L.,
Moench)]. At both sites, crop residues are collected
and used as animal feed.
The altitude of the South African sites ranges from
1350 to 1800 m a.s.l. The three sites are located in the
summer rainfall region with MAP ranging from 516 to
625 mm and MAT ranging from 14 to 17 1C. They belong
to the Highveld grassland biome, which is dominated
by Cymbopogon plurinodis (Stapf ex Burtt-Davy), Themeda
triandra (Forssk.), Elionurus muticus (Spreng., Kuntze)
and Eragrostis curvula (Schrad., Nees) at Harrismith; E.
lehmanniana (Nees), E. obtusa (Munro ex Ficalho and
Hiern), Panicum coloratum (L)., Stipagrostis uniplumis
(Licht., De Winter) and Pentzia globosa (Less.) at Kroon-
stad, and T. triandra (Forssk.) at Tweespruit. The soils
have medium to coarse texture and are classified as
S P E C I A T I O N A N D D Y N A M I C S O F O R G A N I C C A R B O N 513
r 2007 The AuthorsJournal compilation r 2007 Blackwell Publishing Ltd, Global Change Biology, 13, 511–530
Dystric to Eutric Plinthosols (FAO-UNESCO, 1997). The
agricultural fields were plowed to a depth of 20–30 cm
and wheat (Triticum aestivum L.) and maize (Z. mays L.)
were grown in rotation with inorganic fertilizers.
Sampling
In western Kenya, we selected sites from the natural
forests and from fields cultivated for 2, 4, 20, 30, 50, 80,
100 years at the Nandi and for 2, 4, 18, 45, 73 and 103
years at the Kakamega sites. Similarly, in South Africa,
we sampled soils from arable land under cultivation for
about 3, 8, 10, 20, 30, 40, 60 and 90 years and from
adjacent native grasslands sites in the three agroecosys-
tems. At each field, we collected nine 200 cm3 core
subsamples from the upper 10 cm soil (upper 20 cm in
the South African sites) in a radial sampling scheme,
which were later combined to one composite sample. In
some sites, we were able to locate more than one land-
use transitions from the same age group, and we
collected replicate samples from such fields. However,
due to limitations in instrument availability and beam-
time allocation, we pooled these replicate samples
together (in the case of the South African sites, we
mixed samples collected from the three sites that belong
to the same age group together) and prepared one
representative sample per site to represent each conver-
sion time. The samples were then air dried and sieved
(o2 mm) before chemical analysis.
Chemical analysis
Total C, N and H concentrations in the bulk soils and
humic fractions were determined with a C/H/N/S-
analyzer (Elementar Analysensysteme GmbH, Hanau,
Germany). The concentration of O in the humic frac-
tions was measured by PerkinElmer 2400 elemental
analyzer (PerkinElmer Life and Analytical Sciences
Inc., Wellesley, MA, USA). The pH-H2O and pH-KCl
were determined in a 1 : 2.5 soil : water (w/v) suspen-
sion. Selected soil physical and chemical characteristics
of the sites are shown in Table 1.
Extraction of humic fractions
Humic fractions are complex, dark colored, heteroge-
neous mixtures of organic materials which comprise
both humic substances and recognizable biomolecular
fragments intimately associated even covalently bonded
with humic substances (Sutton & Sposito, 2005). They
were extracted from the soils three times with a mixture
of 0.1 M NaOH and 0.4 M NaF (pH 12.4) at a soil to
extraction solution ratio of 1 : 5 (w/v) under N2 envir-
onment. The extraction procedure followed the outline
of Schnitzer (1982), as modified by (Sumann et al., 1998).
Replacement of 0.1 M Na4P2O7 by 0.1 M NaOH–0.4 M
NaF mixture does not affect the 13C NMR spectra of
humic fractions, rather it improves extraction yield
compared with extraction using only 0.1 M Na4P2O7
(Sumann et al., 1998). The F� ion was introduced to
dissolve silicate impurities and reduce the influence of
paramagnetic metals that are major impediments to the
use of solid-state 13C NMR spectroscopy for the char-
acterization of SOM in whole soils and humic fractions
(Kim et al., 1990; Smernik & Oades, 2002). Combined
extracts were filtered twice through a 0.2mm membrane
filter (Gelman Supor, Pall Gelman Laboratory, Ann
Arbor, MI, USA) under pressure to remove fine clay,
that may interfere with the NEXAFS and 13C NMR
measurements (Solomon et al., 2005b). The extracts
were transferred into dialysis tubes (MWCO 12 000–
14 000 Da; Spectrum Laboratories, Gardena, CA, USA)
and dialyzed against distilled–deionized water to re-
move salts and finally lyophilized using a freeze dryer
(Kinetics Thermal Systems, Stone Ridge, NY, USA). This
procedure extracted 51–72% of the SOM from the bulk
soils, and is within the ranges reported by Rice (2001)
and Scheffer & Schachtschabel (2002).
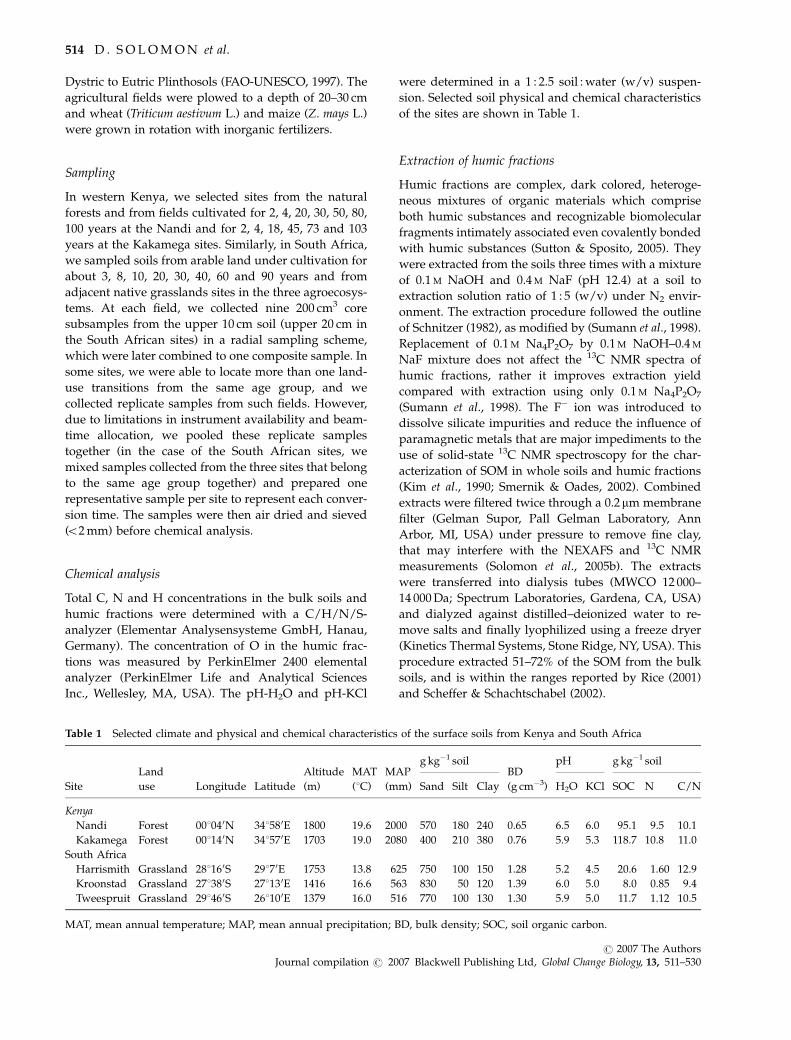
Table 1 Selected climate and physical and chemical characteristics of the surface soils from Kenya and South Africa
Site
Land
use Longitude Latitude
Altitude
(m)
MAT
(1C)
MAP
(mm)
g kg�1 soilBD
(g cm�3)
pH g kg�1 soil
Sand Silt Clay H2O KCl SOC N C/N
Kenya
Nandi Forest 001040N 341580E 1800 19.6 2000 570 180 240 0.65 6.5 6.0 95.1 9.5 10.1
Kakamega Forest 001140N 341570E 1703 19.0 2080 400 210 380 0.76 5.9 5.3 118.7 10.8 11.0
South Africa
Harrismith Grassland 281160S 29170E 1753 13.8 625 750 100 150 1.28 5.2 4.5 20.6 1.60 12.9
Kroonstad Grassland 271380S 271130E 1416 16.6 563 830 50 120 1.39 6.0 5.0 8.0 0.85 9.4
Tweespruit Grassland 291460S 261100E 1379 16.0 516 770 100 130 1.30 5.9 5.0 11.7 1.12 10.5
MAT, mean annual temperature; MAP, mean annual precipitation; BD, bulk density; SOC, soil organic carbon.
514 D . S O L O M O N et al.
r 2007 The AuthorsJournal compilation r 2007 Blackwell Publishing Ltd, Global Change Biology, 13, 511–530

13C NMR spectroscopy
Solid-state 13C cross polarization-magic angle spinning
(CP-MAS) spectra from humic fractions extracted from
the Kenyan soils were obtained at a frequency of
50.318 MHz on a Varian Unity 200 spectrometer (Varian
Inc., Palo Alto, CA, USA) with a 4.7 T wide-bore Oxford
superconducting magnet. About 200 mg of humic frac-
tion samples were packed in 7 mm diameter zirconia
rotors with Kel-F caps and spun at 5 kHz in Doty
Scientific MAS probe (Doty Scientific Inc., Columbia,
SC, USA). All spectra were attained with a contact time
of 1 ms and recycle delay time of 500 ms to ensure
complete relaxation between scans (recycle delay 47
T1H). The spectra were plotted between �100 and
300 ppm using a Lorentzian line broadening of 50 kHz
and other parameters as described by Skjemstad et al.
(2001). Signal recovery for the samples in CP mode
ranged from 48–72% (i.e. 67% in natural forest, 56% in
2 years cultivated, 56% in 20 years cultivated, 54% in 50
years cultivated and 55% in 100 years cultivated fields
at Nandi, and 64% in natural forest, 72% in 2 years
cultivated, 56% in 18 years cultivated, 48% in 45 years
cultivated, 59% in 73 years cultivated and 53% in 103
years cultivated fields at Kakamega), indicating rela-
tively low recovery of signals common to humic frac-
tions. Owing to insufficient quantity of humic fractions
required for solid-state 13C CP-MAS NMR spectroscopy
of the South African samples, we used previously
recorded liquid-state 13C NMR spectra from these sam-
ples in the current investigation. Liquid-state 13C NMR
spectra were recorded as described by Solomon et al.
(2002) on a Bruker Avance DRX 500 NMR spectrometer
(Bruker BioSpin GmbH, Rheinstetten, Germany). Che-
mical shifts were recorded in ppm relative to the
resonance of an external TSP (3-trimethylsilyl propio-
nic) acid standard and signal areas were recalculated to
match the chemical shift regions used in the 13C CP-
MAS NMR results. The humic fractions used for 13C
NMR analysis were not pretreated with dilute hydro-
fluoric acid (HF) to minimize SOC loss and possible
changes in amino acid and carbohydrate structures
following pretreatment (Goncalves et al., 2003), as well
as to maintain sample uniformity used in all spectro-
scopy techniques.
Sr-FTIR spectroscopy
Sr-FTIR-ATR spectra were recorded on U10B beamline
at the National Synchrotron Light Source (NSLS), Broo-
khaven National Laboratory. The beamline is equipped
with a Spectra Tech Continuum IR microscope fitted
with �32 transmission/reflection and FTIR step-scan
spectrophotometer (Nicolet Magna 860, Thermo Nicolet
Corporation, WI, USA) with a KBr beam splitter and
mercury–cadmium–telluride (MCT) detector with
500–7000 cm�1 frequency range and 1.0 cm�1 spectral
resolution. Thin films of humic fraction samples were
prepared as described in Solomon et al. (2005b) from the
aqueous suspension obtained by dispersing them in
millipore water using ultrasound bath. We transferred
10 mL droplets of the aqueous suspension on MirrIR
glass slides (Kevley Techniologies, Chesterland, OH,
USA) and the suspension was dried at 35 1C in a
vacuum oven. FTIR-ATR spectra from the samples were
recorded with a 10mm� 10 mm aperture size from 4000
to 650 cm�1 with a resolution of 4 cm�1. Each spectrum
was composed of 256 scans coadded before Fourier
transform processing. After subtracting the background
of the IR glass, we used OMNIC version 6.1 for win-
dows (Thermo Nicolete Corp.) on the reduced portions
of the spectra (4000–800 cm�1) to automatically correct
the baseline, normalize, identify the peaks and calculate
the signal intensities of the spectra.
NEXAFS
C (1s) NEXAFS were recorded at X-1A1 beamline of the
NSLS using the STXM endstation. The essential compo-
nents of the STMX used in the present experiment were
a tunable undulator, which is inserted in the 2.8 GeV
electron storage ring generating a high flux photons at
106 spatially coherent photons s�1 in the soft X-ray
region, a spherical grating monochromator with max-
imum spectra resolving power of 5000 lines mm�1, a
160 mm Fresnel zone plate with a normal spatial resolu-
tion of 45 nm and a proportional counter to detect the
transmitted photons. The beamline slit width was set to
45 mm� 25mm� 25 mm. The monochromator was cali-
brated using the absorption band of CO2. Thin films
were prepared from the aqueous suspension of humic
fractions in similar manner as for Sr-FTIR-ATR. We
transferred 3 mL droplets of the aqueous suspension to
100 nm thick Si3N4 windows (Silson Ltd., Northampton,
UK) and dried the suspension at 35 1C. After high-
resolution micrographs were taken by STXM to locate
an area of uniform thickness, the illuminated spot on
the samples were then increased to 10mm by defocusing
the zoneplate. Spectra from the samples (I) were col-
lected from three different spots through the films and
Si3N4 windows by moving the grating from 280 to
310 eV on a single spot with 120 ms dwell times in
energy steps of 0.1 eV. Before each sample scan, back-
ground spectra (Io) were collected in triplicates from the
sample free region of the same Si3N4 windows and
averaged. Two ionization thresholds (IP) were set for
the NEXAFS spectra deconvolution by setting two
arctangent functions (AT) at 290.5 eV for aromatic/
S P E C I A T I O N A N D D Y N A M I C S O F O R G A N I C C A R B O N 515
r 2007 The AuthorsJournal compilation r 2007 Blackwell Publishing Ltd, Global Change Biology, 13, 511–530

aliphatic C and 292.0 eV for hydroxylated aromatic C
(taking into account the C and O composition of the
samples) with full-width at half-maximum (FWHM) of
0.4 eV to generate a continuum of spectrum up to
294 eV. The FWHM of the Gaussian peaks (G) was set
at 0.4 eV and six Gaussian functions representing the
main 1s–p* transitions at 284.4 (G1), 285.2 (G2), 286.6
(G3), 287.6 (G4), 288.5 (G5) and 289.3 (G6) eV were
resolved. Furthermore, two s* transitions (290.2, z1
and 291.5, s2) were simulated by simplified Gaussian
shape function with FWHM of o1 and o2 eV, respec-
tively, using WinXAS version 3.1 for windows (WinXAS
Software, Hamburg, Germany). The spectra were pre-
edge normalized using WinXAS to avoid spectral de-
pendence on C content, therefore, spectral properties
are indicative of changes in C chemistry. As fine struc-
tures in the C NEXAFS region above 290 eV transitions
tend to be very broad and overlap with each other
(Cody et al., 1998; Schafer et al., 2003), only main 1s–p*
transitions were used for quantification and interpreta-
tion of the NEXAFS results in the present investigation.
Decay models and statistics
Based on the assumption that SOM reaches new equili-
brium concentration following land-use changes, Dalal
& Mayer (1986a) and Lobe et al. (2001) used exponential
models to describe the response of organic matter in
soils following cultivation. We employed similar ap-
proaches and used a monoexponential decay model to
describe the dynamics of SOC and N concentrations
following long-term land-use changes in the surface
soils under investigation:
Xt ¼ Xe þ ðX0 � XeÞexpð�ktÞ; ð1Þ
where Xt is the concentration of SOC and N in the soils
at cultivation time t, Xe is the total SOC and N concen-
tration in the soils at equilibrium, X0 is the initial
concentration of SOC and N in the native forest or
grassland soils (t 5 0), and k is a rate constant (year�1).
Additionally, as different rates of SOM decomposition
have frequently been attributed to biologically mean-
ingful discrete pools of varying stability (Jenkinson
& Rayner, 1977), we used a modified version of a bi-
exponential model (Lobe et al., 2001) to describe the
dynamics of the different SOC and N pools in the
investigated soils:
Xt ¼ X1expð�k1tÞ þ X2expð�k2tÞ; ð2Þ
where Xt is the concentration of total SOC and N at
cultivation time t, X1 is the concentration of SOC and N
of the labile pool, X2 is the concentration of SOC and N
of the stable pool (X2 5 X0�X1), k1 is the rate constant of
the labile pool (year�1), and k2 is the rate constant of the
stable pool (year�1). The data set for the SOC and N
concentrations (n 5 8 at Nandi, n 5 7 at Kakamega and
n 5 9 at the South African sites) in our experiment were
fairly small and would have resulted in overparameter-
ization if used to calculate SOC and N concentrations at
equilibrium (Xe) using extended biexponential model
[Xt 5 X1exp(�k1t) 1 X2exp(�k2t) 1 Xe]. Therefore, we
did not determine the equilibrium concentrations of
total SOC and N following cultivation using the biex-
ponential model. To reduce variability between SOM
concentrations in the different agroecosystems, SOC
and N losses were expressed as relative proportions to
total SOC and N of the natural forest and grassland eco-
systems (i.e. X0 5 100). Correlation coefficients showing
the relationship between the loss of total SOC and N as
well as the relationship between the band areas of or-
ganic C functional groups derived from C (1s) NEXAFS,13C NMR and signal intensities of the Sr-FTIR-ATR
spectroscopy of humic fractions were run by Pearson
product moment correlation using Statistica 5.0 for
Windows (1999).
Results and discussions
Organic C and N concentrations and long-term dynamicsin bulk soils
The concentration of SOC in surface layers of the forest-
derived soils of Kenya varied from 15.3 to 95.1 g kg�1
soil at Nandi and from 16.8 to 118.7 g kg�1 soil at
Kakamega, while the concentration of total N ranged
from 1.51 to 9.5 g kg�1 soil and from 1.5 to 10.8 g kg�1
soil at the two sites, respectively. These values compare
positively with the ranges SOC and N concentrations
reported for tropical forest-derived soils by Krull et al.
(2002) and Nziguheba et al. (2005) from Kenya, Gug-
genberger et al. (1999) from Costa Rica, Moller et al.
(2000) from Thailand, and by Solomon et al. (2002) and
Lemenih & Itanna (2004) from Ethiopia. The concentra-
tions of SOC and N in the grassland-derived soils of
South Africa ranged from 5.3 to 16.3 g kg�1 soil and
from 0.60 to 1.4 g kg�1 soil, respectively, and are con-
siderably lower than the values from forest-derived
soils of Kenya. However, they are in line with the ranges
reported for variety of tropical and subtropical grass-
land-derived soils by Bechtold & Naiman (2006) from
South Africa, Zingore et al. (2005) from Zimbabwe,
Agbenin & Adeniyi (2005) from Nigeria, Solomon
et al. (2000) and McDonagh et al. (2001) from Tanzania,
and by Michelsen et al. (2005) from Ethiopia. The higher
SOC and N concentrations in the subhumid tropical
agroecosystems of Kenya compared with the subtropi-
cal grassland agoecosystems of South Africa could be
attributed to differences in climate, the quantity and
516 D . S O L O M O N et al.
r 2007 The AuthorsJournal compilation r 2007 Blackwell Publishing Ltd, Global Change Biology, 13, 511–530

quality of organic matter produced and incorporated
annually in to the soil, and to variations in sampling
depth and soil type.
The proportions of SOC and N that remained in the
surface soils in relation to the duration of cultivation are
shown in Fig. 1. According to this figure, the concentra-
tion of organic C in the forest-derived soils of Nandi and
Kakamega, as well as in the grassland-derived soils of
South Africa decreased exponentially to about 24%, 14%
and 33% of the original amount following clearing of the
natural vegetation and long-term cultivation, respec-
tively. Similarly, the concentration of total N declined
with increasing duration of cultivation to about 23%,
15% and 44% of the original concentration at Nandi,
Kakamega and the South African sites, respectively, over
a period of up to 100 years. Significant proportions of the
total SOC (46–73%) and N (37–73%) losses occurred
during the first 3–4 years of conversion indicating that
the surface layers of these forest- and grassland-derived
soils contain large amount of labile SOM, which is
potentially very vulnerable to degradation upon hu-
man-induced land-use and land-cover changes. Our
results show that SOC and N concentrations in the arable
soils approached steady-state equilibrium (te) after about
37 and 38 years at Nandi, after about 21 and 29 years at
Kakamega and after about 34 and 30 years at the South
African sites, respectively. The rate and magnitude of
changes in SOC and N observed especially at the early
stages of conversion in these tropical and subtropical
highland agroecosystems are much larger than the va-
lues reported by Bowman et al. (1990) and Davidson &
Ackerman (1993) for temperate soils and by Nye &
Greenland (1964), Solomon et al. (2000) and Dieckow
et al. (2005) for a range of tropical soils.
As more detailed information about the dynamics of
SOC and N pools can be obtained using biexponential
model, we calculated the time required to reach the
point of kinetic change (tkc) at which losses from the
0 20 40 60 80 100
0
20
40
60
80
100
0 20 40 60 80 100
SO
C r
emai
ning
(%
)
0
20
40
60
80
100
Years since conversion0 20 40 60 80 100
0
20
40
60
80
100
0 20 40 60 80 100
0
20
40
60
80
100
0 20 40 60 80 100
Tot
al N
rem
aini
ng (
%)
0
20
40
60
80
100
Years since conversion0 20 40 60 80 100
0
20
40
60
80
100(c) South African grassland (f) South African grassland
(a) Nandi forest
(b) Kakamega forest (e) Kakamega forest
(d) Nandi forest
r = 0.97
k = 0.14
r = 0.99
k = 0.14
r = 0.98
k = 0.29
r = 0.95
k = 0.23
r = 0.99
k = 0.16
r = 0.99
k = 0.14
Fig. 1 Long-term impacts of human-induced land-use and land-cover changes on the concentrations of total organic carbon and N in
the surface layers of soils from the tropical forest agroecosystems of Kenya and subtropical grassland agroecosystems of South Africa.
The solid lines represent fit using monoexponential model [Eqn (1)].
S P E C I A T I O N A N D D Y N A M I C S O F O R G A N I C C A R B O N 517
r 2007 The AuthorsJournal compilation r 2007 Blackwell Publishing Ltd, Global Change Biology, 13, 511–530

stable pool started to control the dissipation kinetics
using Eqn (2). The results indicated that for the total
SOC concentration, this point was reached after 28, 13
and 17 years of cultivation at Nandi, Kakamega and the
South African sites, respectively; whereas for total N, it
took 24 years at Nandi, 15 years at Kakamega and 22
years at the South African sites. Hence, we suggest that
the capacity of these natural forest- and native grass-
land-derived soils to supply easily mineralizable SOM
pools and associated essential plant nutrients declined
considerably on average after about 20 years of contin-
uous cropping. We attribute the rapid depletion of SOC
and N at the early stage of transition to enhanced
biological mineralization SOM as a result of improved
soil aeration and exposure of physically protected or-
ganic materials in aggregates to soil microorganism due
to physical disruption. Moreover, reduced input of
plant residues into the surface soils, as well as acceler-
ated loss of soil by erosion, and hence, C and N from the
surface soils due to land-use and land-cover changes
(Zingore et al., 2005) may have also contributed to the
observed depletion of SOC and N from the agricultu-
rally managed fields. Our results also indicate that the
forest-derived soils of Kenya lost larger proportions of
SOC and N compared with the grassland-derived soils
of South Africa. This might be ascribed to higher initial
SOM content accompanied by relatively higher MAT
and MAP of the western Kenyan sites, which create
conducive environment for decomposers and increases
vulnerability of SOM to oxidative mineralization and
other losses associated with anthropogenic interven-
tions, and possibly due to the application of inorganic
fertilizers at the South African sites.
The C/N ratio of the surface soils varied between 9.3
and 10.3 at Nandi, from 8.7 to 11.6 at Kakamega, from
8.9 to 11.8 at the South African sites. Unlike the total
SOC and N concentrations, however, there was no
consistent trend observed in C/N ratio with the dura-
tion of cultivation following the conversion of the native
forest and grassland sites into agricultural fields. We
attribute this to a highly significant correlation between
the losses of SOC and N with time in the forest-derived
soils of Kenya (r 5 0.99 at Nandi and r 5 0.98 at Kaka-
mega) and grassland-derived soils of South Africa
(r 5 0.99), indicating the close coupling in loss kinetics
of these two parameters in the investigated soils. These
results partly agree with the results of Dalal & Mayer
(1986b) who observed that cultivation had no signifi-
cant effect on the C/N ratio of some Australian soils.
However, they contradict those of Haas et al. (1957) who
reported lower C/N ratio in cultivated than virgin soils
in the Great Plains, as losses of SOC exceeded that of N
following conversion of native grassland sites to agri-
cultural fields.
Elemental compositions and ratios of humic fractions
Elemental analysis provides information on the distri-
bution of major elements in humic fractions and can be
used as an important indicator of the degree of decom-
position. The data in Table 2 shows that the average
proportions of SOC (42.1%, 41.3% and 37.1%), N (3.9%,
3.9% and 3.3%), H (4.9%, 4.5% and 4.3%) and O (39.5%,
38.9% and 37.5%) in the humic fractions extracted from
the forest-derived soils of Nandi and Kakamega and
grassland-derived soils of South Africa, respectively.
These values are within the ranges reported for humic
fractions extracted from tropical soils by Schnitzer &
Khan (1978), Stevenson (1982) and Perez et al. (2004).
Our results indicate relatively lower proportions of
organic C, N and H and a slightly higher proportion
of O in the humic fractions extracted from soils under
long-term cropping compared with those from native
forest and grassland soils. The trends in the present
investigation compare favorably with the patterns ob-
served by Martin et al. (1998), who showed that cultiva-
tion usually decreases the contents of C, N and H but
increases O concentration due to oxidative degradation
of humic fractions.
The ratio of C/H has been used as an aromaticity
index, where a larger C/H value is associated with a
higher degree aromaticity in humic fractions (McDon-
nell et al., 2001). Our elemental ratios showed that land-
use changes slightly increased the ratio of C/H and that
alkali extractable SOM in the cultivated soils appear to
be more aromatic compared with the native sites. There
was no consistent trend observed in the C/N ratio of
the humic fractions. However, the results in Table 2
indicates that the O/H ratio increased, while the C/O
ratio tend to decrease with time following the conver-
sion of the forests and grasslands to continuous cultiva-
tion in the humic fractions. These results suggest
increased biological oxidation associated with decrease
in readily mineralizable organic C biomolecules such as
some carbohydrates, amino acids and amino sugars in
the cultivated soils as a result of land clearing and
mechanical disturbance of the soil by tillage practices
(Zhang et al., 1999; Solomon et al., 2000, 2002; Brodowski
et al., 2004).
Organic C speciation and long-term dynamics using13C NMR spectroscopy
The stacked 13C NMR spectra of the humic fractions
extracted from the bulk soils of Kenyan and South
African sites (Fig. 2) revealed multiple peaks between
d5 0 and 50 ppm indicating highly heterogeneous com-
position of alkyl-C species due to the presence of (poly)-
methylene chains and branched aliphatic domains such
518 D . S O L O M O N et al.
r 2007 The AuthorsJournal compilation r 2007 Blackwell Publishing Ltd, Global Change Biology, 13, 511–530

as those found in lipids, hemicellulose, proteins, alipha-
tic biopolymers such as cutin and suberin (Skjemstad
et al., 1983). The resonances between d5 50 and 60 ppm
are attributed to methoxyl-C groups indicatives of
syringyl and guaiacyl (sinapyl) units of lignin, as well
as to N-alkyl C from polypeptides (Kogel-Knabner,
2002). Chemical shifts between d5 60 and 110 ppm
represent mainly O-alkyl-C structures attributed to
diverse group of carbohydrates that produce signals
between d5 60 and 95 ppm due to the presence of C2 to
C6 structures such as cellulose, hemicellulose and other
polymeric carbohydrates, as well as alcohols and ether-
bonded aliphatic C; while signals between d5 95 and
110 ppm are ascribed to anomeric C (C1) polysacchar-
ides and ketals (Kogel-Knabner, 2002; Jokic et al., 2003).
Aromatic-C resonated between d5 110 and 165 ppm,
where the broad signals between d5 110 and 145 ppm
are attributed to a wide variety of H- and C-substituted
aryl-C structures, while peaks between d5 145 and
165 ppm arise from O-substituted aryl C indicative of
lignin-derived phenols such as syringyl, guaiacyl and
p-hydroxyphenyl structures (Kogel-Knabner, 2002). Che-
mical shifts between d5 165 and 220 ppm are assigned
to carbonyl-C groups representing a variety organic C
functionalities such as carboxylic acid, amide and poly-
peptides (d5 165–175 ppm), whereas signals between
d5 185 and 220 ppm are attributed to aldehyde-C,
ketonic-C and quinone-C (Skjemstad et al., 1983).
The relative proportion of organic C functional
groups identified by 13C NMR spectroscopy (Table 3)
indicate that structures containing O-alkyl-C are the
dominant organic C forms representing on average for
37.7%, 38.0% and 35.3% of the total SOC identified by13C NMR spectroscopy at the Nandi, Kakamega and the
South African sites, respectively. Aromatic-C (H- and
C-substituted aryl-C and O-aryl-C) structures were the
second most abundant organic C species constituting on
average for 22.0%, 21.9% and 25.6% of the total SOC at
the three sites, respectively. Alkyl-C represented 16.1%
at Nandi, 15.5% at Kakamega and 16.8% at the South
African sites; whereas carbonyl-C accounted for 13.9%,
14.8% and 16.5%, respectively. Methoxyl-C and N-alkyl-
Table 2 Elemental composition and ratios of humic fraction extracts of soils from the long-term chronosequences of Kenya and
South Africa
Site Land use
%
C/N C/H C/O O/HC N H O
Kenya
Nandi
Natural forest 43.2 4.0 5.1 38.4 10.8 8.4 1.12 7.5
2 years cultivated 43.9 3.8 4.6 40.4 11.5 9.5 1.09 8.8
4 years cultivated 43.1 4.0 4.8 40.2 10.8 9.0 1.07 8.4
20 years cultivated 41.3 4.0 4.8 39.2 10.3 8.7 1.05 8.3
30 years cultivated 41.1 4.1 5.0 39.1 10.1 8.2 1.05 7.8
50 years cultivated 41.1 4.2 5.1 39.9 9.7 8.1 1.03 7.8
80 years cultivated 41.3 3.8 4.9 38.1 11.0 8.4 1.08 7.7
100 years cultivated 41.6 3.5 4.6 40.9 12.0 9.1 1.02 8.9
Kakamega
Natural forest 43.6 4.0 4.8 38.8 10.9 9.0 1.12 8.0
2 years cultivated 43.6 4.1 5.0 38.4 10.6 8.7 1.14 7.6
4 years cultivated 44.1 3.9 4.3 38.3 11.3 10.2 1.15 8.9
18 years cultivated 40.7 4.3 4.3 39.1 9.5 9.4 1.04 9.1
45 years cultivated 39.6 4.1 4.6 37.9 9.6 8.6 1.05 8.3
73 years cultivated 39.1 3.4 4.1 41.2 11.7 9.6 0.95 10.1
100 years cultivated 38.6 3.8 4.1 38.9 10.4 9.4 0.99 9.5
South Africa Natural grassland 38.4 3.5 4.5 37.2 11.01 8.5 1.03 8.2
3 years cultivated 37.2 3.3 4.1 37.1 11.4 9.0 1.00 9.0
8 years cultivated 37.5 3.3 4.2 37.6 11.5 8.9 1.00 8.9
10 years cultivated 36.6 3.2 4.1 38.0 11.5 8.9 0.96 9.3
20 years cultivated 34.6 3.1 4.6 37.0 11.2 7.6 0.93 8.1
30 years cultivated 36.7 3.2 4.0 36.7 11.6 9.2 1.00 9.1
40 years cultivated 37.7 3.3 4.1 36.7 11.4 9.2 1.03 9.0
60 years cultivated 36.3 3.3 4.4 38.7 10.9 8.3 0.94 8.8
90 years cultivated 38.6 3.4 4.4 38.2 11.2 8.7 1.01 8.6
S P E C I A T I O N A N D D Y N A M I C S O F O R G A N I C C A R B O N 519
r 2007 The AuthorsJournal compilation r 2007 Blackwell Publishing Ltd, Global Change Biology, 13, 511–530

C accounted only for smaller portion (10.2%, 10.0% and
5.8%) of the total SOC identified by 13C NMR in the
humic fractions extracted from the three agroecosys-
tems (Table 3).
Integration of signal intensities resolved by 13C NMR
spectroscopy (Table 3) indicated subtle but consistent
differences in the structural composition of SOC in the
humic fractions following land-use and land-cover
changes. Clearing natural vegetation and subsequent
cultivation resulted in relatively smaller proportions of
O-alkyl-C structures (from 39.8% to 35.6% at Nandi,
from 42.0% to 34.2% at Kakamega and from 38.0% to
33.8% at the South African sites) in the humic fractions.
However, with the exception of native grassland soils of
South Africa where higher proportions of alkyl-C were
detected by NMR, small but consistent increases in
proportions of alkyl-C and aromatic-C structures were
observed in the humic fractions following land-use and
land-cover changes. The trends for carbonyl-C and
methoxyl-C structures were not consistent.
As the concomitant decrease of labile organic C
structures and increase of recalcitrant components of
SOC move in opposite directions as decomposition
proceeds, Baldock et al. (1997) suggested that ratios of
various organic C functionalities may provide sensitive
indices of the extent of decomposition of SOM. Hence,
we applied the following indexes: O-alkyl-C to aromatic-
C, aromatic-C to alkyl-C 1 methoxyl-C 1 O-alkyl-C 1
aromatic-C 1 carbonyl-C (aromaticity), and alkyl-C to
O-alkyl-C to further evaluate the extent of changes in
the structural composition of SOC in the humic frac-
tions with time following land-use changes. Clearing
the natural vegetation and converting it in to long-term
continuous cultivation resulted in a gradual decrease of
O-alkyl-C to aromatic-C ratio from 1.8 to 1.5 at Nandi,
from 2.2 to 1.4 at Kakamega and from 1.8 to 1.4 at the
South African sites (Table 3), while the degree of ar-
omaticity and aliphaticity (alkyl-C to O-alkyl-C) tend to
show an increasing tendency in the arable soils with the
duration of cultivation. These trends agree with the
changes observed in structural composition of SOC
determined using 13C NMR spectroscopy in other tro-
pical soils following land-use transitions by Golchin
et al. (1995), Baldock et al. (1997), Skjemstad et al.
(2001) and Solomon et al. (2002). However, the ratio of
alkyl-C to O-alkyl-C in the native grassland soils of
−10050 0 −50100150200250 −10050 0 −50100150200250
2 years
ForestForest
20 years
50 years
100 years
2 years
18 years
45 years
73 years
103 years
50 0100150200250 −100
3 years
Grassland
8 years
20 years
30 years
40 years
90 years
(a) Nandi forest, Kenya (b) Kakamega forest, Kenya (c) Grassland, South Africa
Chemical shift (ppm)Chemical shift (ppm)Chemical shift (ppm)
Fig. 2 Stacked 13C N nuclear magnetic resonance spectra of humic fractions from the long-term chronosequences of Kenya and South
Africa.
520 D . S O L O M O N et al.
r 2007 The AuthorsJournal compilation r 2007 Blackwell Publishing Ltd, Global Change Biology, 13, 511–530

South Africa was still high compared with most agri-
cultural fields and does not conform to the above trend.
Abrupt changes in the progressive increase in alkyl-C to
O-alkyl-C ratios have also been observed by Golchin
et al. (1995), and attributed to selective stabilization of
organic inputs or metabolic products of aliphatic nature
by adsorption to mineral surfaces and formation of
organo-mineral complexes in native soils. Despite the
overall similarity of the spectra, which might be as-
cribed to the normally low signal recovery, the fine scale
shifts in chemical composition evident from our 13C
NMR spectra and the trends observed in the decom-
position indexes indicate losses of more readily decom-
posable O-alkyl-C structures such as polysaccharides
from the humic fractions and an accumulation of more
recalcitrant aromatic-C and alkyl-C structures during
the course of decomposition processes following long-
term anthropogenic land-use and land-cover changes.
Organic C speciation and long-term dynamics usingSr-FTIR-ATR spectroscopy
Sr-FTIR-ATR spectra of humic fractions contain a vari-
ety of bands that are diagnostic and can serve as a
valuable tool not only to characterize the principal
classes of chemical groups of which SOM is comprised
but also to investigate management induced changes in
the composition of SOM (Solomon et al., 2005b). The
Sr-FTIR-ATR spectra recorded from the humic fractions
in the present experiment displayed characteristic
absorption band patterns in the frequency range of
4000–800 cm�1 indicating the presence of extremely
heterogeneous structures in these forest- and grassland-
derived soils (Fig. 3). A strong broad band at about
3370 cm�1 represents stretching vibrations of H-bonded
hydroxyl (O–H) groups of phenols with traces of amine
(N–H) stretch (Stevenson, 1982). The weak vibrations at
about 2920 and 2853 cm�1 represent asymmetric and
symmetric aliphatic-C (CH3 and CH2) stretchings.
These peaks are intense and much better resolved in
the humic fractions extracted from the grassland-
derived soils of South Africa compared with the humic
fractions extracted from the forest-derived soils of
Kenya. The slight shoulder around 1720 cm�1 (only visible
in the forest-derived soils) is due to the C5O stretching
of carboxylic-C and ketonic-C. The pronounced broad
band at about 1642 cm�1 is mainly attributed to aro-
matic-C (C5C) vibrations and to a smaller extent to
Table 3 Relative proportions of organic C functional groups in the humic fractions resolved by 13C NMR spectroscopy
Site
Land
use
%O-alkyl-C/
Aromatic-C AromaticitywAlkyl-C/
O-alkyl-CAlkyl Methoxyl O-Alkyl-C Aromatic* Carbonyl
Kenya
Nandi
Forest 13.9 9.1 39.8 22.2 15.0 1.79 0.22 0.35
2 years cultivated 15.3 10.0 39.0 21.6 14.1 1.81 0.22 0.39
20 years cultivated 16.5 10.5 37.9 22.1 13.0 1.72 0.22 0.43
80 years cultivated 18.6 11.3 36.3 20.6 13.2 1.76 0.21 0.51
100 years cultivated 16.4 10.1 35.6 23.6 14.3 1.51 0.24 0.46
Kakamega
Forest 13.3 9.3 42.0 19.0 16.4 2.20 0.19 0.32
2 years cultivated 15.2 9.5 40.0 21.9 13.4 1.82 0.22 0.38
18 years cultivated 15.9 10.7 39.3 19.9 14.2 1.98 0.20 0.40
45 years cultivated 15.1 10.0 37.0 23.7 14.2 1.56 0.24 0.41
73 years cultivated 16.6 10.8 35.3 22.5 14.8 1.57 0.23 0.47
103 years cultivated 16.6 9.4 34.2 24.2 15.6 1.41 0.24 0.48
South Africa Grassland 19.8 5.0 38.0 21.5 15.7 1.77 0.21 0.52
3 years cultivated 16.3 8.2 34.2 27.6 13.7 1.24 0.28 0.48
10 years cultivated 14.6 3.7 36.8 27.4 17.5 1.34 0.27 0.40
20 years cultivated 9.1 10.7 35.4 27.0 17.8 1.31 0.27 0.26
40 years cultivated 16.6 4.2 37.6 25.7 15.9 1.46 0.26 0.44
60 years cultivated 20.4 4.5 31.5 26.4 17.2 1.19 0.26 0.65
90 years cultivated 20.6 4.3 33.8 23.5 17.8 1.44 0.23 0.61
*Aromatic, O-aryl-C 1 H- and C-substituted aryl-C.wAromaticity, aromatic-C/alkyl-C 1 methoxyl-C 1 O-alkyl-C 1 aromatic-C 1 carbonyl-C.
NMR, nuclear magnetic resonance.
S P E C I A T I O N A N D D Y N A M I C S O F O R G A N I C C A R B O N 521
r 2007 The AuthorsJournal compilation r 2007 Blackwell Publishing Ltd, Global Change Biology, 13, 511–530

C5O stretching in quinones and ketonic acids (Steven-
son, 1982; Solomon et al., 2005b). The band which
appeared around 1389 cm�1 arises from aliphatic
(C–H) deformation of CH2 or CH3 groups (Stevenson,
1982). The band around 1252 cm�1 could be attributed
to C–O stretching and OH deformation of carboxylic-C
(COOH) groups (Lehmann et al., 2005; Solomon et al.,
2005b). The strong band at about 1071 cm�1 originated
from C–O stretching vibrations of polysaccharides
(Stevenson, 1982; Solomon et al., 2005b).
Relative proportions of organic C functional groups
calculated from peak intensities of Sr-FTIR-ATR spectra
of the humic fractions show that aromatic-C constitute
on average for 27.0%, 27.5% and 28.3% of the total SOC
identified by this technique, followed by almost similar
proportions of H-bonded O–H groups of phenols
(18.3%, 15.6% and 14.4%) and aliphatic-C deformation
of CH2 or CH3 (16.6%, 17.9% and 15.4%) at Nandi,
Kakamega and the South African sites, respectively
(Table 4). The C–O stretching and OH deformation of
carboxylic-C (COOH) groups accounted for 14.5%,
15.4% and 12.7%, while C–O stretching vibrations of
polysaccharide-C represented on average 13.9%, 14.8%
and 17.1% of the total SOC, respectively. The proportion
of asymmetric and symmetric aliphatic-C groups
amounted on average only to 9.7%, 8.8% and 12.2% of
the total SOC identified by Sr-FTIR-ATR spectroscopy
in the humic fractions extracted from the forest-derived
soils of Nandi, Kakamega and grassland-derived soils
of South Africa, respectively.
Sr-FTIR-ATR spectra (Fig. 3) and relative proportions
of signal intensities (Table 4) clearly demonstrated the
apparent impact of anthropogenic perturbations on
the structural composition of SOC at the molecular level
in these tropical and subtropical agroecosystems. The
most prominent changes in signal intensities appeared
near 1071 and 1626 cm�1 regions (Fig. 3). The relative
proportions of C–O stretching vibrations of polysac-
charides decreased from 19.4% to 8.5% at Nandi, from
19.7% to 9.2% at Kakamega and from 25.4% to 13.9% at
the South African sites following land-use changes. In
contrast, the relative proportion of aromatic-C (C5C)
vibrations increased from 21.1% to 36.9% at Nandi,
from 18.8% to 38.3% at Kakamega and from 14.3% to
33.3% at the South African sites, indicating that more
recalcitrant aromatic-C forms are becoming the domi-
Wavenumbers (cm−1) Wavenumbers (cm−1) Wavenumbers (cm−1)
Abs
orba
nce
(a.u
.)
Abs
orba
nce
(a.u
.)
Abs
orba
nce
(a.u
.)
100015002000250030003500400010001500200025003000350040001000150020002500300035004000
(a) Nandi forest, Kenya (b) Kakamega forest, Kenya (c) Grassland, South Africa
Fig. 3 Synchrotron-based Fourier transform infrared-attenuated total reflectance spectra of humic fractions from the long-term
chronosequences of Kenya and South Africa.
522 D . S O L O M O N et al.
r 2007 The AuthorsJournal compilation r 2007 Blackwell Publishing Ltd, Global Change Biology, 13, 511–530

nant forms of organic C functional groups in the humic
fractions extracted from the cultivated soils. The peak
intensities of Sr-FTIR-ATR spectra also indicated small
but consistent increases in aliphatic (C–H) deformation
of CH2 or CH3 groups following land-use and land-
cover changes signifying accumulation of some recalci-
trant aliphatic structures in the arable soils. Compared
with aliphatic (C–H) deformation of CH2 or CH3
groups, signal intensities of asymmetric and symmetric
aliphatic (CH3 and CH2) vibrations that resonate at
about 2920 and 2853 cm�1 showed an opposite trend,
whereby relative proportions of these organic C func-
tionalities decreased following anthropogenic interven-
tions. These results are in accordance with our previous
investigation on the fate of aliphatic-C structures in
humic fractions extracted from tropical soils (Solomon
et al., 2005b). Similar to 13C NMR spectroscopy, Sr-FTIR-
ATR spectra recorded from the humic fraction extracts
of the native grassland soils of South Africa indicated
the presence of higher asymmetric and symmetric
aliphatic-C, which could explain the larger total
alkyl-C structures and the unusually high alkyl-C to
O-alkyl-C ratios obtained from these sites. The changes
in relative proportions of C–O stretching and OH
deformation of carboxylic (COOH) groups and H-
bonded hydroxyl (O–H) groups of phenols were small
and inconsistent in both forest- and grassland-derived
soils. These results are supported by the trends ob-
served from O-alkyl-C to aromatic-C, aromaticity and
aliphaticity indexes (Fig. 4). According to Fig. 4a, the
ratio of O-alkyl-C to aromatic-C decreased considerably
with time in the humic fractions (from 0.92 to 0.23 at
Nandi, from 1.1 to 0.24 at Kakamega and from 1.8 to
0.42 at the South African sites) after clearing and sub-
sequent establishment of cultivated fields. However, the
degree of aromaticity (from 0.21 to 0.36 at Nandi, from
0.18 to 0.49 at Kakamega and from 0.15 to 0.36 at the
South African sites; Fig. 4b) and aliphaticity (from 1.3 to
3.0 at Nandi, from 1.5 to 2.8 at Kakamega and from 1.1
to 1.9 at the South African sites; Fig. 4c) of the humic
fractions increased with time due to transitions from
natural forest and grassland ecosystems to arable land
Table 4 Relative proportions of the different organic C species in humic fractions resolved by SR-FTIR-ATR spectroscopy
Site Land use
%
Phenolic-C Aliphatic-C* Aromatic-C Aliphatic-Cw Carboxylic-C Polysaccharide-C
Kenya
Nandi
Forest 17.9 10.1 21.1 15.4 16.1 19.4
2 years cultivated 18.0 10.1 22.4 16.2 15.9 17.4
4 years cultivated 19.2 7.2 23.6 17.2 16.6 16.2
20 years cultivated 18.4 14.0 19.9 15.1 15.9 16.8
30 years cultivated 15.3 6.8 30.2 19.4 15.6 12.7
50 years cultivated 18.3 10.7 31.2 17.0 12.3 10.5
80 years cultivated 21.5 10.8 31.0 15.4 11.5 10.0
100 years cultivated 17.4 8.3 36.9 17.1 11.8 8.5
Kakamega
Forest 14.4 14.70 18.80 15.0 17.4 19.7
2 years cultivated 20.4 13.20 20.50 15.5 11.5 18.9
4 years cultivated 16.8 12.90 20.90 15.1 15.8 18.5
18 years cultivated 18.1 5.40 27.50 19.2 16.7 13.1
45 years cultivated 14.1 4.70 31.70 20.4 16.7 12.4
73 years cultivated 12.2 4.30 34.90 20.9 16.2 11.5
103 years cultivated 13.0 6.60 38.30 19.5 13.4 9.2
South Africa Grassland 17.6 20.2 14.3 8.8 13.7 25.4
3 years cultivated 19.5 17.8 22.8 9.4 11.1 19.4
10 years cultivated 12.7 17.5 26.6 15.0 10.1 18.1
20 years cultivated 14.8 12.4 30.2 16.4 10.6 15.6
40 years cultivated 12.6 4.1 36. 9 18. 9 13.3 14.2
60 years cultivated 10.2 6.2 33.8 19.9 16.5 13.4
90 years cultivated 12.9 6.9 33.3 19.4 13.6 13.9
*Aliphatic-C vibration of asymmetric and symmetric CH3 and CH2 groups.wAliphatic-C deformation of CH2 or CH3 groups.
SR-FTIR-ATR, synchrotron-based Fourier transform infrared-attenuated total reflectance.
S P E C I A T I O N A N D D Y N A M I C S O F O R G A N I C C A R B O N 523
r 2007 The AuthorsJournal compilation r 2007 Blackwell Publishing Ltd, Global Change Biology, 13, 511–530

(Fig. 4b and c). The Sr-FTIR-ATR spectral patterns,
proportions and ratios of the humic fractions clearly
indicate that easily degradable SOM constituents, such
as polysaccharide-C and some aliphatic-C moieties
were rapidly oxidized due to accelerated mineralization
following land clearing and long-term cultivation.
Therefore, it is possible to suggest that structural com-
position of the SOM in the agriculturally managed soils
was considerably different from the SOM in the natural
forests and grassland ecosystems, and was dominated
by more recalcitrant forms of aromatic-C and aliphatic-
C structures. Our results also provide evidence that
changes in functional group chemistry of the resultant
SOC due to anthropogenic interventions continued long
after new steady-state equilibrium of total SOC (te) has
been approached in these tropical and subtropical agro-
ecosystems. The changes in the inherent SOM struc-
tures influence the biogeochemical cycling of C and
bioavailability of the nutrients associated with SOM.
Organic C speciation and long-term dynamics using C(1s) NEXAFS spectroscopy
Energy positions of the main 1s–p* transitions in the
fine structure regions (284–290 eV) of the deconvoluted
C (1s) NEXAFS spectra (Fig. 5) show characteristic
descript functional groups (Solomon et al., 2005b),
which allowed us to fingerprint the various SOC struc-
tures present in the humic fractions. They also provide a
means for semiquantitative comparison of organic C
species present in the humic fractions at the various
levels of decomposition, which seems to be a promising
way to obtain a deeper insight into the structural
composition and turnover dynamics of organic C in
terrestrial ecosystems (Scheinost et al., 2001; Schafer
et al., 2003; Solomon et al., 2005b). The C 1s–p* transition
near 284.4 eV (G1) is associated with quinone type-C,
such as benzoquinone and with protonated and alky-
lated aromatic-C or heteroatom-substituted aromatics
(Schafer et al., 2003, 2005; Solomon et al., 2005b). The
resonance near 285.2 eV (G2) is assigned to aromatic-C
(protonated and alkylated to carbonyl-substituted aro-
matic-C) and possibly olefinic-C (Cody et al., 1998;
Ade & Urquhart, 2002; Lehmann et al., 2005). The sum
of G1 and G2 is used in subsequent discussions
throughout this paper to represent total aromatic-C.
0 20 40 60 80 100
Aro
mat
icity
0.1
0.2
0.3
0.4
0.5
0 20 40 60 80 100
Poly
sacc
arid
e-C
/Aro
mat
ic-C
0.0
0.2
0.4
0.6
0.8
1.0
1.2
1.4
1.6
1.8
2.0
Years since conversion
0 20 40 60 80 100
Alip
hatic
-C/O
-alk
yl-C
1.0
1.5
2.0
2.5
3.0
Nandi forestKakamega forestSouth African grassland
(a)
(b)
(c)
Fig. 4 Ratio of polysaccharide-C to aromatic-C (a), aromaticity
(b) and aliphatic-C to polysaccharide-C (c) from the tropical
forest agroecosystems of Kenya (Nandi and Kakamega) and
subtropical grassland agroecosystems of South Africa using
synchrotron-based Fourier transform infrared-attenuated total
reflectance spectroscopy.
Photon energy (eV)
280 282 284 286 288 290 292 294
Nor
mal
ized
abso
rptio
n(a
.u.)
0.0
0.2
0.4
0.6
0.8
1.0
1.2
Fit to experimental spectrumExperimental spectrumQuinone type-CAromatic-CPhenolic-CAliphatic-CCarboxylic-CO-alkyl-C
σσArctangent
Fig. 5 Speciation of soil organic carbon (SOC) using typical C
(1s) near-edge X-ray absorption fine structure spectra deconvo-
lution showing the main 1s–p* and 1s–3p/s* transitions, two s*
transitions and arctangent step functions.
524 D . S O L O M O N et al.
r 2007 The AuthorsJournal compilation r 2007 Blackwell Publishing Ltd, Global Change Biology, 13, 511–530
The absorption band near 286.5 eV (G3) corresponds
primarily to phenolic-C including O-substituted aryl-C
indicative of lignin and possibly to Ketonic-C and
phenyl-C attached to amide group (Cody et al., 1998;
Rothe et al., 2000; Ade & Urquhart, 2002; Schafer et al.,
2003). The 1s–3p/s* transitions near 287.3 eV (G4) is
due to aliphatic-C of CH3, CH2 and CH nature, while
the strong resonance near 288.4 eV (G5) represent C
1s–p* transitions of carboxylic-C (Cody et al., 1998).
The signal near 289.3 eV (G6) is attributed to C 1s–p*
transitions of O-alkyl-C group representing mainly poly-
saccharides, as well as smaller proportions of alcohol
and ether-C (Scheinost et al., 2001; Solomon et al., 2005b).
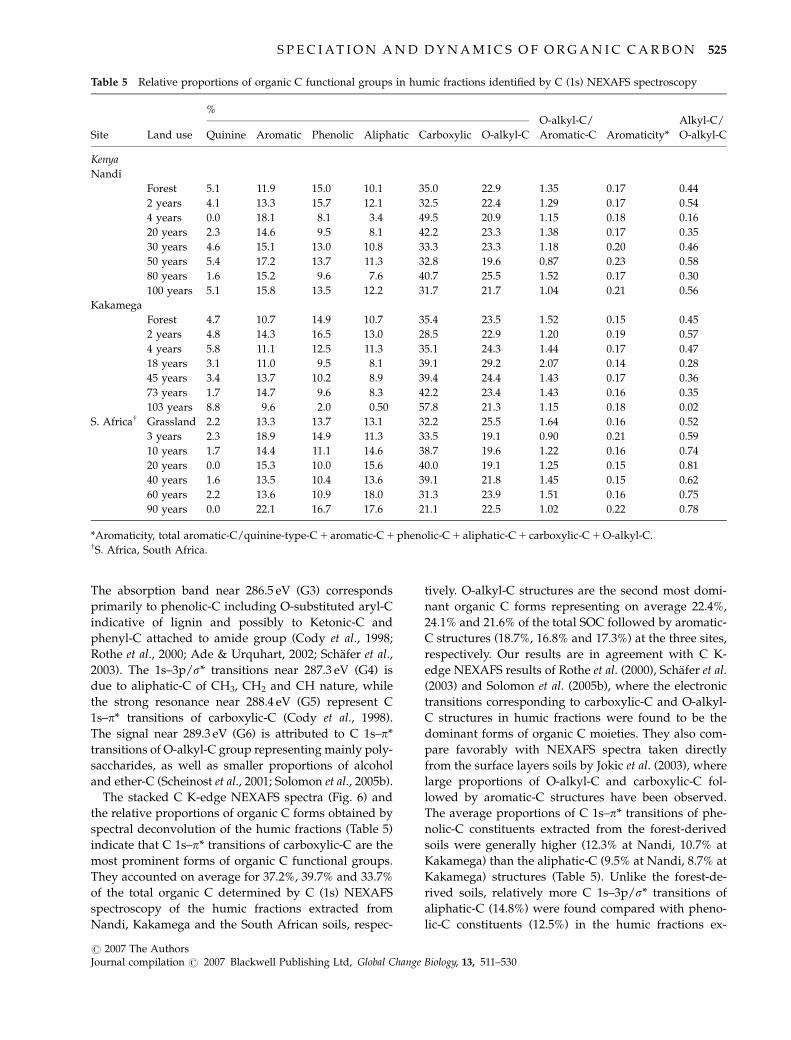
The stacked C K-edge NEXAFS spectra (Fig. 6) and
the relative proportions of organic C forms obtained by
spectral deconvolution of the humic fractions (Table 5)
indicate that C 1s–p* transitions of carboxylic-C are the
most prominent forms of organic C functional groups.
They accounted on average for 37.2%, 39.7% and 33.7%
of the total organic C determined by C (1s) NEXAFS
spectroscopy of the humic fractions extracted from
Nandi, Kakamega and the South African soils, respec-
tively. O-alkyl-C structures are the second most domi-
nant organic C forms representing on average 22.4%,
24.1% and 21.6% of the total SOC followed by aromatic-
C structures (18.7%, 16.8% and 17.3%) at the three sites,
respectively. Our results are in agreement with C K-
edge NEXAFS results of Rothe et al. (2000), Schafer et al.
(2003) and Solomon et al. (2005b), where the electronic
transitions corresponding to carboxylic-C and O-alkyl-
C structures in humic fractions were found to be the
dominant forms of organic C moieties. They also com-
pare favorably with NEXAFS spectra taken directly
from the surface layers soils by Jokic et al. (2003), where
large proportions of O-alkyl-C and carboxylic-C fol-
lowed by aromatic-C structures have been observed.
The average proportions of C 1s–p* transitions of phe-
nolic-C constituents extracted from the forest-derived
soils were generally higher (12.3% at Nandi, 10.7% at
Kakamega) than the aliphatic-C (9.5% at Nandi, 8.7% at
Kakamega) structures (Table 5). Unlike the forest-de-
rived soils, relatively more C 1s–3p/s* transitions of
aliphatic-C (14.8%) were found compared with pheno-
lic-C constituents (12.5%) in the humic fractions ex-
Table 5 Relative proportions of organic C functional groups in humic fractions identified by C (1s) NEXAFS spectroscopy
Site Land use
%O-alkyl-C/
Aromatic-C Aromaticity*
Alkyl-C/
O-alkyl-CQuinine Aromatic Phenolic Aliphatic Carboxylic O-alkyl-C
Kenya
Nandi
Forest 5.1 11.9 15.0 10.1 35.0 22.9 1.35 0.17 0.44
2 years 4.1 13.3 15.7 12.1 32.5 22.4 1.29 0.17 0.54
4 years 0.0 18.1 8.1 3.4 49.5 20.9 1.15 0.18 0.16
20 years 2.3 14.6 9.5 8.1 42.2 23.3 1.38 0.17 0.35
30 years 4.6 15.1 13.0 10.8 33.3 23.3 1.18 0.20 0.46
50 years 5.4 17.2 13.7 11.3 32.8 19.6 0.87 0.23 0.58
80 years 1.6 15.2 9.6 7.6 40.7 25.5 1.52 0.17 0.30
100 years 5.1 15.8 13.5 12.2 31.7 21.7 1.04 0.21 0.56
Kakamega
Forest 4.7 10.7 14.9 10.7 35.4 23.5 1.52 0.15 0.45
2 years 4.8 14.3 16.5 13.0 28.5 22.9 1.20 0.19 0.57
4 years 5.8 11.1 12.5 11.3 35.1 24.3 1.44 0.17 0.47
18 years 3.1 11.0 9.5 8.1 39.1 29.2 2.07 0.14 0.28
45 years 3.4 13.7 10.2 8.9 39.4 24.4 1.43 0.17 0.36
73 years 1.7 14.7 9.6 8.3 42.2 23.4 1.43 0.16 0.35
103 years 8.8 9.6 2.0 0.50 57.8 21.3 1.15 0.18 0.02
S. Africaw Grassland 2.2 13.3 13.7 13.1 32.2 25.5 1.64 0.16 0.52
3 years 2.3 18.9 14.9 11.3 33.5 19.1 0.90 0.21 0.59
10 years 1.7 14.4 11.1 14.6 38.7 19.6 1.22 0.16 0.74
20 years 0.0 15.3 10.0 15.6 40.0 19.1 1.25 0.15 0.81
40 years 1.6 13.5 10.4 13.6 39.1 21.8 1.45 0.15 0.62
60 years 2.2 13.6 10.9 18.0 31.3 23.9 1.51 0.16 0.75
90 years 0.0 22.1 16.7 17.6 21.1 22.5 1.02 0.22 0.78
*Aromaticity, total aromatic-C/quinine-type-C 1 aromatic-C 1 phenolic-C 1 aliphatic-C 1 carboxylic-C 1 O-alkyl-C.wS. Africa, South Africa.
S P E C I A T I O N A N D D Y N A M I C S O F O R G A N I C C A R B O N 525
r 2007 The AuthorsJournal compilation r 2007 Blackwell Publishing Ltd, Global Change Biology, 13, 511–530

tracted from the grassland-derived soils of South Africa.
These results complement our observations of aliphatic-
C functionalities isolated using 13C NMR and Sr-FTIR-
ATR spectroscopy of humic fractions extracted from the
native grassland soils of South Africa.
Examination of C (1s) NEXAFS spectral features
revealed that anthropogenic land-use and land-cover
changes considerably influenced the spectral features of
the humic fractions extracted from the soils under
investigation (Fig. 6). The most prominent qualitative
changes in C (1s) NEXAFS spectra occurred near 285 eV.
As can be noted from the stacked spectra in Fig. 6, the
changes in signal intensity of C 1s–p* aromatic-transi-
tions appeared as early as the fourth year after conver-
sion and their intensity continued to increase with the
duration of cultivation well after the new steady state
was approached in all the three agroecosystems. These
changes were also reflected by the relative proportions
of aromatic-C transitions and by the degree of aroma-
ticity (Table 5). The proportions of aromatic-C increased
from 17.0% to 20.9% at Nandi, from 15.4% to 18.4%
at Kakamega and from 15.5% to 22.1% at the South
African sites. We also noted other subtle but salient
qualitative and quantitative changes following anthro-
pogenic interventions such as the decrease in reso-
nances of the absorption bands at about 286.5 eV that
corresponds to phenolic-C including O-substituted
aryl-C indicative of lignin, and at about 289.3 eV repre-
senting 1s–p* transitions of O-alkyl-C group composed
mainly of polymeric carbohydrates (Fig. 6). Oxidative
degradation of lignin-derived phenols following culti-
vation was also observed from the South African sites
by Lobe et al. (2002). The changes in O-alkyl-C func-
tional groups were reflected by the decreasing trends
O-alkyl-C to aromatic-C ratios (from 1.4 to 1.0 at Nandi,
from 1.5 to 1.2 at Kakamega and from 1.6 to 1.0 at the
South African sites) with an increase in duration of
cultivation (Table 5). In contrast, alkyl-C to O-alkyl-C
ratio of the humic fractions extracted from the forest-
derived soils of Nandi (from 0.44 to 0.56) and grassland-
derived soils of South Africa (from 0.52 to 0.78)
increased with the duration of intervention. The trends
observed at the Kakamega site for this ratio were not
consistent. The C (1s) NEXAFS spectral features, rela-
tive proportions and ratios of the various organic C
functionalities in general reflect: (i) the continued de-
gradation and loss of O-alkyl structures such as those
found in carbohydrates or in cellulose, side-chain oxi-
Nor
mal
ized
abs
orpt
ion
(a.u
.)
Nor
mal
ized
abs
orpt
ion
(a.u
.)
Nor
mal
ized
abs
orpt
ion
(a.u
.)
Photon energy (eV)Photon energy (eV)280 285 290 295 300 305 310280 285 290 295 300 305 310
Photon energy (eV)280 285 290 295 300 305 310
(a) Nandi forest, Kenya (b) Kakamega forest, Kenya (c) Grassland, South Africa
Fig. 6 Stacked C (1s) spectra of humic fractions from the long-term chronosequences of Kenya (Nandi and Kakamega) and South Africa.
526 D . S O L O M O N et al.
r 2007 The AuthorsJournal compilation r 2007 Blackwell Publishing Ltd, Global Change Biology, 13, 511–530

dations of phenylpropane unit of lignin structures with
time, and (ii) the continual aromatization and aliphati-
zation of the SOC possibly due to accumulation of a
wide variety of recalcitrant H- and C-substituted aryl-C
structures and aliphatic components such as (poly)-
methylene units during the decomposition process fol-
lowing long-term anthropogenic perturbations. These
observations complement the results obtained by ele-
mental analysis, as well as by 13C NMR and Sr-FTIR-
ATR spectroscopic techniques.
Relationship of C functionalities identified by the differentspectroscopic techniques
Although C (1s) NEXAFS spectroscopy has been used
to fingerprint the molecular structures of extremely
heterogeneous organic compounds, such as humic frac-
tions (Rothe et al., 2000; Scheinost et al., 2001; Schafer
et al., 2005; Solomon et al., 2005b) as well as for probing
surficial (Jokic et al., 2003) and spatial (Lehmann et al.,
2005) C functional group heterogeneity of mineral soils
and black C particles, respectively, only a few studies
have investigated the relationships between C forms
identified by C K-edge NEXAFS and 13C NMR spectro-
scopy (Scheinost et al., 2001; Schafer et al., 2003; Solomon
et al., 2005b). The correlations between organic C func-
tional groups identified by C (1s) NEXAFS and Sr-FTIR-
ATR spectroscopy of humic fractions had not yet been
assessed at all until now. Hence, we investigated the
relationships between organic C functional groups ob-
tained from NEXAFS band areas and values of the
corresponding C functionalities obtained from 13C
NMR and Sr-FTIR-ATR spectroscopy. Despite wide
range of origin and chemical heterogeneity of the humic
fractions, the results of C (1s) NEXAFS spectra decon-
volution procedure compared very well with the results
of the 13C NMR spectroscopy. We found positive corre-
lation for aromatic-C (quinone and aromatic C vs. H-
and C-substituted aryl-C, r 5 0.72), phenolic-C (pheno-
lic-C vs. methoxyl-C and O-substituted aryl-C, r 5 0.88),
aliphatic-C (aliphatic-C vs. alkyl-C, r 5 0.70), car-
boxylic-C (carboxylic-C vs. carbonyl-C, r 5 0.65) and
O-alkyl-C (r 5 0.63) band areas identified by the C (1s)
NEXAFS and 13C NMR spectroscopy, respectively.
These values are lower than the values reported for
aromatic-C (r 5 0.91), phenolic-C (r 5 0.98), aliphatic-C
(r 5 0.99) and carbonyl-C (r 5 0.95) by Schafer et al.
(2003) for fulvic acid samples extracted from ground
water, but compare very well with the values reported
from humic fractions extracted from subhumid tropical
highland forest soils by Solomon et al. (2005b). Similarly,
we observed positive correlations between the organic
C functional groups identified by C (1s) NEXAFS and
Sr-FTIR-ATR spectroscopy (r 5 0.70 for aromatic-C
(i.e. quinone and aromatic C vs. aromatic-C); r 5 0.45
for phenolic-C; r 5 0.42 for aliphatic-C (i.e. aliphatic-C
vs. asymmetric and symmetric aliphatic-C (CH3 and
CH2) stretching and aliphatic (C–H) deformation of
CH2 or CH3 groups); r 5 0.67 for carboxylic-C and
r 5 0.62 for O-alkyl-C (i.e. O-alkyl-C vs. polysacchar-
ide-C), respectively. Our findings show that the char-
acteristic band positions of NEXAFS spectra were
sufficiently separated to allow discrimination of organic
C functional groups using the deconvolution method.
Therefore, it is possible to suggest that C K-edge NEX-
AFS spectroscopy is a useful technique not only for
detecting C functionalities originating from heteroge-
neous organic matter sources but also to follow qualita-
tively and semiquantitatively the long-term molecular
level structural dynamics of SOC following net C loss
from soils due to anthropogenic perturbations. The
results of our investigation provide clear evidence that
the different spectroscopic techniques used in the pre-
sent investigation have variable degrees of sensitivity
for the different organic C functionalities. Although the
general trends and patterns were similar, these techni-
ques detect the impact of human-induced changes in
SOC species to a different extent. Hence, it is imperative
to use a suite of complimentary spectroscopic techni-
ques in an integrated manner to accurately fingerprint
the structural composition of SOC and to critically
assess the long-term impacts of human-induced land-
use and land-cover changes on the speciation and
structural chemistry SOC to provide process-oriented
data for global C and ecosystem models.
Conclusions
Our study clearly demonstrated that human-induced
long-term land-use and land-cover changes clearly per-
turbed the soil ecosystem and led to an exponential
depletion of up to 85% of the original organic C and N
from the surface soils, thereby reducing the soil quality
and the potentials of these native tropical and subtro-
pical highland ecosystems to serve as C sinks. A sig-
nificant proportion of total depletion occurred during
the first 4 years of conversion indicating that these
forest- and grassland-derived soils contain large
amounts of labile SOM, potentially very vulnerable to
degradation upon human-induced land-use and land-
cover changes. We observed variable response to hu-
man intervention in the ecosystems investigated,
whereby transitions from natural forest to agriculture
lost higher proportions of SOC and N concentrations
compared to conversions from native grasslands to
arable cropping. The magnitude of changes observed
from these tropical and subtropical highland soils were
S P E C I A T I O N A N D D Y N A M I C S O F O R G A N I C C A R B O N 527
r 2007 The AuthorsJournal compilation r 2007 Blackwell Publishing Ltd, Global Change Biology, 13, 511–530

much larger than the values reported in other temperate
and tropical soils.
Using elemental analysis and integrated spectro-
scopic techniques (13C NMR, Sr-FTIR-ATR and C (1s)
NEXAFS spectroscopy), we were able to effectively
fingerprint the structural composition of SOC in the
humic fractions and provided unequivocal evidence
that anthropogenic perturbations changed not only the
sink capacity of soils through net C flux, but also
considerably altered the inherent structural composi-
tion of the remaining SOC. These molecular level com-
positional changes were manifested by: (i) the
continued degradation and loss of O-alkyl and acetal-
C structures such as those found in carbohydrates and
holocellulose (cellulose and hemicellulose), some labile
aliphatic functionalities and side-chain oxidations of
phenylpropane unit of lignin structures, and (ii) by
continued aromatization and aliphatizaton of the humic
fractions possibly through selective accumulation of a
wide variety of H- and C-substituted aryl-C structures
and recalcitrant aliphatic components such as (poly)-
methylene units, respectively, following enhanced de-
composition process. These changes appeared as early
as the fourth year after anthropogenic interventions,
and their intensity for the most part continued to
increase with duration of cultivation until a new quasi-
equilibrium was approached after 20 years. However,
subtle but persistent changes in SOC functional group
chemistry of the resultant SOM continued long after a
steady state had been approached. These changes in the
inherent molecular structures of the SOM may exert
considerable influence on biogeochemical cycling of C
and bioavailability of essential nutrients present in
association with SOM as part of complex organic bio-
molecules, and may significantly affect the sustainabil-
ity of agriculture, as well as potentials of the soils to
sequester C in these tropical and subtropical agroeco-
systems. Our investigation also clearly highlighted the
potentials and shortcomings of the state-of the art
spectroscopic analytical tools employed to investigate
the functional group level changes in SOC, and stressed
the importance of method integration to critically assess
the impacts of human-induced land-use and land-cover
changes on speciation and structural composition of
SOC to provide process-oriented data for global C and
ecosystem models.
Acknowledgements
This study was financially supported by grants from the Na-tional Research Initiative of the USDA-CSREES (2002-35107-122269), the Biocomplexity Initiative of the NSF (BCS-0215890)and the Division of Environmental Biology of the NSF undercontract DEB-0425995. We thank du Preez C. C for his support in
South Africa and Jacobsen C, Wirick S, Miller L and Smith R fortheir support during the spectroscopic analyses. C (1s) NEXAFSspectra were collected at the NSLS, Brookhaven National La-boratory using X-1A1 support the NSF (DBI-9605045) and USDOE (DE-FG02-89ER60858). Sr-FTIR-ATR spectra were collectedat U10B beamline of the NSLS which is supported by the USDOE (DE-AC02-98CH10886).
References
Ade H, Urquhart SG (2002) NEXAFS Spectroscopy and micro-
scopy of natural and synthetic polymers. In: Chemical Applica-
tions of Synchrotron Radiation, Advanced Series in Physical
Chemistry, Vol. 12 (ed. Sham TK), pp. 285–355. World Scientific
Publishing, River Edge, NJ.
Agbenin JO, Adeniyi T (2005) The microbial biomass properties
of a savanna soil under improved grass and legume pastures
in northern Nigeria. Agriculture, Ecosystems & Environment,
109, 245–254.
Baldock JA, Oades JM, Nelson PN et al. (1997) Assessing the
extent of decomposition of natural organic materials using
solid-state 13C NMR spectroscopy. Australian Journal of Soil
Research, 35, 1061–1083.
Batjes NH (1996) Total carbon and nitrogen in the soils of the
world. European Journal of Soil Science, 47, 151–163.
Bechtold JS, Naiman RJ (2006) Soil texture and nitrogen miner-
alization potential across a riparian toposequence in a semi-
arid savanna. Soil Biology and Biochemistry, 38, 1325–1333.
Bowman RA, Reeder JD, Lober RW (1990) Changes in soil
properties in a central plains rangeland soil after 3, 20 and
60 years of cultivation. Soil Science, 150, 851–857.
Brodowski S, Amelung W, Lobe I et al. (2004) Losses and
biogeochemical cycling of soil organic nitrogen with pro-
longed arable cropping in the South African Highveld-evi-
dence from D- and L-amino acids. Biogeochemistry, 71, 17–42.
Cody GD, Ade H, Wirick S et al. (1998) Determination of
chemical–structural changes in vitrinite accompanying lumi-
nescence alteration using C-NEXAFS analysis. Organic
Geochemistry, 28, 441–455.
Dalal RC, Mayer RJ (1986a) Long term trends in fertility of soils
under continuous cultivation and cereal cropping in southern
Queensland. II. Total organic carbon and its rate of loss from
the soil profile. Australian Journal of Soil Research, 24, 281–292.
Dalal RC, Mayer RJ (1986b) Long term trends in fertility of soils
under continuous cultivation and cereal cropping in southern
Queensland. V. Rate of loss of total nitrogen from the soil
profile and changes in carbon: nitrogen ratios. Australian
Journal of Soil Research, 24, 493–504.
Davidson EA, Ackerman IL (1993) Changes in soil carbon
inventories following cultivation of previously untilled soils.
Biogeochemistry, 20, 161–193.
Dieckow J, Mielniczuk J, Knicker H et al. (2005) Composition of
organic matter in a subtropical Acrisol as influenced by land
use, cropping and N fertilization, assessed by CPMAS 13C
NMR spectroscopy. European Journal of Soil Science, 56, 705–715.
Eswaran H, Den Berg EV, Reich P (1993) Organic carbon in soils
of world. Soil Science Society of American Journal, 57, 192–194.
FAO-UNESCO (1997) Soil Map of the World, Revised Legend. ISRIC,
Wageningen.
528 D . S O L O M O N et al.
r 2007 The AuthorsJournal compilation r 2007 Blackwell Publishing Ltd, Global Change Biology, 13, 511–530

Gleixner G, Poirier N, Bol R et al. (2002) Molecular dynamics of
organic matter in a cultivated soil. Organic Geochemistry, 33,
357–366.
Golchin A, Clarke P, Oades JM et al. (1995) The effects of culti-
vation on the composition of organic matter and structural
stability of soils. Australian Journal of Soil Research, 33, 975–993.
Goncalves CN, Dalmolin RSD, Dick DP et al. (2003) The effect
of 10% HF treatment on the resolution of CPMAS 13C NMR
spectra and on the quality of organic matter in Ferralsols.
Geoderma, 116, 373–392.
Guggenberger G, Frey SD, Six J et al. (1999) Bacterial and fungal
cell-wall residues in conventional and no-tillage agroecosys-
tems. Soil Science Society of America Journal, 63, 1188–1198.
Guo LB, Gifford RM (2002) Soil carbon stocks and land use
change: a meta analysis. Global Change Biology, 8, 345–360.
Haas HJ, Evans CE, Miles EF (1957) Nitrogen and carbon changes
in Great Plains soils as influenced by cropping and soil treatments.
Technical Bulletin of the United States Department of
Agriculture, No. 1164, US Government Printing Office,
Washington, DC.
Hatcher PG, Dria KJ, Kim S et al. (2001) Modern analytical
studies of humic substances. Soil Science, 166, 770–794.
Houghton RA (1999) The annual net flux of carbon to the
atmosphere from changes in land use 1850–1990. Tellus, 51B,
298–313.
IPCC (2001) Climate Change 2001: The Scientific Basis, Contribution
of Working Group I to the Third Assessment Report of the Inter-
governmental Panel on Climate Change (eds Houghton JT, Ding
Y, Griggs DJ et al.), Cambridge University Press, Cambridge.
Jenkinson DS, Rayner JH (1977) The turnover of soil organic
matter in some of the Rothamsted classical experiments. Soil
Science, 123, 298–305.
Jokic A, Cutler JN, Ponomarenko E et al. (2003) Organic carbon
and sulfur compounds in wetland soils: insights on structure
and transformation processes using K-edge XANES and NMR
spectroscopy. Geochimica et Cosmochimica Acta, 67, 2585–2597.
Kim JI, Buckau G, Li GH et al. (1990) Characterization of humic
and fulvic acids from Gorleben groundwater. Fresenius Journal
of Analytical Chemistry, 338, 245–252.
Krull ES, Bestland EA, Gates WP (2002) Soil organic matter
decomposition and turnover in a tropical Ultisol: evidence
from d13C, d15N and geochemistry. Radiocarbon, 44, 93–112.
Kogel-Knabner I (2000) Analytical approaches for characterizing
soil organic matter. Organic Geochemistry, 31, 609–625.
Kogel-Knabner I (2002) The macromolecular organic composi-
tion in plant and microbial residues as input to soil. Soil Biology
and Biochemistry, 34, 139–162.
Lal R (2003) Global potential of soil C sequestration to mitigate
the greenhouse effect. Critical Reviews in Plant Sciences, 22,
151–184.
Lehmann J, Liang BQ, Solomon D et al. (2005) Near-edge X-ray
absorption fine structure (NEXAFS) spectroscopy for mapping
nano-scale distribution of organic carbon forms in soil: appli-
cation to black carbon particles. Global Biogeochemical Cycles,
19, GB1013, doi: 10.1029/2004GB002435.
Lemenih M, Itanna F (2004) Soil carbon stocks and turnovers in
various vegetation types and arable lands along an elevation
gradient in southern Ethiopia. Geoderma, 123, 177–188.
Lobe I, Amelung W, Du Preez CC (2001) Losses of carbon and
nitrogen with prolonged arable cropping from sandy soils of
the South African Highveld. European Journal of Soil Science, 52,
93–101.
Lobe I, Du Preez CC, Amelunga W (2002) Influence of prolonged
arable cropping on lignin compounds in sandy soils of the
South African Highveld. European Journal of Soil Science, 53,
553–562.
Martens DA, Reedr TE, Lewis DT (2003) Soil organic C content
and composition of 130-year crop, pasture and forest land-use
managements. Global Change Biology, 10, 65–78.
Martin D, Srivastava PC, Ghosh D et al. (1998) Characteristics
of humus substances in cultivated and natural forest soils of
Sikkim. Geoderma, 84, 345–362.
McDonagh J, Birch-Thomsen T, Magid J (2001) Soil organic
matter decline and compositional change associated with
cereal cropping in Southern Tanzania. Land Degradation and
Development, 12, 13–26.
McDonnell RM, Holden NM, Ward SM et al. (2001) Character-
istics of humic substances in heathland and forested peat soils
of the Wicklow mountains. Biology and Environment: Proceed-
ings of the Royal Irish Academy, 101B, 187–197.
Michelsen A, Andersson M, Jensen M et al. (2005) Carbon stocks,
soil respiration and microbial biomass in fire-prone tropical
grassland, woodland and forest ecosystems. Soil Biology and
Biochemistry, 36, 1707–1717.
Moller A, Kaiser K W, Amelung C et al. (2000) Forms of organic
C and P extracted from tropical soils as assessed by liquid-
state 13C- and 31P-NMR spectroscopy. Australian Journal of Soil
Research, 38, 1017–1035.
Nye PH, Greenland DJ (1964) Changes in the soil after clearing
tropical forest. Plant and Soil, 21, 101–112.
Nziguheba G, Merckx R, Palm CA (2005) Carbon and nitrogen
dynamics in a phosphorus-deficient soil amended with or-
ganic residues and fertilizers in western Kenya. Biology and
Fertility of Soils, 41, 240–248.
Piccolo A, Conte P, Spaccini R et al. (2004) Influence of land
use on the characteristics of humic substances in some
tropical soils of Nigeria. European Journal of Soil Science, 56,
343–352.
Perez MG, Martin-Neto L, Saab SC et al. (2004) Characterization
of humic acids from a Brazilian Oxisol under different tillage
systems by EPR, 13C NMR, FTIR and fluorescence spectro-
scopy. Geoderma, 118, 181–190.
Rice JA (2001) Humin. Soil Science, 166, 848–857.
Rothe J, Denecke MA, Dardenne K (2000) Soft X-Ray spectro-
microscopy investigation of the interaction of aquatic humic
acid and clay colloids. Journal of Colloid and Interface Science,
231, 91–97.
Scheffer F, Schachtschabel P (2002) Lehrbuch der Bodenkunde, 15
Aufl. Spektrum Akademischer Verlag, Heidelberg, Berlin.
Scheinost AC, Kretzschmar R, Christl I et al. (2001) Carbon group
chemistry of humic and fulvic acid: a comparison of C-1s
NEXAFS and 13C-NMR spectroscopies. In: Humic Substances:
Structures, Models and Functions (eds Ghabbour EA, Davies G),
pp. 39–47. Royal Society of Chemistry, Gateshead, UK.
Schlesinger WH (1997) Biogeochemistry: An Analysis of Global
Change. Academic Press, San Diego.
S P E C I A T I O N A N D D Y N A M I C S O F O R G A N I C C A R B O N 529
r 2007 The AuthorsJournal compilation r 2007 Blackwell Publishing Ltd, Global Change Biology, 13, 511–530

Schnitzer M (1982) Organic matter characterization. In: Methods
of Soil Analysis. Part 2. Chemical and Microbiological Properties,
2nd edn (eds Page AL, Miller RH, Keeney DR), pp. 581–594.
American Society of Agronomy, Madison, WI.
Schnitzer M, Khan SU (1978) Soil Organic Matter. Elsevier, New
York.
Schafer T, Buckau G, Artinger R et al. (2005) Origin and mobility
of fulvic acids in the Gorleben aquifer system: implications
from isotopic data and carbon/sulfur XANES. Organic Geo-
chemistry, 36, 567–582.
Schafer T, Hertkorn N, Artinger R et al. (2003) Functional group
analysis of natural organic colloids and clay association
kinetics using C (1s) spectromicroscopy. Journal de Physique
IV France, 104, 409–412.
Skjemstad JO, Dalal RC (1987) Spectroscopic and chemical differ-
ences in organic matter of two Vertisols subjected to long periods
of cultivation. Australian Journal of Soil Research, 25, 323–335.
Skjemstad JO, Dalal RC, Janik LJ et al. (2001) Changes in chemical
nature of soil organic carbon in Vertisols under wheat in
south-eastern Queensland. Australian Journal of Soil Research,
39, 343–359.
Skjemstad JO, Frost RL, Barron PF (1983) Structural units in
humic acids from south-eastern Queensland soils as deter-
mined by 13C-NMR spectroscopy. Australian Journal of Soil
Research, 21, 539–547.
Smernik RJ, Oades JM (2002) Paramagnetic effects on solid state
carbon-13 nuclear magnetic resonance spectra of soil organic
matter. Journal of Environmental Quality, 31, 414–420.
Solomon D, Fritzsche F, Tekalign M et al. (2002) Soil organic
matter composition in the subhumid Ethiopian highlands
as influenced by deforestation and agricultural management.
Soil Science Society of America Journal, 66, 68–82.
Solomon D, Lehmann J, Kinyangi J et al. (2005b) Carbon K-edge
NEXAFS and FTIR-ATR spectroscopic investigation of organic
carbon speciation in soils. Soil Science Society of America Journal,
69, 107–119.
Solomon D, Lehmann J, Lobe I et al. (2005a) Speciation of sulphur
in subtropical soils: evidence from degradative wet-chemical
analysis and S K-edge XANES. European Journal of Soil Science,
56, 621–634.
Solomon D, Lehmann J, Zech W (2000) Land use effects on soil
organic matter properties of chromic Luvisols in the semiarid
tropics: carbon, nitrogen, lignin and carbohydrates. Agriculture
Ecosystems and Environment, 78, 203–213.
Stevenson FJ (1982) Humus Chemistry: Genesis, Composition, Reac-
tions. Wiley, New York.
Sumann M, Amelung W, Haumaier L et al. (1998) Climatic
effects on soil organic phosphorus in the North American
Great Plains identified by phosphorus-31 nuclear magnetic
resonance. Soil Science Society of America Journal, 62, 1580–
1586.
Sutton R, Sposito G (2005) Molecular structure in soil humic
substances: the new view. Environmental Science and Technology,
39, 9009–9015.
Zech W, Senesi N, Guggenberger G et al. (1997) Factors control-
ling humification and mineralization of soil organic matter in
the tropics. Geoderma, 79, 117–161.
Zhang X, Amelung W, Yuan Y et al. (1999) Land-use effects on
amino sugars in particle size fractions of an Argiudoll. Applied
Soil Ecology, 11, 271–275.
Zingore S, Manyame C, Nyamugafata P et al. (2005) Long-term
changes in organic matter of woodland soils cleared for arable
cropping in Zimbabwe. European Journal of Soil Science, 56,
727–736.
530 D . S O L O M O N et al.
r 2007 The AuthorsJournal compilation r 2007 Blackwell Publishing Ltd, Global Change Biology, 13, 511–530