A Fracture Mechanics Approach to Durability Calculations For
11
INTRODUCTION Adhesive bonding is increasingly used in the development of lightweight vehicle bodies. In addition to improving structural rigidity, it provides a means of joining high strength steels, aluminium alloys and dissimilar materials, with good durability against fatigue compared to more traditional methods (spot-welding and seam-welding). As with any manufacturing technology, if full advantage is to be taken of its benefits, analytical methods are required in order to be able to evaluate and optimize the durability of the resulting structure. Without these analytical methods, and in an environment where development times are very short, release of product with unnecessary over-design and/or unquantified safety factors is inevitable. Ideally, adhesive joints should be designed so that they are loaded primarily in shear (rather than peel or cleavage modes), and in addition to having a uniform thin layer of adhesive, fillets are highly desirable in order to minimize stress concentrations at the periphery of the joint. In contrast, adhesive joints in mass-produced automotive vehicle bodies will in general experience complex loadings including elements of shear and peel, and may be underfilled (primarily for cosmetic reasons). Under sufficient static or cyclic loading, such joints are likely to fail by crack propagation through the joint. Cracks may be interfacial or cohesive, or a 2012-01-0731 Published 04/16/2012 Copyright © 2012 SAE International doi: 10.4271/2012-01-0731 saematman.saejournals.org A Fracture Mechanics Approach to Durability Calculations for Adhesive Joints Peter Heyes HBM UK, Ltd. Gunnar Björkman Volvo Technology Andrew Blows and Tim Mumford Jaguar/Land Rover Cars Paul Briskham Coventry University ABSTRACT Effective use of adhesive bonding in automotive vehicle bodies requires analytical methods for durability, so that potential fatigue problems and unnecessary overdesign may be eliminated before the physical prototype stage and release of product with unquantified safety factors avoided. This paper describes a fracture mechanics-based method for predicting the durability of adhesive joints, based on work previously carried out at Volvo [ 1]. The method requires relatively modest modifications to a typical vehicle body FE mesh. Adhesive bonds are represented by bar elements around the periphery of each bond. Grid point forces from shell elements adjacent to the adhesive bond are recovered and used to determine line forces and moments at the edge of the glued flange. These forces and moments are then transferred to an analytical sandwich model of the joint. This enables approximate calculations of the strain energy release rate (or rather the equivalent J-integral) to be made for assumed small cracks at the edge of the adhesive. Analytical results are compared with calculations based on detailed FE meshes for typical test specimen geometries, and with physical test data. J-integral values calculated for different geometries and loadings are shown to be able to correlate the durability of joints, particularly at longer lives, enabling useful estimations of joint durability to be made. CITATION: Heyes, P., Björkman, G., Blows, A., Mumford, T. et al., "A Fracture Mechanics Approach to Durability Calculations for Adhesive Joints," SAE Int. J. Mater. Manf. 5(1):2012, doi:10.4271/2012-01-0731. ____________________________________ 215 Downloaded from SAE International by Vellore Inst of Technology, Thursday, January 09, 2014 10:35:22 PM
-
Upload
kashish-rathod -
Category
Documents
-
view
41 -
download
3
description
fracture
Transcript of A Fracture Mechanics Approach to Durability Calculations For
INTRODUCTIONAdhesive bonding is increasingly used in the development
of lightweight vehicle bodies. In addition to improvingstructural rigidity, it provides a means of joining highstrength steels, aluminium alloys and dissimilar materials,with good durability against fatigue compared to moretraditional methods (spot-welding and seam-welding). Aswith any manufacturing technology, if full advantage is to betaken of its benefits, analytical methods are required in orderto be able to evaluate and optimize the durability of theresulting structure. Without these analytical methods, and inan environment where development times are very short,
release of product with unnecessary over-design and/orunquantified safety factors is inevitable.
Ideally, adhesive joints should be designed so that theyare loaded primarily in shear (rather than peel or cleavagemodes), and in addition to having a uniform thin layer ofadhesive, fillets are highly desirable in order to minimizestress concentrations at the periphery of the joint. In contrast,adhesive joints in mass-produced automotive vehicle bodieswill in general experience complex loadings includingelements of shear and peel, and may be underfilled (primarilyfor cosmetic reasons). Under sufficient static or cyclicloading, such joints are likely to fail by crack propagationthrough the joint. Cracks may be interfacial or cohesive, or a
2012-01-0731Published 04/16/2012
Copyright © 2012 SAE Internationaldoi:10.4271/2012-01-0731saematman.saejournals.org
A Fracture Mechanics Approach to Durability Calculations forAdhesive Joints
Peter HeyesHBM UK, Ltd.
Gunnar BjörkmanVolvo Technology
Andrew Blows and Tim MumfordJaguar/Land Rover Cars
Paul BriskhamCoventry University
ABSTRACTEffective use of adhesive bonding in automotive vehicle bodies requires analytical methods for durability, so that
potential fatigue problems and unnecessary overdesign may be eliminated before the physical prototype stage and releaseof product with unquantified safety factors avoided.
This paper describes a fracture mechanics-based method for predicting the durability of adhesive joints, based on workpreviously carried out at Volvo [1]. The method requires relatively modest modifications to a typical vehicle body FEmesh. Adhesive bonds are represented by bar elements around the periphery of each bond. Grid point forces from shellelements adjacent to the adhesive bond are recovered and used to determine line forces and moments at the edge of theglued flange. These forces and moments are then transferred to an analytical sandwich model of the joint. This enablesapproximate calculations of the strain energy release rate (or rather the equivalent J-integral) to be made for assumed smallcracks at the edge of the adhesive. Analytical results are compared with calculations based on detailed FE meshes fortypical test specimen geometries, and with physical test data. J-integral values calculated for different geometries andloadings are shown to be able to correlate the durability of joints, particularly at longer lives, enabling useful estimations ofjoint durability to be made.
CITATION: Heyes, P., Björkman, G., Blows, A., Mumford, T. et al., "A Fracture Mechanics Approach to DurabilityCalculations for Adhesive Joints," SAE Int. J. Mater. Manf. 5(1):2012, doi:10.4271/2012-01-0731.
____________________________________
215
Downloaded from SAE International by Vellore Inst of Technology, Thursday, January 09, 2014 10:35:22 PM

mixture of these failure modes may occur, depending onfactors such as the choice of adhesive, surface pretreatmentand surface cleanliness prior to adhesive application. SeeFigure 1.
Figure 1. Adhesive joints: Figure 1(b) is more typical ofan automotive vehicle body.
This paper describes a method for evaluating thedurability of such adhesive joints in vehicle bodies, based onwork previously carried out at Volvo by Björkman [1]. It isbased on the following premises:
• Because of the nature of the joints and their manufacturingprocess, their durability is best described using a fracturemechanics approach.
• Stress intensity factors are not particularly useful for cracksin inhomogeneous bodies such as an adhesive joint, or forinterfacial cracks. The loading on a crack is thereforeevaluated using the strain energy release rate, or rather sincewe are considering only limited plasticity around the cracktip, we can use the equivalent J-integral.
• Any calculations must be capable of being carried out on atypical body durability model, with minor modifications only.In the body CAE process, detailed FE modelling of the typenormally used to carry out J-integral calculations is out of thequestion, so an approximate method is required.
• Several factors conspire against making accurate lifeestimations - the imprecise nature of the manufacturingprocess, rather flat SN curves (steep crack growth curves) forthe adhesive, and the fact that the J-integral is a scalarquantity. For this reason, in the interests of making someuseful calculations, the method described here is limited tothe determination of maximum J-integral values andcomparison with a threshold value. Finite life predictions arenot attempted.
The calculation process is illustrated in Figure 2.
Figure 2. Summary of calculation process
The basic steps of the method are as follows:
1. A global finite element analysis of the structure iscarried out. A simple, relatively coarse representation of thejoints is used in which beam elements represent the adhesivejoining the flanges.
2. Line forces and moments along the edges of theflanges are derived from the FE results, combined withapplied loading histories.
3. The line forces and moments are applied to ananalytical “sandwich” model of the bonded flange, and usedto calculate the strain energy release rate G (actually the J-integral) based on an initial small crack in the adhesive.
4. At each point along the edge of the flange, thecalculated maximum J-integral during the loading history iscompared to the threshold required for crack growth Gth todetermine whether or not the joint is likely to fail.
The method does not calculate fatigue life, but in additionto the maximum value of the J-integral for a given flaw size,an estimated reserve factor may be calculated.
THEORETICAL BACKGROUNDMODELLING GUIDELINES AND FEANALYSIS
FE models for adhesive joint durability calculationsrequire only minor changes from typical automotive bodymodels. The modelling guidelines may be summarized asfollows:
• Models should be created using linear shell elementspositioned at the mid-planes of the sheet metal parts.
Heyes et al / SAE Int. J. Mater. Manf. / Volume 5, Issue 1(April 2012)216
Downloaded from SAE International by Vellore Inst of Technology, Thursday, January 09, 2014 10:35:22 PM

• Each adhesive bond should be represented by beamelements around the periphery of the bond, connecting theshell meshes of the joined parts. Typically beams will have a5mm circular cross-section, with modulus 3000 MPa andPoisson ratio 0.4.
• Bonded flanges require more or less congruent and parallelmeshes so that the beams are normal to the flanges.
• Beam elements should be as close as possible to theposition of the edge of the adhesive in the bond, which meansthat ideally the bend radius adjacent to the joint is representedby at least one row of shell elements as in the “preferred”method illustrated in Figure 3.
Figure 3. Mesh cross section - preferred modellingpractice.
Any offset between the position of the beam elements andthe actual edge of the adhesive (e.g. if the “acceptable”method in Figure 3 is used) will result in errors in the forcesand particularly the bending moments at the edge of the joint.The method compensates for this when it estimates thebending moments at the crack tip, but any offset should beminimized for best accuracy.
The purpose of the FE analysis is to provide informationthat can be used to derive time-histories of the J-integral for asmall crack at various points along the edge of the adhesivebond. An intermediate step is the derivation of time-historiesof force and moment per unit length (line forces andmoments) applied to the “sandwich” (flanges plus adhesive)by the adjacent elements. These time histories can begenerated by linear superposition (e.g. by combining staticunit loadcase results and corresponding load-time histories),direct from FE time-steps, or from a transient analysis,whether a direct transient or using a modal superpositionapproach. In any case, the data required from the FE analysisare the nodal forces and moments from the shell elementsadjacent to the flanges.
At each calculation point, the nodal forces and momentsin the shells adjacent to the bonded joint are used todetermine line forces and moments on the upper and lowerelements of the joint, in a local co-ordinate system.
Figure 4. Calculation points and local co-ordinatesystem
The method for determination of the line forces andmoments is based on that originally proposed by Fermér et al[2] for determination of structural stresses at the toe of aseamweld, and refined by Heyes in nCode DesignLife [3].
J-INTEGRAL CALCULATIONThe concept of using a sandwich model to calculate J-
integrals and predict fracture has been described by Fernlundet al [4]. This idea was developed further by Björkman [1],working at Volvo, who extended its application bytransferring loads from a shell model, and critically,improved the accuracy of the calculation through theintroduction of a distortion term, as outlined below.
The basic premise of the method is that the strain energyrelease rate G associated with a small crack in the peripheryof an adhesive bonded joint in a vehicle body can bedetermined by transferring the line forces and moments alongthe edge of the representation of the bond in a shell FE modelof the body to an anlytical “sandwich” model of the joint,which is used to calculate G. In practice, what is actuallycalculated is the equivalent path-independent J-integral asdescribed by Rice [5]. There are two assumptions implicithere:
1. In order for the strain energy release rate G to beequivalent to the J-integral, any yielding must be limited to asmall region around the crack tip. This is reasonable when
Heyes et al / SAE Int. J. Mater. Manf. / Volume 5, Issue 1(April 2012) 217
Downloaded from SAE International by Vellore Inst of Technology, Thursday, January 09, 2014 10:35:22 PM
considering the endurance domain; widespread plasticitywould give rise to low-cycle fatigue failure.
2. Cracks are not large enough to cause significant re-distribution of load around the adhesive joints.
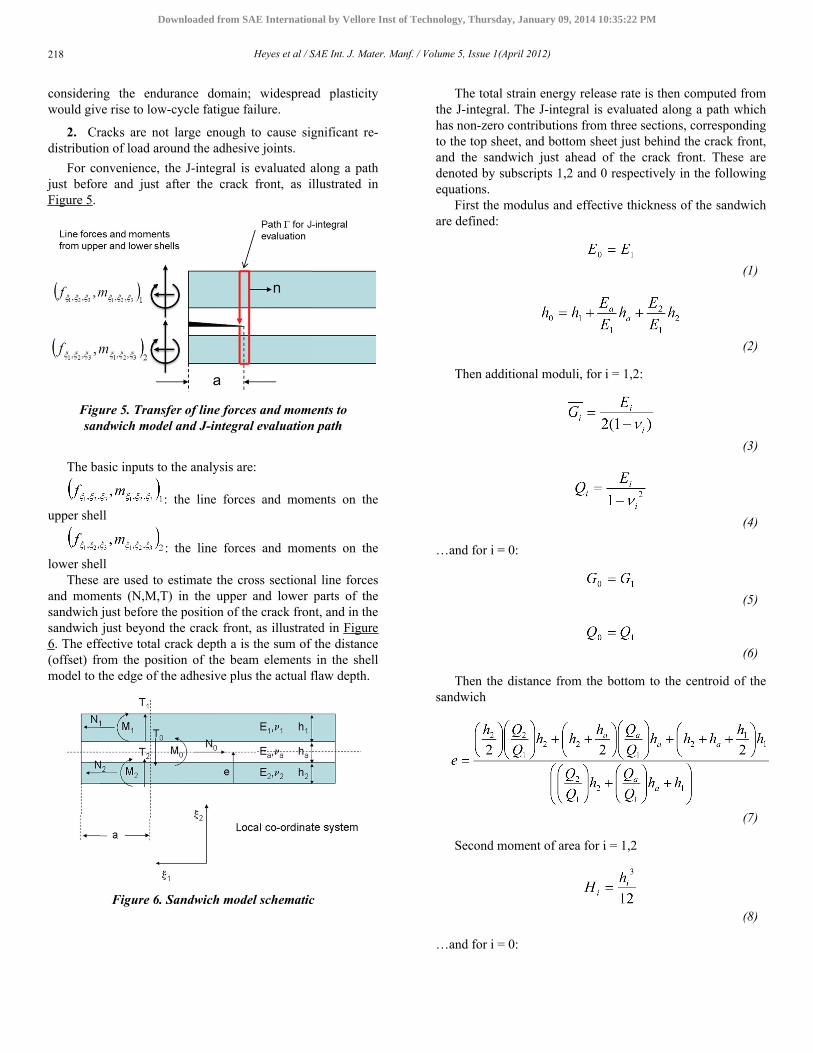
For convenience, the J-integral is evaluated along a pathjust before and just after the crack front, as illustrated inFigure 5.
Figure 5. Transfer of line forces and moments tosandwich model and J-integral evaluation path
The basic inputs to the analysis are:
: the line forces and moments on theupper shell
: the line forces and moments on thelower shell
These are used to estimate the cross sectional line forcesand moments (N,M,T) in the upper and lower parts of thesandwich just before the position of the crack front, and in thesandwich just beyond the crack front, as illustrated in Figure6. The effective total crack depth a is the sum of the distance(offset) from the position of the beam elements in the shellmodel to the edge of the adhesive plus the actual flaw depth.
Figure 6. Sandwich model schematic
The total strain energy release rate is then computed fromthe J-integral. The J-integral is evaluated along a path whichhas non-zero contributions from three sections, correspondingto the top sheet, and bottom sheet just behind the crack front,and the sandwich just ahead of the crack front. These aredenoted by subscripts 1,2 and 0 respectively in the followingequations.
First the modulus and effective thickness of the sandwichare defined:
(1)
(2)
Then additional moduli, for i = 1,2:
(3)
(4)
…and for i = 0:
(5)
(6)
Then the distance from the bottom to the centroid of thesandwich
(7)
Second moment of area for i = 1,2
(8)
…and for i = 0:
Heyes et al / SAE Int. J. Mater. Manf. / Volume 5, Issue 1(April 2012)218
Downloaded from SAE International by Vellore Inst of Technology, Thursday, January 09, 2014 10:35:22 PM

(9)
The distortion (slope) of the beam elements makes asignificant contribution to the strain energy release rate, andhence the J-integral. The rotation of the beam cross sectionsis estimated from:
(10)
for i=1,2, and
(11)
The slope constants K are empirical functions of the sheetand adhesive thicknesses and moduli. For the current work,these functions have been determined based on analyticalexperiments with sheet thicknesses between 1 and 3 mm forsteel and aluminium sheets.
Now we can calculate the J-integral
(12)
and finally
(13)
SOFTWARE IMPLEMENTATIONThe method described in the previous section has been
implemented in the fatigue analysis software package nCodeDesignLife. This allows the user to create an analysisprocess, within a graphical user interface, that can estimatethe J-integral as a function of time for small cracks at pointsall along the edge of adhesive bonds defined in a finiteelement model. Loadings can be defined by linearsuperposition of static loading cases, by direct or modaltransient calculations, or as a duty cycle comprising any
combination of these loading types. The output from theanalysis is the maximum value of the J-integral at eachcalculation point over the period of loading. The result isassigned to adjacent elements for ease of post-processing.The full time-history of the J-integral may also be recoveredif required.
In addition, an estimated reserve factor, based on the ratioof Jmax and the threshold strain energy release rate Gth mayalso be calculated. Since J and G scale as the square of theapplied load, the reserve factor has been defined as follows:
(14)
A simple analysis process is illustrated in Figure 7 below:
Figure 7. Simple analysis process in nCodeDesignLife, based on coach-peel test specimen
VALIDATIONThe validation of the method was carried out in two
stages:
1. The ability of the method to calculate J-integrals on thebasis of grid point forces recovered from a coarse FE modelwas tested against conventional fracture mechanicscalculations using a fine FE mesh.
2. The usefulness of the J-integral as a means ofcorrelating the durability of various adhesive joints wasevaluated using physical test data.
J-INTEGRAL CALCULATIONThe J-integral calculation was validated by comparing
values calculated using the approximate method of Björkman,based on simple structural models, with results computedusing ABAQUS models with detailed FE meshes. Thegeometries chosen are those of the simple lap-shear andcoach-peel specimens used in the fatigue test program. The
Heyes et al / SAE Int. J. Mater. Manf. / Volume 5, Issue 1(April 2012) 219
Downloaded from SAE International by Vellore Inst of Technology, Thursday, January 09, 2014 10:35:22 PM

specimens are made from 2 and 3 mm aluminium sheet, in allpossible thickness combinations, bonded with an epoxyadhesive. In order to ensure a consistent bond width andthickness, and to prevent the formation of any kind of fillet,the bonded area in all specimens was delineated using PTFEtape. The result in all cases is a bonded area 20 mm wide in anominal flange width/overlap of 23 mm, and bond thicknessof 0.25 mm.
The specimen geometries are illustrated in Figure 8.
Figure 8. Coach peel and lap-shear specimen geometries
The simple structural models of the specimens are basedon the preferred modelling guidelines described earlier. Acouple of examples are illustrated in Figure 9.
Figure 9. FE models of lap-shear and coach peelspecimens
The contour integral (J-integral) calculations in ABAQUSwere carried out using detailed models constructed from 2Dplane strain elements, representing a section through thesymmetry plane of each specimen. Crack depths of 0.5 - 3.5mm were considered. An example of the sort of mesh used isillustrated in Figures 10 and 11. Calculations were made forcracks through the middle of the adhesive layer (cohesivefailure) and at the interface between the aluminium and theadhesive (interfacial failure). For asymmetric specimens, bothinterfaces were considered.
Calculated J-integrals from the detailed models for thedefined crack depths are compared with results calculatedusing the approximate method implemented in DesignLife,based on NASTRAN models. To avoid end effects, theapproximate J calculations were taken from the middle of thespecimen. The results are shown in Figures 12,13,14,15,16,17for all the different test configurations.
Figure 10. Detailed 2D model of coach peel specimenwith 0.5 mm crack
Figure 11. 2D model - close up of crack tip area(deformed plot) - cohesive failure
Heyes et al / SAE Int. J. Mater. Manf. / Volume 5, Issue 1(April 2012)220
Downloaded from SAE International by Vellore Inst of Technology, Thursday, January 09, 2014 10:35:22 PM
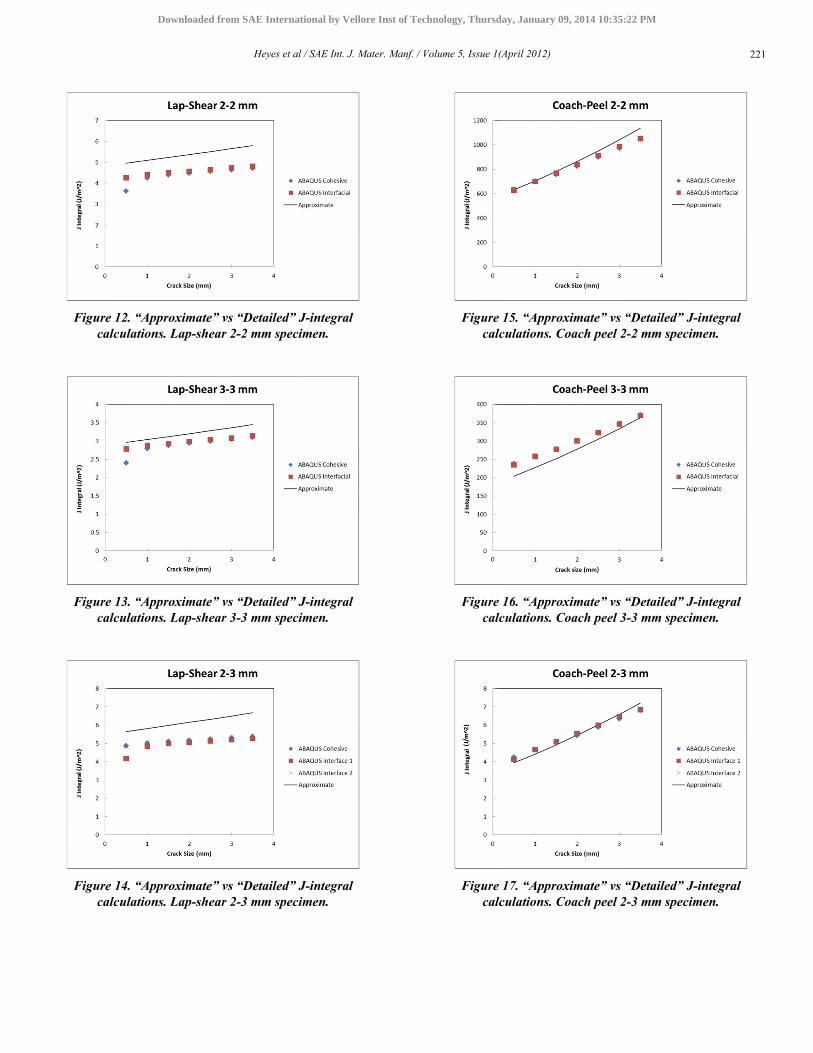
Figure 12. “Approximate” vs “Detailed” J-integralcalculations. Lap-shear 2-2 mm specimen.
Figure 13. “Approximate” vs “Detailed” J-integralcalculations. Lap-shear 3-3 mm specimen.
Figure 14. “Approximate” vs “Detailed” J-integralcalculations. Lap-shear 2-3 mm specimen.
Figure 15. “Approximate” vs “Detailed” J-integralcalculations. Coach peel 2-2 mm specimen.
Figure 16. “Approximate” vs “Detailed” J-integralcalculations. Coach peel 3-3 mm specimen.
Figure 17. “Approximate” vs “Detailed” J-integralcalculations. Coach peel 2-3 mm specimen.
Heyes et al / SAE Int. J. Mater. Manf. / Volume 5, Issue 1(April 2012) 221
Downloaded from SAE International by Vellore Inst of Technology, Thursday, January 09, 2014 10:35:22 PM

CORRELATION OF FATIGUE TESTDATA
The specimens described above were fatigue tested intension-tension at constant amplitude, with load ratio R = 0.1and in load control. Displacement-time histories wererecorded for all specimens.
Additional hybrid riv-bonded and weld-bonded jointspecimens (combinations of self-piercing rivets - SPR - orspotwelds with bonding) were also tested. The locations ofthe rivets or spotwelds in these joints are illustrated in Figure8. These hybrid configurations are not the main subject ofthis paper and while they are mentioned here, the findingsfrom tests on these specimens will be described in more detailin further publications.
Load-life curves for all 6 bonded-only specimengeometries tested (lap-shear and coach-peel specimens in allcombinations of 2 and 3 mm sheet) are summarized in Figure18.
Figure 18. Load-life curves for bonded specimens
The next step was to evaluate the J-integral as a means ofcorrelating the data from different test specimen geometries.For each specimen geometry and load level, the J-integral atthe mid-point of the bond was calculated using theapproximate method, based on simple NASTRAN models,assuming an initial crack size of 0.4 mm. The choice of 0.4mm for the initial defect size was suggested by Björkman [1]based on inspection of test specimens, and correlation of testdata. Ideally the choice of initial defect size should be basedon measurements from production parts, but in practice thevalue of the calculated J-integral is not very sensitive to smallvariations. For example, for a coach peel specimen, initialcrack sizes of 0.2 mm and 0.8 mm result in a reduction of 5%and an increase of 11% in the calculated J-integralrespectively, compared to a 0.4 mm crack. Lap-shearspecimens are less sensitive.
In Figure 19, data from the same tests as those in Figure18 are plotted with the calculated J-integral as the verticalaxis. Note that the J-N curves converge in single scatter band,particularly in the endurance domain (106 − 107 cycles).
Figure 19. J-life curves for bonded specimens
The good correlation of test data with J-integrals based ona small assumed initial crack size, particularly in theendurance (long-life) domain, encourages the idea that thesecalculations might provide a useful basis for evaluating thedurability of real structural joints with a variety of sheetthicknesses and loading types. The degree of scatter,approximate nature of the J-calculations and relatively flatcurves indicate that we cannot expect to make realistic finitelife predictions, particularly for mass-produced parts.However we should be able to predict whether or not theloading on a joint is sufficient to exceed the crack growththreshold for the adhesive.
One other matter should be touched upon here, and that isthe fact that many of the joints in an aluminium car body arehybrid joints, for example combinations of adhesive and self-piercing rivets. In such riv-bonded joints, the mechanicalfasteners are responsible for very little load transfer while theadhesive is intact, and we would expect the presence of arivet to make very little difference to the J-integral at the edgeof the adhesive bond (although the riveting process willinevitably affect the bonded area and uniformity of the bondline thickness). This view is supported by Figure 20 in whichJ-N data (solid circles) for riv-bonded coach peel (T-peel)specimens made with 3 mm sheets are superimposed on thebonded-only data from Figure 19.
Heyes et al / SAE Int. J. Mater. Manf. / Volume 5, Issue 1(April 2012)222
Downloaded from SAE International by Vellore Inst of Technology, Thursday, January 09, 2014 10:35:22 PM

Figure 20. Comparison of bonded and riv-bonded jointdurability, based on J-integral
At higher load levels, the adhesive cracks quite quickly,but there is significant residual life in the joint due to theresilience of the SPR, leading to a relatively steep slopecompared to the pure bonded joints. In the endurance domain,the durability is dominated by the fatigue threshold of theadhesive, and the data appears to converge with that of thepure bonded joints.
APPLICATIONIn order to test the usefulness of the method implemented
in the DesignLife software, it was necessary to apply it to arealistic example, for which the Jaguar XJ “body-in-white”(un-glazed) was selected. Considerable difficulty wasexperienced in generating any fatigue failures in the structuraljoints of the body during rig testing, and someexperimentation was required before a set of loads andconstraints could be identified capable of causing the jointfatigue failures required to validate the method. The resultingexperimental test set-up is illustrated in Figure 21.
The body is constrained at the B-pillars and adjacent sills,and loaded in torsion using 4 actuators acting at the shocktowers. The variable amplitude (VA) load signal for thefatigue testing is derived from a representative surface of thedurability test circuit. The forces in the shock tower signalswere manipulated to give a pure torsional loading on the carbody. The signals for the actuators were scaled up to a highlevel in order to produce fatigue failures within the requiredtest window. The VA signal was also modified to have aconstant frequency of 5Hz in order to avoid any significantdynamic response in the structure.
Figure 21. Test rig with Jaguar XJ body-in-white
The fatigue test was simulated using a typical FEdurability model of the XJ body-in-white (BIW), lightlymodified in accordance with the modelling guidelines for theapproximate J-integral calculation method. Rivets were notexplicitly included in the FE model. The same VA amplitudeloading was applied to the model as used in the physical test,and safety factors calculated based on a threshold strainenergy release rate (J-integral) of 100 J/m2 and an initialcrack size of 0.4 mm. The analysis highlighted a joint in theregion of the rear seat back to C-pillar connection, on bothsides of the vehicle, as having a safety factor < 1.0.
Figure 22. Fatigue test simulation results andcorresponding cracking on test
Heyes et al / SAE Int. J. Mater. Manf. / Volume 5, Issue 1(April 2012) 223
Downloaded from SAE International by Vellore Inst of Technology, Thursday, January 09, 2014 10:35:22 PM

On test, fatigue cracking was observed to occur in thisjoint on both sides of the tested vehicle bodies. An examplefrom the left hand side of the vehicle is marked in Figure 22(inset). Although the condition of the underlying adhesive inthis joint cannot be seen, it is surmised that the adhesive musthave failed in order for the SPR to experience the significantfatigue loading required to generate this crack. Cracking ofthe adhesive is more clearly visible in an example of thecorresponding joint on the right hand side of the body, asillustrated in Figure 23.
Figure 23. Adhesive cracking in rear seat back to C-pillar connection (top right of figure)
SUMMARYThis paper has described an approximate method for the
calculation of the J-integral associated with small cracks incar body adhesive joints. The FE modelling guidelinesrequire only modest modifications to typical body durabilitymodels. Investigations into the usefulness of this methodhave had the following positive results.1. The method has been shown to match J-integralscalculated by explicit and detailed modelling of cracks to areasonable degree of accuracy (in the context of bodydurability calculations).2. The calculated J-integral for a small crack in the edge ofan adhesive joint has been shown to provide a useful meansof correlating the fatigue strength of different joints in shearand peel loading in the endurance domain.3. The method shows promise as a means of identifyingcritically loaded adhesive and hybrid joints in vehicle bodies.
The method has a number of limitations.1. Because the J-integral is always a positive scalar, it is notsuitable for cycle counting or making finite life predictions.Having said that, the making of finite life predictions for thetype of joint covered by this paper may not be a realistic aim.2. There is no consideration of the effect of load ratio.3. Because the sandwich model is linear (no contact), thecalculated J-integrals do not distinguish, for example betweentensile and compressive loading on a peel joint.
In addition to exploring these issues, there is scope forfurther work in a number of other areas.
1. Exploration of the effects of temperature, environment,age and surface treatment on the durability of adhesive joints.
2. Improved modelling guidelines: the guidelines asdescribed lead to relatively high stiffness at the corners of abonded area, and the recommended beam element propertiesare somewhat arbitrary.
3. Improved meshing tools. Experiments with a “meshindependent” approach have so far had rather poor results.
4. Hybrid joint modelling
REFERENCES1. Björkman, G., “Global modeling and life prediction of adhesive bonded
structures,” Volvo Engineering Report, ER-540039, 1999.2. Fermér, M., Andréasson, M., and Frodin, B., “Fatigue Life Prediction of
MAG-Welded Thin-Sheet Structures,” SAE Technical Paper 982311,1998, doi: 10.4271/982311.
3. Heyes, P., “DesignLife theory guide,” HBM UK Ltd, 2010 (v7.0).4. Fernlund, G., Papini, M., McCammond, D. and Spelt, J. K., “Fracture
load predictions for adhesive joints,” Composites Science andTechnology, Vol. 51, 1994, pp. 587-600.
5. Rice, J., “A Path Independent Integral and the Approximate Analysis ofStrain Concentration by Notches and Cracks”, Journal of AppliedMechanics, Vol. 35, 1968, pp. 379-386.
ACKNOWLEDGMENTSThe testing and software implementation work described
in this paper was carried out as part of the “Bonded Car”collaborative research project, the partners being Jaguar LandRover, HBM UK Ltd (nCode), Coventry University,Warwick University, Innoval Technology, Henrob and StokeGolding Applied Research. The project was co-funded by theTechnology Strategy Board's Collaborative Research andDevelopment programme, following an open competition.
The Technology Strategy Board is an executive bodyestablished by the UK Government to drive innovation. Itpromotes and invests in research, development and theexploitation of science, technology and new ideas for thebenefit of business - increasing sustainable economic growthin the UK and improving quality of life.
The theoretical basis of the work presented here wasdeveloped as part of an earlier project conducted by theVolvo Group, whose contribution is gratefully acknowledged.
DEFINITIONS/ABBREVIATIONSh1
the thickness of the top shellh2
the thickness of the bottom shellha
the thickness of the adhesive layerE1
modulus of sheet 1 (upper sheet)v1
Poisson ratio of sheet 1
Heyes et al / SAE Int. J. Mater. Manf. / Volume 5, Issue 1(April 2012)224
Downloaded from SAE International by Vellore Inst of Technology, Thursday, January 09, 2014 10:35:22 PM

E2modulus of sheet 2 (lower sheet)
v2Poisson ratio of sheet 2
EaModulus of adhesive
vaPoisson ratio of adhesive
Heyes et al / SAE Int. J. Mater. Manf. / Volume 5, Issue 1(April 2012) 225
Downloaded from SAE International by Vellore Inst of Technology, Thursday, January 09, 2014 10:35:22 PM