
A flow injection flow cytometry system for on-line monitoring of bioreactors
9
A Flow Injection Flow Cytometry System for On-Line Monitoring of Bioreactors Rui Zhao, Arvind Natarajan, Friedrich Srienc Department of Chemical Engineering and Materials Science, Biological Process Technology Institute, University of Minnesota, 240 Gortner Lab, 1479 Gortner Avenue, St. Paul, MN 55108; telephone: (612)-624-9776; fax: 612-625-1700; e-mail: [email protected] Received 27 February 1998; accepted 9 September 1998 Abstract: For direct and on-line study of the physiologi- cal states of cell cultures, a robust flow injection system has been designed and interfaced with flow cytometry (FI-FCM). The core of the flow injection system includes a microchamber designed for sample processing. The de- sign of this microchamber allows not only an accurate on-line dilution but also on-line cell fixation, staining, and washing. The flow injection part of the system was tested by monitoring the optical density of a growing E.coli culture on-line using a spectrophotometer. The en- tire growth curve, from lag phase to stationary phase, was obtained with frequent sampling. The performance of the entire FI-FCM system is demonstrated in three ap- plications. The first is the monitoring of green fluores- cent protein fluorophore formation kinetics in E.coli by visualizing the fluorescence evolution after protein syn- thesis is inhibited. The data revealed a subpopulation of cells that do not become fluorescent. In addition, the data show that single-cell fluorescence is distributed over a wide range and that the fluorescent population contains cells that are capable of reaching significantly higher ex- pression levels than that indicated by the population av- erage. The second application is the detailed flow cyto- metric evaluation of the batch growth dynamics of E.coli expressing Gfp. The collected single-cell data visualize the batch growth phases and it is shown that a state of balanced growth is never reached by the culture. The third application is the determination of distribution of DNA content of a S. cerevisiae population by automati- cally staining cells using a DNA-specific stain. Reproduc- ibility of the on-line staining reaction shows that the sys- tem is not restricted to measuring the native properties of cells; rather, a wider range of cellular components could be monitored after appropriate sample processing. The system is thus particularly useful because it operates automatically without direct operator supervision for ex- tended time periods. © 1999 John Wiley & Sons, Inc. Biotech- nol Bioeng 62: 609–617, 1999. Keywords: online flow cytometry; flow injection flow cy- tometry; automatic staining; bioreactor monitoring INTRODUCTION There is ample evidence that growing cells are heteroge- neous entities that differ from one another in their physi- ological states. Microbial heterogeneity may arise due to phenotypic changes associated with the cell cycle (Dien and Srienc, 1991; Srienc and Dien, 1992), due to changes in the microenvironments of individual cells (Dunlop and Ye, 1990; Fowler and Dunlop, 1989), or due to mutations re- sulting in genotypic variations in the population (Hall, 1995). Thus, rates of growth-associated parameters, such as protein synthesis or substrate uptake, are distributed in the population. From a biochemical engineering perspective, these population dynamics have profound implications, be- cause the overall productivity of the microbial process de- pends on the contribution of each individual cell. One method to estimate such dynamics is by the use of flow cytometry. In a process environment, rapid, repeated, and long-term on-line manual analysis is usually impractical, if not impos- sible. Therefore, a certain degree of automation is desirable, particularly for more complex analysis procedures such as flow cytometry. To date, a number of flow injection systems have been designed and widely used in microbial process control and automatic analysis (Munch et al., 1992; Reed, 1990; Ruzicka and Hansen, 1975, 1988), but most of them monitor population-averaged properties. The concept of au- tomatic flow cytometric analysis was introduced by Omann et al. (1985), who constructed a sample introduction device fitted to a Becton Dickinson FACS cytometer. Kelley (1989) also developed a similar device. Pennings et al. (1987) developed a system based on continuous pumping of cells and reagents with a peristaltic pump. Although the capabilities of these designs are rather limited, they are pioneering designs in automated flow cytometry. Successful on-line flow cytometry has been demonstrated using a flow injection technique (Ruzicka and Lindberg, 1992). In this study, we present a flow injection system inter- faced with a flow cytometer and a bioreactor to perform on-line assessment of single-cell property distributions. The versatility and performance of this system are demonstrated in several preliminary examples that show the utility of the system as it provides detailed quantitative information on growing cell populations that cannot be obtained with any other existing method. Correspondence to: F. Srienc © 1999 John Wiley & Sons, Inc. CCC 0006-3592/99/050609-09
Transcript of A flow injection flow cytometry system for on-line monitoring of bioreactors
A Flow Injection Flow Cytometry Systemfor On-Line Monitoring of Bioreactors
Rui Zhao, Arvind Natarajan, Friedrich Srienc
Department of Chemical Engineering and Materials Science, BiologicalProcess Technology Institute, University of Minnesota, 240 Gortner Lab,1479 Gortner Avenue, St. Paul, MN 55108; telephone: (612)-624-9776; fax:612-625-1700; e-mail: [email protected]
Received 27 February 1998; accepted 9 September 1998
Abstract: For direct and on-line study of the physiologi-cal states of cell cultures, a robust flow injection systemhas been designed and interfaced with flow cytometry(FI-FCM). The core of the flow injection system includes amicrochamber designed for sample processing. The de-sign of this microchamber allows not only an accurateon-line dilution but also on-line cell fixation, staining,and washing. The flow injection part of the system wastested by monitoring the optical density of a growingE.coli culture on-line using a spectrophotometer. The en-tire growth curve, from lag phase to stationary phase,was obtained with frequent sampling. The performanceof the entire FI-FCM system is demonstrated in three ap-plications. The first is the monitoring of green fluores-cent protein fluorophore formation kinetics in E.coli byvisualizing the fluorescence evolution after protein syn-thesis is inhibited. The data revealed a subpopulation ofcells that do not become fluorescent. In addition, the datashow that single-cell fluorescence is distributed over awide range and that the fluorescent population containscells that are capable of reaching significantly higher ex-pression levels than that indicated by the population av-erage. The second application is the detailed flow cyto-metric evaluation of the batch growth dynamics of E.coliexpressing Gfp. The collected single-cell data visualizethe batch growth phases and it is shown that a state ofbalanced growth is never reached by the culture. Thethird application is the determination of distribution ofDNA content of a S. cerevisiae population by automati-cally staining cells using a DNA-specific stain. Reproduc-ibility of the on-line staining reaction shows that the sys-tem is not restricted to measuring the native propertiesof cells; rather, a wider range of cellular componentscould be monitored after appropriate sample processing.The system is thus particularly useful because it operatesautomatically without direct operator supervision for ex-tended time periods. © 1999 John Wiley & Sons, Inc. Biotech-nol Bioeng 62: 609–617, 1999.Keywords: online flow cytometry; flow injection flow cy-tometry; automatic staining; bioreactor monitoring
INTRODUCTION
There is ample evidence that growing cells are heteroge-neous entities that differ from one another in their physi-
ological states. Microbial heterogeneity may arise due tophenotypic changes associated with the cell cycle (Dien andSrienc, 1991; Srienc and Dien, 1992), due to changes in themicroenvironments of individual cells (Dunlop and Ye,1990; Fowler and Dunlop, 1989), or due to mutations re-sulting in genotypic variations in the population (Hall,1995). Thus, rates of growth-associated parameters, such asprotein synthesis or substrate uptake, are distributed in thepopulation. From a biochemical engineering perspective,these population dynamics have profound implications, be-cause the overall productivity of the microbial process de-pends on the contribution of each individual cell. Onemethod to estimate such dynamics is by the use of flowcytometry.
In a process environment, rapid, repeated, and long-termon-line manual analysis is usually impractical, if not impos-sible. Therefore, a certain degree of automation is desirable,particularly for more complex analysis procedures such asflow cytometry. To date, a number of flow injection systemshave been designed and widely used in microbial processcontrol and automatic analysis (Munch et al., 1992; Reed,1990; Ruzicka and Hansen, 1975, 1988), but most of themmonitor population-averaged properties. The concept of au-tomatic flow cytometric analysis was introduced by Omannet al. (1985), who constructed a sample introduction devicefitted to a Becton Dickinson FACS cytometer. Kelley(1989) also developed a similar device. Pennings et al.(1987) developed a system based on continuous pumping ofcells and reagents with a peristaltic pump. Although thecapabilities of these designs are rather limited, they arepioneering designs in automated flow cytometry. Successfulon-line flow cytometry has been demonstrated using a flowinjection technique (Ruzicka and Lindberg, 1992).
In this study, we present a flow injection system inter-faced with a flow cytometer and a bioreactor to performon-line assessment of single-cell property distributions. Theversatility and performance of this system are demonstratedin several preliminary examples that show the utility of thesystem as it provides detailed quantitative information ongrowing cell populations that cannot be obtained with anyother existing method.Correspondence to:F. Srienc
© 1999 John Wiley & Sons, Inc. CCC 0006-3592/99/050609-09

MATERIALS AND METHODS
Cell Strains, Growth Medium, GrowthConditions, and Staining Conditions
E. coli strain K12 was used in the growth experiment in-volving on-line monitoring of optical density. Cells weregrown in 300 mL of 2XGYT complex medium (Sambrooket al., 1989) in a 1-L flask placed in a 30°C water bath andshaken at 225 rpm. The culture was aerated at 1 vvm by aperistaltic pump through an airstone (Cole-Parmer, VernonHills, IL) immersed in the medium.E. coli BL21 cells trans-formed with the plasmid pRSET/S65T (a kind gift from Dr.R. Y. Tsien, Howard Hughes Medical Center, San Diego)were used in the experiment to study the Gfp fluorophoreformation kinetics and batch growth dynamics. The plasmidcontains an ampicillin-resistance marker gene, and the Gfpgene under the control of a T7 RNA polymerase promoter.Cells were grown in LB complex medium containing am-picillin (100 mg/mL). Production of T7 RNA polymerasewas regulated using an IPTG induciblelacZ promoter pre-sent in the host chromosome. IPTG (200mg/mL) was usedto induce Gfp expression, and chloramphenicol (30mg/mL)was used to inhibit the protein synthesis when needed (Sam-brook et al., 1989).
Saccharomyces cerevisiaestrain YPH399a (MATa, ade2-101, leu2D1, lys2-80, his3D200, trp1D63, ura3-52) cellswere grown overnight in 3 mL YPD medium (bacto-yeastextract 1% w/v, bacto-peptone 2% w/v, dextrose 2% w/v) at30°C and 225 rpm in a 15-mL polystyrene test tube (Fal-con). Cells were diluted to a concentration of ca. 1 × 10⁶
cells in fresh medium, and the tube was placed on ice.Samples were automatically withdrawn into the microcham-ber of the flow injection system. Inside the microchamber,samples were washed with ice-cold PBS (0.15M, pH 7.5),fixed in ice-cold 70% ethanol, washed with ice-cold PBS,treated with chromatin denaturation solution (0.1N HCl,0.5% w/v Triton X-100, 1.75% w/v NaCl), washed withice-cold PBS, and stained with mithramycin A (Sigma, 30mg/mL in PBS, 2 mM MgCl2). Fixation and denaturationsteps were 2 min in length, washes were 1 min in length,and cells were stained with mithramycin for 10 min. Fixa-tion, denaturation, and washing were performed by continu-ously pumping the appropriate reagent through the micro-chamber while mixing the suspended cells using a magneticstir-bar.
FI-FCM System
The equipment used to construct the flow injection systemis listed in Table I. The components were interfaced to apersonal computer using DT2805 and DAS1601 data acqui-sition and system control boards through digital input/output (DI/O) and digital-to-analog (D/A) subsystems.Labtech NOTEBOOK software (Laboratories TechnologyCorp., Wilmington, MA) was used to control both boards.Figure 1 shows a schematic overview of this FI-FCM sys-
tem, which consists of three subsystems: (i) sample deliv-ery; (ii) sample handling; and (iii) sample injection andanalysis.
A sample delivery loop transferred the cell culture from abioreactor to the flow injection system. A static degassingunit was designed to release air bubbles trapped in thesample (Fig. 2a), and sample was continuously recirculatedin this loop. During sampling periods, the cell culture withair bubbles was allowed to accumulate in the glass tube, anda weak vacuum was applied using a peristaltic pump. Due toa combination of static hydraulic buoyancy force and thevacuum, air bubbles were rapidly eliminated from the me-dium through a 0.45-mm in-line filter. The degassed samplewas then fed into the microchamber of the sample handlingsubsystem for further processing. The sample residencetime in the delivery loop was minimized, because the envi-ronmental conditions (in particular, the aeration) in the tub-ing were not the same as those in the bioreactor. However,care was taken to avoid shear-induced damage of the samplethat might result from the use of very high flow rates in thetubing. Hence, Cole-Parmer Masterflex silicon tubing (size#13, i.d. 0.75 mm) and a flow rate of 5 mL/min (0.19 m/s)were used, resulting in a residence time of 10.5 s.
The sample handling consists of a ten-position switchingvalve (#1, Table I) connected with a precise peristaltic pump
Table I. List of equipment.
Equipment Manufacturer Control method
1. Ten-positionswitching valve,Model C25Z
Valco InstrumentsCo. Inc.,Houston, TX
TTL output, DI/Oport #1, DT2805
2. Two-way injectionvalve, Model C22Z
Valco TTL output, DI/Oport #1, DT2805
3. Three-wayswitching valve,Model 01367-72
Cole-Parmer,Vernon Hills, IL
Relay driven, DI/Oport #0, DT2805
4. Peristaltic pump,7520-50
Cole-Parmer Current output, D/Aport #1, DT2805Board
5. Syringe pump,pump 22
HarvardInstrumentation,Harvard, MA
RS-232c
6. Peristaltic pump,7520-20, 7520-30
Cole-Parmer, IL Masterflex speedcontrol unit
7. Magnetic StirPlate, Model 120s
Fisher Scientific,Pittsburgh, PA
8. LH fermentor, 2L LH Fermentation,Hayward, CA
LH fermentorcontrol unit
9. DT2805 dataacquisition andsystem controlboard
Data Translation,Marlboro, MA
10. DAS1601 dataacquisition andsystem controlboard
Keithley DataAcquisition,Taunton, MA
11. Computer,Vectra/66
Hewlett Packard Interfaced withflow cytometer
12. Computer, 486/25c Gateway 2000, N.Sioux City, SD
Interfaced with FIsystem
610 BIOTECHNOLOGY AND BIOENGINEERING, VOL. 62, NO. 5, MARCH 5, 1999
(#4, Table I) to select up to ten different streams, and atwo-way injection valve (#2, Table I) incorporated with amicrochamber to load and inject samples (Fig. 2b,c). Thekey component in sample handling is the microchamber,which has been designed to allow on-line sample dilutionand staining (Fig. 2d). The unit essentially represents astirred-tank reactor with three ports that serve as inlets andoutlets. Because dilution, staining processes, and other en-zymatic reactions are basically mixing processes, they canbe easily carried out in the microchamber in a predictablemanner.
Ports A and B are directly connected to the microcham-ber, whereas port C is connected to the microchamberthrough an in-line filter. With this in-line filter, fluids canflow through the microchamber freely, but cells are retainedinside. To load sample into the microchamber, outlet C isblocked (Fig. 2d), sample is pumped through microchamberfrom port A to port B. To perform on-line dilution of cellsamples, water is pumped through the microchamber fromport A to port B at a predetermined flow rate,F, for a certaintime, t, such that the sample is diluted by a factorD givenby:
D~t! =C0
C~t!= e~F/V!t (1)
whereV is the volume of the microchamber, andC0 is theinitial cell concentration. In practice, the volume term ismodified to account for the dead volume of the connectiontubing. To perform on-line staining, port C is opened,whereas port B is blocked. Solutions such as PBS or ethanolare pumped through the microchamber from port A to portC, so that cells inside the microchamber can be washed,fixed, and stained. After samples are processed, they areinjected into the flow cytometer for analysis. The flow cy-tometer used was an Ortho Cytofluorograf IIs (Ortho Diag-nostics Systems, Westwood, MA) equipped with an argonion laser (Innova 90-5, Coherent Inc., Palo Alto, CA) and aCicero data acquisition system (Cytomation, Fort Collins,CO). The laser was operated at 488 nm (Gfp) or 457 nm(mithramycin), and 100-mW beam power. A band-pass fil-ter (525 ± 15 nm) and an OG530 long-pass filter were usedto collect Gfp and mithramycin fluorescences, respectively.Data were acquired in listmode, pulse area, linear, and loga-rithmic configurations.
RESULTS
System Performance
To test the sample handling system, a growth study ofE.colicells was carried out using a spectrophotometer as the de-
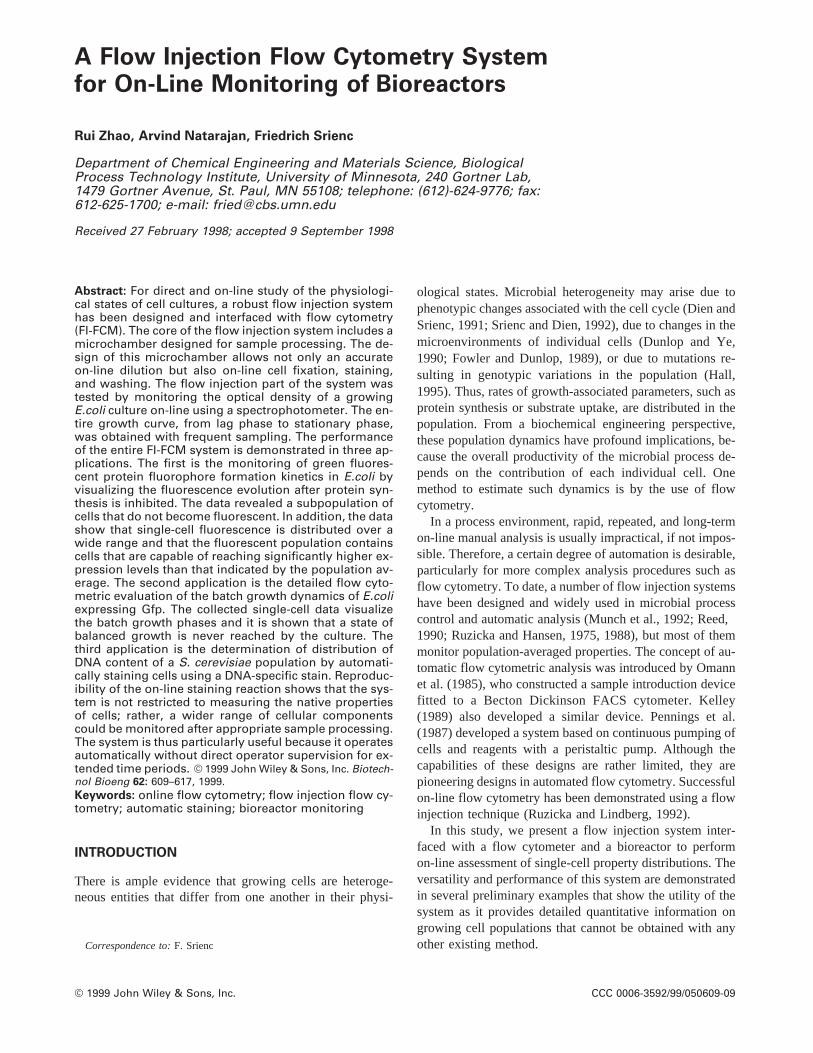
Figure 1. An overview of the FI-FCM system. The system consists of thefollowing parts: sample delivery (‘‘S.D.’’); sample handling (‘‘S.H.’’);sample injection (‘‘S.I.’’); sample analysis (‘‘S.A.’’); and computer control(‘‘C.C.’’). Sample from a bioreactor is first brought to a multipositionvalve and degassing is performed. Up to 10 different samples or reagents(‘‘RE1,’’ etc.) can be selected and pumped into the system using theten-position valve connected with a precise peristaltic pump. A micro-chamber (‘‘MC’’) connected to a two-way injection valve is used to dilutesamples or mix samples with different reagents. After treatment, samplesare injected into the flow cytometer in a pulse-free manner by the mobilephase (saline), which is driven by pressurized air. The flow injection sys-tem is controlled by a PC through two data acquisition and system controlboards. Flow cytometric data acquisition and analyses are performed byanother PC.
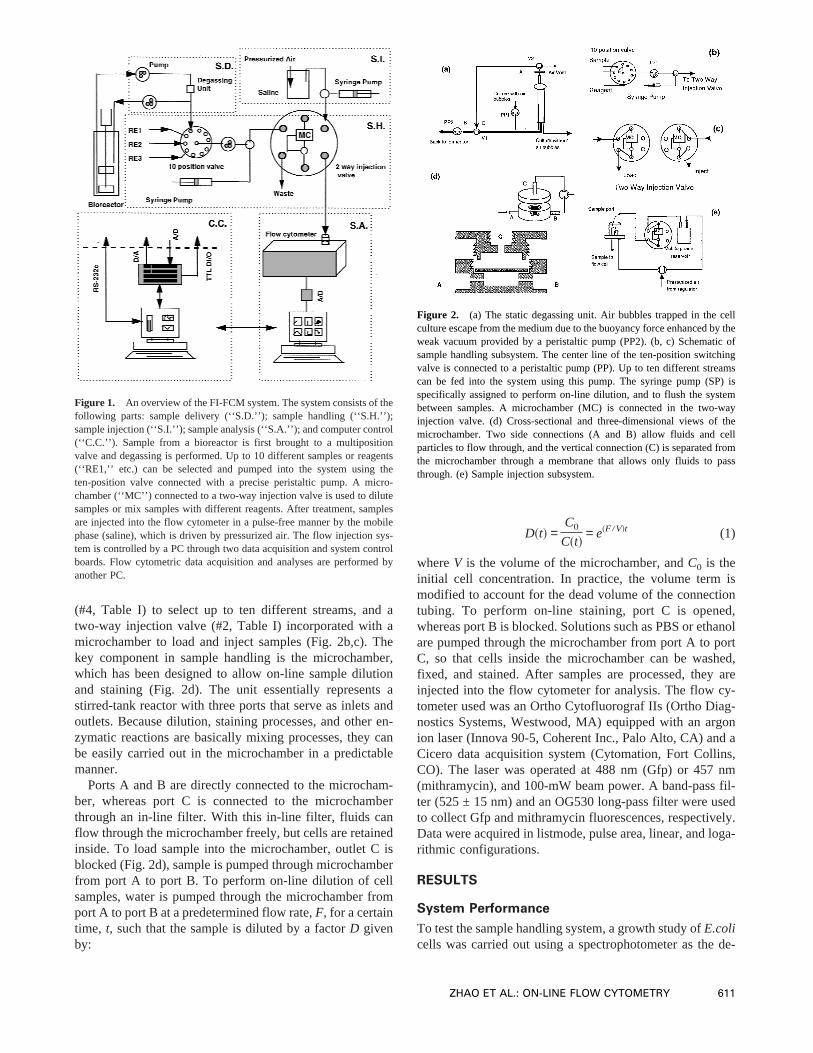
Figure 2. (a) The static degassing unit. Air bubbles trapped in the cellculture escape from the medium due to the buoyancy force enhanced by theweak vacuum provided by a peristaltic pump (PP2). (b, c) Schematic ofsample handling subsystem. The center line of the ten-position switchingvalve is connected to a peristaltic pump (PP). Up to ten different streamscan be fed into the system using this pump. The syringe pump (SP) isspecifically assigned to perform on-line dilution, and to flush the systembetween samples. A microchamber (MC) is connected in the two-wayinjection valve. (d) Cross-sectional and three-dimensional views of themicrochamber. Two side connections (A and B) allow fluids and cellparticles to flow through, and the vertical connection (C) is separated fromthe microchamber through a membrane that allows only fluids to passthrough. (e) Sample injection subsystem.
ZHAO ET AL.: ON-LINE FLOW CYTOMETRY 611

tection device instead of a flow cytometer. The purpose ofthe experiment was to test the reliability of the sampling,degassing, and the dilution subsystems. A satisfactory per-formance of the system would yield the growth curve of acell culture with frequent sampling points over the entiregrowth period by automatically carrying out dilutions tokeep absorbance readings in the linear range when highercell densities were reached.
The output transmittance signals of the spectrophotom-eter were acquired using the A/D subsystem of the DT2805board. A typical output signal is shown in Figure 3a. Thesignal resembles a gamma distribution due to the dispersionof the sample in the carrier stream. The sample concentra-tion was determined by integrating over the entire durationof the signal pulse. Because the dispersion of the cell culturewithin the carrier stream is not linearly related with thesample concentration, the recorded transmittance signals arenot directly proportional to the sample concentration. Thisrelationship can be described by the Taylor dispersion (Tay-lor, 1953) as follows:
C~t! =M/pR2
=4pE te−~Z−vt!2/4Et
(2)
whereC(t) is the concentration of the sample at the positionof the detector at timet, M is the total amount of the sampleinjected into the carrier stream,E is the dispersion coeffi-cient,R is the diameter of the tube,v is the velocity of thestream, andZ is the distance between the detector and thepoint of the injection. Transmittance [V(t)] is related to cell
concentration [C(t)] according to Beer–Lambert’s law(Zubay, 1993):
log10~V~t!! = − K d C~t! (3)
whereK is molar absorption coefficient, andd is the pathlength. Combining Eqs. (2) and (3), the following expres-sion can be derived to relate the amount of sample to themeasured transmittance signal:
*0
`
~1 − logV! dt ~ M (4)
Eq. (4) is valid over the same linear range described byBeer–Lambert’s law. This was determined to be the case forsample absorbances of <2.0 (Fig. 3b). Therefore, on-linedilutions were necessary for dense samples. A zero-orderalgorithm was used to calculate the dilution factor for thenext sample (Di +1) based on the current concentration mea-surement (Ci) and the initial sample concentration (C0). Thealgorithm:
Di+1 = Ci /C0 (5)
is valid when the frequency of sampling is greater than thefrequency of cell division. The lag phase, exponentialgrowth phase, and the stationary phase can be clearly rec-ognized in the growth curve thus obtained (Figure 3c). On-line measurements showed very few variations associatedwith measurement errors, and measurements were thusstable and consistent. The on-line dilution started automati-cally 11 h after the start of the growth experiment, anddilution factors increased from 1 to 27 over the span of theexperiment (Figure 3d). The degassing unit was able toefficiently remove air bubbles from the cell culture sampleseven during the late stages of the experiment when the cellculture was very dense (OD∼40). The two abnormal pointsshown in Figure 3a (at ca. 4 and 10 h) are probably due toair bubbles that likely originated from open ports on theten-position switching valve. This potential problem can beavoided by sealing unused ports. One can note that thedilution factors calculated after the overshoots in the mea-surements did not diverge away, indicating that the zero-order algorithm is robust for this application.
Reproducibility of On-Line FlowCytometry Measurements
A stable sample stream is very important to obtain accuratemeasurements on a flow cytometer. Hence, pressurized airwas used to drive sample from the microchamber to theflow cytometer (Fig. 2e). Most FI systems, including someFI-FCM systems, use a mechanical syringe pump (Blanken-stein et al., 1996; Lindberg et al., 1993). Using our syringepump, it was found that the coefficient of variation of light-scatter distributions of calibration beads obtained washigher than 10% with strong concomitant background noise.In contrast, the use of pressurized air to drive samples gavereproducible, noise-free light-scatter distributions of cali-bration beads.
Figure 3. (a) Typical spectrophotometer output transmittance signal. Thesignal was acquired using the A/D subsystem of the DT2805 data acqui-sition board. (b) The range over which Beer–Lambert’s law is valid wasdetermined by diluting a dense culture, and measuring absorbance at 600nm at each dilution. (c)E. coli growth curve.E. coli BL21 cells weregrown in 2XGYT medium at 30°C, and the optical density of the cellculture was monitored on-line every 10 min for 22 h. The biomass doublingtime was estimated as 1.77 h. (d) On-line dilution. On-line dilution startedautomatically 11 h after the start of the experiment, and the dilution factorincreased to 27 over the course of the experiment.
612 BIOTECHNOLOGY AND BIOENGINEERING, VOL. 62, NO. 5, MARCH 5, 1999
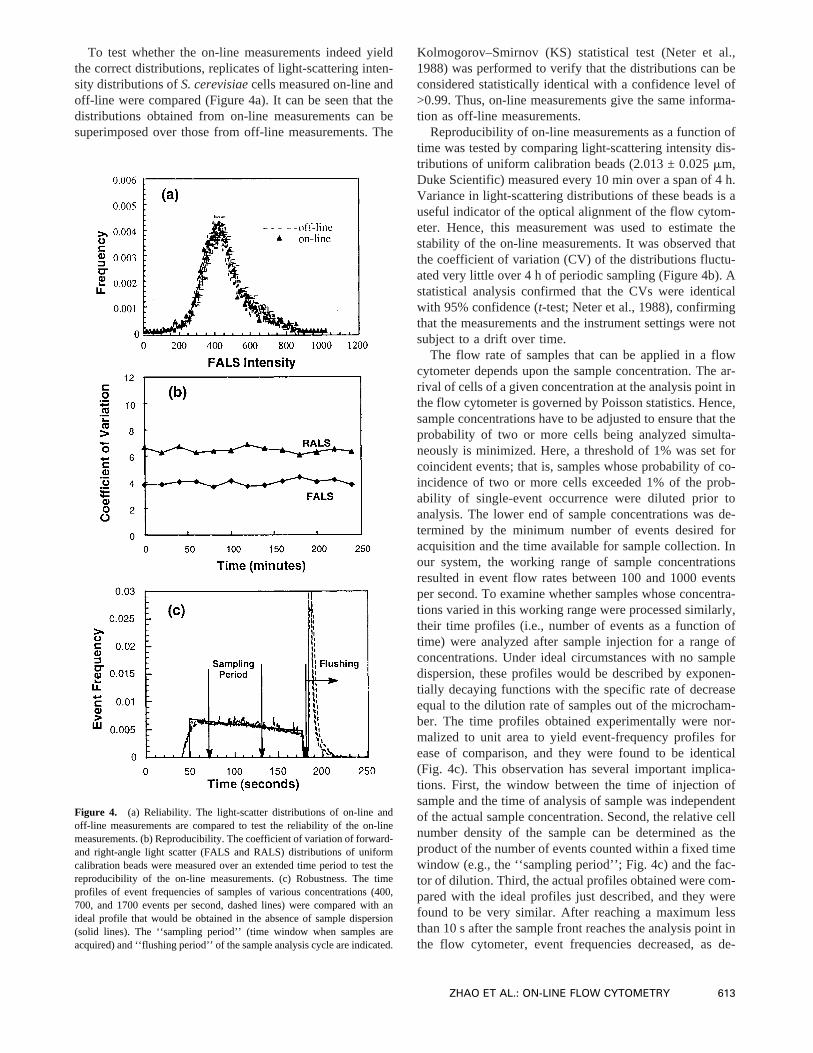
To test whether the on-line measurements indeed yieldthe correct distributions, replicates of light-scattering inten-sity distributions ofS. cerevisiaecells measured on-line andoff-line were compared (Figure 4a). It can be seen that thedistributions obtained from on-line measurements can besuperimposed over those from off-line measurements. The
Kolmogorov–Smirnov (KS) statistical test (Neter et al.,1988) was performed to verify that the distributions can beconsidered statistically identical with a confidence level of>0.99. Thus, on-line measurements give the same informa-tion as off-line measurements.
Reproducibility of on-line measurements as a function oftime was tested by comparing light-scattering intensity dis-tributions of uniform calibration beads (2.013 ± 0.025mm,Duke Scientific) measured every 10 min over a span of 4 h.Variance in light-scattering distributions of these beads is auseful indicator of the optical alignment of the flow cytom-eter. Hence, this measurement was used to estimate thestability of the on-line measurements. It was observed thatthe coefficient of variation (CV) of the distributions fluctu-ated very little over 4 h of periodic sampling (Figure 4b). Astatistical analysis confirmed that the CVs were identicalwith 95% confidence (t-test; Neter et al., 1988), confirmingthat the measurements and the instrument settings were notsubject to a drift over time.
The flow rate of samples that can be applied in a flowcytometer depends upon the sample concentration. The ar-rival of cells of a given concentration at the analysis point inthe flow cytometer is governed by Poisson statistics. Hence,sample concentrations have to be adjusted to ensure that theprobability of two or more cells being analyzed simulta-neously is minimized. Here, a threshold of 1% was set forcoincident events; that is, samples whose probability of co-incidence of two or more cells exceeded 1% of the prob-ability of single-event occurrence were diluted prior toanalysis. The lower end of sample concentrations was de-termined by the minimum number of events desired foracquisition and the time available for sample collection. Inour system, the working range of sample concentrationsresulted in event flow rates between 100 and 1000 eventsper second. To examine whether samples whose concentra-tions varied in this working range were processed similarly,their time profiles (i.e., number of events as a function oftime) were analyzed after sample injection for a range ofconcentrations. Under ideal circumstances with no sampledispersion, these profiles would be described by exponen-tially decaying functions with the specific rate of decreaseequal to the dilution rate of samples out of the microcham-ber. The time profiles obtained experimentally were nor-malized to unit area to yield event-frequency profiles forease of comparison, and they were found to be identical(Fig. 4c). This observation has several important implica-tions. First, the window between the time of injection ofsample and the time of analysis of sample was independentof the actual sample concentration. Second, the relative cellnumber density of the sample can be determined as theproduct of the number of events counted within a fixed timewindow (e.g., the ‘‘sampling period’’; Fig. 4c) and the fac-tor of dilution. Third, the actual profiles obtained were com-pared with the ideal profiles just described, and they werefound to be very similar. After reaching a maximum lessthan 10 s after the sample front reaches the analysis point inthe flow cytometer, event frequencies decreased, as de-
Figure 4. (a) Reliability. The light-scatter distributions of on-line andoff-line measurements are compared to test the reliability of the on-linemeasurements. (b) Reproducibility. The coefficient of variation of forward-and right-angle light scatter (FALS and RALS) distributions of uniformcalibration beads were measured over an extended time period to test thereproducibility of the on-line measurements. (c) Robustness. The timeprofiles of event frequencies of samples of various concentrations (400,700, and 1700 events per second, dashed lines) were compared with anideal profile that would be obtained in the absence of sample dispersion(solid lines). The ‘‘sampling period’’ (time window when samples areacquired) and ‘‘flushing period’’ of the sample analysis cycle are indicated.
ZHAO ET AL.: ON-LINE FLOW CYTOMETRY 613
scribed by the ideal profile. This implies that the micro-chamber can indeed be approximated as an ideal stirred-tank reactor. Finally, any residual sample is completelyflushed away during the flushing period, and hence there isno cross-contamination between successive samples. Thus,the system was robust in handling a range in cell concen-trations, and yielded very reliable data.
Monitoring Cell Population Dynamics
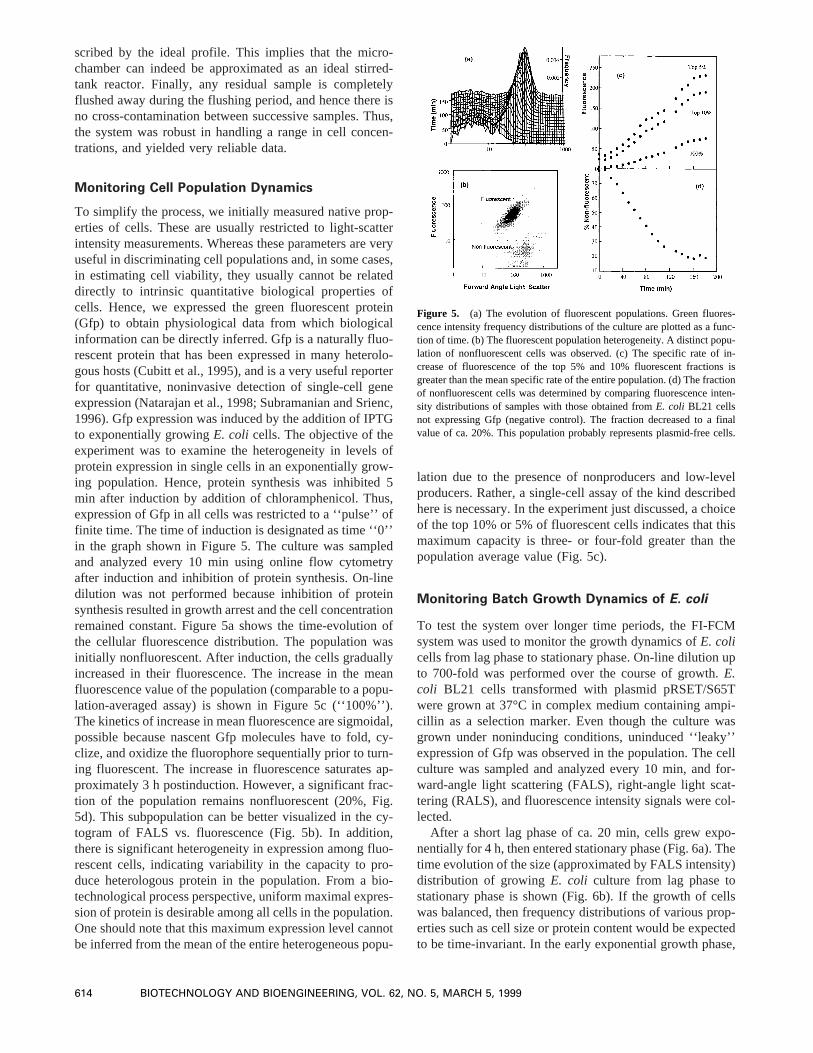
To simplify the process, we initially measured native prop-erties of cells. These are usually restricted to light-scatterintensity measurements. Whereas these parameters are veryuseful in discriminating cell populations and, in some cases,in estimating cell viability, they usually cannot be relateddirectly to intrinsic quantitative biological properties ofcells. Hence, we expressed the green fluorescent protein(Gfp) to obtain physiological data from which biologicalinformation can be directly inferred. Gfp is a naturally fluo-rescent protein that has been expressed in many heterolo-gous hosts (Cubitt et al., 1995), and is a very useful reporterfor quantitative, noninvasive detection of single-cell geneexpression (Natarajan et al., 1998; Subramanian and Srienc,1996). Gfp expression was induced by the addition of IPTGto exponentially growingE. coli cells. The objective of theexperiment was to examine the heterogeneity in levels ofprotein expression in single cells in an exponentially grow-ing population. Hence, protein synthesis was inhibited 5min after induction by addition of chloramphenicol. Thus,expression of Gfp in all cells was restricted to a ‘‘pulse’’ offinite time. The time of induction is designated as time ‘‘0’’in the graph shown in Figure 5. The culture was sampledand analyzed every 10 min using online flow cytometryafter induction and inhibition of protein synthesis. On-linedilution was not performed because inhibition of proteinsynthesis resulted in growth arrest and the cell concentrationremained constant. Figure 5a shows the time-evolution ofthe cellular fluorescence distribution. The population wasinitially nonfluorescent. After induction, the cells graduallyincreased in their fluorescence. The increase in the meanfluorescence value of the population (comparable to a popu-lation-averaged assay) is shown in Figure 5c (‘‘100%’’).The kinetics of increase in mean fluorescence are sigmoidal,possible because nascent Gfp molecules have to fold, cy-clize, and oxidize the fluorophore sequentially prior to turn-ing fluorescent. The increase in fluorescence saturates ap-proximately 3 h postinduction. However, a significant frac-tion of the population remains nonfluorescent (20%, Fig.5d). This subpopulation can be better visualized in the cy-togram of FALS vs. fluorescence (Fig. 5b). In addition,there is significant heterogeneity in expression among fluo-rescent cells, indicating variability in the capacity to pro-duce heterologous protein in the population. From a bio-technological process perspective, uniform maximal expres-sion of protein is desirable among all cells in the population.One should note that this maximum expression level cannotbe inferred from the mean of the entire heterogeneous popu-
lation due to the presence of nonproducers and low-levelproducers. Rather, a single-cell assay of the kind describedhere is necessary. In the experiment just discussed, a choiceof the top 10% or 5% of fluorescent cells indicates that thismaximum capacity is three- or four-fold greater than thepopulation average value (Fig. 5c).
Monitoring Batch Growth Dynamics of E. coli
To test the system over longer time periods, the FI-FCMsystem was used to monitor the growth dynamics ofE. colicells from lag phase to stationary phase. On-line dilution upto 700-fold was performed over the course of growth.E.coli BL21 cells transformed with plasmid pRSET/S65Twere grown at 37°C in complex medium containing ampi-cillin as a selection marker. Even though the culture wasgrown under noninducing conditions, uninduced ‘‘leaky’’expression of Gfp was observed in the population. The cellculture was sampled and analyzed every 10 min, and for-ward-angle light scattering (FALS), right-angle light scat-tering (RALS), and fluorescence intensity signals were col-lected.
After a short lag phase of ca. 20 min, cells grew expo-nentially for 4 h, then entered stationary phase (Fig. 6a). Thetime evolution of the size (approximated by FALS intensity)distribution of growingE. coli culture from lag phase tostationary phase is shown (Fig. 6b). If the growth of cellswas balanced, then frequency distributions of various prop-erties such as cell size or protein content would be expectedto be time-invariant. In the early exponential growth phase,
Figure 5. (a) The evolution of fluorescent populations. Green fluores-cence intensity frequency distributions of the culture are plotted as a func-tion of time. (b) The fluorescent population heterogeneity. A distinct popu-lation of nonfluorescent cells was observed. (c) The specific rate of in-crease of fluorescence of the top 5% and 10% fluorescent fractions isgreater than the mean specific rate of the entire population. (d) The fractionof nonfluorescent cells was determined by comparing fluorescence inten-sity distributions of samples with those obtained fromE. coli BL21 cellsnot expressing Gfp (negative control). The fraction decreased to a finalvalue of ca. 20%. This population probably represents plasmid-free cells.
614 BIOTECHNOLOGY AND BIOENGINEERING, VOL. 62, NO. 5, MARCH 5, 1999
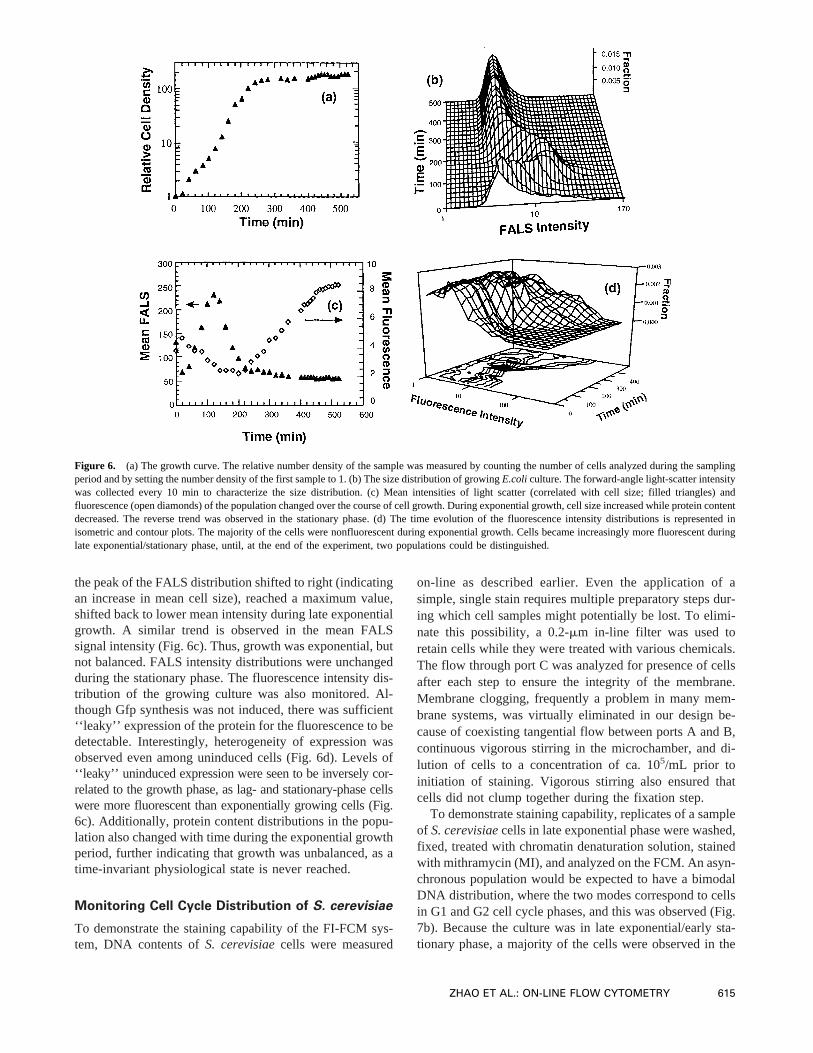
the peak of the FALS distribution shifted to right (indicatingan increase in mean cell size), reached a maximum value,shifted back to lower mean intensity during late exponentialgrowth. A similar trend is observed in the mean FALSsignal intensity (Fig. 6c). Thus, growth was exponential, butnot balanced. FALS intensity distributions were unchangedduring the stationary phase. The fluorescence intensity dis-tribution of the growing culture was also monitored. Al-though Gfp synthesis was not induced, there was sufficient‘‘leaky’’ expression of the protein for the fluorescence to bedetectable. Interestingly, heterogeneity of expression wasobserved even among uninduced cells (Fig. 6d). Levels of‘‘leaky’’ uninduced expression were seen to be inversely cor-related to the growth phase, as lag- and stationary-phase cellswere more fluorescent than exponentially growing cells (Fig.6c). Additionally, protein content distributions in the popu-lation also changed with time during the exponential growthperiod, further indicating that growth was unbalanced, as atime-invariant physiological state is never reached.
Monitoring Cell Cycle Distribution of S. cerevisiae
To demonstrate the staining capability of the FI-FCM sys-tem, DNA contents ofS. cerevisiaecells were measured
on-line as described earlier. Even the application of asimple, single stain requires multiple preparatory steps dur-ing which cell samples might potentially be lost. To elimi-nate this possibility, a 0.2-mm in-line filter was used toretain cells while they were treated with various chemicals.The flow through port C was analyzed for presence of cellsafter each step to ensure the integrity of the membrane.Membrane clogging, frequently a problem in many mem-brane systems, was virtually eliminated in our design be-cause of coexisting tangential flow between ports A and B,continuous vigorous stirring in the microchamber, and di-lution of cells to a concentration of ca. 105/mL prior toinitiation of staining. Vigorous stirring also ensured thatcells did not clump together during the fixation step.
To demonstrate staining capability, replicates of a sampleof S. cerevisiaecells in late exponential phase were washed,fixed, treated with chromatin denaturation solution, stainedwith mithramycin (MI), and analyzed on the FCM. An asyn-chronous population would be expected to have a bimodalDNA distribution, where the two modes correspond to cellsin G1 and G2 cell cycle phases, and this was observed (Fig.7b). Because the culture was in late exponential/early sta-tionary phase, a majority of the cells were observed in the
Figure 6. (a) The growth curve. The relative number density of the sample was measured by counting the number of cells analyzed during the samplingperiod and by setting the number density of the first sample to 1. (b) The size distribution of growingE.coli culture. The forward-angle light-scatter intensitywas collected every 10 min to characterize the size distribution. (c) Mean intensities of light scatter (correlated with cell size; filled triangles) andfluorescence (open diamonds) of the population changed over the course of cell growth. During exponential growth, cell size increased while proteincontentdecreased. The reverse trend was observed in the stationary phase. (d) The time evolution of the fluorescence intensity distributions is represented inisometric and contour plots. The majority of the cells were nonfluorescent during exponential growth. Cells became increasingly more fluorescent duringlate exponential/stationary phase, until, at the end of the experiment, two populations could be distinguished.
ZHAO ET AL.: ON-LINE FLOW CYTOMETRY 615

G1 phase (Fig. 7c). DNA distributions obtained were com-pared with autofluorescence measurements on fixed and de-natured cells that had not been stained. Autofluorescencedistribution is clearly unimodal, and well separated from thestained distributions (Fig. 7c). In comparison, staining didnot affect light-scatter intensity measurements, hence FALSdistributions of unstained and stained cells were identical(Fig. 7a). DNA distributions for three replicate sampleswere also found to be statistically identical, ensuring repro-ducibility of the staining process (KS test; Neter, 1988).Because the entire process is automated, it is easy to envi-sion the use of more complicated staining protocols to tagand quantitate other cellular components also.
DISCUSSION
To determine the state of a growing cell culture, conven-tional monitoring systems typically evaluate measurablequantities of the abiotic phase from which the state of theculture is inferred. Direct measurement of the physiologicalstate is usually not possible because quantitative methods torapidly assay the composition of the biomass are limited.Furthermore, the properties of individual cells are differentand distributed over a range of physiological states. There-fore, population average data provide only limited informa-tion, and accurate information must be sought at the single-cell level.
Fredrickson et al. (1967) and Ramkrishna et al. (1968)proposed a general mathematical framework, known aspopulation balance theory, to describe cell growth and itsinteraction with the environment (see also Ramkrishna,1979, 1985). In this theory, the state of individual cells isspecified by the physiological state vector—a collection ofstate properties such as cell size, protein content, or DNAcontent. The resulting population balance equations are es-sentially number balances on individual cells of a popula-tion, which keep track of, not only the generation and dis-appearance of cells, but also of the continuous change in theidentity of cells due to physiological growth processes. Thismodeling framework (known as corpuscular and structured)most realistically represents the evolution of a heteroge-neous microbial population. Versions of this model havebeen used to extract growth parameters from single-cellproperty distributions obtained using flow cytometry (Dienand Srienc, 1991; Kromenaker and Srienc, 1991, 1994a–c).However, these analyses were performed off-line for specialcases. In general, it has been difficult to apply the popula-tion balance model to real microbial processes due to lack ofexperimental data that would permit identification of modelparameters. Such data could possibly be generated by flowcytometry interfaced with appropriate instrumentation foron-line sample processing and analysis.
Hence, we designed and constructed a versatile andmodular flow injection–flow cytometry (FI-FCM) system.To display the details of information that can be obtained,the system was used to monitor the heterogeneity of proteinexpression in anE.coli cell population. The results clearlyreveal the need for single-cell analysis, because cellularcontent of even a single component such as Gfp content wasdistributed in the population. Frequent, automated samplingpermitted observation of smooth trends of cellular phenom-ena. These data could be used to generate accurate estimatesof the kinetics of transient events. Furthermore, it has beenshown that the system can be used to monitor long-termfermentation processes, during the course of which cell con-centrations would change significantly. Because the systemdoes not require any operator intervention, it is particularlysuitable for process monitoring and control applications.The data obtained can be used to determine not only specificrates of exponential growth, but also to determine the de-tailed physiological state distribution of the cell population.Additionally, single-cell growth parameters can be evalu-ated. To better define the composition of single cells, therange of cellular components that can be monitored can beexpanded by taking advantage of the design of our micro-chamber, which permits on-line cell fixation, and staining,as we have demonstrated.
The examples presented demonstrate that the developedsystem represents a powerful tool for studying cell physi-ology at a level of detail that was not previously possible.Moreover, the FI-FCM system will be advantageous formonitoring bioreactors in studies involving transient growthphenomena, estimation of cellular kinetics, or study of syn-chronous or cyclic trends that might not be observed with
Figure 7. (b) A bivariate histogram of DNA content and forward-anglelight-scatter intensity (FALS) of a late exponentialS. cerevisiaeculture.The two subpopulations observed correspond to cells in the G1 and G2 cellcycle phases. (c) DNA content distribution of three replicate samples ofS.cerevisiaecells (solid line, Y2 axis) are compared with autofluorescencemeasurements of a fixed but unstained population (dashed line, Y1 axis).DNA distributions were obtained by staining with MI (see text). All dis-tributions are normalized to unit area for ease of comparison. Autofluo-rescence distribution (shown on a slightly different scale) is clearly uni-modal, and well separated from DNA distributions. (a) However, stainingdoes not affect light-scatter intensity measurements, and FALS distribu-tions of stained and unstainedS.cerevisiaecells are identical.
616 BIOTECHNOLOGY AND BIOENGINEERING, VOL. 62, NO. 5, MARCH 5, 1999
infrequent sampling. The system thus has significant poten-tial in biotechnology for the monitoring of microbial popu-lations, without the need for excessive manual intervention.
This work was supported partially by the National Science Foun-dation (BES-9708146) and by a seed grant from the BiologicalProcess Technology Institute, University of Minnesota.
References
Blankenstein G, Scampavia LD, Ruzicka J, Christian GD. 1996. Coaxialflow mixer for real-time monitoring of cellular responses in flow in-jection cytometry. Cytometry 25:200–204.
Cubitt AB, Heim R, Adams SR, Boyd AE, Gross LA, Tsien RY. 1995.Understanding, improving and using green fluorescent proteins.Trends Biochem Sci 20:448–455.
Dien BS, Srienc F. 1991. Bromodeoxyuridine labeling and flow cytometricidentification of replicating Saccharomyces cerevisiae cells: Lengthsof cell cycle phases and population variability at specific cell cyclepositions. Biotechnol Prog 7:291–298.
Dunlop EH, Ye SJ. 1990. Micromixing in fermentors: Metabolic changesin Saccharomyces cerevisiae and their relationship to fluid turbulence.Biotechnol Bioeng 36:854–864.
Fowler G, Dunlop EH. 1989. Effects of reactant heterogeneity and mixingon catabolite repression in cultures of Saccharomyces cerevisiae. Bio-technol Bioeng 33:1039–1046.
Fredrickson AG, Ramkrishna D, Tsuchiya HM. 1967. Statistics and dy-namics of procaryotic cell populations. Math Biosci 1:327–374.
Hall BG. 1995. Adaptive mutations in Escherichia coli as a model for themultiple mutational origins of tumors. Proc Natl Acad Sci USA 92:5669–5673.
Kelley KA. 1989. Sample station modification providing on-line reagentaddition and reduced sample transit time for flow cytometers. Cytom-etry 10:796–800.
Kromenaker SJ, Srienc F. 1991. Cell-cycle-dependent protein accumula-tion by producer and nonproducer murine hybridoma cell lines. Apopulation analysis. Biotechnol Bioeng 38:665–677.
Kromenaker SJ, Srienc F. 1994a. Cell cycle kinetics of the accumulation ofheavy and light chain immunoglobulin proteins in a mouse hybridomacell line. Cytotechnology 14:205–218.
Kromenaker SJ, Srienc F. 1994b. Effect of lactic acid on the kinetics ofgrowth and antibody production in a murine hybridoma: Secretionpatterns during the cell cycle. J Biotechnol 34:13–34.
Kromenaker SJ, Srienc F. 1994c. Stability of producer hybridoma cell linesafter cell sorting: A case study. Biotechnol Prog 10:299–307.
Lindberg W, Ruzicka J, Christian GD. 1993. Flow injection cytometry: Anew approach for sample and solution handling in flow cytometry.Cytometry 14:230–236.
Munch T, Sonnleitner B, Fiechter A. 1992. The decisive role of the Sac-charomyces cerevisiae cell cycle behaviour for dynamic growth char-acterization. J Biotechnol 22:329–351.
Natarajan A, Subramanian S, Srienc F. 1998. Comparison of mutant formsof the green fluorescent protein as expression markers in Chinesehamster ovary (CHO) and Saccharomyces cerevisiae cells. J Biotech-nol 62:29–45.
Neter J, Wasserman W, Whitmore GA. 1988. Applied statistics. 3rd edi-tion. Boston: Allyn and Bacon.
Omann GM, Coppersmith W, Finney DA, Sklar LA. 1985. A convenienton-line device for reagent addition, sample mixing, and temperaturecontrol of cell suspensions in flow cytometry. Cytometry 6:69–73.
Pennings A, Speth P, Wessels H, Haanen C. 1987. Improved flow cytom-etry of cellular DNA and RNA by on-line reagent addition. Cytometry8:335–338.
Ramkrishna D. 1979. Statistical models of cell population. In: Ghose TK,Fiechter A, Blakerbrough N, editors. Advances in biochemical engi-neering. New York: Springer. p 47.
Ramkrishna D. 1985. The status of population balances. Rev Chem Eng3:49–95.
Ramkrishna D, Fredrickson AG, Tsuchiya HM. 1968. On relationshipsbetween various distribution functions in balanced unicellular growth.Bull Math Biophys 30:319–323.
Reed AL. 1990. Flow injection analysis in bioprocess control. BioprocessTechnol 6:221–241.
Ruzicka J, Hansen EH. 1975. Flow injection analysis. Anal Chim Acta78:145–163.
Ruzicka J, Hansen EH. 1988. Flow injection analysis. 2nd edition. NewYork: Wiley.
Ruzicka J, Lindberg W. 1992. Flow injection cytoanalysis. Anal Chem64:537–544.
Sambrook J, Maniatis T, Fritsch EF. 1989. Molecular cloning: A laboratorymanual. 2nd edition. Cold Spring Harbor, NY: Cold Spring HarborLaboratory Press.
Srienc F, Dien BS. 1992. Kinetics of the cell cycle of Saccharomycescerevisiae. Ann NY Acad Sci 665:59–71.
Subramanian S, Srienc F. 1996. Quantitative analysis of transient geneexpression in mammalian using the green fluorescent protein. J Bio-technol 49:137–151.
Taylor G. 1953. Dispersion of soluble matter in solvent flowing slowlythrough a tube. Proc R Soc Lond (Ser A) 219:186.
Zubay G. 1993. Biochemistry. Melbourne, Australia: William Brown.
ZHAO ET AL.: ON-LINE FLOW CYTOMETRY 617