A Final Report To NOAA: Office of Ocean and Coastal ...€¦ · A Final Report To NOAA: Office of...
49
PALEOENVIRONMENT OF ELKHORN SLOUGH AND SURROUNDING WETLAND HABITATS: A GEOLOGICAL STUDY USING AN ECOLOGICAL APPROACH . ( A Final Report To NOAA: Office of Ocean and Coastal Resource Management By Michelle Ingram Hornberger May 1991 '
Transcript of A Final Report To NOAA: Office of Ocean and Coastal ...€¦ · A Final Report To NOAA: Office of...

PALEOENVIRONMENT OF ELKHORN SLOUGH AND
SURROUNDING WETLAND HABITATS: A GEOLOGICAL STUDY USING
AN ECOLOGICAL APPROACH
. (
A Final Report To NOAA:
Office of Ocean and Coastal Resource Management
By
Michelle Ingram Hornberger
May 1991
'

ABSTRACf
Elkhorn Slough is a tidally influenced coastal embayment located in northern Monterey
County, in the central region of Monterey Bay. While various studies in the Slough have
described the longterm geological history and very recent ecological conditions, this paper
is an attempt to bridge the gap between geological and ecological studies, using data from
deep and shallow sediment cores, recorded human history and by comparing older
fossilized communities to those found in existing coastal wetlands. Shell fragments,
microfossils, organic debris, and sediment grain size are each indicative of a particular type
of environment and were used to describe the environmental changes. These data indicate
that the modem Elkhorn Slough was formed about 10 thousand years ago (kya) when
rising sea level invaded the Elkhorn River Channel. From 6 kya to present, sedimentation
rates exceeded sea level rise and salt marshes colonized mudflats. The native oyster, Ostrea
lurida, dominated benthic communities at the slough mouth from 1~4 kya when shallow
open water habitats were most widespread. Clam communities were also common at the
mouth from 7 kya to present A unique gastropod community. occurred throughout the
slough around 3.5 kya, after the decline of oyster communities. Salt water did not
regularly invade the northeastern region of Elkhorn Slough, allowing freshwater
communities to develop 4 kya and persist to the present. Salt water periodically influenced
the eastern region of Moro Cojo Slough creating brackish water conditions from 5-l kya.
Neither the temporal occurrences or rate of occurrence of communuties displayed a
particular pattern associated with ecological succession, suggesting that the colonization of
the shoreline by a rising sea created a variable pattern of community distribution.
ii

ACKNOWLEDGEMENTS
I would like to express my appreciation to the members of my committee who made
this project possible: The chairman of my committee, Mike Ledbetter, for providing the
necessary scientific guidance throughout the course of this project; John Oliver for
suggesting the topic and initiating discussions with an interesting point of view; and Dave
Schwartz, for offering his field expertise and geological knowledge of Elkhorn Slough.
Several people were responsible for helping me identify the seeds and pollen found
in my cores, including David Adam of the U.S. Geological Survey and David Bruck of
San Jose State University. I gratefully acknowledge their time, assistance and efforts.
I would like to thank the California Division of Transportation (CAL TRANS) and
the consulting firm of Dames and Moore for allowing me to sub-sample a series of cores
collected along Highway 1. They opened their laboratory to me and provided me with an
abundance of material that would have otherwise been difficult to obtain.
Field work was an important aspect in the collection of data and I was fortunate
enough to have field assistants with a healthy curiosity of what lies beneath the slough.
Special thanks are extended to Mark Silberstein, Tom Okey, Hunter Lenihan, Kim Kiest,
Peter Slattery, Dave Schwartz and John Oliver for often putting up with less than desirable
conditions in the murky mudbanks of Elkhorn Slough. Because of their support and
efforts, I was able to complete this project in a timely fashion.
Special thanks are extended to all the faculty, staff and students of Moss Landing
Marine Laboratories who gave me support throughout my stay at Moss Landing, in
particular Sheila Baldridge and Sandi O'Neil for their ability and interest in tracking down
iii

references, and Lynn McMasters who helped me pull together my figures and tables in an
artistic and informative fashion.
I gratefully acknowledge the Elkhorn Slough Foundation and the California
Department of Fish and Game who provided me with the necessary permits to access my
core locations. This research was supported by funds from NOAA, Office of Ocean and
Coastal Resource Management, Grant# NA88AA-D-CZ027. Additional support was
provided by the Lucille and David Packard Foundation and the Myers Oceanographic Trust
Fund.
IV

TABLE OF CONTENTS
ABSTRACT
ACKNOWLEDGEMENTS
LIST OF FIGURES AND TABLES
IN1RODUCTION
MATERIALS AND METIIODS
OCCURRENCE OF PALEOENVIRONMENTAL INDICA TORS
ELKHORN SLOUGH
MORO COJO SLOUGH
AREAL EXTENT OF COMMUNITIES
SEDIMENTATION RATES
DISCUSSION
Sillv1MARY
REFERENCES CITED
APPENDICES
v
'•
ii
iii
v
1
4
6
6
14
19
23
25
29
31
33

Fi~ure
1.
2.
3.
4.
5.
6.
7.
8.
1.
LIST OF FIGURES AND TABLES
Location map of coring stations in Elkhorn Slough and Moro Cojo Slough.
Vertical distribution of major ecological communities and habitats identified in cores from Elkhorn Slough. ·
Percent of organic debris, foraminifera and shell fragments in sub-samples from Elkhorn Slough and Moro Cojo Slough
Vertical distribution of major ecological communities and habitats identified in cores from Moro Cojo Slough.
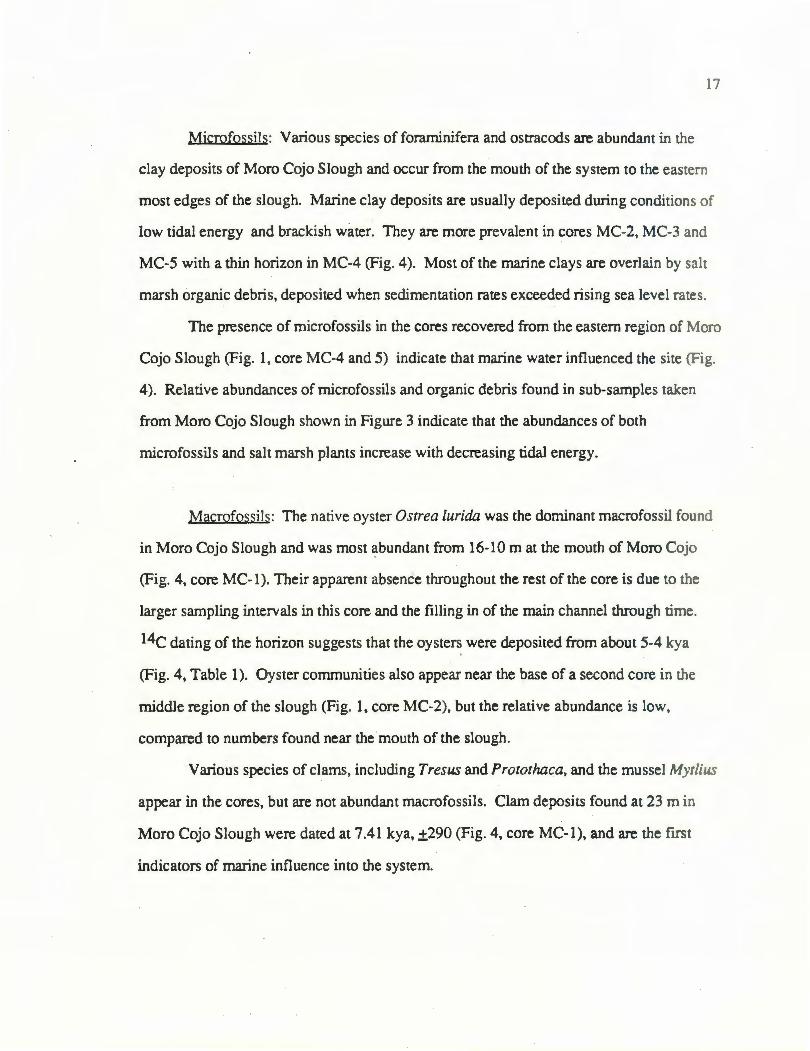
Schematic diagram showing the suggested areal extent of Oyster communities in Elkhorn Slough and Moro Cojo Slough between 10 kya and 4 kya.
Schematic diagram showing the estimated areal extent of Clam communities in Elkhorn Slough and Moro Cojo Slough between 8 kya and 3 kya.
Schematic diagram showing the estimated areal extent of Assiminea and fresh water communities in Elkhorn Slough and Moro Cojo Slough 4 kya.
Sediment accumulation rates in Elkhorn Slough and Moro Cojo Slough based on core data from study site over the past 10 kya. Sedimentation rates are compared with Holocene sea-level rise.
Absolute ages and sediment accumulation rates based on 14c analysis of shell fragments and peat deposits.
Vl
~
3
7
11
15
20
21
22
24
12
INTRODUCilON
California coastal wetlands are dynamic ecosystems which were created during the
last rise in sea level, about 10 thousand years ago (kya). These estuarine environments
have held the interest of both geologists and ecologists alike; geologists studying the
systems on a scale of tens of thousands of years, and ecologists investigating a period of
perhaps .tens of years. Geological investigations of various wetland systems throughout
the world have focused primarily on the sedimentary record (Frost, 1988; Wanless et al.,
1988; Reed, 1989; Wood et al., 1989; and Flethcer et al., 1990), lithologic and fossil
record (Lohmar et al., 1980: Schwartz et al., 1986), and rise in sea level (Atwater et al.,
1979; Ellison, 1989). These studies cover time spans of up to 18 kya and focus on the
geologic events which created the estuarine environments that we see today.
Examples of long term ecological research, or "successional" studies of estuarine
environments are few and usually cover a period of only a few years (e.g., Redfield, 1971;
Zedler, 1977), with the most being a period of perhaps a decade (Macginite, 1935). These
relatively shon term investigations focus predominantly on ecological conditions which
exist today, leaving a gap between the long term geological studies and the shon term
ecological research. Bridging the gap may be a useful step towards developing a historical
model with imponant application for future wetland restoration and enhancement. With
information based on where a system has been in the past, informed management decisions
can be made.
The few studies that have attempted to bridge the gap between geology and ecology
have focused on biological (Redfield, 1971 ), geological (Huntley and Prentice, 1988), or
chemical (Ford, 1990) aspects of estuarine development. One example of a study that
attempts to bridge this gap was conducted in a terrestrial environment ~ Indiana (Jackson,
Futyma and Wilcox, 1988), far removed from any marine influences of the open coast.


MATERIALS AND METI-IODS
During 1989, a series of deep and shallow sediment cores we
Slough and Moro Cojo Slough (Fig. 1). Sample sites were chosen t<
middle and back of each slough. In order to determine the more recen
conditions, a hand-auger 3 em in diameter and 7 meters long was uset
sediment cores. During the summer of 1989, California Transportatior
conducted a Highway 1 improvement study which required collecting t
~40 m) along specific sites near the highway. Sub-samples were obtai!
cores at approximately every m~ter. A commercial drill rig was hired in
complete the series of deep cores in Elkhorn Slough and Moro Cojo Slou
were sub-sampled at half-meter intervals.
Samples were split into 10 gram sub-samples, dried at 50 ·c and p1
solution (0.5g!l) to defloculate the clay particles. After soaking for 24 how
was washed through a 63 1J. sieve. In accordance with common micropaleo
standards, the >631J. fraction was dried and split into approximately 300 gn
samples, where numbers of microfossils, macrofossils, organic debris and fc
remains were counted and recorded. Marine indicators such as foraminifera a
are often associated with marine clay, and indicate low energy environments(. \
1983). Larger shell fragments from mollusks, specifically oysters ( Osrrea /ur\
(Prototheca staminea, Tresus nurralli, and Macoma spp.) and small gastropods
californica) were identified using an illustrated key (Keen and Coan, 1974; and\
al., 1981 ); root material and other fossilized plant remains were identified to the
possible taxanomic order. \
Radiometric age determination ( 14c ) of selected shell fragments and peal I
was carried out by Krueger Enterprises in Cambridge, Massachusetts. Samples
' N
\
M


1
-E -
3
Mouth I
:~:::0 .aCh l6935 yrs. BP ,_. .. ::: (±315 yrs.)
W?# .:n.,h :Vi"' .. ::::18525 yrs. BP :::;:;:::;: (±325 yrs.) :g·g:
ES-1*
I <::;,~
~bf?.
~~ :n n (1"~'(:
"~~ · · · ~· 1-t; ~;.
ES-2* ES-3*
Middle --. Back .----------- - I
4945 yrs. BP (± 165 yrs.)
Y''t'
. ·~ · '1' . .., •-( ''f 't''f't ~ ..
Elkhorn Slough
f Assiminea
0 \l Ostrea lurida
~ Clams
~ Fresh water peat
ES-4
llliiJ Salt marsh
D Marine mudbank
l//:J Marine sand
~ Non-marine coarse sand m·.:-~
~~ Non-marine sand
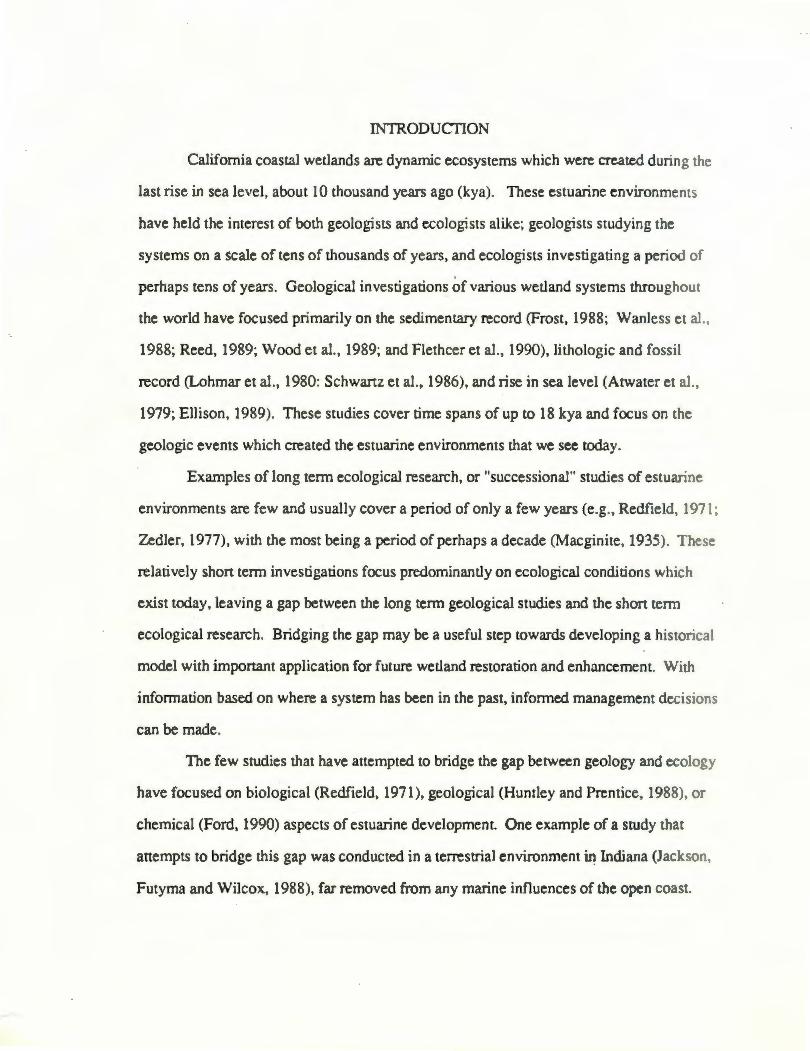
ES-5 ES-6 ES-7 Figure 2: Vertical distribution ol major ecological communitios and habitats identifi9d in coros from Elkhorn Slough. Core ES-7
collected and analyzod by D. Schwartz in 1984. r indicates coros recovered by CAL TRANS). Table 1 lists standard error lor C'• dates.
......

macrofossil throughout the core, but two deposits of clams were found at 5 m and 27 m in
the core (Fig. 2).
8
The upper 6 m of core ES-3 consisted of a marine clay deposit underlain by a
horizon of fresh water peat near 7 m (Fig. 2). A salt marsh deposit lies below the peat and
continues to a depth of about 25 m where it is underlain by a non-marine sand. Clam
deposits, including Protothaca and Macoma, were common in this core and were found at
depths ranging from 25 to 10 meters, Ostrea lurida fragments however only occurred at 23
meters.
Middle: Core ES-4 reached a depth of 11 m with the top 4 m consisting of a salt
marsh deposit underlain by marine clay and microfossils. Small gastropods identified as
Assiminea were found at depths of 5 m, but other shell fragments were not present in this
core (Fig. 2).
~: The three cores that were recovered in the northeastern edge of Elkhorn
Slough, showed similar sequences with a non-marine peat deposit underlain by a poorly
sorted non-marine sand (Fig. 2, cores ES-5, 6 and 7). There were no microfossils or
macrofossil deposits found in these cores.
Sediment Grain Size and T:xpe: Most deep cores revealed a general fining upward
sequence of sediments ranging from the poorly sorted non-marine gravelly sands found at
37 m at the mouth of Elkhorn Slough, to the fine-grained silty marine clay common
throughout the system. These grain- size distributions are similar to the quantitative grain
size analysis of cores analyzed by Schwartz (1983) and define the boundaries which
distinguish the non-marine environment from the marine environment.
9
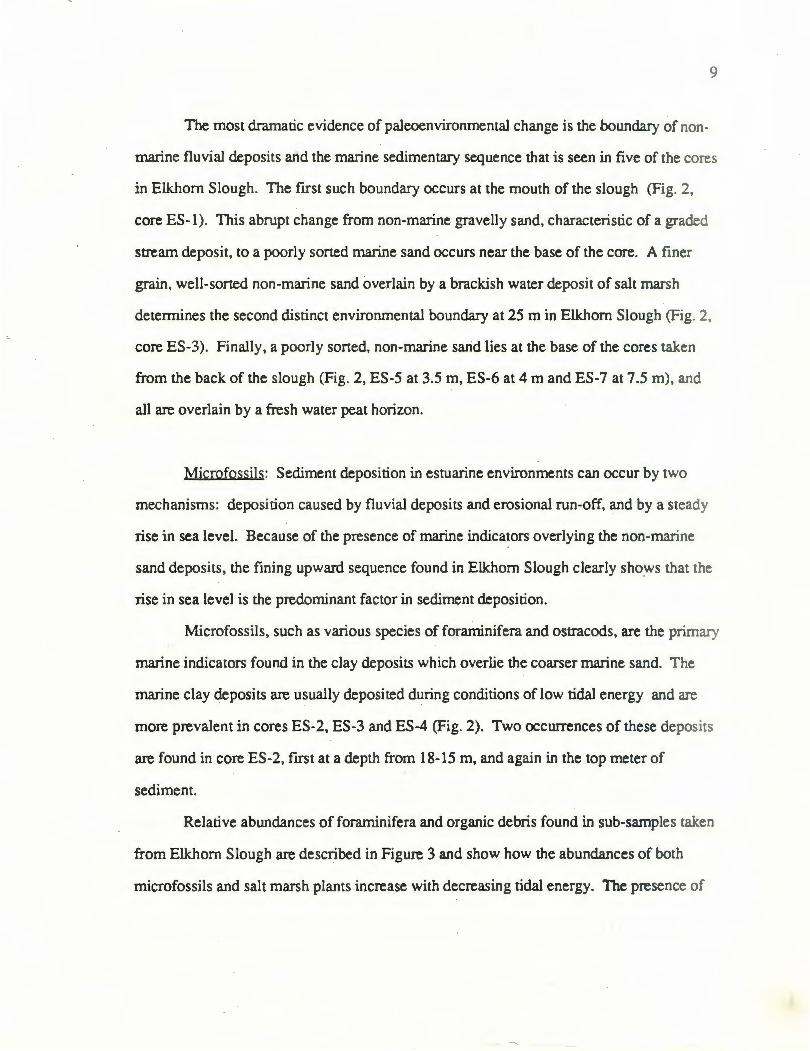
The most dramatic evidence of paleoenvironmental change is the boundary of non
marine fluvial deposits and the marine sedimentary sequence that is seen in five of the cores
in Elkhorn Slough. The first such boundary occurs at the mouth of the slough (Fig. 2,
core ES-1). This abrupt change from non-marine gravelly sand, characteristic of a graded
stream deposit, to a poorly sorted marine sand occurs near the base of the core. A finer
grain, well-sorted non-marine sand overlain by a brackish water deposit of salt marsh
determines the second distinct environmental boundary at 25 m in Elkhorn Slough (Fig. 2,
core ES-3). Finally, a poorly sorted, non-marine sand lies at the base of the cores taken
from the back of the slough (Fig. 2, ES-5 at 3.5 m, ES-6 at 4 m and ES-7 at 7.5 m), and
all are overlain by a fresh water peat horizon.
Microfossils: Sediment deposition in estuarine environments can occur by two
mechanisms: deposition caused by fluvial deposits and erosional run-off, and by a steady
rise in sea level. Because of the presence of marine indicators overlying the non-marine
sand deposits, the fining upward sequence found in Elkhorn Slough clearly sho~s that the
rise in sea level is the predominant factor in sediment deposition.
Microfossils, such as various species of foraminifera and ostracods, are the primary
marine indicators found in the clay deposits which overlie the coarser marine sand. The
marine clay deposits are usually deposited during conditions of low tidal energy and are
more prevalent in cores ES-2, ES-3 and ES-4 (Fig. 2). Two occurrences of these deposits
are found in core ES-2, first at a depth from 18-15 m, and again in the top meter of
sediment.
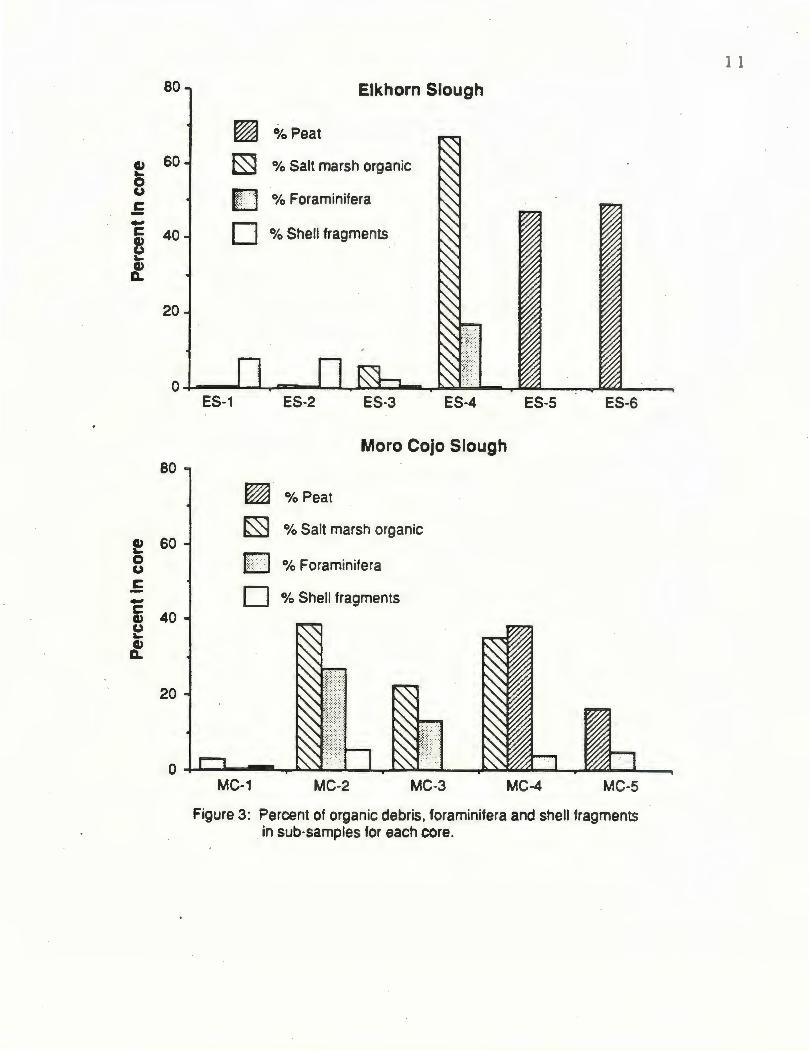
Relative abundances of foraminifera and organic debris found in sub-samples taken
from Elkhorn Slough are described in Figure 3 and show how the abundances of both
microfossils and salt marsh plants increase with decreasing tidal energy. The presence of

10
foraminifera and ostracods in the core recovered from the middle of Elkhorn Slough (Fig.
1, core ES-4) indicate that this was probably a low energy environment as sea level was
rising. Nearly 70% of the sub-sample extracted from the core consisted of forami nifera,
and almost 20% of the sub-sample consisted of marine organic debris (Fig. 3).
Macrofossils: Oysters and clams make up the distinct ecological communities
which eXisted in Elkhorn Slough over the last 10 kya. The oyster Ostrea lurida is the most
abundant macrofossil present in the cores, occurring predominantly at the mouth of the
system, but is found to exist as far back as Bennett Slough (Fig. 1 and 2). The large
abundances of shell fragments throughout core ES-1 suggests the open water subtidal
conditions near the ocean were the prime habitat for this oyster (Appendix 1). The first
shell horizon appearing in ES-1 occurs at 36m and has a 14c age of 10.35 kya, ±375 (Fig
2, Table 1). The oysters appear to be the dominant community in the cores until about 6
kya, when the channels began to fill in with sediment resulting in a more narrow
distribution pattern in the restricted channel.
Scattered occurrences of Ostrea lurida were found in the relatively low energy
environment of Bennett Slough (Fig. 2, cores ES-2 and ES-3). A horizon of oysters
found at 20m in core ES-3 was the last occurrence of oysters in the cores recovered from
Elkhorn Slough, and suggests that the channel began to fill in at Bennett Slough at
approximately 7 kya.
Various types of clams are the second most abundant macrofossil present
throughout Elkhorn Slough, ranging from as deep as 30m to as shallow as 5 m, and
covering a time span in the cores from about 8-4 kya. Two occurrences of clams (Macoma
and Tresus) were found at 25m and 18 m (Fig. 2, core ES-1 ). Clam communities become
80
! 60 0 u .E -c 40 G,)
~ :. 20
0
80
G) 60 ... 0 u .E -c
40 G,) u ... G)
I:L
20
Elkhorn Slough
~ %Peat
~ % Salt marsh organic
I ] % Foraminifera
D % Shell fragments
ES-1 ES-2 ES-3 ES-4
Moro Cojo Slough
~ %Peat
~ % Salt marsh organic
i3 % Foraminifera
D % Shell fragments
MC-1 MC-2 MC-3
ES-5 ES-6
MC-4 MC-5
Figure 3: Percent of organic debris, foraminifera and shell fragments in sub-samples for each core.
1 1

Sediment Sample Depth (m) 14c Date accumulation rate
ELKHORN SLOUGH:
ES-1 36.0 10,350, + 375 6.0 mm/yr.
ES-1 25.0 8525, ± 325 4.4 mm/yr.
ES-1 18.3 6935, ± 315 2.6 mm/yr.
ES-6* 3.3 4945, ± 165 0.67 mm/yr.
MORO COJO SLOUGH:
MC-1 22.3 7410, ± 290 5.3 mm/yr.
MC-1 10.6 5235, ± 265 2.0 mm/yr.
MC-2 5 .0 3460, ± 850 1.4 mm/yr.
· MC-5* 3.5 3780, ± 145 0.93 mm/yr.
Table 1: Absolute ages and sediment accumulation rates based on 14c analysis of shell fragments and peat deposits(* indicates peat sample). See Figure 1 for sample locations.
12

13
more abundant in cores ES-2 and ES-3, occurring near the base of core ES-2, and near the
non-marine/m~ne boundary in core ES-3 (Fig. 2). Their disappearance from the cores at
4 kya indicates that like the oysters, the clam's distribution was limited to the width of the
channel.
A small community of gastropods identified as the brackish water snail Assiminea ,
was found in the middle of the system at a depth of about 3-4m (Fig. 2, core ES-4). The
presence of Assiminea suggests that this part of the slough was probably a salt marsh at
about 4 kya.
Fresh Water Peat Deposits: Evidence of fresh water communities first appear in the
fossil record about 5 kya and are primarily found in the outer edges near the northeastern
slough (Fig. 2, cores ES-5, ES-6 and ES-7). The fresh water peat, named because of the
absence of marine indicators, overlies the non-marine sand deposited by an ancient river
bed. 14c dating of a peat layer in core ES-6 suggests that this boundary lies at
approximately 5 kya (Table 1), when fresh water influx, combined with high rates of
sedimentation, created a fresh water marsh that existed until historical times (Oliver et al.,
1990).
A fresh water peat horizon from 7-5 m indicates that a fresh water spring invaded
an area in Bennett Slough about 4 kya for a brief period in geologic time (Fig. 2, core ES-
3). Historical accounts of fresh water springs in Elkhorn Slough suggest that fresh water
. probably occurred sporadically throughout the slough d~ng the last several thousand
years.

14
Moro Cojo Slough
Paleoenvironmental Indicators in Sedimentary Cores
Mouth: The upper 4 m of core MC-1 was marine clay underlain by a well-sorted to
poorly sorted marine sand (Fig. 4). Macrofossil deposits were found throughout the core
and included a small muscle deposit at 9m, an oyster deposit between 10-16 m and a clam
deposit at 23 meters. Because of the absence of any marine indicators below 23 m, the
base of the core is probably a non-marine sand.
Middle: The upper 3 m of core MC-2 contained predominantly salt marsh organic
deposits underlain by marine clay to a depth of 13 meters (Fig. 4). Gastropod shells were
found in a thin horizon at 5 m (Fig. 4, core MC-2) and co-occurred with a deposit of salt
marsh seeds identified as Ruppia maritima (D. Adam, U.S. Geological Survey 1989, pers.
cornm.). Oyster shells were found in a marine clay deposit at 10-14 m and were underlain
by a poorly sorted non-marine sand at the base of the core (Fig. 4).
The second core recovered from the middle of the slough was similar to MC-2,
with the upper 2m consisting of salt marsh organic deposits underlain by marine clay (Fig.
3, core MC-3). Although the bore-hole collapsed before a distinct sand layer was found,
the base of the core became sandy, indicating that the same poorly sorted non-
marine sand horizon found in core MC-2 was probably near the base of core MC-3. The
gastropod Assiminea and Ruppia seeds were found at the 5 m horizon (Fig. 4).
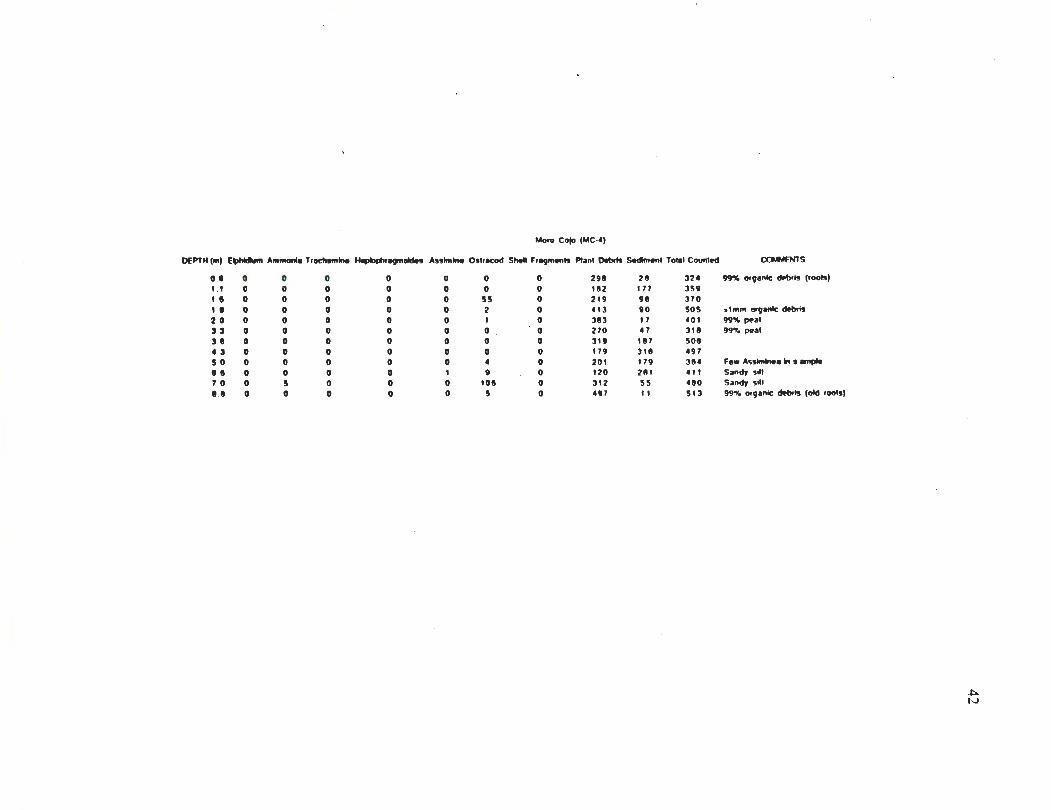
~: The upper 5 m of core MC-4 consisted primarily of a fresh-water peat
deposit, with a thin horizon of marine clay deposited at 1.5 meters (Fig. 4). The base of
MC-4 reached a depth of 7 m, and consisted mostly of salt marsh organic debris with some
occurrences of ostracods.

-E -L: -a. <1> ()
0
10
30
: ~ :;: ~: ~: ~ : -:-:-:-:-:·
::: ::~ 5235 yrs. BP (±265 yrs.)
MC-1*
Middle
3460 yrs. BP (±850 yrs.)
MC-2
:a 3780 yrs. BP
(±145 yrs.)
Moro Cojo Slough
~ Myfflus
f Assiminea
:.- Ruppia maritima
0 ~ Ostrea lurida
~ Clams
~~Salt Marsh
r:p I Marine mudbank
jt}~UI Marine sand
~ Fresh water peat ~ :o~ Non-marine sand
MC-3 MC-4 MC-5
Figure 4: Vertical distribution of major ecological communities and habitats in cores from Moro Cojo Slough.
(• Indicates cores recovered by CAL TRANS).· Table 1 lists standard error for C14 dates. -~

16
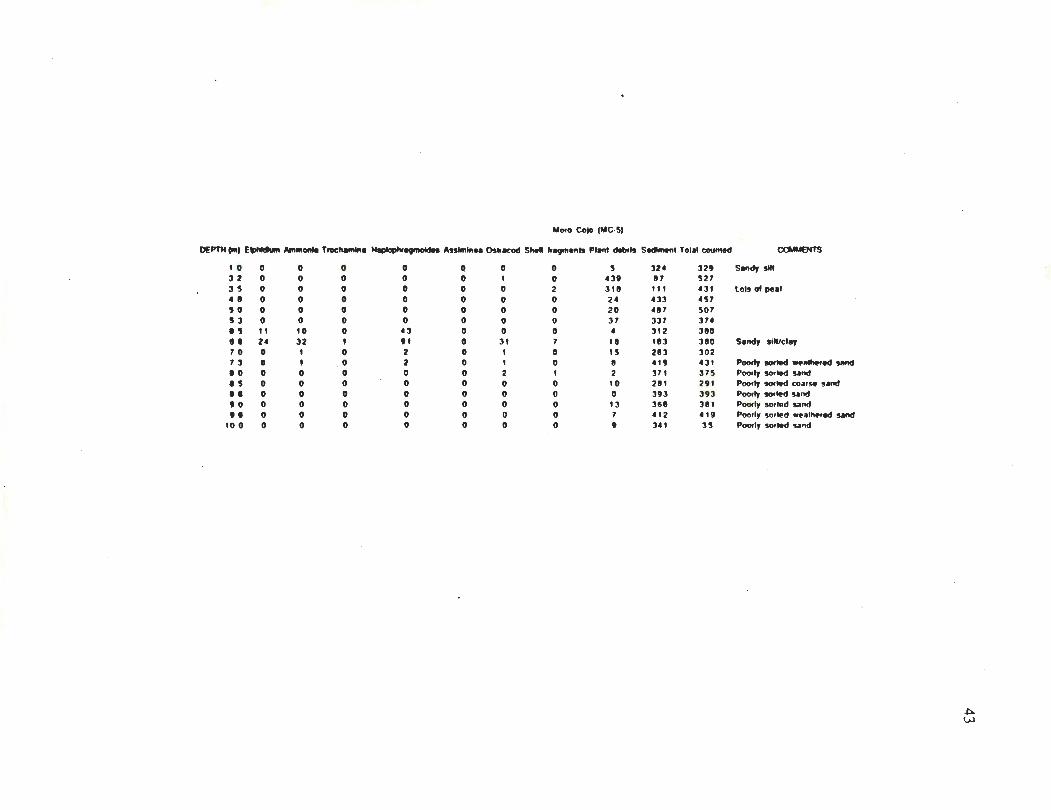
The core collected in the eastern most region of the slough (Fig. 4, core MC-5),
reached a depth of 9 m. The upper 6 m consisted of a fresh-water peat deposit underlain by
a 1 m horizon of marine clay. The base of this core contained a poorly sorted non-marine
sand deposit.
Sediment Grain Size and Type: The sedimentary deposits found in Moro Cojo
Slough showed a general fining upward sequence of grain size, from a non-marine flu vial
environment to a marine environment, similar to cores collected from Elkhorn Slough. The
transition of non-marine environments to marine environments was found in three of the
five cores recovered from Moro Cojo, .ranging from depths as deep as 23m and as shallow
as 7 m (Fig. 4).
The base of the core collected near the mouth of Moro Cojo Slough (Fig. 1)
consisted of a poorly sorted non-marine sand, grading upward into a finer-grained marine
sand (Fig. 4, core MC-1) consistent with the known rise in sea level during the past 10
kya. The age of a shell layer near the base of the non-marine/marine interface in MC-1 is
about 7.41 kya, suggesting that marine water did not invade this part of the system until
after it had reached Elkhorn Slough. While the coarse non-marine gravelly sands fou nd at
the base of the mouth of Elkhorn Slough appear to be absent in Moro Cojo, they may
actually lie at a deeper depth.
A poorly sorted weathered sand, probably from the Aromas Formation in the
surrounding hillsides, defines the non-marine/marine boundary near the base of core MC-2
(Fig. 4) and is overlain by the fine marine clays indicative of a low energy, estuarine
environment.
17
Microfossils: Various species of foraminifera and ostracods are abundant in the
clay deposits of Moro Cojo Slough and occur from the mouth of the system to the eastern
most edges of the slough. Marine clay deposits are usually deposited during conditions of
low tidal energy and brackish water. They are more prevalent in cores MC-2, MC-3 and
MC-5 with a thin horizon in MC-4 (Fig. 4). Most of the marine clays are overlain by salt
marsh organic debris, deposited when sedimentation rates exceeded rising sea level rates.
The presence of microfossils in the cores recovered from the eastern region of Moro
Cojo Slough (Fig. 1, core MC-4 and 5) indicate that marine water influenced the site (Fig.
4 ). Relative abundances of microfossils and organic debris found in sub-samples taken
from Moro Cojo Slough shown in Figure 3 indicate that the abundances of both
microfossils and salt marsh plants increase with decreasing tidal energy.
Macrofossil s: The native oyster Ostrea lurida was the dominant macrofossil found
in Moro Cojo Slough and was most ~bundant from 16-10 mat the mouth of Moro Cojo
(Fig. 4, core MC-1). Their apparent absence throughout the rest of the core is due to the
larger sampling intervals in this core and the filling in of the main channel through time.
14c dating of the horizon suggests that the oysters were deposited from about 5-4 kya
(Fig. 4, Table 1 ). Oyster communities also appear near the base of a second core in the
middle region of the slough (Fig. 1, core MC-2), but the relative abundance is low,
compared to numbers found near the mouth of the slough.
Various species of clams, including Tresus and Protothaca, and the mussel Mytlius
appear in the cores, but are not abundant macrofossils. Clam deposits found at 23 m in
Moro Cojo Slough were dated at 7.41 kya, ±290 (Fig. 4, core MC-1), and are the frrs t
indicators of marine influence into the system.

18
The mussel Mytilus appeared once in the core MC-1, but at the much shallower
boundary of 9 m. Mytlius may have been more abundant than the core data suggest as their
shells are commonly found in nearby Indian middens (Dietz and Hilderbrandt, 1986).
The small gastropod Ass imine a found in Elkhorn Slough was present in even
greater numbers in Moro Cojo Slough and was first seen in MC-2, again in MC-3 with a
few in MC-4, all lying at a depth of about 5 m (Fig. 4). Because of the low amount of
datable carbon in the gastropod shells, the standard error of the age is high (3.46 kya ±
850), but still provides a useful date which conforms to existing data.
Seeds of Ruppia maritima were found in the same horizon as the gastropod,
suggesting a brackish water environment in the middle of Moro Cojo Slough between 2-4
kya. The abundance of seeds decreases with increasing distance from the ocean, following
the same trend as the Assiminea.
fresh Water Peat Deposits: Non-marine peat deposits with thin horizons of marine
clay make up the fresh water communities near the eastern edges of Moro Cojo Slough
(Fig. 4, cores MC-4 and MC-5) from about 3.8 kya to present. The fresh water
community was inundated by marine water and convened back to a fresh water
environment (Fig. 4). The marine water was persistent enough to leave a permanent fossil
record, unlike Elkhorn Slough, where there was never enough direct flow into this area to
leave behind traces of its presence.
Areal Extent of Fossil Communities
Fossil communities have been divided into time slices to show how the structure of
the slough changed through time. These interpretations are based on core data and '
historical infonnation. Oyster communities in Elkhorn Slough and Moro Cojo Slough
from 10-5 kya are shown schematically in Figure 5. The range of oysters. is extended
fanher up the main channel because the known historical occurrence is well documented
(MacGinite, 1935; Gordon, 1979). Sea level was approximately 65 m lower than present
day conditions (Atwater et al., 1977) and the main channels of both Elkhorn Slough and
Moro Cojo Slough were much broader than today.
19
The distribution of clam communities from Elkhorn Slough and Moro Cojo Slough
from 8-3 kya is shown in Figure 6. Sea level had transgressed to 17 m offshore at 8 kya,
and infilling of the channels of Elkhorn Slough had begun.
Figure 7 shows the areal extent of both the gastropod community (Assiminea) and
the fresh water deposits at about 4 kya. The sea level was approximately 5 m funher
offshore than it is today (Atwater, et al., 1977) and the system looks much like its present
configuration.
\ :::10,000 - 4000 years B.P. \
\ Oyster Community Bl \
\ \
\ \
\ \
\
\ \
\ \
\ \
\
I I
I
1----65m 1•
Elkhorn Slough
More Cojo Slough
Figure 5: Schematic diagram showing the suggested areal extent of Oyster communities in Elkhorn Slough and Moro Cojo Slough between1 0,000 and 4000 years ago (black circles show core locations). Solid line is approximate coast line 1 0,000 years ago and dashed line rapresents present day coast line (Atwater et al. , 1 977).
20

\ \
Monterey Bay
\ \
\ \
= 8000-3000 years B. P.
\ \
Clam Community
\ \
\ \
\ \
\
I I
\
I I
I I
Elkhorn Slough
Moro Cojo Slough
~17m-f
Figure 6: Schematic diagram showing the estimated areal extent of clam communities throughout Elkhorn and Moro Cojo Slough. (black circles show core locations) . Dashed line is present day sea level, and solid line represents sea level8000 years ago .
21

= 4000 years B.P.
Assiminea
Fresh water ~
Elkhorn Slough
Monterey Bay
H Sm
Moro Cojo Slough
Figure 7: Schematic diagram showing the suggested areal extent of Assiminea and fresh water communities in Elkhorn and Moro Cojo Slough (black circles show core locaations). Dashed lines represent present sea level and solid line represents sea level 4000 years ago.
22

23
Sedimentation Rates
Sediment deposition in Elkhorn Slough and Mora Cojo Slough correlates closely
with the rise in sea level during the last 10 kya (Fig. 5), with sedimentation rates decreasing
through time. According to published sea level data along the California coast, sea level
rose quickly at a rate of 2 cm/yr between 10-6 kya and_slowed to about 0.1-0.2 cm/yr from
6 kya to present (Atwater et al., 1979).
Approximate sedimentation rates in both sloughs were calculated using the 14c •
dates from selected cores (Table 1), suggesting that between 10-8 kya sediment
accumulation rates at the mouth of Elkhorn Slough averaged about 6.0 mm/yr., slowing to
a rate of 4.4 mm/yr from 8-7 kya. Using the 14c date at 18m in core ES-1, the shallowest
sample at the mouth, the best sedimentation rate that can be calculated from 7 kya to present
is approximately 2.6 mm/year. Sedimentation rates were significantly lower in the
northeastern edge of Elkhorn Slough, averaging about 0.67 mm/year from 5 kya to
present.
Rates of sedimentation in Mora Cojo Slough followed the rise in sea level curve,
with an average sedimentation rate of 5.3 mm/year from 7-5 kya, decreasing to about 2.0
mm/yr between 5-3 kya (Fig. 5). As the sea level rise began to slow, sedimentation
decreased to about 1.4 mm/year during the last 3 kya (Fig. 5). Calculations of
sedimentation rates near the eastern edge of Mora Cojo Slough averaged 0.93 mm/year
during the last 3,780 kya, considerably slower than rates from the mouth of the slough.

Years, kya
0 2 4 6 8 10
R"2 • 0.95
10 -E -CD .. 0 u c c - 20 ~ -c. CD Q
30 Y2
• 0.35627 + 0.16524x R"2 • 0.91
40+-~~~~~--~~-r~~----~--~
0 1 2 3 4 5 6 7
Sedimentation Rate (mm/yr"1)
\ Sedimentation Rate .... --..... ~ 14 C Date
'Atwater Sea Level Curve
0 Elkhorn Slough
• Moro Cojo Slough
Figure 8: Sediment accumulation rates in Elkhorn Slough and Moro Cojo Slough based on core data from study site (Fig. 1) over the past 10 kya. Dotted line represents Holocene Sea Level rise in southern San Francisco Bay (Atwater et al., 1977).
24

DISCUSSION
Bridging the gap between long-tenn geological investigations and shon-tenn
ecological studies is necessary to develop a realistic historical model of community
development in coastal wetlands. The general characteristic of community development or
ecological succession are disputed (Odum, 1969; Drury and Nisbet, 1973; and Connell and
Slatyer, 1977). Two potential characteristics are a predictable sequence from an early to a
late or climax stage, and a predictable rate of succession for a community or habitat (Odum,
1969). Primary succession is said to occur in a new habitat that has not been previously
occupied by ecological communities. The colonization of a shoreline during a sea level
progression is an example of primary succession, but because these occurrences are
relatively rare and take a long time to complete, they are rarely observed Nevertheless,
primary successions are often thought to display best the characteristics of ecological
succession (Odum, 1969; Connel and Slatyer, 1977).
There was no one predictable sequence or rate of succession in the wetland
communities of Elkhorn Slough. Adjacent cores showed important differences in
community presence and distribution. For example, while some cores contained distinct
and persistent communities of Rip pia martima and Assiminea (e.g., Moro Cojo Slough),
other cores showed similar general sedimentary characteristics but this community was
absent. The major patterns observed in both Elkhorn Slough and Moro Cojo Slough were
not predictable, suggesting that they are dynamic systems. Variations occur over relatively
small spatial scales, between cores taken only hundreds of meters a pan.
Other investigators have noticed developmental stages and patterns in coastal
embayments such as the gradual fining upward sequence of sediment grain size and
colonization of marsh plants on mudflats (Redfield, 1971; Atwater, 1977; Lohmar et al. ,
1980; and Schwanz et al., 1986). Examples of similar sequences can be found in both

26
Elkhorn Slough and Moro Cojo Slough, but these occurrences appear to be unpredictable
and are highly variable. A similar study Jackson et al. (1988) also found no predictable
sequences or rate of succession in aquatic vegetation from dune ponds in Indiana.
Macrofossil stratigraphy and pollen data showed no significant changes between 3kya- 150
years, and determined that the rapid vegetational change at the 150 year boundary was
caused by local human disturbance rather than a natural shift between successional stages.
Oysters occurred throughout the cores collected near the mouth of both sloughs and
were among the first indicators of sea water invading Elkhorn Slough (Fig. 2, core ES- 1 ).
They persisted until historical times. While core data do no indicate extensive oyster
habitats after 4 kya, data collected from nearby Indian deposits (Dietz and Hilderbrandt,
1986) and historical observation (Gordon, 1979) indicate that the native oyster beds existed
until about the turn of the century. The apparent absence of oysters from the cores at 4 kya
show how the margins of the main channel slowly fllled in with sediment, shifting the
oyster community towards the main ch-annel.
Although their range primarily covers the broad open areas of shallow subtidal
environments that were created by the rising sea, small oyster communities were evident in
the more protected environment of Bennett Slough, an area of much lower tidal energy
(Fig. 1 and 2, core ES-3). The most abundant communities of oysters were found in the
marine sand deposits (Fig. 2 and 4, cores ES-1/2; MC-1), but oysters were also present in
mudbank environments. Oyster beds were apparently best developed in broad open areas
of shallow water.
Clam communities, like the oyster, follow no particular pattern or sequence that
supports the idea of a successional progression of organisms during the invasion of a rising
sea. Core data suggests that they appear at about 8 kya in both sloughs and persist in core
until approximately 2 kya, although they are also known to occur at the mouth of Elkhorn

27
Slough throughout this century (MacGinnite, 1935; Nybakken et al., 1977). Again, the
gradual filling in of the main channel as sedimentation rates exceeded rates in sea level rise
accounts for the apparent disappearance of clam communities in the cores.
The areal extent of clam communities is smaller than oyster beds and generally
occurred near the slough mouths, where tidal flushing is strong and constant. However,
their presence at the mouth of the systems do not exclude occurrences in more protected
and shallow water environments (Fig.2, core ES-3; Fig. 4, core MC-3). Clam
communities were found in both marine sand and sandy mud, suggesting that clams are not
confined to a particular sedimentary environment.
The gastropod Assiminea and seeds of Ruppia occurred at the 5 m horizon
throughout Moro Cojo Slough at 3.5 kya. The same community occurred in a more
restricted part of Elkhorn Slough. A morophologically and ecologically similar gastropod,
Tyronia imitator (California brackish water snail) lives on Ruppia in very shallow (usually
<1/2 m) in brackish water with relatively poor tidal circulation in Moro Cojo Slough today
(Kellogg, 1980). The Assiminea and Ruppia assemblage probably lived in similar
hydrologic conditions.
Although human activities prevent salt water movement into the back of Moro Cojo
Slough and Elkhorn Slough today (Gordon, 1979), the eastern margin of these systems
has undergone dramatic environmental fluctuations in the geologic past. Fresh water
marshes developed in a number of different patterns and sequences as their appearance
above, below and between marine deposits suggests that the environmental conditions over
the past 5 kya were dynamic. Some marshes originate on fluvial deposits (Fig. 2, core ES-
5,6 and 7) and persist until they were converted to salt water habitats by human
disturbances (Gordon, 1979). In the eastern region of Moro Cojo Slough, fresh water
marshes are also underlain by non-marine fluvial sand, but are replaced by brackish water
habitats for as long as I kya and then revert back to freshwater (Fig. 4, core MC-5 ). In
other areas, freshwater marshes emerge over extensive brackish water sequences, persist
for a period of about 2.5 kya, and are replaced by fresh water deposits (Fig. 4, core MC-
4). Spatially and temporally restricted freshwater communities also existed and were
probably developed near local springs (Fig. 2, core ES-3).
28
Although the succession of wetland communities shows little predictable sequences
or rates over the last 10 kya, the movement of salt water into Elkhorn Slough is a gradual
process. The non-marine gravely sands at the base of core ES-1 show that during the last
low stand of sea level, about 16-I8 kya (Beard et al., I982), a large river channel was
created in the western region of Elkhorn Valley (Schwartz et al., I986). Shells dated from
this core bottom indicate that sea level began to rise and inundate the mouth of Elkhorn
Slough about I 0.35 kya and poorly sorted marine sand was replaced with the fining
upward sequence of marine sediment common in estuarine environments (Atwater et al. ,
1979; Schwartz et al., I986). The hydrologic sequence of salt water invading Moro Cojo
Slough is similar to that of Elkhorn Slough, with a record of marine water invact.tng the
mouth at about 8 kya, reaching the middle of the slough at about 5 kya and unlike Elkhorn
Slough, reaching the eastern edge of the system on a consistent basis as recent as 1 kya.
Rates of sediment accumulation along the west coast of California are similar to the
rates calculated for Elkhorn Slough and Moro Cojo Slough and show no obvious
discrepancies from the expected norm (Atwater et al., 1977; Schwartz et al., 1986). A sea
level curve calculated from data collected in San Francisco Bay can be used to compare
sedimentation rates and dates of accumulations in Elkhorn Slough (Fig. 5). The data
follow the same general trend, with high rates of sedimentation with the rapid rise in sea
level, and slow rates of sedimentation with a decrease in rate of sea level rise.

SUMMARY
The Elkhorn Slough wetland system has undergone several physical and ecological
changes during the past 10 kya, when the rise in sea level changed a non-marine fluvial
environment into a tidally influenced coastal embayment. Development of ecological
communities during the past 10 kya, including oysters, clams, gastropods and fresh water
marshes occurred without predictable rates or sequences contrary to some models of
ecological succession (Odum, 1969). The most important pattern of habitat and community
development include:
1. About 10.35 kya sea level was approximately 65 m offshore of the present day shore
line when it invaded the mouth of an ancient river channel, creating an open-water marine
embayment. Large occurrences of oyster deposits near the mouth of Elkhorn Slough
suggest a well flushed, tidally influenced environment.
2. As sea level continued to rise at a rate of about 2.0 em/yr., Moro Cojo Slough was
inundated with marine water about 8 kya, changing from a primarily fresh water system to
a marine and brackish water environment. Evidence of clam communities near the mouth
suggest a well flushed, open water system.
3. Rates of sedimentation began to exceed rates of sea level rise about 6 kya, allowing salt
marshes to encroach upon the existing mudflats. Communities of both oysters and clams
were established in nearby Bennett Slough. Marine water invaded the middle region of
Moro Cojo Slough, depositing the marine clay associated with a low energy environment.
30
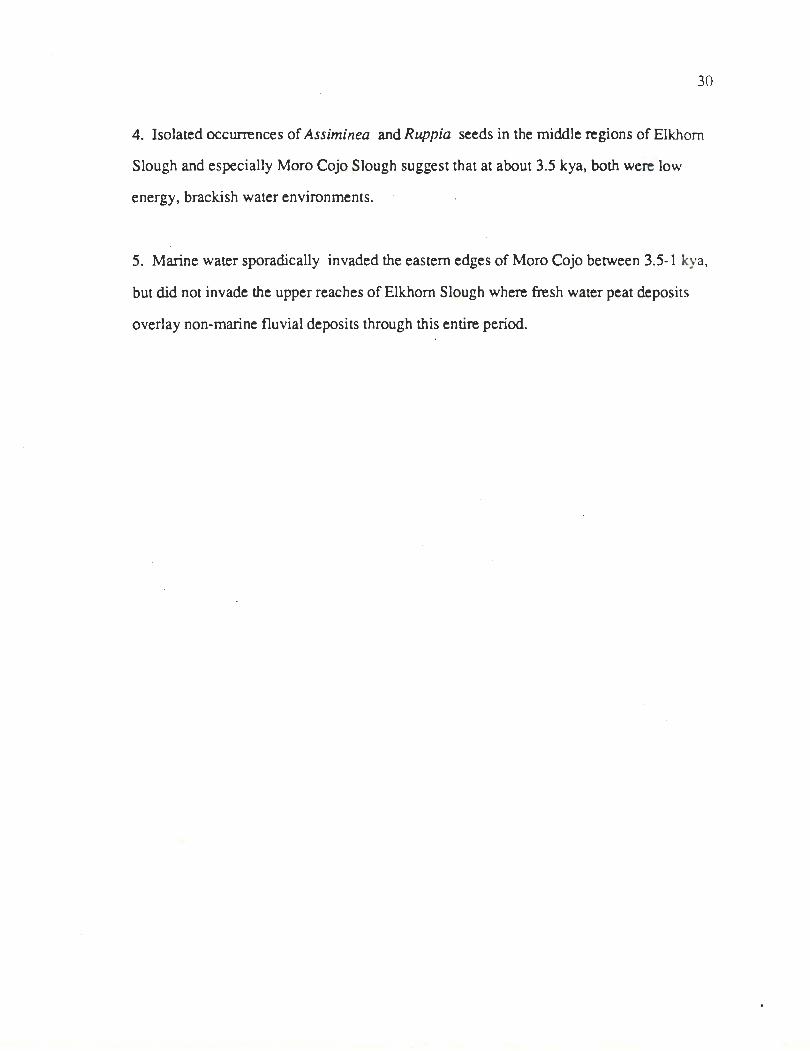
4. Isolated occurrences of Assiminea and Ruppia seeds in the middle regions of Elkhorn
Slough and especiall>' Moro Cojo Slough suggest that at about 3.5 kya, both were low
energy, brackish water environments.
5. Marine water sporadically invaded the eastern edges of Moro Cojo between 3.5- 1 kya,
but did not invade the upper reaches of Elkhorn Slough where fresh water peat deposits
overlay non-marine fluvial deposits through this entire period.
REFERENCES CITED
Atwater, B.F., Hedel, C.W. and Helley E.J., 1977, Late Quaternary Depositional history, Holocene Sea-Level Changes, and Vertical Crustal Movement, Southern San Francisco Bay, California: United States Geological Survey Professional Paper 1014, pp. 15.
Beard, J.H., Sangree, J. B., and Smith, L.A., 1982, Quaternary chronology, paleoclimate, depositional sequences, and eustatic cycles: AAPG Bulletin, v. 66, p. 158-169.
Connell, J.H. and Slatyer, R.O., 1977, Mechanisms of succession in natural communities and their role in community stability and organization: The American Naturalist, 111 (982) pp. 1119-1144.
Dietz, S.A., Hilderbrandt, W., 1986, Final Report of Archaeological Data Recovery Program at CA-MNT-229, Moss Landing, Monterey County, California: Archaeological Consulting and Research Services, Inc., Santa Cruz County, California, pp.475.
Drury, W. H. and Nisbet, I.T.,1973, Succession: Journal of the Arnold Arboretum, 54(3) pp.331-369.
Ellison, J.A., 1989, Pollen analysis of mangrove sediments as a sea-level indicator: assessment from Tongatapu, Tonga: Palaeogeography, Paleoclimatology, Paleoecology, 74(3/4) pp. 341.
Flethcer, C.H., Knebel, H.J., and Kraft, J.C., 1990, Holocene evolution of an estuarine coast and tidal wetlands: Geological Society of America Bulletin, v. 102, pp. 283-297.
Ford, M.S., 1990, A 1 0,000-yr history of natural ecosystem acidification: Ecological Monographs, v. 60, no. 1, p. 57-89.
Frost, I., 1988, A Holocene sedimentary record from Anangucocha in the Ecuadorian Amazon: Ecology, 69(1), pp. 66-73.
Gordon, B. L., 1979, Monterey Bay Area: Natural history and cultural imprints (2nd edition); Boxwood Press, Pacific Grove, California.
Huntley, B. and Prentice, C.I., 1988, July Temperatures in Europe from Pollen data, 6000 Years Before Present: Science, v. 241, pp. 687-690.
Jackson, S.T., Futyma, R.P. and Wilcox, D.A., 1988, A Paleoecologcial Test of a Classical Hydrosere in the Lake Michigan Dunes: Ecology, 69(4) pp. 928-936.
Keen, A.M., and Coan, E., 1974, Marine Molluscan Genera of western North America and illustrated key. 2nd edition, Stanford University Press, pp. 208.

Kellogg, M. G., 1980, Status of the California Brackish water snail, Tyronia imitator, in Central California. California Dept. of Fish and Game, Inland Fisheries Endangered Species Program, Special Publication 80-3, pp. 23.
32
Lohmar, J.M., Macdonald, K.B., and Janes, S.A., 1980, Late Pleistocene-Holocene sedimentary infilling and faunal change in a southern California coastal lagoon: In Field, M.E., Bouma, A.H., Colburn, I.P., Douglas, R.G., Ingle, J.C. (eds.), Quaternary depositional environments of the Pacific Coast, Pacific Coast Paleogeography Symposium 4, The Pacific Section, Society of Economic Paleontologists and Mineralogists, California.
MacGinite, G.E., 1935, Ecologic aspects of a California marine estuary: American Midland Naturalist, v. 16, no. 5, p. 629-765.
Manin, B. D. and Emery, K. 0., 1967, Geology of Monterey Canyon, California: AAPG Bulletin, v. 51, no. 11, p. 2281-2304.
Nybak.ken, J., Caillier, G., and Broenkow, 1977, Ecologic and hydrographic studies of Elkhorn Slough, Moss Landing Harbor and nearshore coastal waters, July 1974-June 1976. Moss Landing Marine Labs, Moss Landing, CA pp. 464.
Odum, E.P., 1969, The strategy of ecosystem development: Science, v. 164, pp. 262-270.
Redfield, A.C., 1971, Development of a New England Salt Marsh: Ecological Monographs, 42(2) pp. 201-237.
Reed, D.J., 1989, Patterns of sediment deposition in subsiding coastal salt-marshes, Terrebonne Bay Louisiana: The role of winter storms: Estuaries, 12(4) pp. 222-227.
I
Rehder, H.A., Carmichael, J.H., Nehring C., and Brewer, M.B., 1981, The Audubon Society field guide to Nonh American seashells, Alfred A. Knopf publishers, Chanticleer Press, Inc., New York.
Schwanz, D.L., 1983, Geologic history of Elkhorn Slough, Monterey county, California, M.S. Thesis, San Jose State University, San Jose California. 102 pp.
Schwanz, D.L., Mullins, H.T., and Belknap, D.F., 1986, Holocene Geologic History of a Transform Margin Estuary: Elkhorn Slough, Central California. Estuarine, Coastal and Shelf Science, 22:285-302.
Wanless, H.R., Tyrell, K.M., Tedesco, L.P. and Davis, J.J., 1988, Tidal Flat Sedimentation from Hurricane Kate, Caicos Platform, British West Indies: Journal of Sedimentary Petrology, 58(4) pp. 724-738.
Wood, M.E., Kelley, J.T., Belknap D.F., 1989, Patterns of sediment accumulation in the tidal marshes of Maine: Estuaries, 12(4) pp. 237-246.
Zedler, J.B., 1977, Salt marsh community structure in the Tijuana Estuary, California: Estuarine and Coastal Marine Science, 5:39-53.

Appendix 1. The distribution of microfossils, plant debris and sediment recovered from cores taken in Elkhorn Slough. See Figure 1 for locations.

Elkhorn SloiJ9h (ES· II
OEPTH(III) E~ Am111onle Troch-lntt H!'Piol>hr"9moidft Anlllllnee Oslrecod S .... l ha<Jmenls Plant ~brls S-.!iment Total coUflt•d
l 0 0 0 0 0 0 0 0 0 453 453 3 0 0 0 0 0 0 0 0 I 2 250 2&3 J J 0 0 0 0 0 0 12 255 267 4 3 0 0 0 0 ' 0 0 H3 425 •• 0 0 0 0 0 0 0 H9 H9 1. 0 I 0 0 0 0 0 JU 350 I 3 0 I J 0 I 0 0 0 526 550 • 3 0 0 0 0 0 0 0 H8 498
"' 0 0 5 0 0 0 0 395 400 ll. 0 0 0 0 0 4 0 389 393 I] 3 0 0 0 0 0 0 ' 577 578 13 5 0 0 0 0 0 0 0 463 483 Ill 0 0 0 0 0 0 0 393 393 IS 0 0 0 0 0 0 ' ' 338 338 153 0 0 0 0 0 I I 593 595
"' 0 0 0 ' 0 2 2 • 600 1119 170 I 0 0 0 0 0 II ' 548 558 113 0 0 0 0 0 0 12 4 498 512 tiJ 0 0 0 0 0 0 4 0 394 398 20 J 0 0 0 0 0 0 5 5 378 3811 21. 0 0 0 0 0 0 0 0 4711 4711 220 0 0 0 0 0 0 0 0 383 Jill 23 5 0 0 0 0 0 0 I 2 512 515 lJI 0 0 0 0 0 0 0 l H9 411 25 0 0 0 0 0 0 0 I 0 423 424 280 0 0 0 0 0 2 5 0 3211 333 211 J 0 0 0 0 0 0 0 0 339 339 29 J 3 0 1 I 0 13 " 0 304 3U :u. I 0 ' I 0 J 0 0 Jill 3711 Jll I 0 0 ' 0 0 I 0 458 550 35 0 0 0 ' 4 0 0 130 0 293 4211 310 0 0 0 I 0 0 I 3 0 537 551 31. 0 0 0 0 0 0 0 I 391 397 37 0 0 0 0 0 0 0 0 0 412 412 31 3 0 0 0 0 0 0 0 0 3114 3114 311 0 0 0 0 0 0 0 0 4113 453
CCMotENTS
w..n sor~M Ynd
Writ sortl'd s.lftd
•'"'"' ,..,., .. !IJIP
W•l sork'd g••y sand w,R sort<'d 9'•Y s;ond > 1 mm lrw oy'SI•f '' AC)ment'
.tmm Oy'"'' lr;ogmen11 . -• sorted 9'•Y sand · Wpft SOriPd IJ'•J .... d .tmm oyst•• sh•lls . Wpll -~ 9rey sand >lmrn tl;tm' and oy91t!r stt.tf! ,.tmm ~ fra9m•nf!, w .. n sort"<! ynd
>lmm '""' lra<Jments. Wei son.d med 9' ainecl sand
•'"'"' o, .... """" .. ...,... .... ~ 5 clam fra<JS (Trnsus & Proto· lh«ei .W•I SO<Ied send
Coersotr ·9'•ined sand
lots oro, • .,., ""'~"'""~ •'"""
90'1'. o,.,.. ''81J'"I!ftiS& """"' ........ o, .... '""h &11119""'"~ Poorly ..,,te-d IJ't!Y •end 3•hen 1••9"'•"'' W"l rou,..,.d. poorly SO<It!d sand Wnll rounrtrd . poorly •ort•d· sand Poorly sor rPd frghl sand
w .,.

U•ho•n !';Oo1J91> C£ S 21
OEPTH ""' E~ AIIIMOnle Troch8mln8 Haplaphr..,....,..,., Anlmlne8 ~lr8Cod ShoR l••9m•nh P18nr d<'IHi11 S""'"'""l
I I 0 0 0 0 0 0 0 0 ~09 21 0 0 0 ' 0 0 0 40 411 ,, 0 0 0 0 0 0 0 0 HI ~ z 0 0 0 0 0 0 0 0 5ll 5, 0 0 0 0 0 0 0 0 ~87 II 0 0 0 l 0 0 ' t 510 I I 0 0 0 0 0 0 0 0 47] I I 0 0 0 0 0 0 0 0 419 10 l 0 0 0 0 0 0 0 0 3611 10, 0 0 0 0 0 0 0 0 HJ 10 5 0 0 0 0 0 0 0 0 41 I Ill 0 0 0 0 0 0 0 ' •H Ill 0 0 0 0 0 0 0 , ~61 12 0 0 0 0 0 0 0 ' ' 447 122 0 0 0 0 0 0 l 0 ... .,, 0 0 0 0 0 0 5 0 112] ·u :1 0 0 0 0 0 0 4 0 4]9 110 0 0 0 0 0 0 2 0 ~71 Ill 0 0 0 0 0 • II 14 IOJ 170 0 0 0 l 0 0 21 7 45] 172 0 0 0 l 0 l J ll 519 Ill 0 0 0 0 0 0 0 0 379 ltl 0 0 0 0 0 0 0 0 401 lO 0 0 0 0 0 0 0 0 0 419 21 0 0 0 0 0 0 0 0 0 1127 21 7 0 0 0 0 0 0 :1 5 tot 2l :1 0 0 0 l 0 0 • , JJCI 24] 0 0 0 0 0 0 0 0 ]17 25 0 0 0 0 0 0 0 0 0 Jll 210 0 0 0 l 0 0 0 ' HI 211 0 0 0 0 0 ' 0 0 Jl7 271 0 0 0 0 0 ' 0 0 4)1 21 l 0 0 0 ' 0 0 l 0 4211 ltl 0 0 0 l 0 2
·~ 0 107 :10 0 0 0 ' l 0 0 4 0 427 JI .O 0 0 0 I 0 0 17 0 ]11
···~I
~09 47)
HI 5ll 517 SJ2 47]
•a 3611 lH 4 I I .,. ~u ... 112' 121 44]
57] 129 481 5S9 ]79 401 ... IH 417 347 ]17 ,., Ht 3211 02 4]0 3711 04 ,.,
COMMIIII';
"''"''" ft.• -:,hrW": ,. hnm It•• co:h• ·W lt :.,tn""'"' w~n ~'"ft . d:trll 'l:'trtd
w .. " ~Oftrd ltqhl ~:tt•tl
,. 1 "''" cl.1•n h "'fJ'"""'. Poorlr -~d ~nd Poortr tort,.d ,.1nd
PooriJ ''""'" • ·•nd • lmm Pl'bbiP! f: 'ne 9' wralhru~·d Und Wr~lhl'fPd~nd
SandJ 1~1
Pomr, '"''"d •n"••••d s.on.t. Clam ,.., • I"'"' P..,.r, _,,.d •ulhpr.cl und
• I"'"' clam lr a9m•nts . ...,. 9• al n.d sand •'"'"' ~h"" h:tl)rncnt• . ftne t•ai ~d~d "''"'" •hflll ha1mrnt, _ r."- t••i "Pd sand .. mm ••• ttt.tl hai;J..,.nf9
•'"'"' o,,l.., ha9mf'nts
•''""' 'lhr" """"'"'" W•• S<>rlrd - 9'~"' S3nd. •• "'"' I•• ''"'" lr 89"'Phh "'"''" Or ... t.-, lt:t1Jtnf"ttt• •'"''" Orco:trt fra'Jmrr•t'l •lmm Clam I OJ~It'r tra9""'"''
""" .,. ........ rt ~ ...... "'""" Chtr• h:1fJ""""~ ., hnm Oy\trt . f:f:1fn h.ltJntnnt1
,. tmm du•ll h;,IJutt•nl'l
w Vt

I i i .. ii 0 ~
c • E
l ~ i "' i ~
i. ii:
" ~ R ~ "' c E
l ... • • ...
"' .. • ~ "' I ;; 0
J 15 II.
• l "'
I i'
i %
• .§
i ~
~ ~ .I g I c
i "' ! % li: ~
•. l
~ "' c t .. E . r I ~ ~ i .
~ t t~~~t'F
' E t i ~ ' ; ~ ~ : ' ·~ !l ·~ ~ ~ ~jjj~~l 1 1.)
" ~3-P.looo~~& :E ... 1 " 6 0 c 0 i ~ ~ ~ ~ ~ ~ &. ... "' E E E E ~~~~~~ c i 'I? E E ! ! ! ~ g g g g g g :::1: ~~ . . A A AJ:G.C..C..A.Q.C..
~~m~·~~m-c-~•••~•-•~ ~~c-~~c~~cc~~~c~~~co ··~·~·~~·~~~·~·~~··~
e- -e~o-•-~~~c~-e-•• ~~c~-c~~c~~-c~c~~Ncc •• ~~·~~·~~~·M•MM••M
.., ~N~~-e:Ne..,•ce~cccocc
:c,.,o•coocooo
OCOCCOOON:eNOOCOCOOO
oooococoocoocoocoooo
ooo~ooN--oo~oooooooo
NN~Meeooeeoo••~••oo~
N"~•o-·~~••o~•~~o-•~ -------NNNNNPJP.tMrt
36

("'""'" Slov9" IES •1
OEPTHCml Efphldlum Ammonia Trochtlmln ~.,....,.Au...,;., .. Oslraco Sh•" •agm..,ls Plant ""b•is S•6m•nt Total tountf.d CCJ,tM£tnS
1 .0 0 0 0 0 0 0 0 377 ]I •or Mo•"' ••t•nl oog:tnrc:s , I 0 0 0 0 0 ' 0 3ll 211 35l )3 0 0 0 I 0 0 0 •n 88 510 Mostly o11pnrc: (•ools) so Ull IS 0 0 0 2• 0 1111 21 •n •'""" As .. "'unra Sl u 10 0 0 • " 0 IU ' 292 ,. tmm 1\o;~"'"""-' • 0 t7 21 , 0 I .I 0 2611 6 357 ... t mm OttJ3nic~ I ,.,.._ h "9 rnprtt, . , 29 21 2 I l u I 3 2 .. 2 10 3511 "'"''" 011 '"''=1 I ~h"" ,,,..9 tn(llnt'l
" .l 0 0 0 0 0 0 0 13 358 379 37 Sc>O<e po"""
£""-" Slo ..... IES 51
OEPTH (M) t~ Ammonia Trothamlna Haploplw119....,., Spo•e Pol .. n O.tracocl Shel ''119"'•"'' Plant ct.bt111 S•~•nt Total c"""tPcl C()f.4t.I£N1S
OS 0 0 0 0 0 0 , 330 12'9 u• • tmm "'9·>n<e ""br•s I 0 0 0 0 0 0 0 0 37'9 II 3117
1 s 0 0 0 0 0 0 0 2S7 2113 720 rf)f)fly •wulrft illll:tt'fi
' . 0 0 0 0 0 0 0 707 250 •H 20 0 0 0 0 0 0 0 37 32, 3511 .lmm J>('M>In . po01ty '"'""' 21 0 0 0 0 0 0 0 7 392 , .. •'"'"' l)<'bhlr•. po<Niy so•"'cl )0 0 0 0 0 0 0 0 , 521 5H Poo•ly ...,,,,.rf ,,,..rf·J>-'"' •• 0 0 0 0 0 0 0 0 nz •·n co~t--:ft ,, "'"''"'"' ... .,1ft 7 0 0 0 0 0 0 0 0 0 . ., .,, Co.u~ 9' Atoma" 9:1ttd
...., .........

;o "' ~ t R "' c ~
f ...
... .. c & .. ! 0 .. c .. f ... .. "'
i c .. ii: ~
f. E f ~ ., : "' 1 .. .. ~ 0
I IL
l • t t i It :z: • t • &
K ;:. .. I 5 l ... I :z: ... ~
~
C>~P"'Cti'IP"'P"'IP!o -~~CNCit/"'~ r'Jr"'.r"'tt'\ • ...,.
oooooooo
oocooooo
oooooooo
oooooooo
oooooooo
oooooooo
oooooooo
•OOf"'.Or"'e 0_.,..,., • .,...,
38

Appendix 2. The distribution of microfossils, macrrofossils, plant debris and sediment recovered from cores taken in Moro Cojo Slough. See Figure 1 for locations.

1/) z
! i I u ! ~
< r ... :- 3,
~ .. j
• ! u i D li: j ~ c
l r .: l 1/)
1 X
5 • r ~ c . • I i :
I i .. • I c
J ! i! .. ~
.. i E 0 .. .:
! !!'
~ s .!
~N~.c~~-c~•~c~~e ~~~~~·~~~~~c~e~c
~·~~~~~~~·~~~··~
-~~•~~•c-•~•~•~• ,..., •• ...,...,e.CI~-It'I .... -P¥0""""""1D r"'l!ll,...,r"'P¥r'lr"'tl'lll'l • .,.. •••• r')
ooc::---f'lrll-rtOf"IOOC
.. rtf'IWO•rt"""OOOOOOOOOO
oooooooooooooooo
0000000000001'111000
oo-oo .. ~ooooooooo
~ooo-ooooooooooo
000~~···~~~- ... ~ft· ft•oo-•~••••--"""'..,"'
_________ ._ ......... """
40

• llbo Coto f~ · ll
OEPTM!"" ~ ~~-T-in8 Hoploplw.....-1 Aulmlnea <hlrllcocl Shell Fr ......... t Plent O.brtt Se<l.....,l TOIII C..-.1 QCMA(NIS
01 • • 0 0 0 0 311 u 411 "' plant olebrlt t•oolt) I 2 0 0 0 0 0 0 lOl 47 l45 ~ ptanl debf•l froot1l 30 0 0 0 0 0 0 S73 71 "' 99"lf. P•at end 0,..._ pl:.nt Mbrrt
!IS 0 0 0 0 171 0 90 107 37l Vf'ry fff1e ct~y 18f'T'IOI"'
ss • 33 4 3 0 7 7 74 ns 374 ,.tmm •he" ffiiQt A A•~• 51 3 4 0 IZ 101 101 49 77 HI Rupp.e '""' a ~An~• "''""' 51 3Z " I 0 29 l6 47 35 769 Rupo~a 1fe(h. then '' *:1'"•"'' I An•mtna , 1""" 7. I 0 I 0 421 1 9 I l ... Clay tfd•rn.-.t ••th lolt of - <h~acoclt and .,......,.,. 10 0 2 0 0 117 .0 0 .. , ,,,
era, '"""' .. "'' loll ol Otrracod 11 .3 " • 0 0 s II 12 Ill 783 O,tlff tr191 ·~rnm
IZO 3 • 4 0 " 2 Ill 119 ll7 Oy ttet '' •o• ,. 1 mm I SCI 0 0 0 0 0 0 0 367 367 Coarta . '"""" IOI'Md Aromat tand 11 .0 0 0 0 0 0 0 0 429 479 Coarte. poorly torr•d Aromu tand
•
Moro Coto fMC ·31
DEPTM ""' E..,._,.,. Ammonia Troct>amln ~..,....,..., Attlminea Otlracod Shell Fril9f"M'It Plan! o.brlt s.dimpnt lola! Coun!M COMMENTS
t .O 0 I 0 0 0 0 0 321 47 3419 90"1. Plan! dPb<it (roolt) . I I II 27 0 0 0 311 0 23 304 410 3 3 t 0 0 0 0 0 0 22 309 332 .lmm . ... ~. 31 t 0 0 0 0 0 0 74 260 335 so 7 s 0 s 0 IS 0 47 359 4311 •'"'"' ........ ""~" •• • 12 I 0 0 24 7 " l51 410 .1mm 1 cl- ,,..,..,."'· few Attiminea 7 0 10 3 0 0 0 lOll 0 10 279 4011
100 t 7 0 0 0 37 0 294 0 339 95'11. Plant dobrit 13 .3 0 0 0 0 0 0 0 27 Ull 305 98'11. Sa...t, "" piolcft
~ ......
MO<O Colo (MC·•I
OEP'TH C"'l E~ Am""'"'• Troell-lne H~regmoldH Anlmlne O•tracod Shell Fre,ments Plant Ot!bm s.dlmenl Tolel Counled
0 .1 0 0 0 0 0 0 0 2911 28 32.
'·' 0 0 0 0 0 0 0 1112 177 359 I I 0 0 0 0 0 55 0 219 911 370 I I 0 0 0 0 0 2 0 H3 90 505 2 0 0 0 0 0 0 I 0 3113 I 7 •o1 3 3 0 0 0 0 0 0 0 270 u 311 31 0 0 0 0 0 0 0 311 1117 5011 • 3 0 0 0 0 0 0 0 179 3111 .,7 50 0 0 0 0 0 • 0 201 179 311.
•• 0 0 0 0 I 9 0 120 2111 .I' 7 0 0 5 0 0 0 lOll 0 312 55 .eo ••• 0 0 0 0 0 5 0 .,7 II 513
OCJMMENTS
99'lr. organic dlob<l• Crool•l
.lmm organic ct.bm 99'11. ~al 99'1'o JH!al
Few A~•tmtne• Ins -pie Sandy •~I
Sandy •ill 99'1'. organic ct.brl! Cold rools)
~ tv
MO<o Cojo fMC·51
DEPTMfMI E~ Am1110flle Trocllellllne HIPaPfw89'ftOidn Asslonlnoe Onecod Shell lriHJ"'•""' Plant debris Sedl,.,t Total counted
t 0 0 0 0 0 0 0 0 5 324 329 32 0 0 0 0 0 t 0 4JI 117 527 3 5 0 0 0 0 0 0 2 Jill Ill 431 4. 0 0 0 0 0 0 0 24 433 457 50 0 0 0 0 0 0 0 20 4117 507 53 0 0 0 0 0 0 0 37 337 374 .,
" tO 0 43 0 0 0 4 312 3110
•• 24 32 t " 0 31 7 Ill I 113 JIIO 70 0 ' 0 2 0 ' 0 15 2113 30l 7 3 0 t 0 2 0 ' 0 • 419 431 10 0 0 0 0 0 2 I 2 371 375 • 5 0 0 0 0 0 0 0 tO 2111 291 I I 0 0 0 0 0 0 0 0 393 393 to 0 0 0 0 0 0 0 tJ J611 Jill ,. 0 0 0 0 0 0 0 7 412 419
10 .0 0 0 0 0 0 0 0 I J4t J5
CXNMENTS
Sanlfr slh
lot' of peal
Sencty sillldey
Poorly -ted -• ..... eel send Poorly -led sand Poorly -led coarse ,.nd Poorly !O<Ied sand Poorly !O<Iod s.•nd Poorly sorlt'd w..all>t'red sand Poorly sorted sand
~ w