A Few Thoughts on Inflation 2013 A Few Thoughts on Inflation Kung Hei Fat Choi! We would like to...
12
February 2013 A Few Thoughts on Inflation Kung Hei Fat Choi! We would like to start by wishing all readers good health, happiness and prosperity in the Year of the Snake! * * * * * This Chinese New Year holiday, my significant other half (i.e., my wife) and I went to New York to visit her family and celebrate the festive season. It was an enjoyable and relaxing trip. I also have the pleasure to re-visit some of the landmarks and famous tourist attractions Big Apple (a nickname for New York City) is well-known for. During our stay, we experienced a severe snow storm that overnight dumped nearly 20 inches of snow in some parts of New York. Instead of succumbing to mother-nature and staying indoor, we braved the coldness and thick blanket of snow the next morning and drove three hours to a mountain in Upstate for some downhill skiing. Although I went to ski every few years, it’s been a very long while since I last skied on fresh natural snow, and needless to say we had a blast of fun time that day. Coming back to the focus of this article, I got a close-up look at how inflation varies for different items yet within the same category. The category is food. When I was studying for my graduate degree in New York some 20 years ago, I often ate pizza for lunch. Not that I am an avid pizza fan, but rather because it was affordable and the mixture of a baked dough of flour and water is highly filling to the stomach. Back then, a slice of New York style pizza could be had for quite a bit less than a buck. This time, I wandered into a pizza shop in mid-town Manhattan and learned with no small shock that a piece of ham and mushroom with cheese pizza costs $5.99 plus tax. In other words, in about 20 years a slice of pizza has gone from less than a dollar to slighly over six dollars. According to my trusted HP12C (a financial calculator), that works out to compounded annual increase of about 9.5%. Back in college days, one shop that I frequently visited during nightime is a donut chain called Dunkin’ Donuts. Apart from the fact that I have a big sweet tooth is that their shops operate 24 hours and their coffee offers unlimited refills. When mid-term and final exams approach, I would grab my books and study notes and go to a nearby shop. I would typically go well after dinner time because by then there would be few customers. I would then buy a cup of coffee and stay for hours using the place as study room. This way, I save on my electric bills (i.e., lighting, and air-conditioning in the summer) and gas bills (i.e., heating during winter times), and I get unlimited supply of caffeine to keep me awake, all for about 30 cents. Sometimes, when I want to indulge myself, I would buy a couple of donuts during study breaks for about a quarter apiece. Ah, those good old days! Page.1 of 12
Transcript of A Few Thoughts on Inflation 2013 A Few Thoughts on Inflation Kung Hei Fat Choi! We would like to...

February 2013
A Few Thoughts on Inflation Kung Hei Fat Choi! We would like to start by wishing all readers good health, happiness and prosperity in the Year of the Snake!
* * * * * This Chinese New Year holiday, my significant other half (i.e., my wife) and I went to New York to visit her family and celebrate the festive season. It was an enjoyable and relaxing trip. I also have the pleasure to re-visit some of the landmarks and famous tourist attractions Big Apple (a nickname for New York City) is well-known for. During our stay, we experienced a severe snow storm that overnight dumped nearly 20 inches of snow in some parts of New York. Instead of succumbing to mother-nature and staying indoor, we braved the coldness and thick blanket of snow the next morning and drove three hours to a mountain in Upstate for some downhill skiing. Although I went to ski every few years, it’s been a very long while since I last skied on fresh natural snow, and needless to say we had a blast of fun time that day. Coming back to the focus of this article, I got a close-up look at how inflation varies for different items yet within the same category. The category is food. When I was studying for my graduate degree in New York some 20 years ago, I often ate pizza for lunch. Not that I am an avid pizza fan, but rather because it was affordable and the mixture of a baked dough of flour and water is highly filling to the stomach. Back then, a slice of New York style pizza could be had for quite a bit less than a buck. This time, I wandered into a pizza shop in mid-town Manhattan and learned with no small shock that a piece of ham and mushroom with cheese pizza costs $5.99 plus tax. In other words, in about 20 years a slice of pizza has gone from less than a dollar to slighly over six dollars. According to my trusted HP12C (a financial calculator), that works out to compounded annual increase of about 9.5%. Back in college days, one shop that I frequently visited during nightime is a donut chain called Dunkin’ Donuts. Apart from the fact that I have a big sweet tooth is that their shops operate 24 hours and their coffee offers unlimited refills. When mid-term and final exams approach, I would grab my books and study notes and go to a nearby shop. I would typically go well after dinner time because by then there would be few customers. I would then buy a cup of coffee and stay for hours using the place as study room. This way, I save on my electric bills (i.e., lighting, and air-conditioning in the summer) and gas bills (i.e., heating during winter times), and I get unlimited supply of caffeine to keep me awake, all for about 30 cents. Sometimes, when I want to indulge myself, I would buy a couple of donuts during study breaks for about a quarter apiece. Ah, those good old days!
Page.1 of 12

For this reason, my heart always has a soft spot (or fondness) for the chain and its donuts. So during this visit, I deliberately went into a Dunkin’ Donuts shop to check out their offerings and how prices have changed. To my surprise, pleasantly I should add, prices for their donuts haven’t gone up excessively. I purchased a dozen donuts (photo to the right) for $7.59. So that means donut price has been increasing at an annual rate of about 3.5% over the past 20 years. While the pace is quicker than the government’s take on general inflation (as denoted by the Consumer Price Index, or CPI), it’s nowhere near the pace of gains of pizzas. For those readers who may think what a cheapskate that I am, buying pizzas and donuts while visiting overseas in-laws, please just sit tight. Being a good son-in-law, I treat my wife’s family to a sumptuous dinner at a renowned steakhouse for an early celebration of the Year of the Snake. This restaurant was established in 1887 and is regularly voted as one of ten must-eat restaurants in New York. They are famous for the aged porterhouse steaks, specially made steak sauce, and baked breads and whipped butter that are made on premise. Since this is the first time I visited the estabishment, I have no way to compare how much its prices have changed over the years. But readers could compare their prices to those of their favorite steakhouses in Hong Kong and elsewhere to see how prices vary in different markets. For that meal, it cost $600 (USD of course) for our party of eight adults and one child (aged 11), without wine. You can decide for yourself whether that’s reasonable. All I can say is all the rave reviews about their food are justified.
On the returning flight to Hong Kong, I reflected on the trip and wondered what topic to write for this month’s featured article. Then the flight attendants served dinner. It so happened that I had the beef stew on rice as main. While I stared at the chunks of meat in a thick dark sauce, my mind involuntarily recalled the dinner we had at the above-mentioned steakhouse. What a difference it was! Then it dawned on me how the cost of a meal can differ widely depending on what you eat, where you eat and when you eat. Prices changed over time, but the pace of change varies on the type of food (or item of concern) and in different places, hence the pace and its impact varies from person to person. It’s commonly known that inflation varies in different countries. But few people would spare a minute considering how CPI relates to themselves and others in the society. For instance, the latest CPI figure in the U.S. is for year-on-year increase of 1.6%; whereas the latest composite CPI reading in Hong Kong is for annual gain of 3.7% (see below chart for the history of Hong Kong CPI since 1980). The difference in CPI is as much a result of difference in various economic factors as well as the composition of the basket of goods for calculating the index. Take food as an example. For lower income households, the amount of money spend on food items should constitute a larger portion of their income than higher income households. This is because food consumption is relatively inelastic to income. To put this in a different context, consider Warren Buffet or Li Ka-Shing who are among the wealthiest individuals in the world. They may have fancier tastes for food and frequent more expensive establishments, but the amount they spend relative to their income should be considerably less than Mr. Joe Smith would adjusted for income.
Page.2 of 12

Note: Historically, from 1980 until 2012, Hong Kong Composite Consumer Price Index (CPI) averaged 76.37 index points, reaching an all time high of 112.90 in December of 2012 and a record low of 26.30 in October of 1980. In this regard, Hong Kong’s Census and Statistics Department has gone some ways to differential the impact of inflation and compiles separate CPI series relating to households in different expenditure ranges. Specifically, CPI(A) relates to about 50% of households in HK, which are in the relatively low expenditure range; CPI(B) relates to the next 30% of households, which are in the medium expenditure range; CPI(C) relates to the next 10% of households, which are in the relatively high expenditure range; and Composite CPI relates to all of the above households taken together, which is compiled based on the aggregate expenditure pattern for reflecting overall consumer price inflation. As households spend more on some items and less on others, a weighting system has been designed to show the relative importance of individual items in the basket of consumer goods and services bought by households. The weights used in calculating CPI are derived from results of the Household Expenditure Survey and is updated once every 5 years. While it is commendable effort of HK’s CSD in distinguishing consumer price inflation affecting different household groups, it should be noted that the measure is not a representation of standard of living by different income groups. Consider watches, which is one of the items in the CPI basket. We all wear watches, but their prices vary widely and so do their price change. Hong Kong people is well known for their ownership of fancy watches, and Rolex is among the most popular premium brand. The below table listed the manufacturer suggested retail prices for three highly sort after models by calendar year. It’s clear the year-on-year price change far exceed what CPI would have suggested. For comparison sake, these days the watch I wear regularly is a digital running watch made by Casio. I bought it about three years ago and the price has hardly changed throughout this time.
Rolex 'hot models' MSRPsSeries 2008-01 2009-01 2010-01 2011-01 2012-01 2013-01Explorer II 42,300 43,700 45,800 48,600 53,100 60,500
% Change 3.31% 4.81% 6.11% 9.26% 13.94%Submarina 39,000 40,200 44,900 49,000 58,000 62,100
% Change 3.08% 11.69% 9.13% 18.37% 7.07%Daytona 43,100 53,600 56,800 62,100 71,000 87,500
% Change 24.36% 5.97% 9.33% 14.33% 23.24%Note: Highlighted cells represent redesigned or upgraded models Inflation is perhaps the single-most often read and mentioned economic term in our everyday vocabulary, but it is also commonly misunderstood. Next time, when you hear someone talks about inflation, try asking that person on what and to whom does inflation refer to.
* * * * *
Page.3 of 12

Market Review & Outlook
U.S.: Neutral Out of market expectation, the initially reported slight -0.1% annualized decline in 2012Q4 real GDP has been revised downward to a full percentage point below consensus forecasts and represents the first quarterly real GDP drop since 2009Q2. However, financial markets largely shrugged off the unanticipated bad news on the back of improved investor sentiment. In Q4 of last year, federal spending and inventory investment came in weaker than expected and exports declined for the first time in three and a half years. On the positive side, consumer spending rose at a decent 2.2% pace, business fixed investment rebounded at an 8.4% annual rate and housing continued recovering strongly with a 15.3% annualized gain. Consequently, despite the 0.1% overall output decline, private final demand (GDP less inventory investment and public sector spending) rose at an accelerated 3.0% pace. Decent private final demand growth came despite well-publicized uncertainty about the “fiscal cliff”, which in no small part should be attributed to stimulus from the Fed’s quantitative easing (QE) policies. As Fed’s balance sheet expands, so too have banks’ balance sheets. Last year, bank credit rose 3.9%, more than doubled the 1.8% pace in 2011. As Fed purchases more Treasuries with fiat money, banks’ overall deposits also rose sharply – rising 7.2% last year after gained 6.7% in 2011.
Page.4 of 12
Such deposit inflows have encouraged banks to step up their lending partly by loosening lending standards. In the past, changes in bank lending standards had been a leading indicator of net job formation, since banks play a

pivotal role in lending to credit-constrained households and small businesses. Increase in federal personal tax rates this year will impact consumer spending less than their approximately 1% of GDP size. Federal individual income tax hikes are for the top few percent of income earners with relatively low marginal propensities to spend (i.e., comparatively high saving rates). At the same time, since there is evidence that the expiring temporary Social Security payroll tax cut did not meaningfully boost consumption, its expiration is not expected to negatively impact consumption either. Europe: Neutral France’s economic outlook has dulled significantly in the past few months, with French manufacturing and services PMIs both trending lower. As shown in Chart 1 below, French and German indices, both for manufacturing and services, were in line with each other and rising back in July and August. However, they have parted way since then, with January flash indices showing substantial widening. In closer inspection, French indices were more in line with those of Italy and Spain in December and, based on the latest flash estimates, are set to come in below them in January. The development heightened market concern that France might be following the path of Spain.
In contrast, economic pulse of Germany remains fairly strong. Germany’s unemployment rate has been declining steadily over the past few years and has fallen to a 20-year low, whereas it has been increasing in France over the last 18 months, rising to a 15-year high. Analysts attribute such result to the German Kurzarbeit, a system of work plus welfare, which has proved much more effective at getting people into jobs than its French equivalent.
Page.5 of 12
A consequence of this divergence is that French wage growth has remained sluggish, hardly moving above the 2% bar, on average. This means French workers have seen no increase in their purchasing power of late, which has weighed on household confidence and consumption spending. Investors should keep a close eye to the France economic situation as the year progresses.
Japan: Neutral January 22 was a landmark date for the BOJ with the introduction of a 2% inflation target. Even though a strict timeframe to achieve the target was not included in the joint statement released by the BOJ and government, the statement specified that the BOJ will pursue monetary easing to try to achieve the target at the earliest possible time. Because of Governor Shirakawa’s strong resistance to having a 2% target just a few months ago, the change was significant even though the decision was well priced in by market before the announcement. Subsequent resignation of Shirakawa lifts expectation of further weakening of the Japanese yen.

The BOJ also announced additional easing measure at the same time, namely an “open-ended asset purchasing” of financial assets every month without setting any termination date. Previously, it had set end-2013 as the termination date of asset accumulation. Despite BOJ’s new easing measures, some investors were disappointed at the scheduled pace of APP expansion in 2014 is much slower than the pace this year. As the Bank forecast just 0.9% inflation for FY2014, a weak easing measure casts doubts about BOJ�s seriousness to achieve 2% inflation any time soon. The consensus forecast of GDP growth among private forecasters has been upgraded for FY13. The upgrade was the first since August 2012. The government is reported to upgrade its growth forecast for FY13 to 2.5% from 1.7% before the regime change and the BOJ lifts is growth forecast for FY14 to 2.3%. While private forecasts are still less optimistic than policymakers, bolder policy responses from both the BOJ and government have started to affect the economic outlook among the private sector. Consensus core CPI inflation forecast among analysts was raised by just 0.03% for both FY13 and FY14. Even BOJ raised its core CPI inflation forecast for FY14 by only 0.1%.
China: Neutral Rapid re-acceleration of credit cycle is pushing China’s post-crisis credit binge deeper into worrying territory. Stripping out the relatively small amount of net equity issuance included in TSF produces a working estimate of domestic credit to the non-financial sector. After broad stability in 2003-08, China’s credit-to-GDP ratio has exploded over the last five years, rising by close to 60% of GDP since end 2008. In terms of CNY, total social financing has almost trebled since the end of 2007, rising from CNY 32trn to more than CNY 94trn by end of last year. To put the scale of China’s credit binge in context, the 60% increase in credit-to-GDP ratio comfortably outstrips the rise in the US’s in the five years preceding the onset of its banking crisis in 2007-08. China’s credit binge is alarming from another perspective, as economic literature suggests credit booms provide ‘early warning’ and are key ‘smoking gun’ of both banking crises and painful recessions.
Page.6 of 12
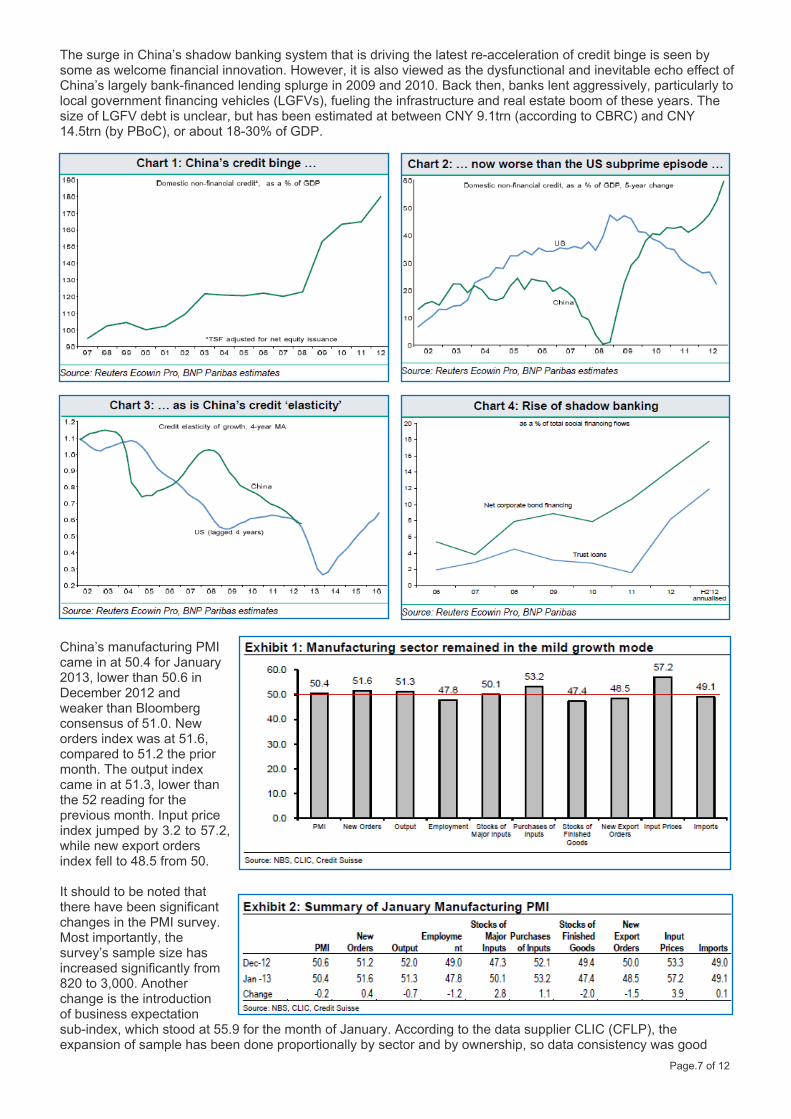
The surge in China’s shadow banking system that is driving the latest re-acceleration of credit binge is seen by some as welcome financial innovation. However, it is also viewed as the dysfunctional and inevitable echo effect of China’s largely bank-financed lending splurge in 2009 and 2010. Back then, banks lent aggressively, particularly to local government financing vehicles (LGFVs), fueling the infrastructure and real estate boom of these years. The size of LGFV debt is unclear, but has been estimated at between CNY 9.1trn (according to CBRC) and CNY 14.5trn (by PBoC), or about 18-30% of GDP.
Page.7 of 12
China’s manufacturing PMI came in at 50.4 for January 2013, lower than 50.6 in December 2012 and weaker than Bloomberg consensus of 51.0. New orders index was at 51.6, compared to 51.2 the prior month. The output index came in at 51.3, lower than the 52 reading for the previous month. Input price index jumped by 3.2 to 57.2, while new export orders index fell to 48.5 from 50. It should to be noted that there have been significant changes in the PMI survey. Most importantly, the survey’s sample size has increased significantly from 820 to 3,000. Another change is the introduction of business expectation sub-index, which stood at 55.9 for the month of January. According to the data supplier CLIC (CFLP), the expansion of sample has been done proportionally by sector and by ownership, so data consistency was good

enough for comparison with previous months. India: Neutral Strong performance of India’s equity market over the recent past has been driven mainly by a re-rating of valuations. Valuations are currently marginally higher than the long-term average. Investor sentiment has been aided by lowering of global risks and more importantly improvement in the domestic policy environment – specifically, the Government’s measures to consolidate its fiscal position and open up the economy to foreign investments. Indian equities’ relative valuation compared to peer markets is currently at historical mean levels. While the valuation levels for EMs and the extent of relative premium that India should trade at can be debated upon, most investors agree that India could trade at higher premium than it is now, given higher growth forecast over the near term and on a structural basis on the
back of diversified growth drivers and higher capital efficiency. India’s vulnerability stems more from the dependence on external capital in a risk-off scenario. The current under-valuation of Indian equities in terms of market cap / GDP is consistent with the prevailing economic scenario, wherein top-line growth remains strong but earnings are under stress due to high inflation and interest rates. Government’s new policies and political resolve to consolidate the fiscal position and open up the economy to foreign investments since September 2012 have been well received by investors. FIIs have invested US$15 bn over Sept-Jan in Indian equities, lifting equity prices while offsetting the burgeoning current account deficit. Subsequent to the recent re-rating, valuations are in neutral zone. Current valuations at 14.5x one-year forward earnings are just shy of last
Page.8 of 12
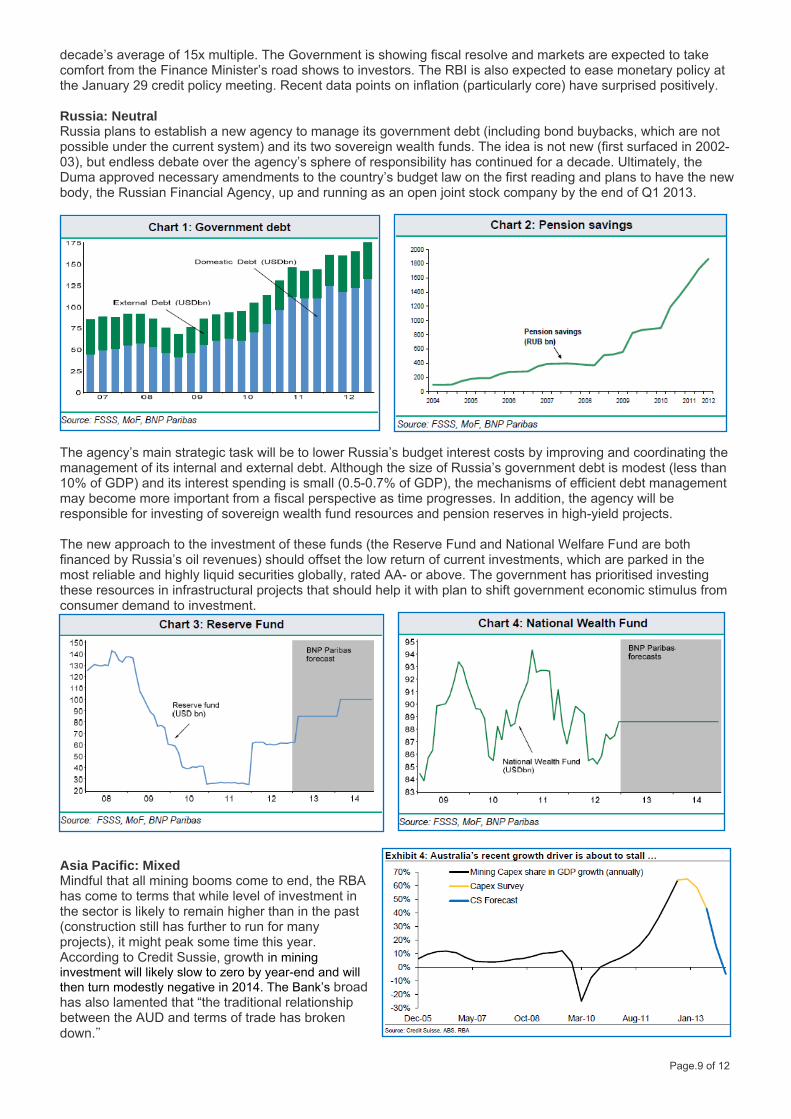
decade’s average of 15x multiple. The Government is showing fiscal resolve and markets are expected to take comfort from the Finance Minister’s road shows to investors. The RBI is also expected to ease monetary policy at the January 29 credit policy meeting. Recent data points on inflation (particularly core) have surprised positively. Russia: Neutral Russia plans to establish a new agency to manage its government debt (including bond buybacks, which are not possible under the current system) and its two sovereign wealth funds. The idea is not new (first surfaced in 2002-03), but endless debate over the agency’s sphere of responsibility has continued for a decade. Ultimately, the Duma approved necessary amendments to the country’s budget law on the first reading and plans to have the new body, the Russian Financial Agency, up and running as an open joint stock company by the end of Q1 2013.
Page.9 of 12
The agency’s main strategic task will be to lower Russia’s budget interest costs by improving and coordinating the management of its internal and external debt. Although the size of Russia’s government debt is modest (less than 10% of GDP) and its interest spending is small (0.5-0.7% of GDP), the mechanisms of efficient debt management may become more important from a fiscal perspective as time progresses. In addition, the agency will be responsible for investing of sovereign wealth fund resources and pension reserves in high-yield projects. The new approach to the investment of these funds (the Reserve Fund and National Welfare Fund are both financed by Russia’s oil revenues) should offset the low return of current investments, which are parked in the most reliable and highly liquid securities globally, rated AA- or above. The government has prioritised investing these resources in infrastructural projects that should help it with plan to shift government economic stimulus from consumer demand to investment.
Asia Pacific: Mixed Mindful that all mining booms come to end, the RBA has come to terms that while level of investment in the sector is likely to remain higher than in the past (construction still has further to run for many projects), it might peak some time this year. According to Credit Sussie, growth in mining investment will likely slow to zero by year-end and will then turn modestly negative in 2014. The Bank’s broad has also lamented that “the traditional relationship between the AUD and terms of trade has broken down."

There are various explanations to AUD’s strength, including safe haven flows, increased official reserve holdings, continued sizable yield gap and purchase by international investors as a form of catastrophe insurance. In the short term, there is little doubt risk appetite generally prevails, but over longer term, terms of trade and interest differentials are more important.
Commodities: Negative The past five years have been among the most tumultuous ever seen in global financial markets, with the collapse of Lehman Brothers in September 2008 unleashing a series of events without precedent since at least the 1930s. The financial underpinnings of the crisis, the potential consequences of the reflationary “fix”, along with the rolling financial issues in Europe, all contributed to an extraordinary flight to quality. U.S. Treasuries and gold were among the clearest beneficiaries, with the precious metal enjoying a Renaissance period as its role as a financial asset was reappraised by central banks and investors. Other key structural changes included the launch of physically backed gold ETFs, the emergence of growing number of central banks on the buy-side, and increased institutional investment in commodities. Gold price is close to the highest level ever relative to the average of industrial metal prices. The current price of gold is 180%
Page.10 of 12

above the stationary long run average of base metals. Another way of assessing the price of gold is to compare it with the price of other assets. Notably, both U.S. equities and U.S. housing are currently the cheapest they have ever been relative to gold. Over the recent months, rebound in global growth with IP beginning to recover in October last year and flash PMI data for January suggests that the trend may continue this year. In particular, surveys in Europe finally joining the modest improvement seen to date elsewhere. The improvement has already been reflected in the U.S. Treasuries market. The deferral of the fiscal cliff has eased pressure on Congress and market concern, and Treasuries have subsequently experienced continue sell off as more and more capital flows into risk assets with yields have broken into higher (albeit still low by historical) levels. In turn, resultant move up in U.S. real (bond) rates has weighed on gold.
Bonds: Mixed Fund flows into fixed income and out of equities have been relentless over the past five years. The search for ‘safe’ yield has had the effect of driving yield even lower. Potential reversal of such flows could lead to PE-expansion gains for equities, as well as perpetuate an eventual rise in rates. However, a major asset reallocation and its consequences for valuations may not be imminent at least in the near term for two reasons. First, net supply of U.S. fixed income instruments is shrinking. Morgan Stanley estimates that in 2013, the net supply of fixed income will be around $1.4 trillion. Factoring in the Fed’s QE3 purchases of Treasuries and Agencies, the actual net supply to private investors will be only a couple hundred billion dollars. Meanwhile, demand for fixed income products should remain strong – from retail investors, pension funds and financial institutions for regulatory reasons. According to MS, such supply and demand drivers will keep downward pressure on yields, hence reducing risk of potential losses to bonds. Second and related, the reallocation into fixed income and out of equities is as much a secular as cyclical phenomenon. Low yields may be unappealing, but until investors actually experience losses on their bond portfolio, it’s unlikely they’ll feel compelled to move en masse into risky equities. Stated differently, a big flow reversal back into equities won’t happen until the macro environment looks set to improve notably, which may begin to show more confirming signs in 2H13 based on 2014 upside risks.
Page.11 of 12

* Unless otherwise stated, all figures and information are collected from WSJ, Bloomberg or Haver Analytics. Important Note & Disclaimer: This document has been prepared mainly as information for internal professional advisers and nothing contained in this document should be construed as an invitation or an offer to invest or a recommendation to buy or sell any particular security or to adopt any investment strategy. Although the information provided in this document is obtained or compiled from what we believe to be reliable sources, AMG Financial Group Limited and its affiliates and the author cannot and does not warrant, guarantee or represent, expressly or impliedly, the accuracy, validity or completeness of any information or data made available to the recipients of this document for any particular purpose and no liability in respect of any errors or omissions is accepted by AMG Financial Group Limited or its affiliates or any director or employee of AMG Financial Group Limited or his/her affiliates or the author. The author’s views are subject to change without notice to the recipients of this document. Past performance is not necessarily a guide to future performance, the value of any investment and the income from it can rise as well as can fall as a result of currency and market fluctuations. The recipients of this document should seek for professional advice if they are in any doubt about any of the information contained herein. For any comments, please send email to us at [email protected]
Page.12 of 12
. AMG Financial Group 5/F, Guangdong Investment Tower, 148 Connaught Road Central, Central, HONG KONG Telephone: (852) 3970 9531 Facsimile: (852) 3426 2650