A draft report for the - NERA · REPORT FOR THE GREATER LONDON AUTHORITY ... large benefits for...
69
January 2003 ALCOHOL IN LONDON: A COST-BENEFIT ANALYSIS - A FINAL REPORT FOR THE GREATER LONDON AUTHORITY by John Dodgson, Director Edward Bramley-Harker, Associate Director Michael Spackman, Special Advisor Salman Aslam, Analyst Leela Barham, Analyst
Transcript of A draft report for the - NERA · REPORT FOR THE GREATER LONDON AUTHORITY ... large benefits for...
January 2003
ALCOHOL IN LONDON: A COST-BENEFIT ANALYSIS - A FINALREPORT FOR THE GREATER LONDON AUTHORITY
by John Dodgson, Director Edward Bramley-Harker, Associate DirectorMichael Spackman, Special Advisor Salman Aslam, AnalystLeela Barham, Analyst
TABLE OF CONTENTS
EXECUTIVE SUMMARY i
1. INTRODUCTION 1
2. THE MARKET FOR ALCOHOL 3 2.1. London in Brief 3 2.2. Main Aspects of the Market 4
3. EVALUATION OF COSTS 14 3.1. Health Costs 14 3.2. Costs of Crime 21 3.3. Workplace Costs 24 3.4. Welfare Implications 26
4. EVALUATION OF BENEFITS 28 4.1. Alcohol Expenditure and Stakeholders 28 4.2. The Pleasure from Drinking 34 4.3. Wider Benefits 35 4.4. Welfare Implications 37
5. CONCLUSIONS 38
APPENDIX A. BACKGROUND DATA 40 A.1. Market for Alcohol 40 A.2. Health Costs 40 A.3. Crime Costs 49
APPENDIX B. THE PLEASURE FROM DRINKING 52
REFERENCES 55
LIST OF TABLES
Table 1 A Summary of Treatment Costs for the NHS due to Alcohol Abuse in London (2000 prices) iii
Table 2 Cost of Crime Related to Alcohol Abuse in London (2000 prices) iv Table 3 Attribution of Alcohol Expenditure in London (2000 Prices) vi Table 4 The Pleasure from Drinking Alcohol in London (£m) vii Table 2.1 Key Statistics on London 3 Table 2.2 Typical Alcohol Volume, by Type of Drink 4 Table 2.3 Frequency of Drinking, by Age and Gender (Percentage of Total) 6 Table 2.4 Alcohol Consumption on the Heaviest Drinking Day Last Week, People
Aged 16 and Over, 2000-01, in London and the UK (Percentage of Total Population) 8 Table 2.5 Estimated Average Weekly Consumption of Alcohol by Age and Gender for
London, 2000 (Alcohol Units) 9 Table 2.6 Estimated Consumption of 100% Pure Alcohol, London and the UK, 2000 10 Table 2.7 Volume and Expenditure of Alcohol Consumed (London Estimates), by Drink Type 11 Table 2.8 Consumption in the Last Week on the Heaviest Drinking Day, by Ethnic Minority
Groups (Percentage of Total) 12 Table 3.1 Acute Effects of Alcohol 15 Table 3.2 Nature of Health Costs at the Individual Level 16 Table 3.3 Health Costs Attributable to Alcohol 21 Table 3.4 Costs of Crime Due to Alcohol in London 24 Table 4.1 Employment Related to Manufacturing of Alcoholic Drinks in the UK, 2000 29 Table 4.2 Employment in Licensed Retailing and Selected Industries in the UK, 2000 30 Table 4.3 Employment Costs (Including Part-Time) Across Different Industries in London, 2000 31 Table 4.4 Estimated Gross Profit Margins in Selected Industries, 2000 32 Table 4.5 Estimated Government Revenue from Taxes and Custom Duties Related to Sale of
Alcohol in the UK and London, 2000 (£m) 33 Table 4.6 The Pleasure from Drinking Alcohol in London (£m) 35 Table 5.1 Financial Consequences and Consumer Surplus from Alcohol in London
(2000 Prices) 38 Table 5.2 Costs of Alcohol in London (2000 Prices) 38 Table A.1 Trend in Income and Prices in the UK (Index 1985=100) 40 Table A.2 Direct Mortality due to Alcohol by Gender for England and Wales 1999 40 Table A.3 Indirect Attribution of Alcohol to Mortality by ICD 9 Code 41 Table A.4 Male Mortality in England by ICD 9 Code 1999 42 Table A.5 Female Mortality in England by ICD 9 Code 1999 43 Table A.6 Male and Female Indirect Alcohol Mortality by ICD 9 Code London 1999 44 Table A.7 A&E attendances by Severity of Attendance and Average Cost England
and Wales 2002 45 Table A.8 A&E Attendances by Severity of Attendance and Average Cost
London 1999 Activity 46 Table A.9 NHS Hospital Admissions for Primary and Secondary* Diagnosis of Alcohol
Related Diseases London 2000/01 47

Table A.10 NHS Hospital Admissions for Health Authorities in the Greater London Area 1998/9 47
Table A.11 Average A&E Cost of Treatment 48 Table A.12 Notifiable Offences London 1999 49 Table A.13 Proportion of Arrestees Testing Positive for Alcohol by Offence Type 50 Table A.14 Number of Violent Offenders Under the Influence of Alcohol, 2000 50 Table A.15 Cost of Crime, UK 2000 (£) 51 Table B.1 Estimate of Consumer Surplus 53
LIST OF FIGURES
Figure 2.1 Comparison of Drinking Frequency Between Men and Women in the UK 5 Figure 2.2 Comparison of Alcohol Consumption Between Men and Women (UK) 7 Figure 2.3 Affordability of Alcoholic Drinks, UK (1985=100) 13 Figure 4.1 The Cost of a Pint of Beer 34 Figure B.1 Measuring Consumer Surplus 52
Executive Summary
i
EXECUTIVE SUMMARY
Alcohol is an important part of London. It is a multi-billion pound industry that provides large benefits for consumers and many businesses and substantial revenues for the government. However, consumption of alcohol also leads to health and other social costs. In the past few decades considerable work has been done on evaluating the impact of these costs on the society but the evaluation of the social benefit of alcohol has largely been ignored. Moreover, none of these cost-benefit analyses specifically study London. This report seeks to bridge this gap and is part of an input into the Greater London Authority’s (GLA) agenda for action on alcohol in London.
A look at the market for alcohol in London is a precursor to understanding the nature of the costs and benefits. There is a relative dearth of information related to the consumption of alcohol in London. This report accumulates data from various sources to understand the market as well as to form the basis of the cost-benefit analysis.
The Market for Alcohol
Total expenditure on alcohol in London is estimated at £4.6 billion. London, like the rest of the country, is predominantly a beer-drinking city. More than half the consumption of alcohol in London is in the form of beer or cider. A quarter is consumed as wine and the rest as spirits. Frequency and consumption patterns differ markedly across gender, age and ethnic groups.
Men drink more frequently than women. They also consume more alcohol when they drink. On average, men consume 16.1 units of alcohol, while women consume 8.2 units per week in London. Similarly, consumption in young adults is higher than older people, for both men and women.
Most of the main minority ethnic groups in London, which form more than a quarter of the population, on average tend to consume less alcohol compared to the national average. Consumption also differs between various ethnic groups. Very few Pakistanis and Bangladeshis consume alcohol. Similarly Indian, Chinese and Black Caribbean population also drinks less when compared to the national average. However, the Irish consume far more than the average.
Data from the General Household Survey suggests that consumption patterns differs markedly across regions of the UK. A comparison of consumption of alcohol in 1998-99 amongst adults on the heaviest drinking day suggests that the proportion that drank over 4 units for men and 3 units for women (roughly the prescribed daily limit) was much lower for Londoners than for the rest of the country.
The average weekly consumption ‘limit’ of alcohol as prescribed by the Department of Health is 21 units for men and 14 units for women. A vast majority Londoners drink below
Executive Summary
ii
this limit. In fact, more than a fifth of men and a third of women do not drink, or drink less than a unit of alcohol a week. Many of the problems associated with alcohol are not related to people who drink in modest to low amounts. Alcohol is more likely to contribute to harm when drunk over prescribed weekly limits or in binges1. More than 24% of men and 15% of women drink over the prescribed safe limits of alcohol consumption.
Social Costs of Consumption
On an individual level alcohol use may lead to psychological and physical harm. There can be knock on costs to the government, businesses or to society. In this report we identify three main costs associated with alcohol use: health costs (costs to the individuals and the NHS), costs of crime (including drunk driving), and workplace costs.
Health Costs
This report assesses both direct costs (where alcohol is the sole cause of harm) as well as indirect health costs of alcohol. It examines the way that these costs are distributed between the NHS and the individual, although the two may be closely related (those who become seriously ill necessitate a cost to the NHS).
On an individual level there are two main effects of alcohol abuse – morbidity and mortality. Morbidity effects may range from lowered judgement from a few pints on a given day or a hangover, to long-term effects such as liver cirrhosis from consistent abuse of alcohol. There is little data available that could be used to cost morbidity resulting from alcohol use. However, data on the consumption pattern of Londoners suggests that a substantial proportion of population drinks above the prescribed safe limits. Hence, there will be morbidity costs.
It is estimated that alcohol contributed to 808 deaths directly, and 1,648 deaths indirectly in 1999. Valuing the cost of mortality has been the source of considerable discussion in the health literature. Despite the difficulties in valuing the loss of a human life, the UK government has made estimates based upon the willingness to pay approach.2 The ‘human cost’ element of fatal injury is estimated at £750,640 in 2000. Using these estimates London-specific mortality costs related to alcohol equate to £0.61 billion (in 2000 prices) for direct deaths and £1.24 billion (in 2000 prices) for indirect deaths.
Alcohol abuse also results in additional costs for the NHS. These costs may arise at the primary or secondary care level. At the primary care level the costs consists of extra consultations with GPs and practice nurses, laboratory tests, pharmaceuticals and other
1 Modest levels of drinking may also contribute to harm because they impair certain abilities in people such as hand-eye coordination. This in certain instances could be lethal (for example accidents due to drunk driving).
2 These estimates are published as guidance to public authorities on valuing road safety. However they are not specific to road accidents and are used in a range of other applications.

Executive Summary
iii
fringe costs relating to managing non-urgent symptoms and prescribing. Secondary level costs relate to more specialised treatment in hospitals and emergency care. These will include additional inpatient admissions and outpatient consultations due to alcohol abuse. Whilst sizable, in comparison to mortality these costs are small.
Table 1 A Summary of Treatment Costs for the NHS
due to Alcohol Abuse in London (2000 prices)
Item Total activity Total cost Primary care GP and practice nurse consultations
302,438 GP consultations and 88,347 consultations
£2.7 million
Laboratory tests 105,275 haematology and biochemistry tests £2.5 million Secondary care Inpatient admissions 12,250 admissions £15.6 million Outpatient consultations 82,706 attendances £8.4 million A&E attendances 304,606 attendances £20.5 million Ambulance transportation 4,238 callouts £2.0 million
Source: NERA estimates.
Table 1 shows the estimated additional activity generated due to alcohol use in London. Alcohol is estimated to contribute around 0.83% of all GP and practice nurse consultations. Similarly it also contributes to a substantial number of inpatient admissions, outpatient consultations and A&E attendances at the secondary care level. The additional costs of these treatment types as well as laboratory tests and ambulance callouts amount to over £52 million. It should be noted that the costs here only relate to treatment cost for the NHS and do not include the morbidity element to the individual. The table also does not include some important areas of costs such as pharmaceutical costs, due to lack of data. (For more detailed description of the estimates, refer to Section 3.1.3).
Under this heading also fall the costs to the social services of handling the consequences of alcohol abuse, but there is no data source to identify these costs.
Cost of Crime
Besides health costs, the report evaluates the cost of crime that could be linked to alcohol use. This report looks at three main types of crimes: violent crimes; petty crimes such as robbery, burglary, theft and criminal damage; and road accidents where alcohol plays a part.
Measuring the cost of a crime is complicated as it needs to consider not only property loss or damage and personal injury, but also the emotional costs of the victim and wider social costs, such a loss of security. In case of injuries and deaths in road accidents relating to drunk driving, the estimates also need to evaluate the morbidity and mortality costs.

Executive Summary
iv
Estimates of the social cost of these crimes and activity levels are taken from literature. The cost of violent and small crimes is taken from a detailed study commissioned by the Home Office on the social and economic costs of crime. The costs of road accidents are taken from the Department for Transport.
Table 2 shows that the total cost of crime is over £1.7 billion. Of this the most substantial cost is related to drunk driving, primarily because road accidents, very often, result in severe casualties or death. Correspondingly, although similar in number, violent crimes result in more than three times the costs of other crimes, because they have a more profound effect on the victim.
Table 2 Cost of Crime Related to Alcohol
Abuse in London (2000 prices)
Item Total activity Total cost Violent crimes 59,000 offences (excluding homicide) £302 million Other crimes such as robbery, burglary, theft and criminal damage
62,000 offences £90 million
Accidents related to drunk driving 1,760 casualties from 1,151 accidents £1,282 million Source: NERA estimates.
Workplace Costs
Lastly, this report evaluates the economic impact of the use of alcohol on employers. Even at moderate consumption levels, alcohol can act as a depressant - impairing reasoning, memory, perception and co-ordination. Alcohol can hence be a cost to the employers, for example through absence from work, reduction in working hours per day, or lower productivity while working. In an extreme case employers might also need to replace the employee.
The workplace cost of alcohol is usually studied under three heads – unemployment, loss of productivity and absenteeism. With the unemployment level in London being close to 7.3%, it is likely that a replacement would be available if an employee is discharged due to alcohol related problems. In this case, the cost to the employer would be the recruitment cost of replacement, for which there is little data available to make reasonable estimates. Similarly, there is no data available to estimate the ‘productivity’ effect of alcohol on employees.
There is a considerable literature on the impact of absenteeism on the economy. Using estimates from literature, we have estimated the cost of absenteeism to the businesses, based on relative absence levels of people with an alcohol problem compared to the average. It is estimated that alcohol abuse results in 1.68 million lost working days – amounting to a cost of over £294 million to London.

Executive Summary
v
Other social costs
Although the loss of an employee from the labour force may impose only limited costs on the previous employee, there is likely to be an ongoing social cost in support for the unemployed and perhaps unemployable individual. Much of this cost may be in social security payments, which are “transfer payments”, transferring money from taxpayers to the recipient, with a net social cost created only by the costs of administration and the distortions of taxation. However the loss of income from employment is a real social cost, to the individual or to his or her dependents. Abuse is also imposed on individuals and their households through hardships that are beyond those of the loss of income and conventional morbidity. However, no data available to estimate the total cost of these.
Social Benefit of Consumption
Attribution of Alcohol Expenditure Across Stakeholders
As a starting point, to estimate the social benefit of alcohol, this report looks in detail at how the £4.6 billion consumer expenditure on alcohol in 2000, is shared between different stakeholders in the market – namely the employees, the businesses and the government.
Employment due to alcohol is mainly generated in the manufacturing and in the distribution and retail of alcoholic drinks. Using the Annual Business Inquiry (ABI), it is estimated that 5,500 jobs are linked to the manufacturing of alcohol that is consumed in London, and another 76,778 jobs (including part-time jobs) are linked to the retail of alcohol. After taking into account the taxes and national insurance paid by the employees on their gross salaries, it is estimated that the net benefit to the employees (including pension) ranges between £408 to £451 million in 2000. The net flow of taxes on income and national insurance to the government is estimated at between £159 to £175 million.
The main flow for the businesses is their net margin (profit net of taxes) on the sale of alcohol. There is little data available in the public domain on the cost of production and distribution costs of alcoholic drinks in London. However, again using ABI statistics, we have estimated the gross margin of the manufacturing, and distribution and retail companies as 15.7% and 15%, respectively. After taking into account the corporation tax on profits, it is estimated that manufacturers earned £399 million, and distributors and retailers earned £137 million in 2000 from alcohol sales in London. The total corporation tax amounts to £115 million.
The revenue from income taxes and national insurance contribution, as well as corporation tax is a very small share of the overall income that is generated for the government by the sale of alcohol. These taxes would also be expected if the resources were released from alcohol production and services to produce other goods and services instead. However, there are other specific taxes on the consumption of alcohol that generate substantial revenues for government, such as excise duty and VAT.

Executive Summary
vi
It is estimated that in addition to taxes on employees and businesses, the government receives around £1.6bn from various duties and taxes on alcohol in London, bringing the total share of government revenue in total expenditure to 41% (£1.9bn).
Table 3 summarises the financial flows arising out of the consumption of alcohol in London.
Table 3 Attribution of Alcohol Expenditure
in London (2000 Prices)
Total expenditure on alcohol £4.62 billion Main beneficiaries: Income for employees £0.41-0.45 billion Profits for businesses £0.54 billion Revenue for government (including taxes on employee incomes and corporate earnings)
£1.85-1.87 billion
Source: NERA
When interpreting this attribution, it is important to note that if the resources employed in producing alcohol-related products and services were not engaged in these activities they would be available to produce other goods and services instead. Thus wages and profits attributable to alcohol are not true measures of social benefit – in the absence of alcohol these expenditures would be generated through other economic activities, albeit with a difficult transition. To an economist, the real social benefit of alcohol lies in its consumption, and in its efficiency as a source of government revenue. However, figures on the production of alcohol related activities provide a measure of their importance today to the national and local economy, and of the transitional costs which would arise were it to markedly contract.
Social Benefit of Alcohol – Consumer Surplus
The primary benefit of alcohol lies in its utility to consumers. People consume alcohol because they value its consumption enough to pay the price for it. Hence, the net direct benefit of alcohol to consumers is the “consumer surplus” - the extent to which the value that consumers place on alcohol exceeds the price they pay.
Measuring consumer surplus is complicated. It requires estimating people’s willingness to pay for different quantities of alcohol (i.e. the demand curve), which is difficult to do in practice. We have made some indicative estimates of consumer surplus by assuming a linear demand curve and using point estimates of demand elasticity of different alcoholic drinks from literature. There is a degree of uncertainty around estimates of this type. Nonetheless, it looks to be a substantial benefit. Table 4 summarises the result.

Executive Summary
vii
Table 4 The Pleasure from Drinking Alcohol
in London (£m)
Beer Cider Wine Spirits Total
Total spend on alcohol 2,257 197 1,228 935 4,617 Willingness to spend on alcohol 3,385 296 1,842 1,403 6,926 Estimated consumer surplus 1,128 99 614 468 2,309
Source: NERA estimate.
It is estimated that people are willing to pay up to 50% more than what they actually spend on alcohol. The total consumer surplus hence is close to £2.3 billion. From a policy perspective it is important to recognise from Table 4, that it is not what people actually pay, it is their willingness to pay that should be taken into account when evaluating the real benefit of consumption, as the two can vary substantially.
Other Social Benefits
Besides the direct benefits to consumers, alcohol in itself contributes to the consumption and viability of other industries for whom, it is almost a necessary complement. For many others its absence is likely to cause a substantial reduction in economic activity. While limitations in data prevent us from making any concrete estimates of the benefit of alcohol to these industries in material terms, this report looks at the impact of alcohol on wider economic activity, the late night economy and tourism as an indicator of how alcohol can affect economic activity, and affect the distribution of income and employment in London. (It is notable that these three areas are interlinked and hence there is an overlap in the benefits.)
The estimated turnover of hotels and restaurants in London is close to £6 billion. More than 1.7 million jobs are associated with these businesses. The late night economy is estimated to be linked to over 0.3 million jobs. Similarly tourist spend in London is over £8.9 billion and tourism supports some 7% of total employment in Great Britain. The economy of all these sectors is affected by the presence and use of alcohol in London. While alcohol solely may not generate much of this activity, it is seen as essential to sustain the level of turnover and employment in these sectors (although, again, if these other sectors contracted they would release resources which would be used to produce other goods and services).
A more substantial benefit, which may be much greater that the direct benefit to consumers, is the impact of alcohol related service on the quality of life. Local neighbourhoods, and the character of London as capital city, are clearly affected by the provision of these services, for which there is no evident substitute. However this is a benefit which appears to be inherently an issue for political judgment rather than explicit valuation.
Executive Summary
viii
Conclusions
The purpose of this study is to inform the debate about the costs and benefits of alcohol in London. It has gathered a wide range of data to understand the market for alcohol in London and to evaluate the consequences of alcohol use and abuse.
The study shows that alcohol plays an important part in life in London. A vast majority of people consume it. The alcohol industry supports a substantial number of jobs and businesses, and also provides significant revenue to the government.
However, all this comes at a cost. The abuse of alcohol results in a number of deaths, morbidity cost to the individual, and substantial treatment costs for the NHS. There are also criminal justice and workplace costs.
Evaluating the effect of alcohol is not an exact science. We have illustrated at each step of the estimation our assumptions, which readers should look at to form their own judgements. Based on those assumptions, this report shows that in dealing with policy related to alcohol use, it is important to take a balanced look at the costs and benefits. It is important to keep in mind the value that people put on the consumption of alcohol, and its general contribution to the quality of life.
From the information available today it is not possible to value all the costs and benefits of alcohol, nor of the impacts of more or less tight regulation. Some of these omissions are substantial, in particular the contribution of alcohol to the quality of life of London residents and to London as capital city. However, these estimates do provide broad indicators of the economic and social effects of alcohol on London.

Introduction
1
1. INTRODUCTION
This report evaluates the social costs and benefits of alcohol consumption in London. It studies the alcohol market in London and identifies the main costs and benefits – quantifying their impact where possible.
The Greater London Authority (GLA) commissioned NERA to undertake this study as an input to a consultation document “Agenda for action on alcohol in London” that is to be published in early 2003. While a wide variety of literature and data is available on the effects of alcohol consumption and trade worldwide and for the UK, there is little research that focuses specifically on London. Hence, the purpose of this report is to focus on costs and benefits of alcohol to London. It is worth noticing that much of the literature focuses on social costs of alcohol. To provide a balance we have gone into some detail to explore potential benefits.
The consumption of alcohol affects physical and psychological well-being of individuals. Yet many individuals, who are perhaps aware of its negative affects, still consume it.3 Recent studies have shown that alcohol dependent workers may affect productivity.4 On the other hand the consumption of alcohol supports an industry and its employees. The government also earns a large portion of its revenues directly from the alcohol industry. It also brings substantial benefits to consumers, who (apart form the small minority who are addicted) would not otherwise buy the product. Much research has compared the numbers for these various costs and benefits, including government outlays to treat ill health or protect people from crime that may be attributable to alcohol consumption.
This report looks at three main stakeholders in the market of alcohol - the general public, businesses, and the government. The framework under which this study analyses the cost of alcohol consumption has to balance the impact of alcohol on each party. To the extent that is making judgments about the distribution of costs and benefits between different groups, this exercise is fairly subjective.
The analytical literature on the social cost of alcohol consumption can be divided into four important perspectives: public health, public finance, public choice and welfare economics. Each has its distinctive perspective. While public health is an important issue, it is clearly only one of many. The same is true of public finance. Public choice theory takes an overview, but from a perspective of rival stakeholder influences on policy. Welfare economics takes a more formal, quantitative overview, which can subsume public health and public finance analysis, by explicitly identifying all the social costs and benefits and
3 According to Lader and Meltzer (2001), 71% of people in the UK who drink alcohol over the prescribed limits, know about the prescribed limit of consumption.
4 Discussed in Section 3.3.
Introduction
2
where they fall. It is the approach that we see as the most useful analytical basis for this study.
The welfare economics approach allows evaluation of each cost and benefit separately; hence it can be used to inform the policy makers and the stakeholders about the comparative costs and benefits. A basic limitation of this perspective is the difficulties in measurement and valuation of issues that are very complicated to assess, such as pleasure from drinking. Estimates in these cases are at best a qualified approximation. Where measurement is possible, data availability is often limited. This is particularly true in the case of London, as regional data for London is often not detailed. Where data limitation does not allow quantification, we qualitatively assess the extent of costs and benefits by looking at previous research or data from other regions.
The social costs of alcohol are sometimes divided into internal and external costs and benefits. Internal costs and benefits are obvious and seen by consumers in their decision to consume alcohol. External costs and benefits in contrast are not considered in decision making by individuals either because they fall on others, or because consumers lack information about them – for example the cost of unemployment caused due to excessive drinking.
The report first studies the market for alcohol in Section 2. This forms the basis of our estimation of costs in Section 3, and benefits in Section 4. The final section presents a summary of our estimates and some important conclusions.
The Market for Alcohol
3
2. THE MARKET FOR ALCOHOL
The section provides a snapshot of the main attributes of the market for alcohol in London. The market for alcohol is far broader than just the use of alcohol in beverages. However this section only presents the level of expenditure and consumption of alcohol in London. The broader implications of alcohol consumptions are discussed in Sections 3 and 4.
2.1. London in Brief
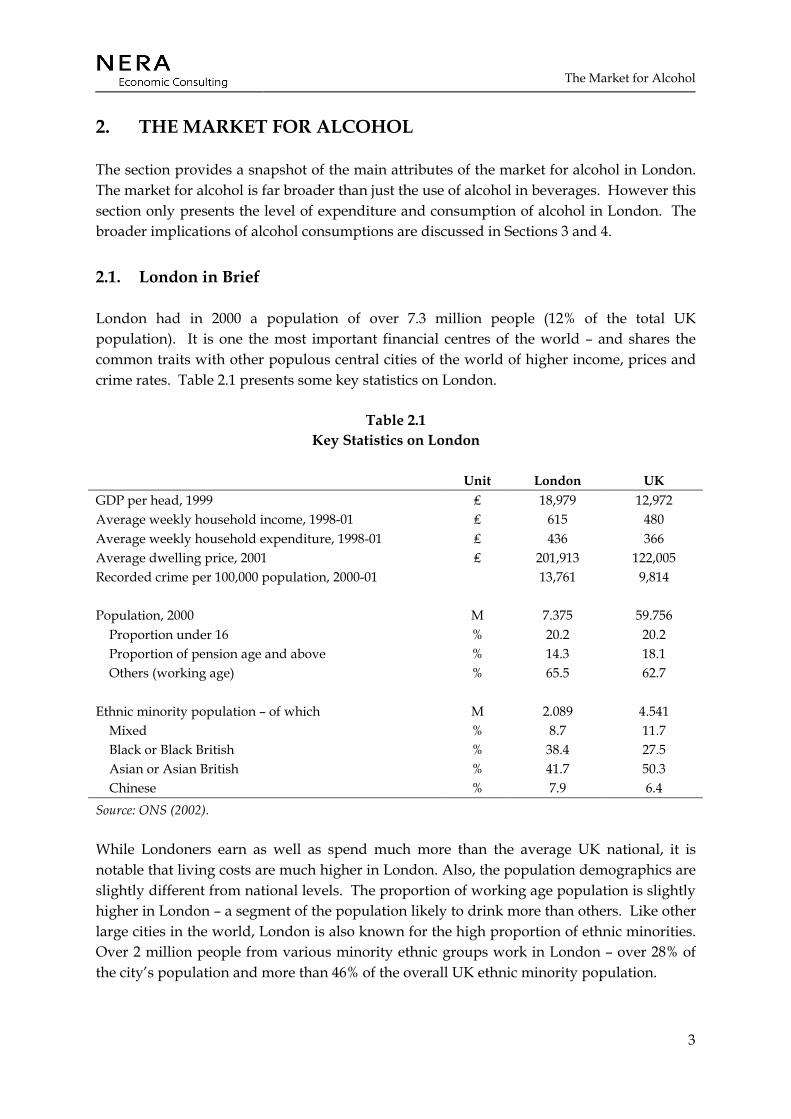
London had in 2000 a population of over 7.3 million people (12% of the total UK population). It is one the most important financial centres of the world – and shares the common traits with other populous central cities of the world of higher income, prices and crime rates. Table 2.1 presents some key statistics on London.
Table 2.1 Key Statistics on London
Unit London UK GDP per head, 1999 ₤ 18,979 12,972 Average weekly household income, 1998-01 ₤ 615 480 Average weekly household expenditure, 1998-01 ₤ 436 366 Average dwelling price, 2001 ₤ 201,913 122,005 Recorded crime per 100,000 population, 2000-01 13,761 9,814 Population, 2000 M 7.375 59.756 Proportion under 16 % 20.2 20.2 Proportion of pension age and above % 14.3 18.1 Others (working age) % 65.5 62.7 Ethnic minority population – of which M 2.089 4.541 Mixed % 8.7 11.7 Black or Black British % 38.4 27.5 Asian or Asian British % 41.7 50.3 Chinese % 7.9 6.4 Source: ONS (2002).
While Londoners earn as well as spend much more than the average UK national, it is notable that living costs are much higher in London. Also, the population demographics are slightly different from national levels. The proportion of working age population is slightly higher in London – a segment of the population likely to drink more than others. Like other large cities in the world, London is also known for the high proportion of ethnic minorities. Over 2 million people from various minority ethnic groups work in London – over 28% of the city’s population and more than 46% of the overall UK ethnic minority population.
The Market for Alcohol
4
In the calculation of costs and benefits it is important to remember the differences between London and the rest of the UK. Calculations for London need to take into account the population and income traits of Londoners.
2.2. Main Aspects of the Market
Alcohol is consumed in the form of wines, beers and spirits. These beverages differ primarily in their method of production. The alcohol used in these beverages is ethanol, which varies in its extent in these drinks (see Table 2.2).
Table 2.2 Typical Alcohol Volume, by Type of Drink
Percent Beers 2-8 Unfortified wines 8-14 Fortified wines 20 Spirits 40-50
Source: Cook and Moore (1999).
The individual consumption, price, taxation and other attributes of each of these beverages differ between genders, age groups and areas. The UK as a whole is predominantly a beer-drinking society with more than half of all alcohol consumed in beer form in 2000, compared to a quarter of the consumption in wine form and the rest in spirits and alcopops.5,6
2.2.1. Expenditure
Based on the Family Expenditure Survey (FES) the Office of National Statistics (ONS) estimates that average household expenditure in London on alcoholic drinks is ₤16.40 per week, or 3.76% of their total expenditure. This is slightly less than the 4.05% average for the UK.
Total expenditure on alcohol in London implied by the FES statistics is ₤2.7bn in 2000. This is 14% of the total expenditure on alcohol in the UK (₤19.6bn). However, the approach used by the FES seems to underestimate both expenditure on alcohol as well as overall expenditure by households. According to Consumer Trends (CT), based on the figures released by the Customs and Excise, in 2000 total spend on the purchase of alcohol in the UK is close to ₤33.6bn – which is 5.70% of overall consumer expenditure (£589.2bn).7 This implies that the FES data under-reports alcohol consumption by 41% at the national level.
5 The term ‘alcopops’ is used to describe flavoured alcoholic drinks and pre-mixed spirits. It may also contain some ciders.
6 Beer & Pub Association (2001). 7 ONS (2001a).
The Market for Alcohol
5
Under-reporting in the FES data is probably because it looks at household expenditure on alcohol and hence may exclude expenditure by businesses. Also, it is possible that in a survey people may not provide an accurate assessment of their consumption. Assuming, a similar level of under-reporting for London as for the UK, implies ₤28.8 per week expense by the households (₤ 4.62bn in total). (A more detailed description of this expenditure on the basis of different drink types is presented in Table 2.7).
2.2.2. Frequency of drinking
Detailed figures on the frequency and volume of alcohol consumption are not available for London. However the ONS surveys provide good information on the consumption patterns of individuals in the UK. We have used the data from these surveys and adapted it to London.
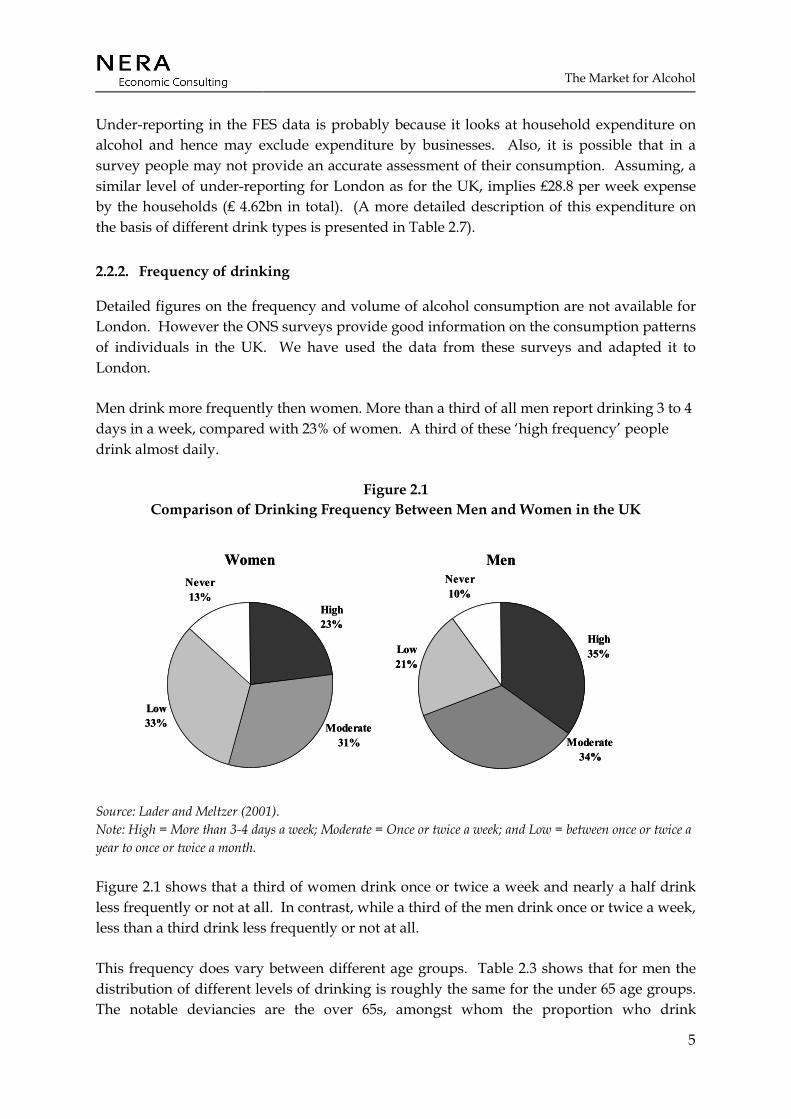
Men drink more frequently then women. More than a third of all men report drinking 3 to 4 days in a week, compared with 23% of women. A third of these ‘high frequency’ people drink almost daily.
Figure 2.1 Comparison of Drinking Frequency Between Men and Women in the UK
Women
Low33%
Never13%
High23%
Moderate31%
Men
Low21%
Never10%
High35%
Moderate34%
Women
Low33%
Never13%
High23%
Moderate31%
Men
Low21%
Never10%
High35%
Moderate34%
Source: Lader and Meltzer (2001). Note: High = More than 3-4 days a week; Moderate = Once or twice a week; and Low = between once or twice a year to once or twice a month.
Figure 2.1 shows that a third of women drink once or twice a week and nearly a half drink less frequently or not at all. In contrast, while a third of the men drink once or twice a week, less than a third drink less frequently or not at all.
This frequency does vary between different age groups. Table 2.3 shows that for men the distribution of different levels of drinking is roughly the same for the under 65 age groups. The notable deviancies are the over 65s, amongst whom the proportion who drink

The Market for Alcohol
6
moderately is much lower than the other age groups. Also notable is the small proportion of abstainers and low frequency drinkers in the 25-44 age groups.
For women the pattern of consumption between the 16-24 and 25-44 groups is fairly similar. Compared to the overall average, their proportion of moderate drinkers is almost 20% higher than for the over 65s. The 45-64 age groups have more high frequency drinkers but the 65 and over age groups have many more low frequency drinkers and non-drinkers. With age the combination of moderate and high frequency drinkers goes down, and that of low frequency and non-drinkers goes up. This is also reflected in the very high proportion of over 65s that do not drink at all.
Table 2.3 Frequency of Drinking, by Age and Gender (Percentage of Total)
Men Women Age 16-24 25-44 45-64 65+ 16-24 25-44 45-64 65+ High 30 36 34 38 22 21 26 20 Moderate 38 38 35 23 38 36 31 17 Low 22 18 23 26 30 32 33 37 Never 11 8 9 13 11 10 11 26
Source: Lader and Meltzer (2001). Note: High = More than 3-4 days a week; Moderate = Once or twice a week; and Low = between once or twice a year to once or twice a month.
2.2.3. Volume of drinking
Alcohol can become a significant health problem if it is consumed in excess. According to the Department of Health, drinking 21 units a week for men and 14 units a week for women is unlikely to cause serious harm to the individual.8 However, 24% of men and 15% of women, on average, pass this limit.
8 A unit of alcohol is defined as 8 grams by weight or 1cl (10ml) by volume of pure alcohol. This approximately is the amount of alcohol in half a pint of ordinary strength beer, a single pub measure of spirits (25ml), or a small glass of ordinary wine.

The Market for Alcohol
7
Figure 2.2 Comparison of Alcohol Consumption Between Men and Women (UK)
WomenNon-
drinkers13%
< 1 unit22%
1-7 units34%
Over 14 units15%
8-14 units16%
MenNon-Drinkers
9%
< 1 unit12%
1-10 units33%
Over 21 units24%
11-21 units22%
WomenNon-
drinkers13%
< 1 unit22%
1-7 units34%
Over 14 units15%
8-14 units16%
MenNon-Drinkers
9%
< 1 unit12%
1-10 units33%
Over 21 units24%
11-21 units22%
Source: Lader and Meltzer (2001).
Figure 2.2 shows that not only women are less frequent drinkers, but the proportion of women that drink over the prescribed limit is also less than men. Also notable is the fact that of the people who drink, a fair proportion of both men and women drink less than a unit per week. Moreover, four-fifths of women and three-fourths of men in the UK drink below the prescribed limit of alcohol consumption. It is important to note that many of the problems caused by alcohol that this report intends to cost are not related to these moderate and low-end consumers. Most of the costs are related to a small proportion of high-end consumers and ‘binge’ drinkers.
The consumption pattern differs markedly between different regions in the UK. Data from the General Household Survey suggests that Londoners drink less compared to the rest of the country. A comparison of the consumption in 1998-99 amongst adults on the heaviest drinking day suggests that the proportion that drank over 4 units for men and 3 units for women (roughly the prescribed daily limit) was much lower for Londoners than for the rest of the country.
The Market for Alcohol
8
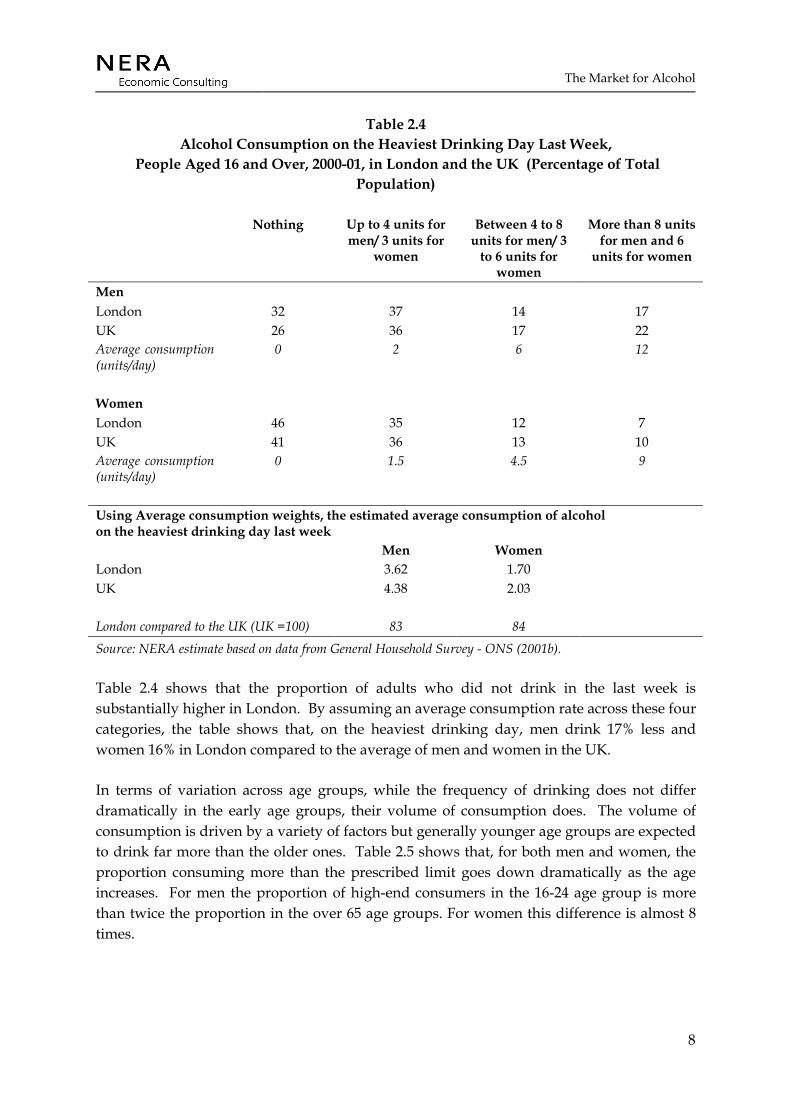
Table 2.4 Alcohol Consumption on the Heaviest Drinking Day Last Week,
People Aged 16 and Over, 2000-01, in London and the UK (Percentage of Total Population)
Nothing Up to 4 units for men/ 3 units for
women
Between 4 to 8 units for men/ 3
to 6 units for women
More than 8 units for men and 6
units for women
Men London 32 37 14 17 UK 26 36 17 22 Average consumption (units/day)
0 2 6 12
Women London 46 35 12 7 UK 41 36 13 10 Average consumption (units/day)
0 1.5 4.5 9
Using Average consumption weights, the estimated average consumption of alcohol on the heaviest drinking day last week
Men Women London 3.62 1.70 UK 4.38 2.03 London compared to the UK (UK =100) 83 84 Source: NERA estimate based on data from General Household Survey - ONS (2001b).
Table 2.4 shows that the proportion of adults who did not drink in the last week is substantially higher in London. By assuming an average consumption rate across these four categories, the table shows that, on the heaviest drinking day, men drink 17% less and women 16% in London compared to the average of men and women in the UK.
In terms of variation across age groups, while the frequency of drinking does not differ dramatically in the early age groups, their volume of consumption does. The volume of consumption is driven by a variety of factors but generally younger age groups are expected to drink far more than the older ones. Table 2.5 shows that, for both men and women, the proportion consuming more than the prescribed limit goes down dramatically as the age increases. For men the proportion of high-end consumers in the 16-24 age group is more than twice the proportion in the over 65 age groups. For women this difference is almost 8 times.
The Market for Alcohol
9
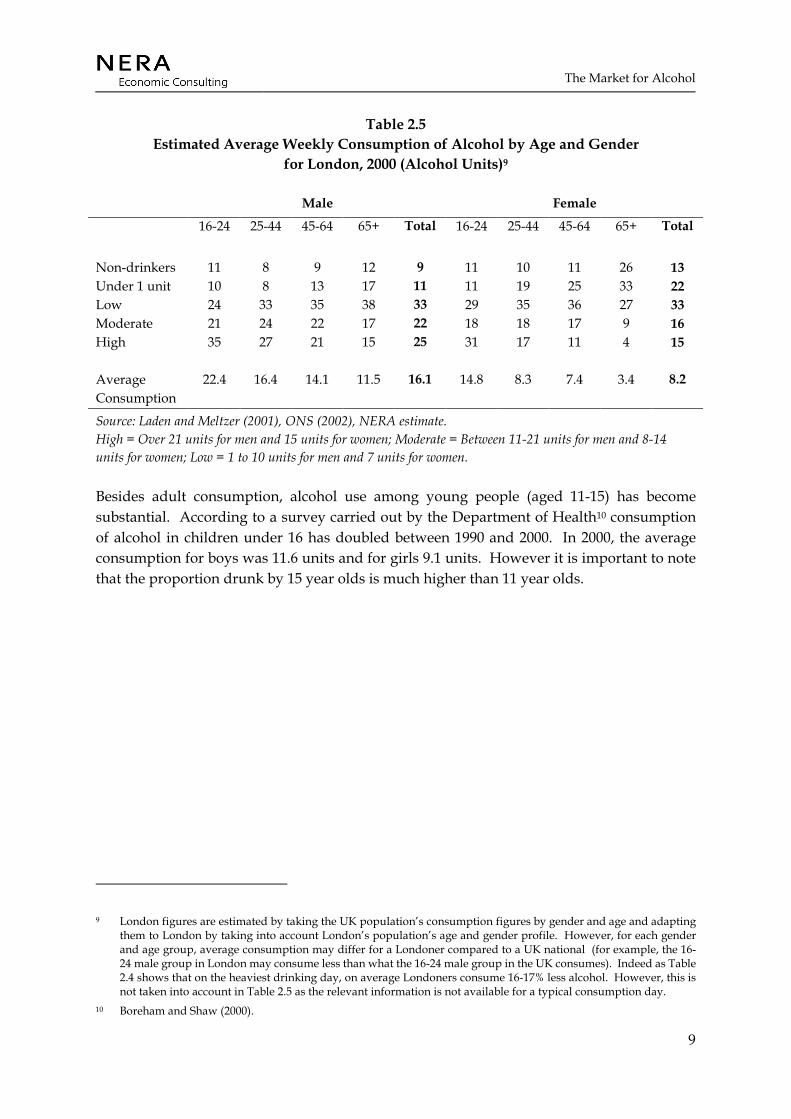
Table 2.5 Estimated Average Weekly Consumption of Alcohol by Age and Gender
for London, 2000 (Alcohol Units)9
Male Female
16-24 25-44 45-64 65+ Total 16-24 25-44 45-64 65+ Total
Non-drinkers 11 8 9 12 9 11 10 11 26 13 Under 1 unit 10 8 13 17 11 11 19 25 33 22 Low 24 33 35 38 33 29 35 36 27 33 Moderate 21 24 22 17 22 18 18 17 9 16 High 35 27 21 15 25 31 17 11 4 15 Average Consumption
22.4 16.4 14.1 11.5 16.1 14.8 8.3 7.4 3.4 8.2
Source: Laden and Meltzer (2001), ONS (2002), NERA estimate. High = Over 21 units for men and 15 units for women; Moderate = Between 11-21 units for men and 8-14 units for women; Low = 1 to 10 units for men and 7 units for women.
Besides adult consumption, alcohol use among young people (aged 11-15) has become substantial. According to a survey carried out by the Department of Health10 consumption of alcohol in children under 16 has doubled between 1990 and 2000. In 2000, the average consumption for boys was 11.6 units and for girls 9.1 units. However it is important to note that the proportion drunk by 15 year olds is much higher than 11 year olds.
9 London figures are estimated by taking the UK population’s consumption figures by gender and age and adapting them to London by taking into account London’s population’s age and gender profile. However, for each gender and age group, average consumption may differ for a Londoner compared to a UK national (for example, the 16-24 male group in London may consume less than what the 16-24 male group in the UK consumes). Indeed as Table 2.4 shows that on the heaviest drinking day, on average Londoners consume 16-17% less alcohol. However, this is not taken into account in Table 2.5 as the relevant information is not available for a typical consumption day.
10 Boreham and Shaw (2000).
The Market for Alcohol
10
Table 2.6 Estimated Consumption of 100% Pure Alcohol, London and the UK, 2000
Consumers Average weekly consumption
Yearly consumption
Yearly Consumption
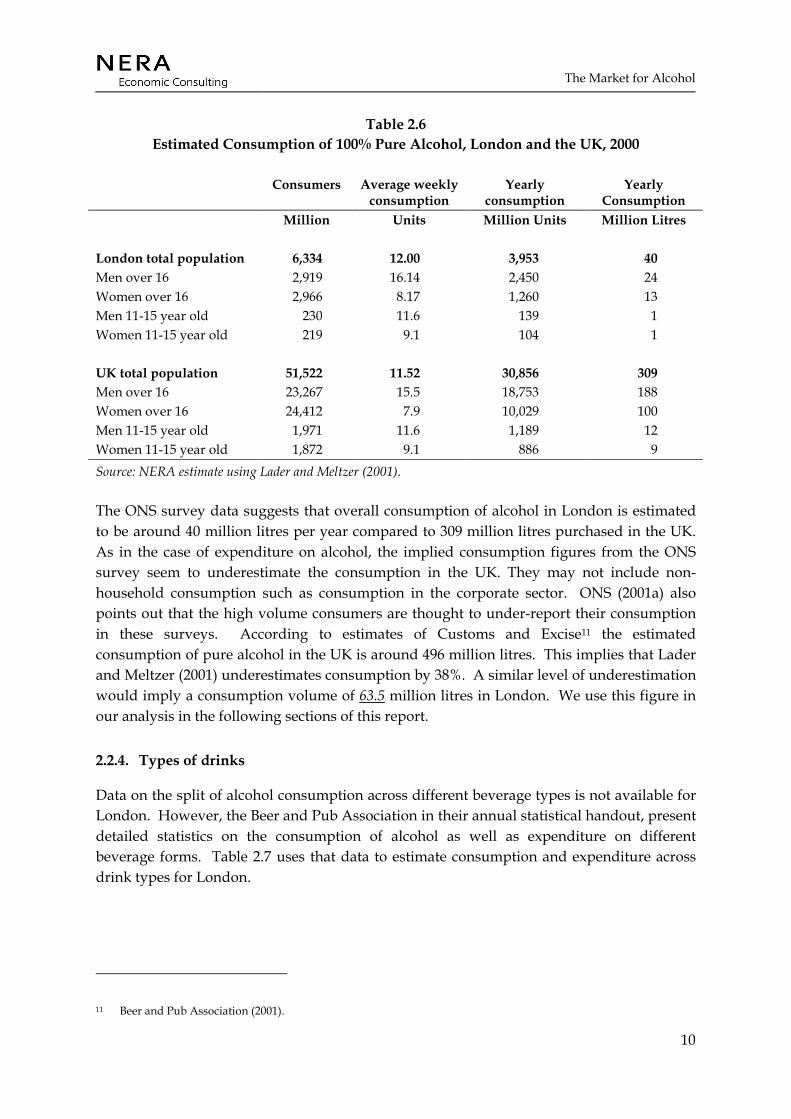
Million Units Million Units Million Litres London total population 6,334 12.00 3,953 40 Men over 16 2,919 16.14 2,450 24 Women over 16 2,966 8.17 1,260 13 Men 11-15 year old 230 11.6 139 1 Women 11-15 year old 219 9.1 104 1 UK total population 51,522 11.52 30,856 309 Men over 16 23,267 15.5 18,753 188 Women over 16 24,412 7.9 10,029 100 Men 11-15 year old 1,971 11.6 1,189 12 Women 11-15 year old 1,872 9.1 886 9 Source: NERA estimate using Lader and Meltzer (2001).
The ONS survey data suggests that overall consumption of alcohol in London is estimated to be around 40 million litres per year compared to 309 million litres purchased in the UK. As in the case of expenditure on alcohol, the implied consumption figures from the ONS survey seem to underestimate the consumption in the UK. They may not include non-household consumption such as consumption in the corporate sector. ONS (2001a) also points out that the high volume consumers are thought to under-report their consumption in these surveys. According to estimates of Customs and Excise11 the estimated consumption of pure alcohol in the UK is around 496 million litres. This implies that Lader and Meltzer (2001) underestimates consumption by 38%. A similar level of underestimation would imply a consumption volume of 63.5 million litres in London. We use this figure in our analysis in the following sections of this report.
2.2.4. Types of drinks
Data on the split of alcohol consumption across different beverage types is not available for London. However, the Beer and Pub Association in their annual statistical handout, present detailed statistics on the consumption of alcohol as well as expenditure on different beverage forms. Table 2.7 uses that data to estimate consumption and expenditure across drink types for London.
11 Beer and Pub Association (2001).
The Market for Alcohol
11
Table 2.7 Volume and Expenditure of Alcohol Consumed (London Estimates), by Drink Type
Beer Cider Wine Spirits (pure alcohol)
Total
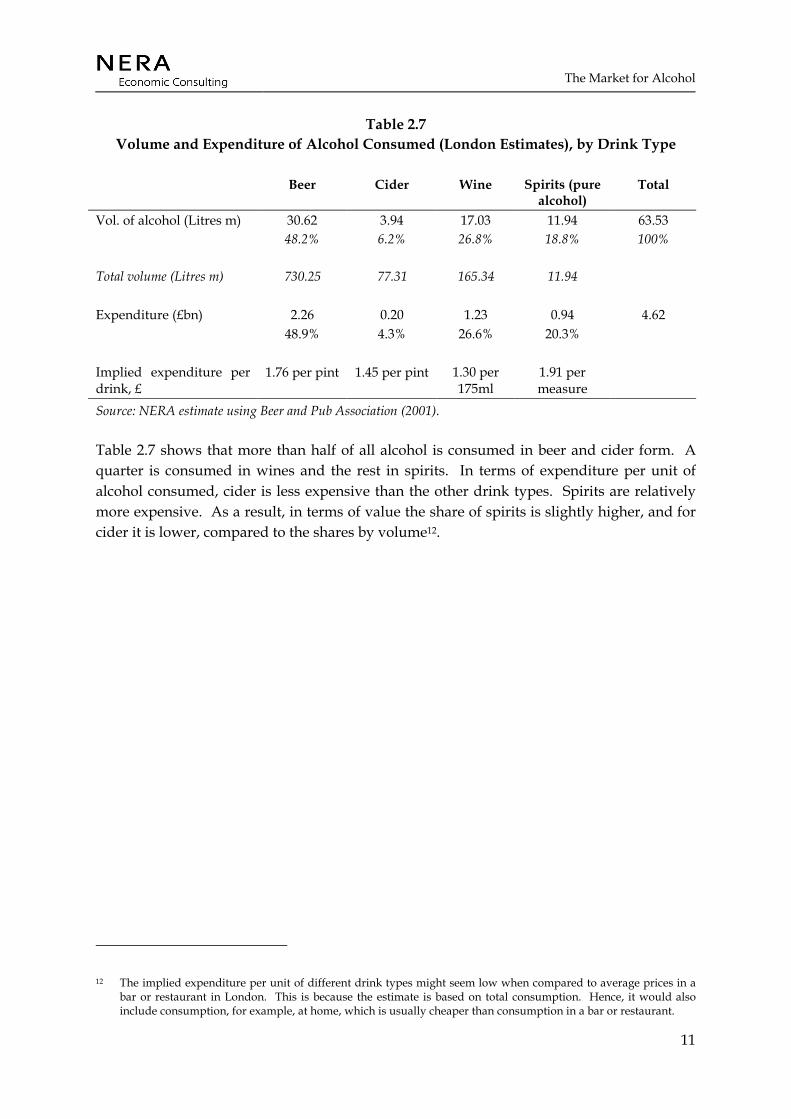
Vol. of alcohol (Litres m) 30.62 3.94 17.03 11.94 63.53 48.2% 6.2% 26.8% 18.8% 100% Total volume (Litres m) 730.25 77.31 165.34 11.94 Expenditure (£bn) 2.26 0.20 1.23 0.94 4.62 48.9% 4.3% 26.6% 20.3% Implied expenditure per drink, £
1.76 per pint 1.45 per pint 1.30 per 175ml
1.91 per measure
Source: NERA estimate using Beer and Pub Association (2001).
Table 2.7 shows that more than half of all alcohol is consumed in beer and cider form. A quarter is consumed in wines and the rest in spirits. In terms of expenditure per unit of alcohol consumed, cider is less expensive than the other drink types. Spirits are relatively more expensive. As a result, in terms of value the share of spirits is slightly higher, and for cider it is lower, compared to the shares by volume12.
12 The implied expenditure per unit of different drink types might seem low when compared to average prices in a bar or restaurant in London. This is because the estimate is based on total consumption. Hence, it would also include consumption, for example, at home, which is usually cheaper than consumption in a bar or restaurant.

The Market for Alcohol
12
2.2.5. Consumption by minority ethnic group
Table 2.8 Consumption in the Last Week on the Heaviest Drinking Day, by Ethnic Minority
Groups (Percentage of Total)
Age Black C’bbean
Indian Pakistani B’deshi Chinese Irish National
Men More than 8 units 10 10 1 2 2 35 25 Between 4 and 8 units 17 12 2 0 6 23 20 Up to 4 units 35 22 2 1 29 21 31 Never 38 56 95 98 63 21 23 Women More than 6 units 6 2 1 0 3 14 12 Between 3 and 6units 12 3 0 0 6 23 17 Up to 3 units 32 9 1 0 20 28 33 Never 51 85 98 100 72 35 38 Source: ONS (2001a).
Detailed figures on the volume and frequency of consumption, and expenditure on alcohol are not available for different minority ethnic groups. However, the Health Survey for England asks men and women of different ethnic backgrounds whether they had consumed alcohol in the last week. The result show that, other than the Irish, both men and women in minority ethnic groups were less likely to have drunk in the last week. For Pakistanis and Bangladeshis, an overwhelming majority is likely not to have drunk at all in the last week.
Both Irish men and women are likely to have drunk more than the national average. They are also likely to drink more on their heaviest drinking day.
2.2.6. Prices and affordability
The prices of alcoholic drinks have been rising steadily, relative to inflation, for many years. Between 1985 and 2000, the prices of all alcoholic drinks have increased by up to an additional 20% over the increase in retail prices.13 However, during the same period real incomes have risen by over 57%, resulting in alcohol being more affordable to the consumers – to the tune of 40% for certain drink types (for data on income and price change see Table A.1). Within alcoholic drinks, the major increase in prices is seen in beers and spirits.
Figure 2.3 shows the trend in the affordability of beverages that contain alcohol. Affordability is defined as the difference between rise in income compared to the rise in
13 Based on retail price index including all items.

The Market for Alcohol
13
prices. It shows that between 1985 and 2000, the affordability of alcoholic drinks increased consistently apart from 1990-91, where prices rose much faster than real incomes. Between 1985-2000, the affordability of wines has increased by over 60%, compared to beers and wines whose affordability increase by less than 30%.
Figure 2.3 Affordability of Alcoholic Drinks, UK (1985=100)
75
100
125
150
175
1985198619871988198919901991199219931994199519961997199819992000
Affo
rdab
ility
inde
x (1
985=
100)
All alcoholic drinks Beers
Wines Spirits
Source: NERA estimate.
This market analysis suggests that alcohol is a major part of life for people of all ages in London. About 20 percent of people drink to levels which exceed the governments recommended limits, the proportion drinking to the point at which they may cause substantial harm to themselves and to the society appears to be much smaller. The evidence suggests that average consumption in London is lower than the rest of the UK. Other aspects of the market of alcohol in London in terms of their social costs and benefits are discussed in Sections 3 and 5 respectively.
Evaluation of Costs
14
3. EVALUATION OF COSTS
The costs of excessive alcohol consumption accrue to the individual and to society. On an individual level, even moderate levels of alcohol consumption may lead to physical and psychological harm. This effect on personal health may affect not just the individual himself but also government and businesses. The following sections illustrate this by analysing the social costs of alcohol including: health costs (costs to the individuals and the NHS), costs of crime (including drunk driving), and workplace costs.
3.1. Health Costs
It is important to distinguish between ill health of the individual who is consuming alcohol and those who suffer ill health or injury as a result of another’s alcohol consumption (such as a road accident arising from drunk driving).
Thus the types and costs of ill health that are related to alcohol are divided into two levels: costs at an individual level, and at the level of the NHS. Although these costs are related (those who become seriously ill necessitate a cost to the NHS), this report examines the way that these costs are distributed between the NHS and the individual.
The report goes further than just looking at costs that arise in instances where alcohol is the sole cause of harm (for example death due to binge drinking) – often termed as direct costs of alcohol. This report also evaluates instances where alcohol indirectly causes significant harm by aggravating harm caused by other sources.
Costs incurred in the health system as a result of criminal activity (e.g. drunk driving) are considered in a later section on the costs of alcohol-related crime.
3.1.1. Ill health due to alcohol consumption
Individuals face health risks from alcohol in two instances: the first where there is a high level of alcohol consumed in a rapid space of time (so called binge drinking), second where there is a high level of alcohol consumed and sustained over the longer term (leading to addiction and long term health risks).
The acute effects of alcohol can be described according to the level of alcohol in the blood. Table 3.1 sets out the main effects from a low level of blood alcohol through to the effects of excessive drinking.
Evaluation of Costs
15
Table 3.1 Acute Effects of Alcohol
Blood alcohol
level (mg/100ml)
Estimated no. of consecutively drunk
pints of beer per average man
Effects
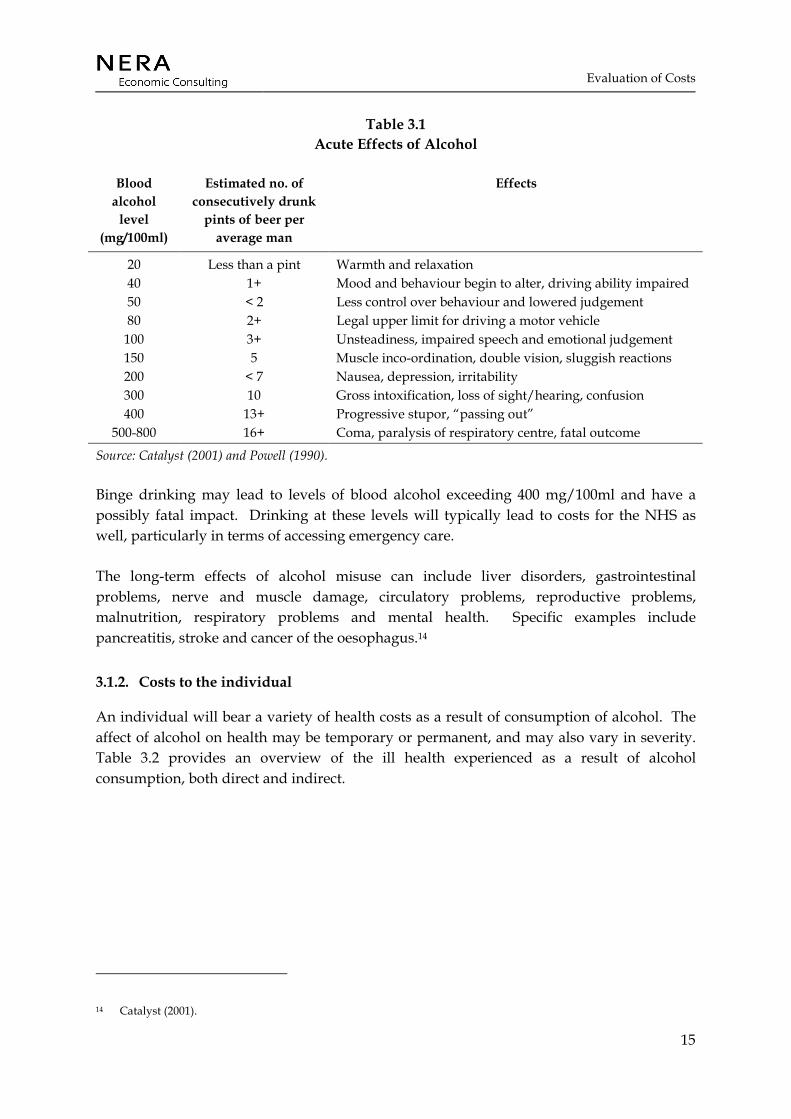
20 Less than a pint Warmth and relaxation 40 1+ Mood and behaviour begin to alter, driving ability impaired 50 < 2 Less control over behaviour and lowered judgement 80 2+ Legal upper limit for driving a motor vehicle
100 3+ Unsteadiness, impaired speech and emotional judgement 150 5 Muscle inco-ordination, double vision, sluggish reactions 200 < 7 Nausea, depression, irritability 300 10 Gross intoxification, loss of sight/hearing, confusion 400 13+ Progressive stupor, “passing out”
500-800 16+ Coma, paralysis of respiratory centre, fatal outcome
Source: Catalyst (2001) and Powell (1990).
Binge drinking may lead to levels of blood alcohol exceeding 400 mg/100ml and have a possibly fatal impact. Drinking at these levels will typically lead to costs for the NHS as well, particularly in terms of accessing emergency care.
The long-term effects of alcohol misuse can include liver disorders, gastrointestinal problems, nerve and muscle damage, circulatory problems, reproductive problems, malnutrition, respiratory problems and mental health. Specific examples include pancreatitis, stroke and cancer of the oesophagus.14
3.1.2. Costs to the individual
An individual will bear a variety of health costs as a result of consumption of alcohol. The affect of alcohol on health may be temporary or permanent, and may also vary in severity. Table 3.2 provides an overview of the ill health experienced as a result of alcohol consumption, both direct and indirect.
14 Catalyst (2001).

Evaluation of Costs
16
Table 3.2 Nature of Health Costs at the Individual Level
Temporary effects Permanent effects Severe effects
Direct Effect of temporary ill health after drinking e.g. headache, nausea and fatigue
Effect of permanent ill health after high levels of consumption over a period of time e.g. liver cirrhosis
Mortality as a result of binge drinking
Indirect Effect of temporary ill health as a result of personal injury after drinking e.g. falling over
Effect of accidents as a result of drinking.
Mortality as a result of accidents after drinking
Source: NERA.
3.1.2.1. Temporary effects
Comparatively low levels of alcohol use often results in short-term health effects such as fatigue, nausea, headache and loss of coordination. This may further lead to indirect costs such as minor injuries. While, these health effects might not result in any material costs, they do affect an individual’s quality of life – often termed as morbidity.
Data on the temporary effects of alcohol is difficult to find – not least due to the variety of types of effects involved. However, the previous section shows that 17% of men drink over 8 units (equivalent to 4 pints of beer) on their heaviest drinking day and 7% of women drink over 6 units (equivalent to 3 pints of beer) (see Table 2.4). At these levels individuals face muscle in-coordination and are susceptible to morbidity. Hence, although not quantifiable it is clear that a large proportion of London’s population faces these costs.
Alcohol is released from the bloodstream at 10 mg (or one unit) per hour.15 Therefore, these temporary affects may affect the individual for a considerable amount of time, affecting his or her productivity. A possible cost arising from this is the affect on workplace productivity. These costs are estimated in Section 3.3.
3.1.2.2. Permanent effects
Permanent costs of alcohol use range from greater difficulty in performing everyday tasks to more serious health impacts, such as cancer. Indirect permanent costs may take the form of much higher use of A&E facilities in hospitals to loss of life from accidents. Potentially these costs could be substantial. Estimates suggest that there are more than 0.2 million problem alcohol users in London in the age range 15 to 64.16 These form the pool of people that are at
15 Powell (1990). 16 London Health Observatory, Alcohol Misuse http://www.lho.org.uk/hil/alcohol.htm.

Evaluation of Costs
17
risk from these permanent effects. However, as with temporary effects, the morbidity related to permanent affects is not easily quantifiable.
There also external costs related to permanent effects of alcohol – for example, loss of output (see Section 3.3) and additional A & E costs.
3.1.2.3. Severe effects - Mortality
Excessive alcohol consumption, or actions under the influence of alcohol may lead to death. Of the total number of deaths in London (64,583 in 1999), it is estimated that the annual average number of deaths due to alcohol is 808 (estimated using 1998 –2000 data). 17 This suggests that the London specific direct mortality as a result of alcohol is 1.25 per cent. This is in line with national data. Published mortality figures by cause of death for England and Wales18 suggest 5,508 deaths related to alcohol use in 1999 (see Table A.2) out of total number of deaths of 556,100 in 199919 - implying 1% of deaths to be related to alcohol.
Alcohol may also contribute to mortality indirectly, as it can increase the prevalence of particular diseases. Work undertaken by Godfrey and Hardman (1994) made use of attributable fractions of alcohol in overall mortality derived from clinical studies to provide an estimate of indirect mortality due to alcohol. Table A.3 reproduces these attribution fractions for specific diseases for males and females. We have used these attribution fractions and data on London specific mortality provided by the LHO to determine the level of indirect mortality in London due to alcohol. The figures imply that that on top of the 808 deaths directly related to alcohol there are a further 1,648 deaths indirectly related to alcohol in 1999.
Valuing the cost of mortality has been the source of considerable discussion in the health literature. Despite the difficulties in valuing the loss of a human life, the UK government has taken information based upon the willingness to pay approach.20 The ‘human’ costs element (capturing morbidity) ranges from £7,640 for a slight injury, to £104,300 for a serious injury and £750,640 for a fatal injury (all figures for 2000). 21
Applying the fatal human cost element to the number of deaths in London directly attributable to alcohol would imply a figure of £0.61 billion (in 2000 prices). Applying the fatal human cost to indirect mortality due to alcohol gives a figure of £1.24 billion (in 2000 prices).
17 London Health Observatory analysis of ONS data. 18 ONS (2001a). 19 ONS (1999a). 20 Department for Transport (2000). 21 These figures are used in government mainly but not only for the analysis of transport safety. We use them to
estimate the overall human costs of alcohol-related death in the absence of any more specific data.

Evaluation of Costs
18
3.1.3. Costs to the NHS
The NHS provides health care service to all individuals within the UK. The type of services provided include:
• Primary care: This consists of General Practitioners (GPs) who provide a range of family health services. GPs may be involved in dealing with alcohol-related health problems when these are not urgent. This may include managing of symptoms and prescribing. GPs are also involved in preventative care.
• Secondary care: This consists of specialists in the hospital setting who provide inpatient and outpatient care. Secondary care also encompasses the provision of emergency care – i.e. for those who bypass primary care and attend Accident and Emergency departments.
In addition, Local Authorities will incur some alcohol-related costs (e.g. costs of residential rehabilitation and day-care programmes). In the time available, we have not been able to identify alcohol- and London-specific costs, but we recognise that this will be an addition to health-related costs.
We discuss the cost to each in turn.
3.1.3.1. Primary care costs
Alcohol misuse may results in extra activity in the primary care sector. The main areas of expense in the primary care sector include
• GP and practice nurse consultations
• Laboratory tests (e.g. liver function tests, and tests for the level of blood alcohol)
• Others (such as community psychiatric team contacts and pharmaceuticals)
GP and practice nurse consultations
Estimates of primary care activity related to alcohol consumption and the extent of their cost to London are not available. However, we have made some estimates on the relative extent of primary care activity that could be attributed to alcohol consumption.
For GP and practice nurses consultations we have used the annual average consultations per person from the General Household Survey (ONS (2001b)) by gender and age group. We have adapted this data to London by taking into account the gender and age profile of London’s population. The estimate for London implies 36.5 million GP consultations and 10.7 million practice nurse consultations in London in 2000.
Evaluation of Costs
19
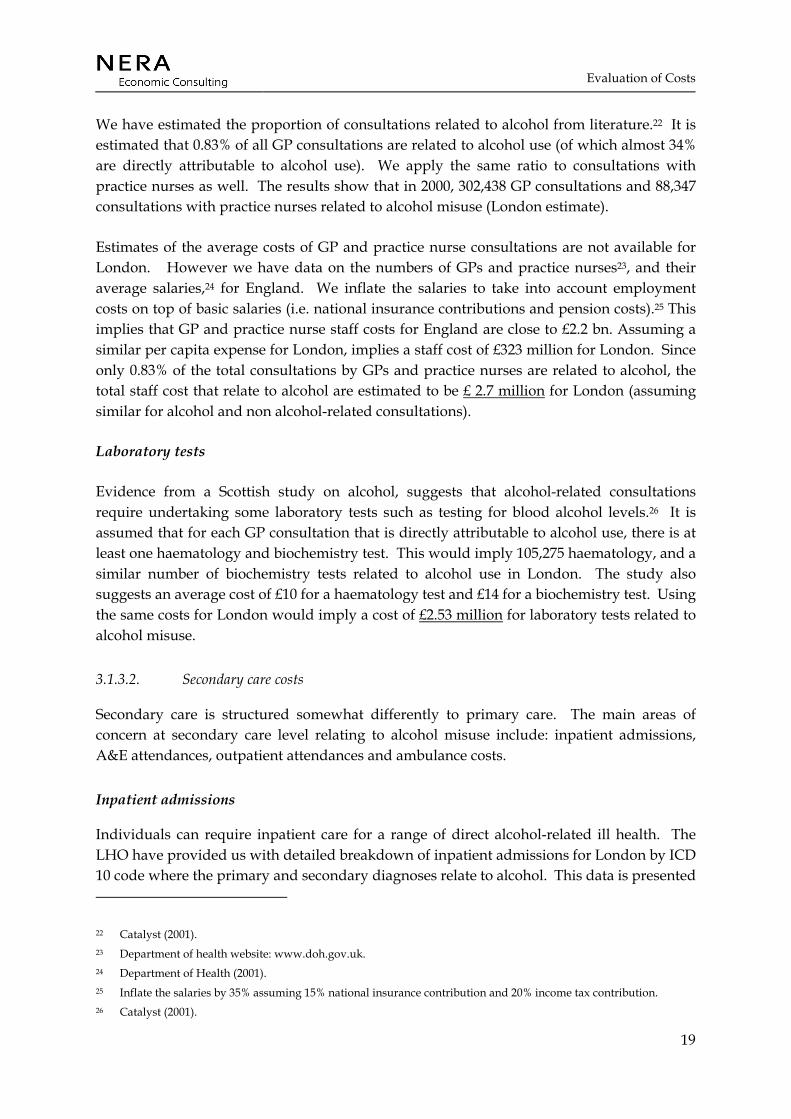
We have estimated the proportion of consultations related to alcohol from literature.22 It is estimated that 0.83% of all GP consultations are related to alcohol use (of which almost 34% are directly attributable to alcohol use). We apply the same ratio to consultations with practice nurses as well. The results show that in 2000, 302,438 GP consultations and 88,347 consultations with practice nurses related to alcohol misuse (London estimate).
Estimates of the average costs of GP and practice nurse consultations are not available for London. However we have data on the numbers of GPs and practice nurses23, and their average salaries,24 for England. We inflate the salaries to take into account employment costs on top of basic salaries (i.e. national insurance contributions and pension costs).25 This implies that GP and practice nurse staff costs for England are close to £2.2 bn. Assuming a similar per capita expense for London, implies a staff cost of £323 million for London. Since only 0.83% of the total consultations by GPs and practice nurses are related to alcohol, the total staff cost that relate to alcohol are estimated to be £ 2.7 million for London (assuming similar for alcohol and non alcohol-related consultations).
Laboratory tests
Evidence from a Scottish study on alcohol, suggests that alcohol-related consultations require undertaking some laboratory tests such as testing for blood alcohol levels.26 It is assumed that for each GP consultation that is directly attributable to alcohol use, there is at least one haematology and biochemistry test. This would imply 105,275 haematology, and a similar number of biochemistry tests related to alcohol use in London. The study also suggests an average cost of £10 for a haematology test and £14 for a biochemistry test. Using the same costs for London would imply a cost of £2.53 million for laboratory tests related to alcohol misuse.
3.1.3.2. Secondary care costs
Secondary care is structured somewhat differently to primary care. The main areas of concern at secondary care level relating to alcohol misuse include: inpatient admissions, A&E attendances, outpatient attendances and ambulance costs.
Inpatient admissions
Individuals can require inpatient care for a range of direct alcohol-related ill health. The LHO have provided us with detailed breakdown of inpatient admissions for London by ICD 10 code where the primary and secondary diagnoses relate to alcohol. This data is presented
22 Catalyst (2001). 23 Department of health website: www.doh.gov.uk. 24 Department of Health (2001). 25 Inflate the salaries by 35% assuming 15% national insurance contribution and 20% income tax contribution. 26 Catalyst (2001).

Evaluation of Costs
20
in Table A.9 in the appendix. It suggests that in 2000/01, an estimated 12,250 inpatient admissions in London were attributable to alcohol. In 1999, the average acute spend per inpatient admission for the NHS was close to £ 1,239.27 Using these volume and cost (inflated by 3% to take inflation into account)28 figures as an estimate for London, implies total costs of £15.63million for direct alcohol-related inpatient admissions in London in 2000. (Note, however, that this is based on the assumption that alcohol-related admissions reflect average inpatient costs).
A&E attendances
There were almost 2.54 million A&E attendances in London in 1998/9, made up of 2.37 million first attendances and 0.17 million follow-up attendances.29
There is no data on the number of A&E attendances that are attributable to alcohol so we have used an estimate derived from the literature. A study of Scotland30 estimates that 12% of the total A&E attendances are related to alcohol. Using this estimate implies 304,606 A&E attendances in London to be related to alcohol in 1999.
NHS reference costs provide unit costs for a number of health care interventions. This data provides the average unit cost of A&E attendances for all NHS Trusts in England and Wales, and the average cost by type of A&E attendances (minor through to fatal A&E attendances). The number of A&E attendances by severity of attendance is not available at the London level. However using the proportions of English and Welsh A&E attendances by severity we are able to apportion London attendances into these categories. Applying the relevant 2001 unit costs gives an estimated average cost of £20.5 million (2002 figures).
Table A.11 in the appendix provides a detailed breakdown of the data.
3.1.3.3. Outpatient attendances
London data is available upon the total number of outpatient attendances, with 1,033,825 total attendances.31 However, the number attributable to alcohol, or the cost per outpatient attendance is not available. As with the A&E data, we have estimated outpatient activity related to alcohol using data from other regions, suggesting that 8% of total attendances are
27 Number of admissions in 1999 was close to 11.1 million (http://www.doh.gov.uk/hes/free_data/table198.html) resulting in total acute spend in the NHS of around £13,646 million. (http://www.doh.gov.uk/dohreport/report2001/drchap6.pdf).
28 Data for 1999-2000 inflation taken from http://www.statistics.gov.uk/STATBASE/tsdataset.asp?vlnk=229. 29 Department of Health, Outpatient and Ward Attendees, England, 1998-99 (KH09).
http://www.doh.gov.uk/hospitalactivity/statistics/1998-99/a_and_e_attendances/y10.htm. 30 Catalyst (2001). 31 Department of Health, Outpatient and Ward Attendees, England, 1998-99 (KH09).
http://www.doh.gov.uk/hospitalactivity/statistics/1998-99/outpatient_attendances/y10.htm.

Evaluation of Costs
21
linked to alcohol misuse.32 Assuming a similar trend in London, outpatient attendances due to alcohol are estimated to be 82,706 in 1998/9. The cost of an outpatient appointment is estimated at £10133 resulting in total outpatient cost of £ 8.35 million.
3.1.3.4. Ambulance transportation
Data suggests that in 2000, 4,283 ambulance call outs could be related to alcohol use.34 Netten, Rees and Harrison (2001) have estimated the cost of paramedic and emergency ambulance services in the NHS at £474 (paramedic costs of £247, emergency ambulance costs of £188 and transport costs of £39). This suggests a total cost of £2.03 million for London.
3.1.4. Summary
Health costs due to alcohol occur at both the individual and NHS level. Table 3.3 provides a summary of these costs. Where a monetary value for the health cost is available this is also included.
Table 3.3 Health Costs Attributable to Alcohol
Individual level NHS level Morbidity
Mortality (£1,844, m) Primary care
GP and Practice nurse consultations (£2.7m) Laboratory tests (£2.5m)
Secondary care Inpatient admissions (£15.6m)
A&E attendances (£20.5m) Outpatient attendances (£8.4m)
Ambulance transportation (£2.0m) Source: NERA.
3.2. Costs of Crime
Alcohol contributes to a number of crimes. Besides costs to individuals, these crimes also affect the government in terms of costs involved in policing alcohol-related crimes and prosecuting criminals. Violent crime and road accidents attributable to alcohol may also lead to costs for the NHS. Besides estimating the cost of violent crimes and the cost of road accidents due to drunk driving, this section also estimates the cost of crimes such as robbery, burglary, theft, and criminal damage.
32 Catalyst (2001). 33 Matrix (2001). 34 London Health Observatory analysis of London Ambulance Service NHS Trust data.
Evaluation of Costs
22
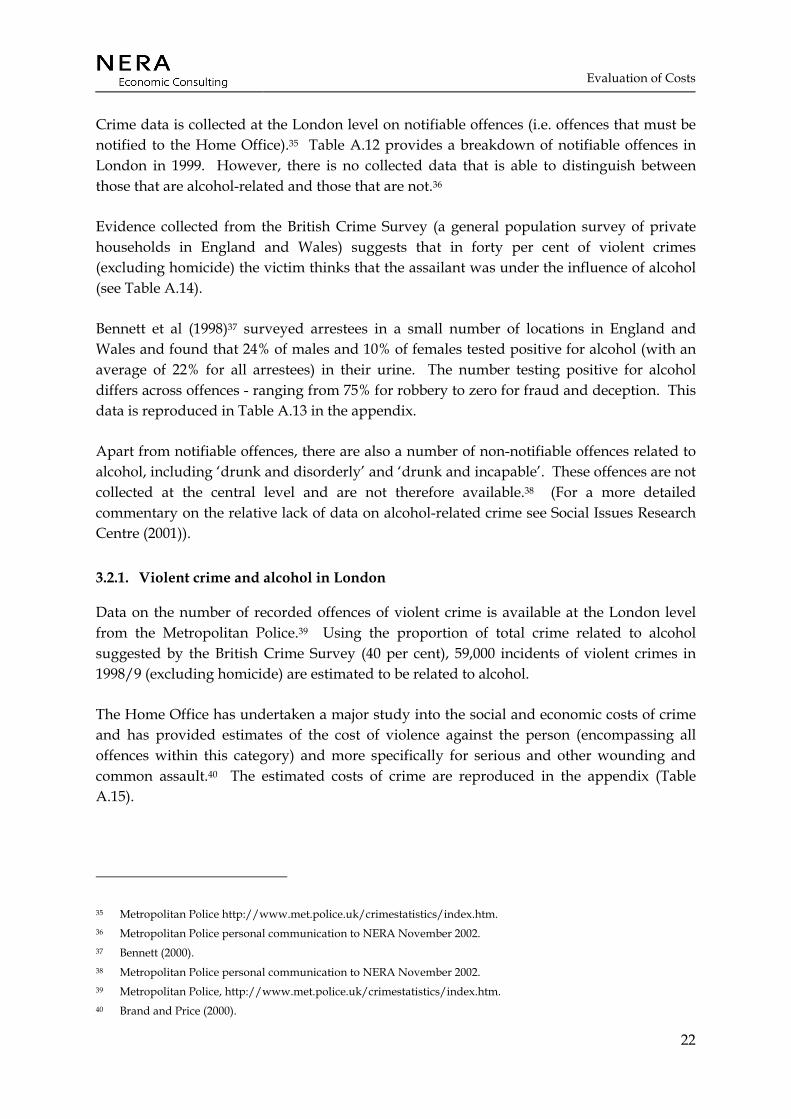
Crime data is collected at the London level on notifiable offences (i.e. offences that must be notified to the Home Office).35 Table A.12 provides a breakdown of notifiable offences in London in 1999. However, there is no collected data that is able to distinguish between those that are alcohol-related and those that are not.36
Evidence collected from the British Crime Survey (a general population survey of private households in England and Wales) suggests that in forty per cent of violent crimes (excluding homicide) the victim thinks that the assailant was under the influence of alcohol (see Table A.14).
Bennett et al (1998)37 surveyed arrestees in a small number of locations in England and Wales and found that 24% of males and 10% of females tested positive for alcohol (with an average of 22% for all arrestees) in their urine. The number testing positive for alcohol differs across offences - ranging from 75% for robbery to zero for fraud and deception. This data is reproduced in Table A.13 in the appendix.
Apart from notifiable offences, there are also a number of non-notifiable offences related to alcohol, including ‘drunk and disorderly’ and ‘drunk and incapable’. These offences are not collected at the central level and are not therefore available.38 (For a more detailed commentary on the relative lack of data on alcohol-related crime see Social Issues Research Centre (2001)).
3.2.1. Violent crime and alcohol in London
Data on the number of recorded offences of violent crime is available at the London level from the Metropolitan Police.39 Using the proportion of total crime related to alcohol suggested by the British Crime Survey (40 per cent), 59,000 incidents of violent crimes in 1998/9 (excluding homicide) are estimated to be related to alcohol.
The Home Office has undertaken a major study into the social and economic costs of crime and has provided estimates of the cost of violence against the person (encompassing all offences within this category) and more specifically for serious and other wounding and common assault.40 The estimated costs of crime are reproduced in the appendix (Table A.15).
35 Metropolitan Police http://www.met.police.uk/crimestatistics/index.htm. 36 Metropolitan Police personal communication to NERA November 2002. 37 Bennett (2000). 38 Metropolitan Police personal communication to NERA November 2002. 39 Metropolitan Police, http://www.met.police.uk/crimestatistics/index.htm. 40 Brand and Price (2000).

Evaluation of Costs
23
Applying these cost estimates to the proportion of violent crimes attributable to alcohol in London gives an estimate of £ 302 million (in 2000 prices).
3.2.2. Other crime and alcohol in London
This report also tries to evaluate the cost of robbery, burglary, theft and handling, and criminal damage that could be related to alcohol use in London. Although, other crimes such as sexual offences or handling of stolen goods may also be significant, there is little data available on the proportion of these crimes that could be attributed to alcohol to form reasonable estimates.
Data on robbery, burglary, theft and handling, and criminal damage is available for London. Combining this data with the attribution rates provided by Bennett (2001) suggests that 125,000 offences were due to alcohol. Acknowledging that not all of these crimes may be solely due to alcohol (arrestees also had very high levels of illicit drugs use) we have reduced the attribution by half. This suggests that 62,000 offences may be due to alcohol.
The Home Office has also considered the cost of robbery, burglary, theft and criminal damage. We have combined the cost of these with the number of these offences that are attributable to alcohol. Applying these costs to the 62,000 offences gives an estimated cost of £90 million (2000 prices).
3.2.3. Traffic accidents involving alcohol
The results of the breath tests of drivers involved in accidents in London41 suggests that there were more than 1,151 accidents in London where the driver had consumed more than the legal limit of alcohol. However no information is available on the number of casualties involved in these accidents for London.
The Department of the Environment, Transport and the Regions collects data on the number of casualties and accidents involving alcohol in Great Britain. It shows that in 1999, there were 16,830 casualties involved in 11,010 accidents involving illegal levels of alcohol. Using the same level of casualties per accident for London would imply 1,760 casualties from the 1,151 road accidents related to alcohol in London.
The Department for Transport estimates the cost of road accident casualties in the UK, which we use to provide an overall cost of £1.28 billion in 2000 due to alcohol-related road accidents in London.
41 London Health Observatory analysis of Transport for London data.
Evaluation of Costs
24
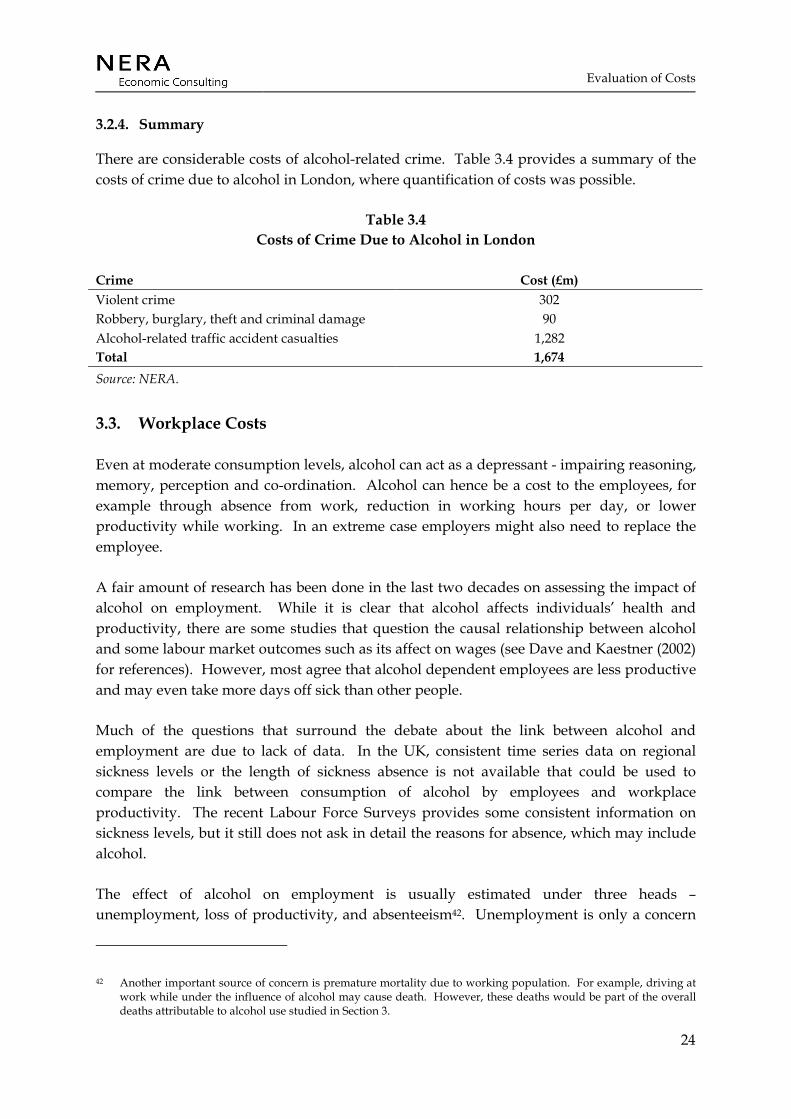
3.2.4. Summary
There are considerable costs of alcohol-related crime. Table 3.4 provides a summary of the costs of crime due to alcohol in London, where quantification of costs was possible.
Table 3.4 Costs of Crime Due to Alcohol in London
Crime Cost (£m) Violent crime 302 Robbery, burglary, theft and criminal damage 90 Alcohol-related traffic accident casualties 1,282 Total 1,674 Source: NERA.
3.3. Workplace Costs
Even at moderate consumption levels, alcohol can act as a depressant - impairing reasoning, memory, perception and co-ordination. Alcohol can hence be a cost to the employees, for example through absence from work, reduction in working hours per day, or lower productivity while working. In an extreme case employers might also need to replace the employee.
A fair amount of research has been done in the last two decades on assessing the impact of alcohol on employment. While it is clear that alcohol affects individuals’ health and productivity, there are some studies that question the causal relationship between alcohol and some labour market outcomes such as its affect on wages (see Dave and Kaestner (2002) for references). However, most agree that alcohol dependent employees are less productive and may even take more days off sick than other people.
Much of the questions that surround the debate about the link between alcohol and employment are due to lack of data. In the UK, consistent time series data on regional sickness levels or the length of sickness absence is not available that could be used to compare the link between consumption of alcohol by employees and workplace productivity. The recent Labour Force Surveys provides some consistent information on sickness levels, but it still does not ask in detail the reasons for absence, which may include alcohol.
The effect of alcohol on employment is usually estimated under three heads – unemployment, loss of productivity, and absenteeism42. Unemployment is only a concern
42 Another important source of concern is premature mortality due to working population. For example, driving at work while under the influence of alcohol may cause death. However, these deaths would be part of the overall deaths attributable to alcohol use studied in Section 3.
Evaluation of Costs
25
where the economy of a region is facing full employment. Under such a condition, replacing an employee would be difficult. Although measuring full employment rate is difficult, it is notable that London’s unemployment rate is 7.3% - well over the 5.7% rate for the UK in 2000.43 Hence, It is likely that if an employee were discharged due to alcohol problems, a replacement would be available. Under such conditions the economy of London is unlikely to suffer much as the position would not be left vacant, and the only costs would be the replacement cost to the employer.44
Consumption of alcohol could also affect the economy by reducing productivity of employees. Impairment of senses due to excess alcohol consumption must affect the ability of workers to perform their tasks – both physical and intellectual. However, there is no data available that may inform about the extent of this problem.
Finally absenteeism or the extra days of absence for employees that consume alcohol is a major concern for the businesses. We have estimated the costs of absenteeism, using the “human capital approach”. This approach takes into account the number of days lost to due to alcohol and values them at the average costs of an employee, after taking into account employer’s cost (national insurance, pension etc)).
There are almost 3.5 million employed people (including self employed) in London in 2000. The labour force survey suggests that almost 3.2% of employees (111,904 employees) in London are absent in a usual week, a fraction higher than the 3.1% absence for the UK. Absence is much higher in women compared to men (2.9% for males and 3.6% for females).45 A proportion of these are related to alcohol.
Estimating the proportion of the employees with a drinking problem is difficult. Some surveys infer the level of problem drinking by analysing questions that may indicate dependence on alcohol (Catalyst (2002)). In the absence of such data, we estimate the proportion of ‘dependent’ drinkers by looking at the proportion of men and women that ‘usually’ drink more than 50% of the prescribed ‘safe’ limit of alcohol.
Lader and Meltzer (2001) provide age-specific data on usual weekly consumption for men and women in 2000. Taking into account London’s population demographics, it is estimated that more than 11% of men, on average, drank over 35 units of alcohol and 6% of women drank over 25 units in London. This would imply around 317,650 employees in London drink 50% more than the prescribed safe limits.
43 ILO employment rates taken from ONS (2002). 44 Their might be some productivity effects as the reduction of an ‘able’ employee reduces the pool of employees
available for work. 45 The estimate takes into account the differences in population and economic activity rates between men and women
in the UK.
Evaluation of Costs
26
It is well documented that alcohol dependent employees take more time off than the rest of the workforce. Different estimates suggest that employees that are dependent on alcohol use may take 2 to 5 times more time-off than other employees (Powell (1990), Hutcheson et al (1995), Catalyst (2002)). The Labour Force Survey (2000) suggests that the average number of days off per employee is 4 for men and 6 for women each year. Taking a conservative estimate and assuming alcohol dependent employees take 3 times more days off than the average, implies 1.68 million working days lost due to alcohol in London – almost 10% of the total working days lost due to sickness in London.
The average daily income per employee (including employment costs) in London is estimated at £200.46 This implies that the total cost of absenteeism to London’s economy is £294 million.47
3.4. Welfare Implications
It is clear that consumption of alcohol results in significant costs to the individual as well as the government and businesses. As said earlier much of these costs are related to high-end consumers and ‘binge’ drinkers, and our analysis is Section 2.2, shows that the extent of alcohol consumed varies by gender, age and minority ethnic groups.
Ideally the welfare analysis of the costs of alcohol would require analysis of each of the costs based on different population groups. However, data for such an exercise is not available. Hence, by looking at the relative consumption levels of different population groups we qualitatively assess which population groups are likely to cause more costs than others.
Section 2.2 shows that men drink more frequently than women, and when they do they consume more as well. The proportion of men that drink over 4 units of alcohol (roughly the safe limit of consumption for men) on their heaviest drinking day is 31% compared to only 19% that drank over 6 units for women. The average weekly consumption of men in London is 16.1 units compared to 8.2 units for women.48
There is also a clear trend between age and consumption of alcohol. Average weekly consumption as well the consumption level on the heaviest drinking day in the last week for both men and women, goes down with age. However, this trend is opposite when it comes
46 Estimated by dividing London’s GDP to the total number of employees and inflating it to take into account employment costs. Employment costs are estimated to be 28% of net salary (see section 4.1.1). GDP figure for 2000 is estimated by inflating the 1999 by UK’s GDP growth in 2000.
47 Estimating social costs of alcohol on employment is complicated. Alcohol dependency, employment, wages are very different between social classes and age groups. It is also arguable whether the loss in output is equal to the daily employment costs. Hutcheson (1995) argues that work absence would not matter if the work not done on absent days is covered by higher productivity on other days, or if other colleagues cover the work. In the absence of knowing the causal relationship between alcohol, absenteeism and loss output, the estimate should not be considered a ‘true cost’.
48 See sections 2.2.2 and 2.2.3.

Evaluation of Costs
27
to under-age drinking. In the 11-15 age groups, the 15 years old drink far more than the 11 year olds.
Finally, Table 2.1 shows that 28% of London’s population consists of ethnic minorities. Of these 90% are Black, Asian or Chinese - minority groups with considerably less consumption levels compared to the national level. The Irish on the other hand drink more than the average.
Based on the assumption that high-end consumers are a cause of the major costs of alcohol, and the main trends in consumption across different population groups one can assume that consumption of alcohol by women, older adults and minorities is less harmful to the society compared to their counterparts, as they drink less compared to them.
Evaluation of Benefits
28
4. EVALUATION OF BENEFITS
While a vast amount of literature is available on the individual and social costs of alcohol use, evaluation of the benefits has largely been ignored. There have been studies that have shown marginally better productivity of moderate drinkers compared to abstainers, as well as other studies showing possible health benefits of drinking wine. However, these benefits are debatable and their extent, at best, is marginal. The real benefit of alcohol lies in its consumption. The net direct benefit to the individual consumers is the “consumer surplus”, which is the extent to which value to consumers exceeds the prices which they pay. Very little data is available to estimate this. However, the social benefits of alcohol are broader than benefits that accrue directly to the alcohol consumer, being such an intricate part of the social culture.
The alcohol market also accounts for substantial consumer spending. Households spend up to 6% of their incomes on alcohol, plus more on complementing industries such as restaurants and hotels. The alcohol industry in London also undoubtedly has positive impact on the numbers who visit London.
Care has to be taken in assessing the value to society of particular kinds of employment. Although it may not appear so to the individual, the total level of employment or unemployment, in London or in the UK, is most unlikely to be materially affected by more or less restriction on alcohol. The people employed to provide alcohol related services are resource which would otherwise be providing other services. However the degree of freedom or restriction does affect on the social climate or atmosphere of the city, which does of course have a real effect on welfare. Alcohol also raises large quantities of taxation, which would otherwise need to be raised in ways, which would probably have more adverse effects on national income.
Many of these impacts are difficult to quantify, but some rough estimates can be made.
The following section considers: a) the distribution of alcohol expenditure between main stakeholders such as employees, businesses, and government; b) individual utility or pleasure from drinking; c) wider effects such as increase in employment in complementary industries.
4.1. Alcohol Expenditure and Stakeholders
This section identifies the direct material consequences of alcohol consumption, for example, the profit to businesses in the supply chain of alcohol; the wages of employees; and the excise revenue for government. Many of these direct benefits are already quantified in a free market (such as salaries). In fact, in theory, the retail price of (or expenditure on) alcohol

Evaluation of Benefits
29
includes all the cash flows that accrue at each level in the supply chain.49 Hence, this report quantifies the main beneficiaries of the revenue that arises out of its sale.
In Section 2.2.1 it is estimated that the total expenditure on alcohol in London is close to £4.6bn. The following section estimate how this is distributed between different stakeholders.
4.1.1. Employment
Local alcohol consumption absorbs employment at the manufacturer as well as the retail level. More than three-quarters of the alcohol consumed in the UK, by value, is produced locally. This varies substantially across drink types – for example 90% of the beer consumed is produced locally, where as only 25% of wines (including coolers such as flavoured alcoholic beverages) and 34% of spirits consumed are locally produced in 2000.50 Hence most of the employment in the manufacturing side arises in the brewing industry. It is also notable that the UK exports a fair share of its production to other countries.
Table 4.1 Employment Related to Manufacturing of
Alcoholic Drinks in the UK, 2000
Manufacturing of Thousand Beer 22.7 Spirits 10.8 Cider, perry & other fruit wines 3.3 Malt 2.3 Wine 0.8 Total 40.0 Source: NERA estimate using Annual Business Inquiry.
Table 4.1 shows that local manufacturing of alcoholic drinks absorbs almost 40,000 direct jobs (including part time jobs)51. The estimation of employment in these industries that is attributable to consumption in London is not straightforward. However, assuming that it is directly proportional to the share of London in UK’s total consumption (by value) implies that 13.7% of this employment or 5,500 jobs in the manufacturing of alcohol industry are related to the consumption of alcohol in London.
49 In the free market only goods and services that are traded could be valued – therefore non-tradable or indirect benefits may not be part of the price.
50 NERA estimate. 51 This estimate is based on data from the Annual Business Inquiry (ABI). According to ABI the turnover of business
with these jobs was around £10bn in 2000. Considering the £33bn UK market, it seems that, even with discounting for imports and smuggling (the employment related to their production is not part of ABI statistics), as well as margins for distributors and manufacturers, the turnover is well under the overall expenditure. If this means that ABI does not take into account all manufacturing units in their statistics, then the employment data in Table 4.1 underestimates total employment related to alcohol manufacturing in the UK.

Evaluation of Benefits
30
Manufacturing only accounts for a small share of alcohol-related employment. In fact, most of the jobs related to alcohol are in the retail sector – in pubs and clubs for instance. However on these premises other goods might be sold as well and it is difficult to decipher how much of the time and cost of employees should be attributed to alcohol consumption.
According to a survey by the ONS, of the people who drink alcohol in the UK, over 70% of people buy alcohol from licensed pubs and bars; a similar proportion buys it from the supermarket; over 60% buy it with food in restaurants; and only 4% purchase alcohol from somewhere other than a retail outlet. The proportion of employees’ effort related to sales of alcohol in supermarkets compared to other goods is fairly insignificant. Hence, this report assesses the employment related to alcohol by looking at licensed outlets such as pubs, restaurants and hotel with restaurants.
Table 4.2 Employment in Licensed Retailing and Selected
Industries in the UK, 2000
Total (thousand)
Proportion related to
alcohol (%)
Alcohol-related employment
Bars and Pubs 601 0.90 - 0.95 541 – 571 Restaurants 565 0.15 - 0.20 85 – 113 Hotels and motels with restaurants 322 0.10 - 0.15 32 – 48 Total 1,488 658 – 732 Source: NERA estimate using Beer and Pub Association (2001).
Table 4.2 shows that around 1.5 million jobs are involved in industries that retail alcoholic beverages in the UK. Of these, more than 0.6 million jobs in pubs and bars can be assumed to be mostly involved with the sale of alcohol. However, employees in restaurants and hotels have other responsibilities and there is no information available to explain how many jobs in these industries are directly related to alcohol. Hence, the table uses some sensitivities to look at the possible magnitude of the jobs.
Assuming that 90-95% of the jobs in bars and pubs; and 15-20% in restaurants; and 10-15% in hotels and motels could be related to the consumption of alcohol, Table 4.2 shows that more than 0.66 million jobs could be related to the sale of alcohol in the UK.
There are more than 82,288 pubs and clubs in the England and Wales in 2001 - of these, 9,527 are within London. Of the 20,330 restaurants in the UK, 4,699 are in London.52 Similarly, only 7% of the 7,232 hotels in England are in London. By inflating England and Wales’ data to UK using population differences, assuming a similar staff per premise ratio in London compared to the UK, and comparing the number of UK retail premises to London, it is
52 Home Office (2002).
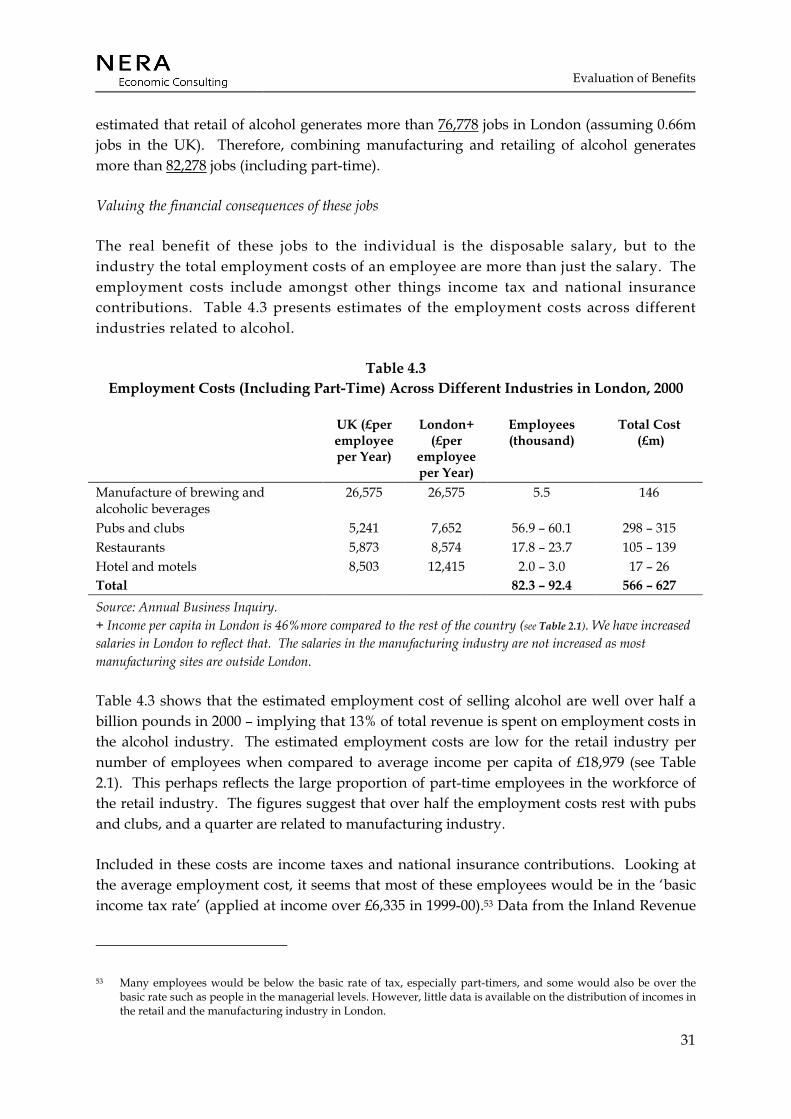
Evaluation of Benefits
31
estimated that retail of alcohol generates more than 76,778 jobs in London (assuming 0.66m jobs in the UK). Therefore, combining manufacturing and retailing of alcohol generates more than 82,278 jobs (including part-time).
Valuing the financial consequences of these jobs
The real benefit of these jobs to the individual is the disposable salary, but to the industry the total employment costs of an employee are more than just the salary. The employment costs include amongst other things income tax and national insurance contributions. Table 4.3 presents estimates of the employment costs across different industries related to alcohol.
Table 4.3 Employment Costs (Including Part-Time) Across Different Industries in London, 2000
UK (£per employee per Year)
London+ (£per
employee per Year)
Employees (thousand)
Total Cost (£m)
Manufacture of brewing and alcoholic beverages
26,575 26,575 5.5 146
Pubs and clubs 5,241 7,652 56.9 – 60.1 298 – 315 Restaurants 5,873 8,574 17.8 – 23.7 105 – 139 Hotel and motels 8,503 12,415 2.0 – 3.0 17 – 26 Total 82.3 – 92.4 566 – 627 Source: Annual Business Inquiry. + Income per capita in London is 46%more compared to the rest of the country (see Table 2.1). We have increased salaries in London to reflect that. The salaries in the manufacturing industry are not increased as most manufacturing sites are outside London.
Table 4.3 shows that the estimated employment cost of selling alcohol are well over half a billion pounds in 2000 – implying that 13% of total revenue is spent on employment costs in the alcohol industry. The estimated employment costs are low for the retail industry per number of employees when compared to average income per capita of £18,979 (see Table 2.1). This perhaps reflects the large proportion of part-time employees in the workforce of the retail industry. The figures suggest that over half the employment costs rest with pubs and clubs, and a quarter are related to manufacturing industry.
Included in these costs are income taxes and national insurance contributions. Looking at the average employment cost, it seems that most of these employees would be in the ‘basic income tax rate’ (applied at income over £6,335 in 1999-00).53 Data from the Inland Revenue
53 Many employees would be below the basic rate of tax, especially part-timers, and some would also be over the basic rate such as people in the managerial levels. However, little data is available on the distribution of incomes in the retail and the manufacturing industry in London.

Evaluation of Benefits
32
suggests that average tax rate for basic rate tax payers is around 13%.54,55 Similarly, assuming a national insurance contribution of around 15% for people at this income level, the proportion of these employment costs directly benefiting the government are 28% or £159m - £175m in 2000. This implies a benefit to the employees (including pensions etc) ranging between £408m to £451m.
4.1.2. Profit margins
We have contacted the British Beer and Pub Association and other industry level contacts for information on the profit margins involved in the sale of alcohol at the manufacturing, distribution and retail level. However, this information is unavailable in the public domain. There is also little information available about the additional costs involved at the distribution and retail level, or the level of corporation tax paid just by the alcohol industry.
In the absence of such data we have estimated the profit margin on the basis of information available in the Annual Business Inquiry on gross value added (GVA), staff costs and capital expenditure in alcohol-related manufacturing industries, and retailers. Assuming gross profits to be equal to be the difference between GVA and staff and capital cost, Table 4.4 presents the profit margins in selected industries.
Table 4.4 Estimated Gross Profit Margins in Selected Industries, 2000
%
Manufacturing of beverages 15.7% Bars 9.8% Restaurants 14.3% Hotels and motels with restaurants 20.1%
Source: Annual Business Inquiry.
In the absence of the split between the proportion of sales in pubs, restaurants and hotels, we have assumed an average 15% profit margin at the retail level. Also, we have assumed 25% distribution costs.56 These assumptions imply that the gross average profit for retailers is around £167m and for manufacturers its £484m.
On this profit, firms need to pay corporation tax. In 1999-2000, the average corporation tax paid by firms on profits was 21.4%.57 Using this figure, the net benefit to the retailers of
54 The average tax rate is the amount of income tax paid compared to the nominal income. 55 Source: http://www.inlandrevenue.gov.uk. 56 Data on level of distributional costs is not available, hence the 25% costs figure is a guesstimate based on
discussions with industry level contacts. 57 Source: http://www.inlandrevenue.gov.uk.

Evaluation of Benefits
33
alcohol sales is £137m and for manufacturers it is £399m. The revenue for the government is around £115m.
However we must here repeat the “heath warning”, that if the resources employed in producing alcohol related products and services were not engaged in these activities they would be available to produce other goods and services instead. The wages and profits attributable to alcohol therefore are not measures of social benefit attributable to alcohol. The social benefits lie in its consumption. However figures on the production of alcohol related activities provide a measure of their importance today of the national and local economy, and of the transitional costs which would arise were it to markedly contract.
4.1.3. Government revenue
The revenue from income taxes and national insurance contribution, as well as corporation tax is a very small share of the overall income that is generated for the government by the sale of alcohol. These taxes might still arise if the resources were producing other goods and services instead. However, there are other specific taxes on the consumption of alcohol that are high. Moreover, a substantial proportion of alcoholic drinks are imported and customs and excise duty are applied over it. Finally, at the retail level an additional 17.5% value added tax (VAT) is applied as well. All in all Customs and Excise duty and VAT account for a third of the value of all sales of alcohol.
Table 4.5 Estimated Government Revenue from Taxes and Custom Duties
Related to Sale of Alcohol in the UK and London, 2000 (£m)
Beer Cider and Wine
Spirits Total
UK* Total Sales+ 16,414 10,368 6,801 33,583 Custom and Excise revenue 2,813 1,812 1,804 6,429 VAT 2,487 1,513 1,031 5,030 Total revenue for the government 5,300 3,325 2,835 11,459 London Total Sales+ 2,257 1,425 935 4,617 Custom and Excise revenue 387 249 248 884 VAT 342 208 142 692 Total revenue for the government 729 457 390 1,575
*Source: Beer and Pub Association (2001). + Estimated in Section 2.2.
Table 4.5 shows that the government receives about £1.6bn from various duties and taxes on alcohol in London. This is well over 34% of the total expense on alcohol in London. The table shows that, of the revenue, 15% is taken by the government, on average, under the head of VAT. The rest of it is taken as duty, which averages around 17% for beer, cider and

Evaluation of Benefits
34
wine; and over 26% on spirits. If this were added to the income tax on salaries and corporation tax, the net government revenue associated with alcohol consumption in London is approaching £1.9bn.
Figure 4.1 The Cost of a Pint of Beer
0%
20%
40%
60%
80%
100%
Other costs GovernmentEmployees ManufacturersRetailers
Figure 4.1 shows the share of the sale price of the sale of a pint of beer flowing to different stakeholders. It shows that for every pound spent on beer in London, 38p goes to the government; 9p to salaries of employees; 3p as profit to the retailers; 6p as profit to the manufacturers; and the rest goes in the manufacturing and distribution costs that include ingredient and capital costs.
4.2. The Pleasure from Drinking
Section 4.1 shows how the price of a pint is shared between different stakeholders. However, in reality even with all the taxes and profits, when the consumer decides buy a pint of beer, to him or her the utility of having beer must be at least enough to compensate for the price paid. Hence, the pleasure of drinking is worth at least as much as the price to the consumer. Some consumers would choose to buy it, even if the price had been higher. The highest price a consumer would have been willing to pay for a pint of beer is known as willingness to pay. The difference between what the consumer is willing to pay and what is actually paid is termed as the ‘consumer surplus’.
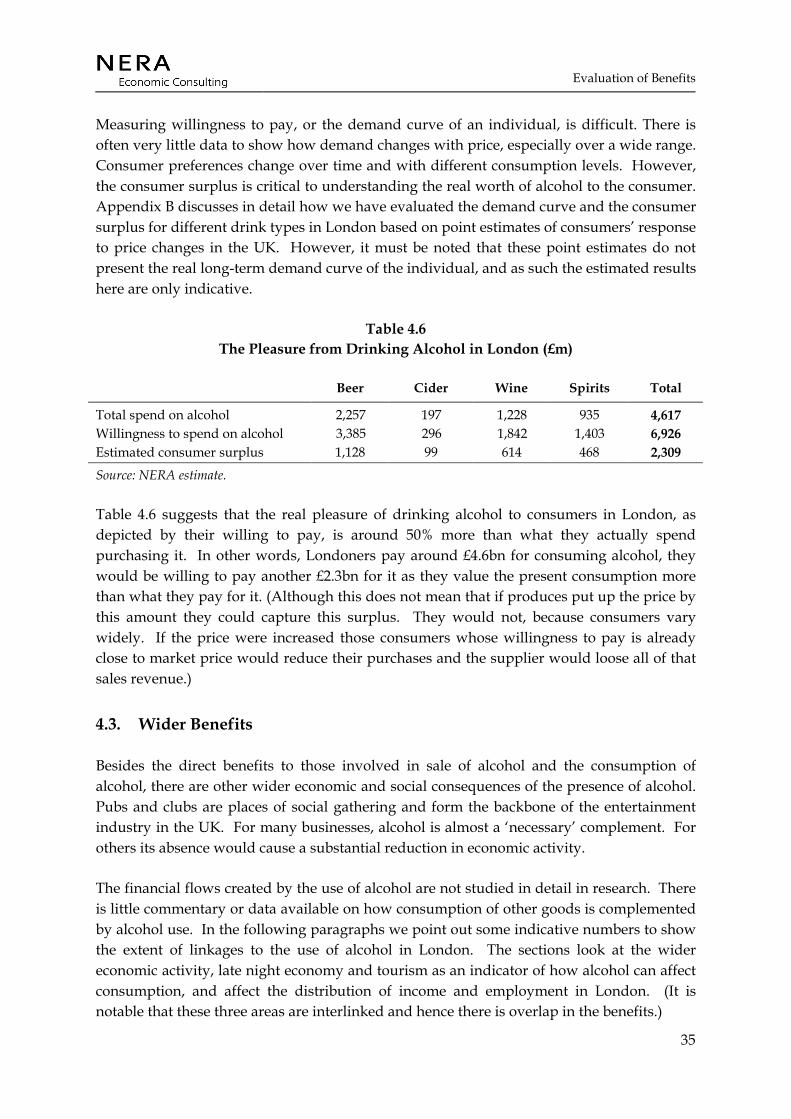
Evaluation of Benefits
35
Measuring willingness to pay, or the demand curve of an individual, is difficult. There is often very little data to show how demand changes with price, especially over a wide range. Consumer preferences change over time and with different consumption levels. However, the consumer surplus is critical to understanding the real worth of alcohol to the consumer. Appendix B discusses in detail how we have evaluated the demand curve and the consumer surplus for different drink types in London based on point estimates of consumers’ response to price changes in the UK. However, it must be noted that these point estimates do not present the real long-term demand curve of the individual, and as such the estimated results here are only indicative.
Table 4.6 The Pleasure from Drinking Alcohol in London (£m)
Beer Cider Wine Spirits Total
Total spend on alcohol 2,257 197 1,228 935 4,617 Willingness to spend on alcohol 3,385 296 1,842 1,403 6,926 Estimated consumer surplus 1,128 99 614 468 2,309
Source: NERA estimate.
Table 4.6 suggests that the real pleasure of drinking alcohol to consumers in London, as depicted by their willing to pay, is around 50% more than what they actually spend purchasing it. In other words, Londoners pay around £4.6bn for consuming alcohol, they would be willing to pay another £2.3bn for it as they value the present consumption more than what they pay for it. (Although this does not mean that if produces put up the price by this amount they could capture this surplus. They would not, because consumers vary widely. If the price were increased those consumers whose willingness to pay is already close to market price would reduce their purchases and the supplier would loose all of that sales revenue.)
4.3. Wider Benefits
Besides the direct benefits to those involved in sale of alcohol and the consumption of alcohol, there are other wider economic and social consequences of the presence of alcohol. Pubs and clubs are places of social gathering and form the backbone of the entertainment industry in the UK. For many businesses, alcohol is almost a ‘necessary’ complement. For others its absence would cause a substantial reduction in economic activity.
The financial flows created by the use of alcohol are not studied in detail in research. There is little commentary or data available on how consumption of other goods is complemented by alcohol use. In the following paragraphs we point out some indicative numbers to show the extent of linkages to the use of alcohol in London. The sections look at the wider economic activity, late night economy and tourism as an indicator of how alcohol can affect consumption, and affect the distribution of income and employment in London. (It is notable that these three areas are interlinked and hence there is overlap in the benefits.)
Evaluation of Benefits
36
4.3.1.1. Wider economic activity
As mentioned earlier, a wide variety of businesses are affected by the use of alcohol. According to Annual Business Inquiry, turnover in hotels and restaurants is almost £800 per capita in the UK in 2000 (implying almost £6bn for London).58 More than 1.7 million jobs are associated with these businesses. While, only a fraction of these are directly involved in the sale of alcohol, if the absence of revenue related to alcohol were to affect only 20% of the sales –over a billion pounds of business in London could be said to depend on alcohol.
4.3.1.2. The late night economy
While isolating the impact of alcohol on complementing businesses is difficult, some key economic centres in London are bound to be affected. According to a report on the late night economy in London by the GLA59, more than half a million people go out clubbing regularly in London on a Saturday night. It is seen as a main part of London’s city life. It also is strongly linked to over 300,000 jobs involved in the entertainment industry in London. Assuming these workers also include part-time workers and the overall earnings average half of the average per capita income of £18, 979 in London in 2000 (see Table 2.1), a rough estimate of the private income for employees related to London’s late night economy is around £2.8bn.
Alcohol is seen as a crucial link to the late night economy – both in terms of cost and benefits. Without alcohol, the late night economy would be substantially less than what it is now.
4.3.1.3. Tourism
Tourism is another major industry in the UK and in London. In 2000, it contributed over £75bn to the UK economy (4.5% of GDP) – half in the form of tourist spend (the other half includes day trips and fares to UK carriers). Only a fifth of the spending by the tourists was on business trips, the rest was on holidays or visiting friends and families. The vast majority of the overseas tourists are from countries where alcohol consumption is very much part of social life.
London is a major part of UK’s tourist industry. It attracts almost a quarter of the total spend by tourists in the UK (£8.9bn). According to some estimates of the 2.1 million employees (some 7% of total employment in Great Britain) related to tourism in the UK, 0.3 million are in London. Their numbers are growing by almost 20% per year.60
58 Annual business Inquiry, http://www.statistics.gov.uk/abi/default.asp. 59 GLA (2002). 60 Data taken from StarUK dataset: www.staruk.org.uk.
Evaluation of Benefits
37
While alcohol may not encourage tourist spend, the absence of alcohol may deter some tourists from visiting London. There is no data available to suggest what that number might look like – but a conservative estimate of a 10% reduction in spending would imply £890m loss of tourist turnover for London.
While looking at these numbers it is important to note that we are not isolating the impact of alcohol on tourism. Of the 0.3 million jobs in the tourism industry almost one-third are in hotels in restaurants which are also linked to the jobs in the late night economy or the ones mentioned under wider economic activity. Also, the spending levels mentioned include spend on alcohol which is already valued under direct benefits. The purpose of this section is to point out that alcohol is a contributor to these industries. Hence, its consumption contributes to the turnover for businesses, employment incomes, and tax revenues.
4.4. Welfare Implications
There is very little data available for any welfare analysis of the differences in the flows of finances across genders, age and minority groups in the alcohol industry. While we discuss the consumption patterns of alcohol across these population groups, we do not know differences in willingness to pay across these groups to get an idea of the consumer surplus related to these groups.
We tried to gather information on the proportion of women employees in alcohol related industries from the British Beer and Pub Association. However, this information was not available. Ideally, this data could be used in attributing the earnings in the manufacture and retail of alcohol between genders. Similar data for minority ethnic groups was also not available.
Working in bars and restaurants, as well as other part-time work in the entertainment industry, is potentially a big source of employment for young people. Hence, they are also important beneficiaries of the employment earnings in the alcohol industries.
Finally, by far the most important beneficiary of alcohol-related financial flows is the government. The revenue that London’s alcohol consumption provides to the government in terms of taxes and duties could be used to redistribute income more efficiently.
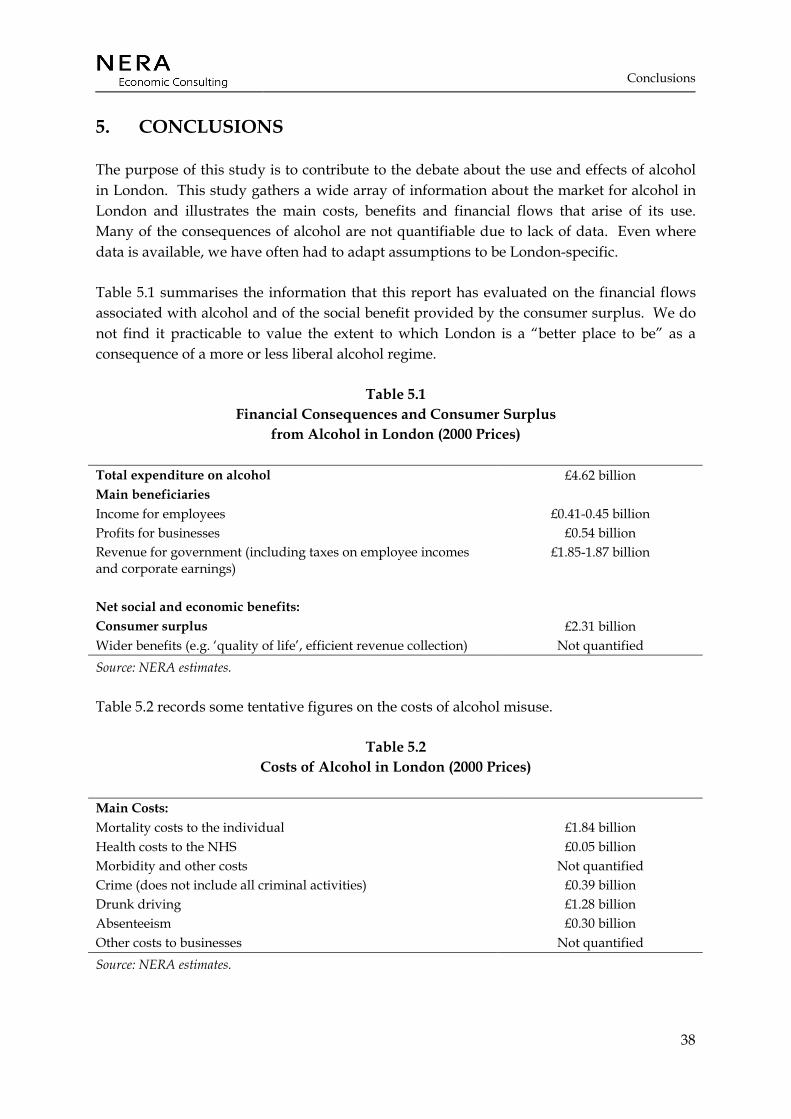
Conclusions
38
5. CONCLUSIONS
The purpose of this study is to contribute to the debate about the use and effects of alcohol in London. This study gathers a wide array of information about the market for alcohol in London and illustrates the main costs, benefits and financial flows that arise of its use. Many of the consequences of alcohol are not quantifiable due to lack of data. Even where data is available, we have often had to adapt assumptions to be London-specific.
Table 5.1 summarises the information that this report has evaluated on the financial flows associated with alcohol and of the social benefit provided by the consumer surplus. We do not find it practicable to value the extent to which London is a “better place to be” as a consequence of a more or less liberal alcohol regime.
Table 5.1 Financial Consequences and Consumer Surplus
from Alcohol in London (2000 Prices)
Total expenditure on alcohol £4.62 billion Main beneficiaries Income for employees £0.41-0.45 billion Profits for businesses £0.54 billion Revenue for government (including taxes on employee incomes and corporate earnings)
£1.85-1.87 billion
Net social and economic benefits: Consumer surplus £2.31 billion Wider benefits (e.g. ‘quality of life’, efficient revenue collection) Not quantified Source: NERA estimates.
Table 5.2 records some tentative figures on the costs of alcohol misuse.
Table 5.2 Costs of Alcohol in London (2000 Prices)
Main Costs: Mortality costs to the individual £1.84 billion Health costs to the NHS £0.05 billion Morbidity and other costs Not quantified Crime (does not include all criminal activities) £0.39 billion Drunk driving £1.28 billion Absenteeism £0.30 billion Other costs to businesses Not quantified Source: NERA estimates.
Conclusions
39
Table 5.1 shows that alcohol expenditure in London results in almost £1 billion of revenue that flows to individuals and businesses that are involved in its sale in London. Government receives a little less than twice that amount in the form of taxes and duties. However, all this comes at a cost.
The misuse of alcohol results in substantial numbers of deaths in London. The total mortality directly or indirectly related to alcohol cost over £1.84 billion to London. We expect a substantial morbidity cost as well, which we have not been able to estimate due to lack of data. However it is clear that the physiological and psychological effects of alcohol abuse are detrimental to the economy. Apart from individual harm that alcohol may inflict, we have also estimated some of the costs that relate to treating patients that use alcohol in the NHS. These costs are estimated at £52 million.
Finally, while we have not been able to quantify all the costs that businesses expect to face due to alcohol use, estimates of cost of absenteeism due to alcohol are substantial. Our estimates suggest that just absenteeism related to alcohol in London costs the economy £0.3 billion.
Even with these substantial potential costs, individuals choose to consume alcohol. Although only indicative, our analysis of the “pleasure of drinking” from alcohol shows that consumption of alcohol is worth £ 2.3 billion more than what consumers pay for it.
It is also clear from our analysis that besides individual pleasure the alcohol industry complements billions of pounds of expenditure by consumers in the form of expense on tourism or late night activities. While this is not a direct social benefit per se, it is important to recognise the contribution that alcohol makes in sustaining this economic activity and its contribution to the quality of life.
Quantifying the social costs and benefits of alcohol is not an exact science. However we have illustrated at each step of the estimation our assumptions, which readers should look at to form their own judgements. Based on those assumptions, this report shows that in dealing with policy related to alcohol use, one has to take particular notice of issues such as mortality cost or the pleasure from drinking. Still it is important to see that many of the costs and benefits are not assessed in this report and their affects can also be substantial.
These figures should be regarded as broad indicators of some of the financial and other quantities associated with alcohol in London. The extent to which they measure true social costs and benefits varies widely and the do not provide a set of figures from which to derive a total net benefit (or disbenefit) of alcohol. Nor do they provide direct information about the effects of marginal changes in the regime of alcohol regulation. They do however provide some quantitative infill for the very complex place which alcohol has in the life of London.

Appendix A
40
APPENDIX A. BACKGROUND DATA
A.1. Market for Alcohol
Table A.1 Trend in Income and Prices in the UK (Index 1985=100)
Year Income RPI (all items)
Beer Cider Wine Spirits
1985 100 100 100 100 100 100 1986 104 103 104 106 103 106 1987 108 108 109 111 106 110 1988 114 113 114 117 110 117 1989 119 122 121 125 115 125 1990 123 133 132 137 125 135 1991 125 141 149 155 140 149 1992 130 146 158 165 149 158 1993 134 149 165 174 154 167 1994 135 152 169 179 156 174 1995 139 158 176 187 161 181 1996 142 161 181 193 164 188 1997 147 166 186 200 167 195 1998 147 172 192 208 171 203 1999 153 175 197 215 174 210 2000 157 180 200 219 175 218
Source: ONS (2001a) and Beer and Pub Association (2001).
A.2. Health Costs
Table A.2 Direct Mortality due to Alcohol by Gender for England and Wales 1999
Alcoholic psychoses
Alcohol dependence syndrome
Non-dependent
abuse of alcohol
Alcoholic cardiomy
opathy
Chronic liver
disease and cirrhosis
Toxic effect of alcohol
Total
Men 13 220 109 109 2,904 99 3,454 Women 9 105 49 28 1,814 49 2,054 Persons 22 325 158 137 4,718 148 5,508 Source: ONS (2001a).

Appendix A
41
Table A.3 Indirect Attribution of Alcohol to Mortality by ICD 9 Code
Percentage of deaths attributable to alcohol ICD code Disease Male Female
140-239 Neoplasm 4 3 430-438 Cerebrovascular
Disease 12 3
460-519 Respiratory Disease 11 2 520-570 Disease of the
Digestive System 12 3
800-999 Other 6 1 Source: Adapted from Godfrey and Hardman (1994).
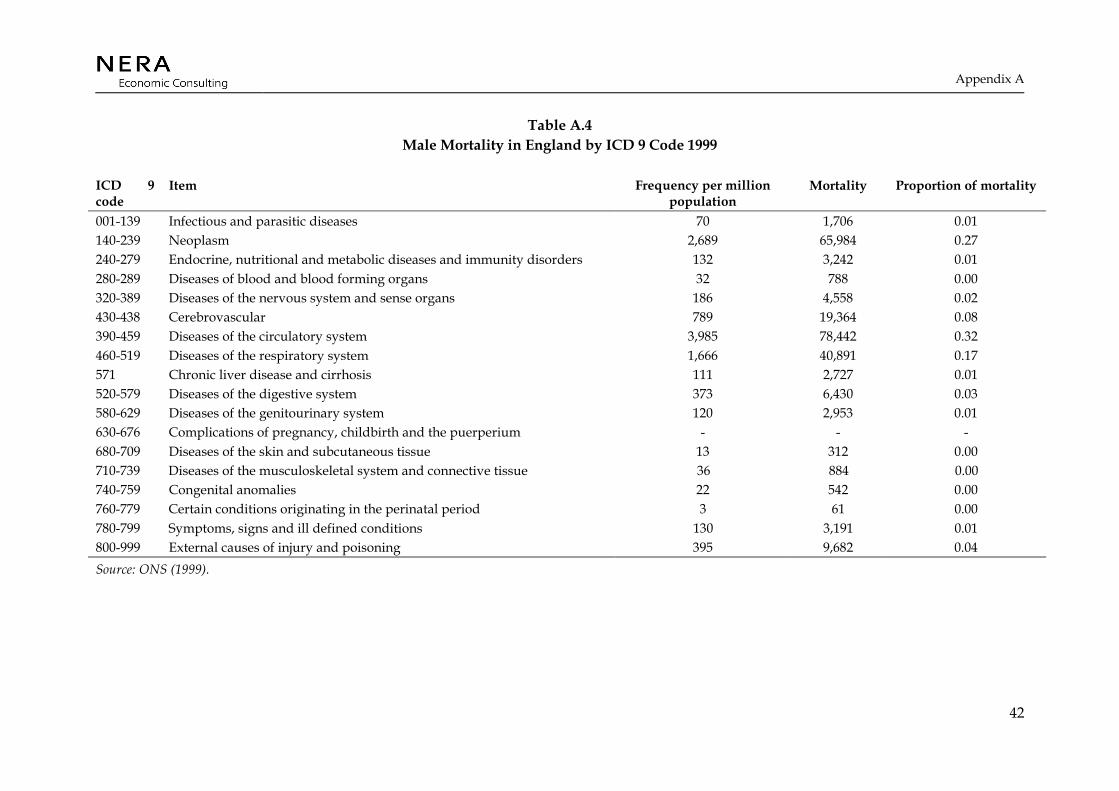
Appendix A
42
Table A.4 Male Mortality in England by ICD 9 Code 1999
ICD 9 code
Item Frequency per million population
Mortality Proportion of mortality
001-139 Infectious and parasitic diseases 70 1,706 0.01 140-239 Neoplasm 2,689 65,984 0.27 240-279 Endocrine, nutritional and metabolic diseases and immunity disorders 132 3,242 0.01 280-289 Diseases of blood and blood forming organs 32 788 0.00 320-389 Diseases of the nervous system and sense organs 186 4,558 0.02 430-438 Cerebrovascular 789 19,364 0.08 390-459 Diseases of the circulatory system 3,985 78,442 0.32 460-519 Diseases of the respiratory system 1,666 40,891 0.17 571 Chronic liver disease and cirrhosis 111 2,727 0.01 520-579 Diseases of the digestive system 373 6,430 0.03 580-629 Diseases of the genitourinary system 120 2,953 0.01 630-676 Complications of pregnancy, childbirth and the puerperium - - - 680-709 Diseases of the skin and subcutaneous tissue 13 312 0.00 710-739 Diseases of the musculoskeletal system and connective tissue 36 884 0.00 740-759 Congenital anomalies 22 542 0.00 760-779 Certain conditions originating in the perinatal period 3 61 0.00 780-799 Symptoms, signs and ill defined conditions 130 3,191 0.01 800-999 External causes of injury and poisoning 395 9,682 0.04 Source: ONS (1999).
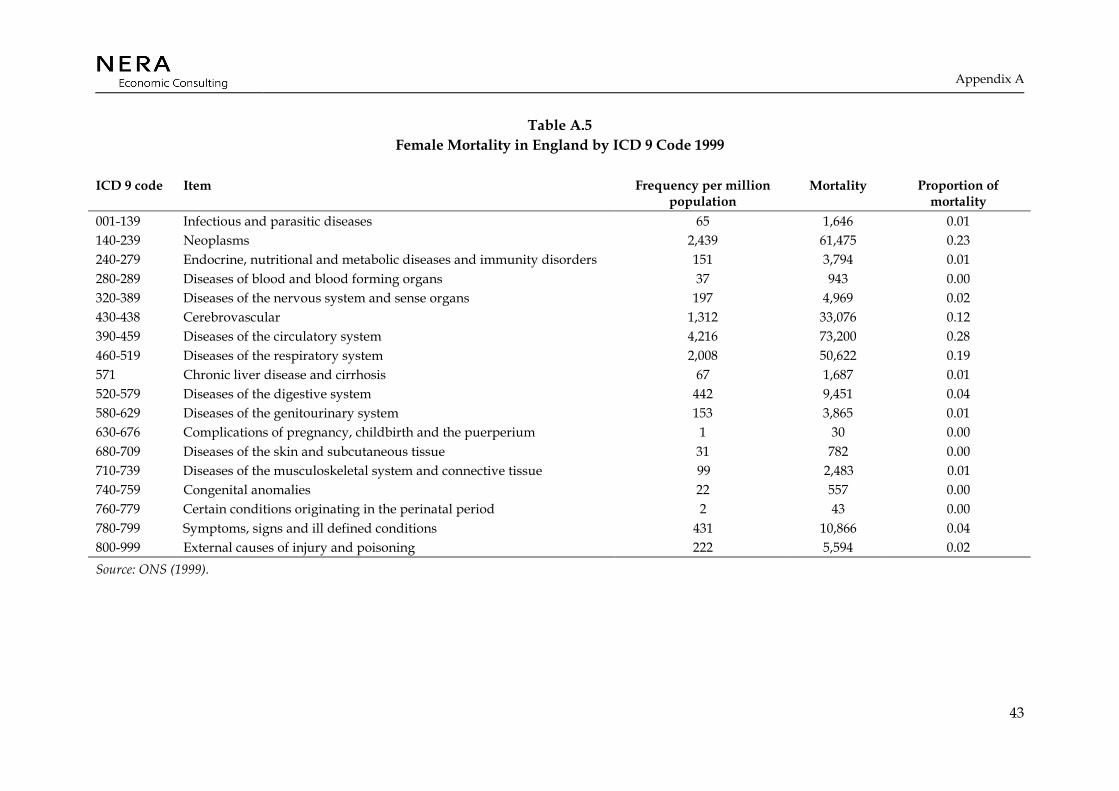
Appendix A
43
Table A.5 Female Mortality in England by ICD 9 Code 1999
ICD 9 code Item Frequency per million population
Mortality Proportion of mortality
001-139 Infectious and parasitic diseases 65 1,646 0.01 140-239 Neoplasms 2,439 61,475 0.23 240-279 Endocrine, nutritional and metabolic diseases and immunity disorders 151 3,794 0.01 280-289 Diseases of blood and blood forming organs 37 943 0.00 320-389 Diseases of the nervous system and sense organs 197 4,969 0.02 430-438 Cerebrovascular 1,312 33,076 0.12 390-459 Diseases of the circulatory system 4,216 73,200 0.28 460-519 Diseases of the respiratory system 2,008 50,622 0.19 571 Chronic liver disease and cirrhosis 67 1,687 0.01 520-579 Diseases of the digestive system 442 9,451 0.04 580-629 Diseases of the genitourinary system 153 3,865 0.01 630-676 Complications of pregnancy, childbirth and the puerperium 1 30 0.00 680-709 Diseases of the skin and subcutaneous tissue 31 782 0.00 710-739 Diseases of the musculoskeletal system and connective tissue 99 2,483 0.01 740-759 Congenital anomalies 22 557 0.00 760-779 Certain conditions originating in the perinatal period 2 43 0.00 780-799 Symptoms, signs and ill defined conditions 431 10,866 0.04 800-999 External causes of injury and poisoning 222 5,594 0.02 Source: ONS (1999).

Appendix A
44
Table A.6 Male and Female Indirect Alcohol Mortality by ICD 9 Code London 1999
ICD 9 code Item Male mortality Female mortality 001-139 Infectious and parasitic diseases 221 206 140-239 Neoplasms 8,554 7,698 240-279 Endocrine, nutritional and metabolic diseases and immunity disorders 420 475 280-289 Diseases of blood and blood forming organs 102 118 320-389 Diseases of the nervous system and sense organs 591 622 430-438 Cerebrovascular 2,510 4,142 390-459 Diseases of the circulatory system 7,659 5,025 460-519 Diseases of the respiratory system 5,301 6,340 571 Chronic liver disease and cirrhosis 353 211 520-579 Diseases of the digestive system 480 972 580-629 Diseases of the genitourinary system 3,826 484 630-676 Complications of pregnancy, childbirth and the puerperium 0 4 680-709 Diseases of the skin and subcutaneous tissue 40 98 710-739 Diseases of the musculoskeletal system and connective tissue 114 311 740-759 Congenital anomalies 70 70 760-779 Certain conditions originating in the perinatal period 8 5 780-799 Symptoms, signs and ill defined conditions 413 1,361 800-999 External causes of injury and poisoning 1,255 701 Source: NERA calculations.

Appendix A
45
Table A.7 A&E attendances by Severity of Attendance and Average Cost England and Wales 2002
HRG Code HRG Label Attendances Proportion Average cost (£) DOA Dead on Arrival 36,990 0.3% 32 V01 High Cost Imaging (Died / Admitted) 78,258 0.6% 182 V02 High Cost Imaging (Referred / Discharged) 141,457 1.2% 111 V03 Other High Cost Investigation (Died / Admitted) 774,521 6.4% 122 V04 Other High Cost Investigation (Referred / Discharged) 2,361,417 19.4% 75 V05 Lower Cost Investigation (Died / Admitted) 892,172 7.3% 96 V06 Lower Cost Investigation (Referred / Discharged) 1,741,620 14.3% 59 V07 No Investigation (Died / Admitted) 793,475 6.5% 86 V08 No Investigation (Referred / Discharged) 4,193,515 34.5% 47 U06 Attendance Disposal Invalid For Grouping 1,133,700 9.3% 57 Source: DH Reference costs 2002 http://www.doh.gov.uk/nhsexec/refcosts.htm.
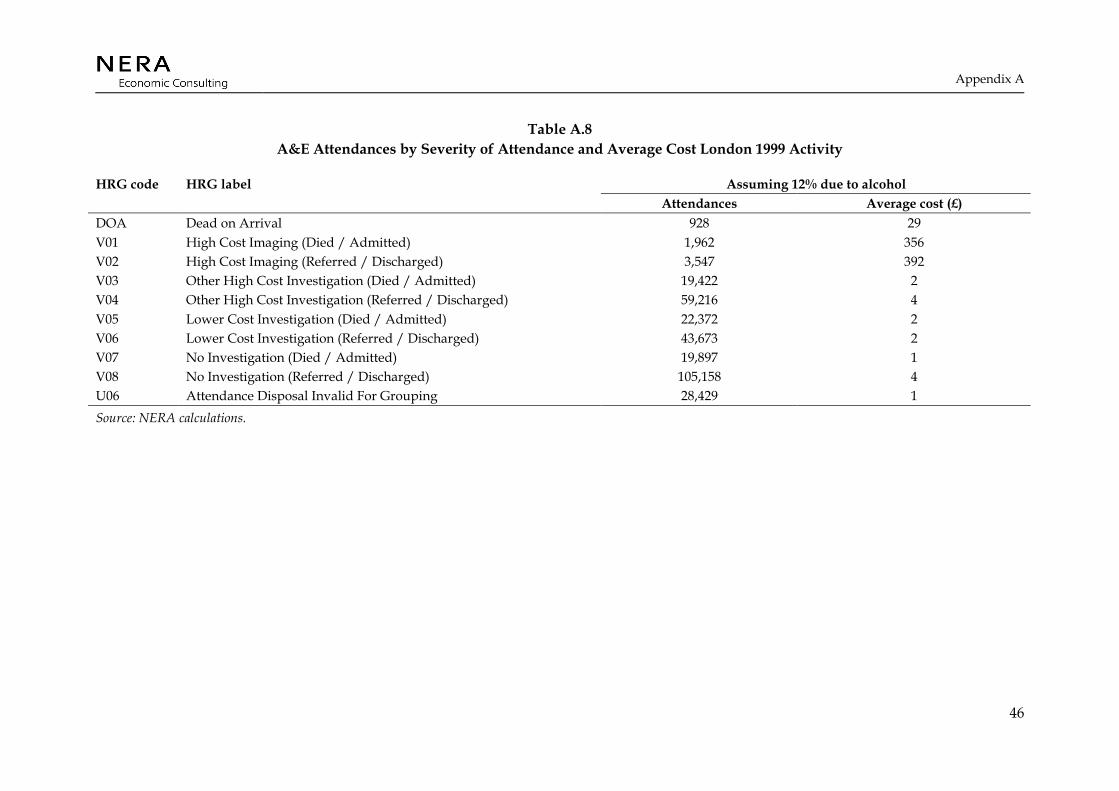
Appendix A
46
Table A.8 A&E Attendances by Severity of Attendance and Average Cost London 1999 Activity
Assuming 12% due to alcohol HRG code HRG label Attendances Average cost (£)
DOA Dead on Arrival 928 29 V01 High Cost Imaging (Died / Admitted) 1,962 356 V02 High Cost Imaging (Referred / Discharged) 3,547 392 V03 Other High Cost Investigation (Died / Admitted) 19,422 2 V04 Other High Cost Investigation (Referred / Discharged) 59,216 4 V05 Lower Cost Investigation (Died / Admitted) 22,372 2 V06 Lower Cost Investigation (Referred / Discharged) 43,673 2 V07 No Investigation (Died / Admitted) 19,897 1 V08 No Investigation (Referred / Discharged) 105,158 4 U06 Attendance Disposal Invalid For Grouping 28,429 1 Source: NERA calculations.
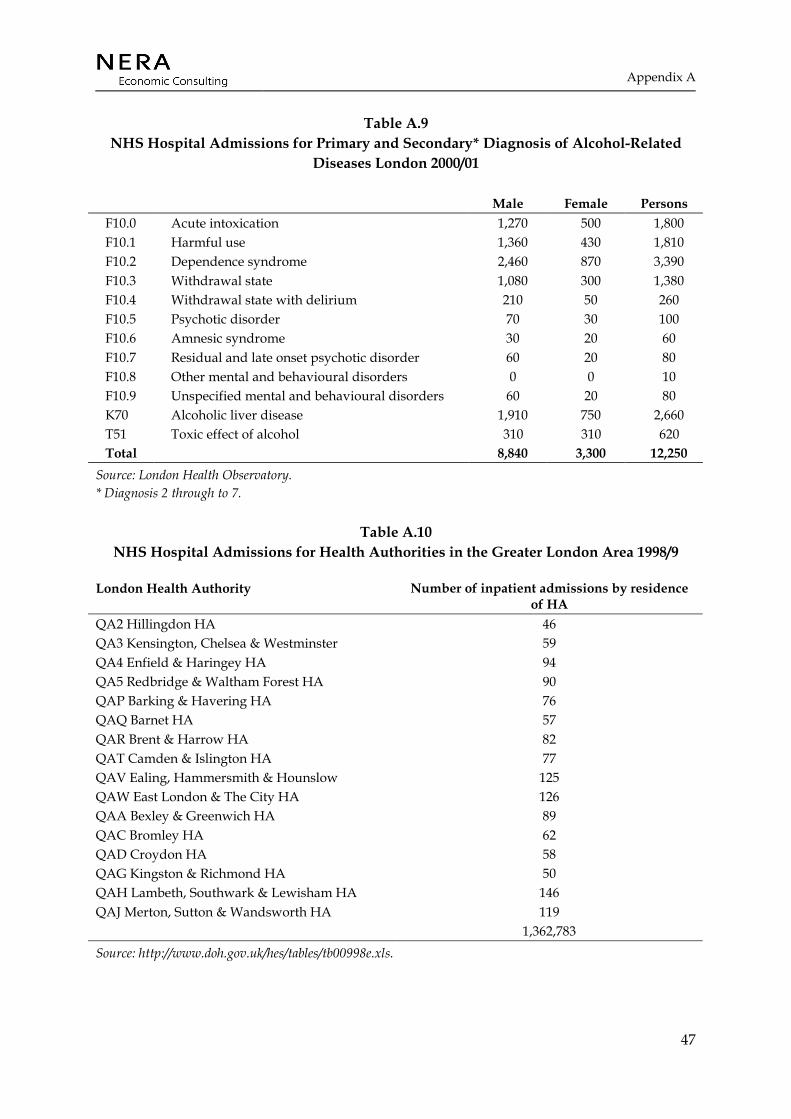
Appendix A
47
Table A.9 NHS Hospital Admissions for Primary and Secondary* Diagnosis of Alcohol-Related
Diseases London 2000/01
Male Female Persons F10.0 Acute intoxication 1,270 500 1,800 F10.1 Harmful use 1,360 430 1,810 F10.2 Dependence syndrome 2,460 870 3,390 F10.3 Withdrawal state 1,080 300 1,380 F10.4 Withdrawal state with delirium 210 50 260 F10.5 Psychotic disorder 70 30 100 F10.6 Amnesic syndrome 30 20 60 F10.7 Residual and late onset psychotic disorder 60 20 80 F10.8 Other mental and behavioural disorders 0 0 10 F10.9 Unspecified mental and behavioural disorders 60 20 80 K70 Alcoholic liver disease 1,910 750 2,660 T51 Toxic effect of alcohol 310 310 620 Total 8,840 3,300 12,250
Source: London Health Observatory. * Diagnosis 2 through to 7.
Table A.10 NHS Hospital Admissions for Health Authorities in the Greater London Area 1998/9
London Health Authority Number of inpatient admissions by residence of HA
QA2 Hillingdon HA 46 QA3 Kensington, Chelsea & Westminster 59 QA4 Enfield & Haringey HA 94 QA5 Redbridge & Waltham Forest HA 90 QAP Barking & Havering HA 76 QAQ Barnet HA 57 QAR Brent & Harrow HA 82 QAT Camden & Islington HA 77 QAV Ealing, Hammersmith & Hounslow 125 QAW East London & The City HA 126 QAA Bexley & Greenwich HA 89 QAC Bromley HA 62 QAD Croydon HA 58 QAG Kingston & Richmond HA 50 QAH Lambeth, Southwark & Lewisham HA 146 QAJ Merton, Sutton & Wandsworth HA 119 1,362,783 Source: http://www.doh.gov.uk/hes/tables/tb00998e.xls.
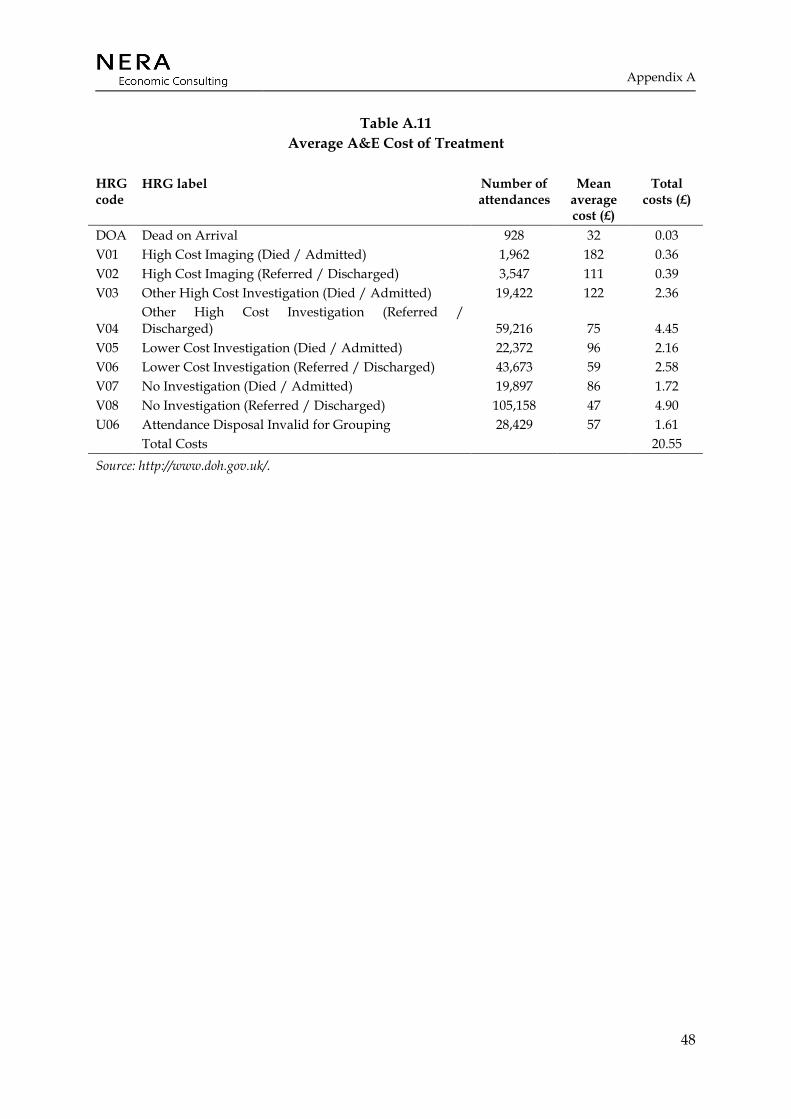
Appendix A
48
Table A.11 Average A&E Cost of Treatment
HRG code
HRG label Number of attendances
Mean average cost (£)
Total costs (£)
DOA Dead on Arrival 928 32 0.03 V01 High Cost Imaging (Died / Admitted) 1,962 182 0.36 V02 High Cost Imaging (Referred / Discharged) 3,547 111 0.39 V03 Other High Cost Investigation (Died / Admitted) 19,422 122 2.36
V04 Other High Cost Investigation (Referred / Discharged) 59,216 75 4.45
V05 Lower Cost Investigation (Died / Admitted) 22,372 96 2.16 V06 Lower Cost Investigation (Referred / Discharged) 43,673 59 2.58 V07 No Investigation (Died / Admitted) 19,897 86 1.72 V08 No Investigation (Referred / Discharged) 105,158 47 4.90 U06 Attendance Disposal Invalid for Grouping 28,429 57 1.61 Total Costs 20.55 Source: http://www.doh.gov.uk/.

Appendix A
49
A.3. Crime Costs
Table A.12 Notifiable Offences London 1999
Notifiable offence Number Murder 170 GBH 5367 ABH 34560 Common Assault 71056 Offensive Weapon 5746 Harassment 22279 Other Violence 8370 Violence Against the Person Total 147,548 Rape 2159 Other Sexual 6503 Sexual Offences Total 8662 Personal Property 30971 Business Property 4025 Robbery Total 34996 Burglary in a Dwelling 74531 Burglary in Other Buildings 44645 Burglary Total 119176 Theft/Taking of M/V 58819 Theft From M/V 103748 M/V Interference & Tampering 3629 Theft From Shops 44609 Snatches 10710 Picking Pockets, etc 24083 Theft/Taking of Pedal Cycles 17420 Other Theft 132383 Handling Stolen Goods 2694 Theft and Handling Total 398095 Counted per Victim 96204 Other Fraud & Forgery 1760 Fraud or Forgery Total 97964 Criminal Damage To a Dwelling 37011 Criminal Damage To Other Bldg 22339 Criminal Damage To M/V 64951 Other Criminal Damage 15587 Criminal Damage Total 139888 Drug Trafficking 3129 Possession Of Drugs 21252 Other Drug Offences 460 Drugs Total 24841 Going Equipped 933 Other Notifiable 8808 Other Notifiable Offences Total 9741
Source: http://www.met.police.uk/crimestatistics/index.htm.
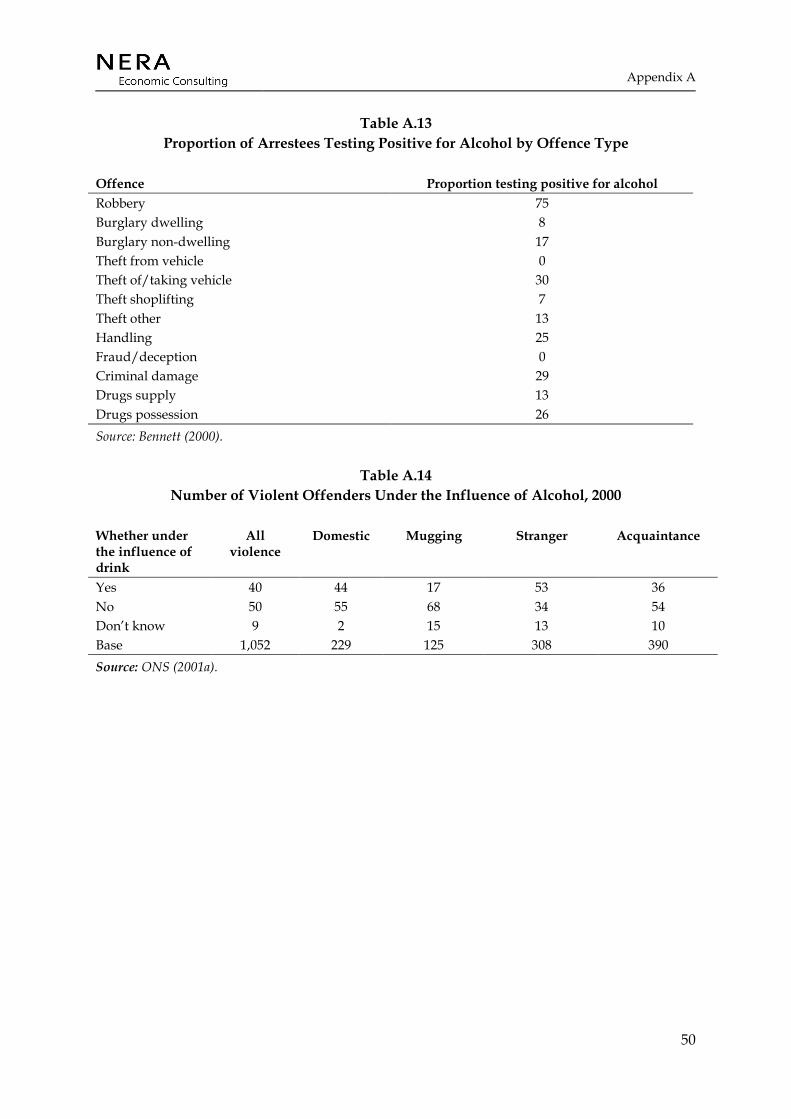
Appendix A
50
Table A.13 Proportion of Arrestees Testing Positive for Alcohol by Offence Type
Offence Proportion testing positive for alcohol Robbery 75 Burglary dwelling 8 Burglary non-dwelling 17 Theft from vehicle 0 Theft of/taking vehicle 30 Theft shoplifting 7 Theft other 13 Handling 25 Fraud/deception 0 Criminal damage 29 Drugs supply 13 Drugs possession 26 Source: Bennett (2000).
Table A.14 Number of Violent Offenders Under the Influence of Alcohol, 2000
Whether under the influence of drink
All violence
Domestic Mugging Stranger Acquaintance
Yes 40 44 17 53 36 No 50 55 68 34 54 Don’t know 9 2 15 13 10 Base 1,052 229 125 308 390 Source: ONS (2001a).

Appendix A
51
Table A.15 Cost of Crime, UK 2000 (£)
Violence against the
person
Serious Wounding
Other wounding
Common assault
Security expenditure 2 10 0 0 Insurance administration 0 0 0 0 Property stolen and damaged 0 0 0 0 Emotional and physical impact on victims 13,000 97,000 120 240 Lost output 2,500 14,000 400 20 Victim services 10 6 6 6 Health services 1,200 8,500 200 0 CJS 2,700 1,300 1,300 270 Average cost 19,000 130,000 2,000 540 Security expenditure 2 10 0 0 Brand and Price (2000)

Appendix B
52
APPENDIX B. THE PLEASURE FROM DRINKING
It is important to know the benefit or the pleasure of alcohol to the consumer. As long as the pleasure of drinking in monetary terms is higher than the price, the consumer will consume alcohol. In other words the pleasure from alcohol has to be at least as much as the price paid for it. However, for many consumers the value of a pint of beer is higher than the prevailing price. Consumer surplus tries to measure this additional value to the consumers over and above the price they pay.
To estimate the consumer surplus, we make use of the fact that the demand curve gives us the prices that consumers would be willing to pay for each quantity. A simple illustration of this is shown in Figure B.1. It shows a downward sloping demand curve in line ‘bcd’, with the prevailing price and quantity as P* and Q* respectively. For all the units of the product sold before Q*, the consumers are willing to pay an amount indicated by the height of the demand curve. The difference between the height of the demand curve and P* gives the consumer surplus for each quantity. Therefore for the first unit, the consumer surplus is equal to the difference between point ‘b’ and ‘a’. Aggregating the consumer surplus till Q* gives us the total consumer surplus, indicated by the area ‘abc’ in Figure B.1.
Figure B.1 Measuring Consumer Surplus
Q*
P*
Quantity
Price
c
b
a
defQ*
P*
Quantity
Price
c
b
a
def
P*
Quantity
Price
c
b
a
def
Figure B.1 shows that if we know the shape of the demand curve for alcohol, it is fairly simple to compute consumer surplus. In reality the demand curve is unlikely to be linear and estimating its shape is not simple for many reasons (for example, people might not know their willingness to pay) and the scope of this study does not allow us to estimate in any case. In the absence of such information we assume a linear demand curve. Estimates of the slope of this demand curve is made using estimates of ‘elasticity of demand’ of different alcohol products from literature and the following formula:

Appendix B
53
Elasticity of demand, ηD = % change in quantity demanded/ % change in price
ηD = 1/Slope of the demand curve * P/Q
Slope of the demand curve = 1/ηD * P/Q
Elasticity of demand is used to estimate the change in revenue for a change in price. For example, an elasticity of –1 shows that a change in price of a good by 10% would be offset by a 10% decrease in quantity demanded – leaving revenue unchanged.
In Section 2.2 we estimate the total price and quantity of alcohol consumed for beer, cider, wines and spirits in London. Estimates of own price elasticity of demand of these drink types is taken from Blake and Nied’s (1995) analysis of demand for alcoholic drinks in United Kingdom. The results are summarised in Table B.1.
Table B.1 Estimate of Consumer Surplus
Beer Cider Wine Spirits Total Expenditure (£m) 2.26 0.20 1.23 0.94 4.62 Volume of consumption (m Litres) 730.25 77.31 165.34 11.94 Price per Litre 3.09 2.55 7.43 76.35 Elasticity -0.95 -0.80 -1.32 -0.93 Consumer Surplus (£m) 1.12 0.10 0.61 0.47 2.31 Source: NERA estimate using Blake and Nied (1995).
Table B.1 shows that the cider is the least elastic of all the drink types i.e. it has the highest elasticity at –0.8. A 10% increase in cider price only reduces the quantity by 8% - resulting in an increase in revenue. Conversely, wines are most elastic of the drink types being assessed. A 10% increase in price of wine results in a 13.2% decrease in demand, resulting in a drop in revenue. Using elasticity, price and quantity shown in the table we estimated the slope of the demand curve and hence the consumer surplus at the given average price. The results show that for all the drinks types the surplus is almost 50% of the price i.e. people are, on average, willing to pay an extra 50% more compared to the prevailing average price in the market.
Estimating consumer surplus in this manner is very simplistic. We know that the demand curve of a product like alcohol is not linear – hence the slope and elasticity vary for different quantities. A linear demand curve implies the same value to the first pint of beer compared to the 10th. However in real life people are likely to value the first pint much more than the 10th. On an aggregate level, this implies a change in the elasticity for different volume of consumption. In other words, if wine consumption in London was only 10% of what it is now, and prices were to go up by 10%, people might not drop there consumption by 13.2%, as would be implied by our present estimates.

Appendix B
54
Besides, the demand for alcohol is also likely to change with time and is expected to be different between the UK and London. Hence the estimates from Blake and Nied (1995) may not accurately reflect the present market in London. Therefore these estimates of consumer surplus should only be considered as indicative.
References
55
REFERENCES
Alcohol Concern. Various Fact Sheets, www. alcoholconcern.org.uk.
Alcohol Concern (2002) “Your Very Good Health?” www.alcoholconcern.org.uk.
Baker, P. and McKay, S. (1990) “The Structure of Alcohol Taxes: A Hangover from the Past?” Institute of Fiscal Studies, commentary number 21.
Beer and Pub Association (2001) “Statistical Handbook”.
Bennett (2000) “Drugs and Crime: The Results of the Second Development Stage of the New-Adam programme”. Home Office research study 205.
Blake, D. and Nied, A. (1995) “The Demand for Alcohol in United Kingdom”. Discussion paper 9/95, Birbeck College, University of London.
Boreham, R. and Shaw, A. (2001) “Smoking, Drinking and Drug Use Among Young People in England in 2000” Office of National Statistics.
Brand, S. and Price, R. (2000) “The Economic and Social Cost of Crime” Home Office research study 217.
Catalyst (2001) “Alcohol Misuse in Scotland: Trends and Costs” Scottish Executive.
Chaloupka, F., Grossman, M., Bickel, W., and Saffer, H. (1999) “The Economic Analysis of Substance Use and Abuse”. National Bureau of Economic Research, University of Chicago.
Cook, P. and Moore, M. (1999) “Alcohol”. Working paper 6905, NBER working paper series.
Coyle, D., Godfrey, C., Hardman, G. and Raistrick, D. (1997) “Costing Substance Misuse”. Addiction 92(8), pages 1007-1015.
Dave, D. and Kaestner, R. (2002) “Alcohol Taxes and Labour Market Outcomes”. Journal of Health Economics 21, pages 357-371.
Deehan, A. (1999) “Alcohol and Crime” Crime reduction research series paper 3, Home Office.
Department of Health (2001) “NHS Staff Earnings Survey 2000”. Press release, reference 2001/0461.
Department for Transport, (2000) “Valuation of the Benefits of Prevention of Road Accidents” Highway Economics note number 1.
References
56
DETR (2000) “Road Accidents: Great Britain 1999”.
Godfrey, C. (1992) “The Cost-effectiveness of Alcohol Services”. Yartic Occasional Paper 2, Centre of Health Economics.
Godfrey, C., Hardman, G. and Maynard, A. (1994) “Conceptual Issues in estimating the Social Costs of Alcohol”. International Symposium on the Economic Costs of Substance Abuse, Banff, Canada May 11-13, 1994.
Godfrey, C. and Hardman, G. (1994) “Changing the Social Costs of Alcohol”. Centre for Health Economics, University of York.
GLA (2002) “ Late-Night London: Planning and Managing the Late Night Economy”. SDX Technical Report Six.
Home Office (2000) “The 2000 British Crime Survey”. Statistical Bulletin 18/00.
Home Office (2000b) “Motoring Offences” Statistical bulletin 26/00.
Home Office (2002) “Liquor Licensing”. Statistical Bulletin 02/02.
Hutcheson, G., Henderson, M., and- Davies, J. (1995) “Alcohol in Workplace: Costs and Responsibilities”. Department of Education and Employment.
Institute of Alcohol Studies. Various Fact Sheets, www. ias.org.
Pirmohammed, M., Brown, C., Owens, L., Luke, C., Gilmore, I. Breckenridge, A., and Park, B. (2000) “The Burden of Alcohol Use in Inner-city General Hospitals” Quarterly Journal of Medicine 93, page 291-295.
Lader, D. and Meltzer, H. (2001) “ Drinking: Adults’ behaviour and knowledge in 2000” A report on the Department of Health using the ONS omnibus survey.
Matrix (2001) “Estimating the Cost of Injuries and Accidents to London” Available at http://www.lho.org.uk/holp/ia/ia_appc1.htm in January 2003.
National Economic Research Associates, and CASPAR (1998) “Valuation of Death from Air Pollution”.
Netten, A., Ress, T. and Harrison, G. (2001) “ Unit Costs of Health and Social Care”. Personal Social Services Research Unit, University of Kent.
Office of National Statistics (1999) “Mortality Statistics: General” Series DH1, number 32.
References
57
Office of National Statistics (1999b) “Mortality Statistics: Cause” Series DH2, number 26.
Office of National Statistics (2000) “Focus on London”.
Office of National Statistics (2001a) “Statistics on Alcohol: England, 1978 onwards”. Statistical bulletin 2001/13.
Office of National Statistics (2001b) “Living in Britain”. Results from the 2000 General Household Survey.
Office of National Statistics (2001c) “Travel Trends”. A report on the 2000 International Passenger Survey.
Office of National Statistics (2002) “Region in Figures: London”. Number 5.
Office of National Statistics (2002b) “Regional Labour Market Performance”. Labour Market Trends, May 2002.
Office of National Statistics (2002c) “Trends and Sources on Sickness Absence”. Labour Market Trends, April 2002.
Povey, S. and Cotton, J. (2000) “Recorded Crime Statistics” Home Office, Statistical bulletin 1/00.
Powell, M. (1990) “Reducing the Costs of Alcohol in Workplace: The Case for Employer Policies”. Discussion paper 68, University of York.
Social Issues Research Centre (2001) “Counting the Cost: The Measurement and Recording of Alcohol-Related Violence and Disorder”. The Portman Group.
Youth Justice Board (2001) “Youth Survey 2001”.