A Deep Learning Model for Automated Sleep Stages ...
22
Yildirim, O., Baloglu, U. B., & Acharya, U. R. (2019). A deep learning model for automated sleep stages classification using PSG signals. International Journal of Environmental Research and Public Health, 16(4), [599]. https://doi.org/10.3390/ijerph16040599 Publisher's PDF, also known as Version of record License (if available): CC BY Link to published version (if available): 10.3390/ijerph16040599 Link to publication record in Explore Bristol Research PDF-document This is the final published version of the article (version of record). It first appeared online via MDPI at https://doi.org/10.3390/ijerph16040599 . Please refer to any applicable terms of use of the publisher. University of Bristol - Explore Bristol Research General rights This document is made available in accordance with publisher policies. Please cite only the published version using the reference above. Full terms of use are available: http://www.bristol.ac.uk/red/research-policy/pure/user-guides/ebr-terms/
Transcript of A Deep Learning Model for Automated Sleep Stages ...

Yildirim, O., Baloglu, U. B., & Acharya, U. R. (2019). A deep learningmodel for automated sleep stages classification using PSG signals.International Journal of Environmental Research and Public Health,16(4), [599]. https://doi.org/10.3390/ijerph16040599
Publisher's PDF, also known as Version of recordLicense (if available):CC BYLink to published version (if available):10.3390/ijerph16040599
Link to publication record in Explore Bristol ResearchPDF-document
This is the final published version of the article (version of record). It first appeared online via MDPI athttps://doi.org/10.3390/ijerph16040599 . Please refer to any applicable terms of use of the publisher.
University of Bristol - Explore Bristol ResearchGeneral rights
This document is made available in accordance with publisher policies. Please cite only thepublished version using the reference above. Full terms of use are available:http://www.bristol.ac.uk/red/research-policy/pure/user-guides/ebr-terms/

International Journal of
Environmental Research
and Public Health
Article
A Deep Learning Model for Automated Sleep StagesClassification Using PSG Signals
Ozal Yildirim 1,* , Ulas Baran Baloglu 1 and U Rajendra Acharya 2,3,4
1 Department of Computer Engineering, Munzur University, Tunceli 62000, Turkey; [email protected] Department of Electronics and Computer Engineering, Ngee Ann Polytechnic, Singapore 599489, Singapore;
[email protected] Department of Biomedical Engineering, School of Science and Technology,
Singapore School of Social Sciences, Singapore 599489, Singapore4 School of Medicine, Faculty of Health and Medical Sciences, Taylor’s University,
Subang Jaya 47500, Malaysia* Correspondence: [email protected]; Tel.: +90-428-213-1794
Received: 1 December 2018; Accepted: 16 February 2019; Published: 19 February 2019�����������������
Abstract: Sleep disorder is a symptom of many neurological diseases that may significantly affectthe quality of daily life. Traditional methods are time-consuming and involve the manual scoringof polysomnogram (PSG) signals obtained in a laboratory environment. However, the automatedmonitoring of sleep stages can help detect neurological disorders accurately as well. In this study,a flexible deep learning model is proposed using raw PSG signals. A one-dimensional convolutionalneural network (1D-CNN) is developed using electroencephalogram (EEG) and electrooculogram(EOG) signals for the classification of sleep stages. The performance of the system is evaluated usingtwo public databases (sleep-edf and sleep-edfx). The developed model yielded the highest accuraciesof 98.06%, 94.64%, 92.36%, 91.22%, and 91.00% for two to six sleep classes, respectively, using thesleep-edf database. Further, the proposed model obtained the highest accuracies of 97.62%, 94.34%,92.33%, 90.98%, and 89.54%, respectively for the same two to six sleep classes using the sleep-edfxdataset. The developed deep learning model is ready for clinical usage, and can be tested with bigPSG data.
Keywords: sleep stages; classification; deep learning; CNNs; polysomnography (PSG)
1. Introduction
Sleep disorders are widespread in most of the population, and may lead to serious healthproblems affecting the quality of life [1]. Insomnia, hypersomnias, parasomnias, sleep-related breathing,narcolepsy, circadian rhythm disorders, and sleep-related movement disorders are the commonhealth problems that are created due to sleep disorders. Although many of these disorders can bediagnosed clinically, some of them should be analyzed using advanced techniques in the laboratoryenvironment [1,2]. Polysomnogram (PSG) recordings of subjects are the physiological signals thatare collected during an entire night of sleep. The PSG is a multivariate system consisting of signalrecordings such as electroencephalogram (EEG), electrocardiogram (ECG), electrooculogram (EOG),and electromyogram (EMG) [3]. After the recordings, sleep stage scoring is performed on PSG records.This process is manually carried out by the sleep experts who score and grade the sleep stages [4].These experts visually evaluate the PSG signals for a specific time frame, and then determine the scoresaccording to various criteria. The main criteria for this process are based on the guidelines that werefirst proposed by Rechtschaffen and Kales (R&K) [5], and later developed by the American Academy ofSleep Medicine (AASM) [6]. According to the rules of R&K, a sleep stage can be classified as wake (W),
Int. J. Environ. Res. Public Health 2019, 16, 599; doi:10.3390/ijerph16040599 www.mdpi.com/journal/ijerph

Int. J. Environ. Res. Public Health 2019, 16, 599 2 of 21
four non-rapid eye movement (NREM) stages (S1–S4), and rapid eye movement (REM). According tothe AASM guidelines, the S3 and S4 stages are represented by a single class as slow-wave sleep (SWS).The wake sleep stage is defined as the class of awakening of the subject before the sleep. NREM S1is the first stage of a sleep where the brain activity slows down, and muscles are relaxed. Stage S2is the stage where the actual sleep phase begins, and the eye movements stop in this stage. Stage S3is called deep sleep, because the brain function of the subject is significantly reduced. Deep sleepactivity continues in the NREM S4 sleep stage. Eyes are closed in the REM stage, but they also moverapidly [7].
The visual inspection of PSG signals and manual determination of sleep stages is a complex,costly, and problematic process that requires expertise [8,9]. Besides, it is visually hard to detect EEGsignal variations due to their random and chaotic nature [10]. For this reason, automated detectionand recognition systems are developed to assist the experts. The most commonly used PSG signal forsleep-stage classification is the EEG data of one or more channels. Usage of the EEG signal is mostlypreferred because EEG signals can be easily obtained with wearable technologies, and they consist ofuseful information as well [10,11]. Wearable technologies are an important technological advancementbecause the usage of this technology helps monitor the sleep data of subjects comfortably in their homeenvironment [12].
During EEG signal processing, feature extraction, feature selection, and classification [13]steps are commonly used. Time, frequency, time-frequency domain-based transformations, andnon-linear feature extraction methods are employed by various researchers at the feature extractionstage of EEG signals [14–16]. Due to the characteristic features of these signals, more advancedsignal-processing techniques and complex machine learning algorithms are preferred instead of timeand frequency domain approaches [7,10,17–19]. However, all of these approaches are mostly basedon the use of shallow classifiers on the features obtained from one or more handcrafted featureextraction/selection processes.
Acharya et al. [20] have performed the automatic identification of sleep stages with a Gaussianmixture model classifier using high-order spectra (HOS)-based features for two channels of EEGdata. For the feature extraction stage, Sharma et al. [7] employed a novel three-band time-frequencylocalized wavelet filter bank, and then the extracted features were given as input to the supportvector machine (SVM) classifier for the automated recognition of sleep-stages. Hassan et al. [21]first decomposed the EEG signals using ensemble empirical mode decomposition (EEMD), and thenextracted several statistical properties from the data. For this purpose, they proposed a classifiercalled random undersampling boosting (RUSBoost), which can automatically score sleep with theobtained features. Zhu et al. [22] performed the sleep-stage recognition task with 14963 EEG segmentsusing a graph domain-based approach. They mapped EEG signals into a visibility graph (VG) anda horizontal visibility graph (HVG). Rahman et al. [23] preferred discrete wavelet transform (DWT) forthe feature extraction on single EOG signals, and they claimed the superiority of EOG signals overEEG signals in the classification of sleep stages. Tsinalis et al. [12] obtained sleep stage-specific signalcharacteristics using time-frequency-based feature extraction, and achieved an average accuracy of86% on EEG data of 20 healthy young adults. Bajaj et al. [24] proposed an EEG-based technique thatused time-frequency images (TFIs). Their method can automatically classify the data into sleep stagesby using the least-square SVM classifier and the features from the histograms of segmented TFIs.
Huang et al. [9] used spectral feature extraction from two foreheads (FP1 and FP2) of EEG signalsby using short-time fast Fourier transform and manual scoring knowledge. They also classifiedsleep stages with these features by using the relevant vector machine classification technique.Nakamura et al. [25] employed a multi-class SVM to classify the features derived from EEG byusing multi-scale fuzzy entropy (MSFE) and multi-scale permutation entropy (MSPE) features.Similarly, Rodriguze-Sotelo et al. [4] used entropy-based features with an unsupervised classifier.Acharya et al. [26] proposed a solution for the recognition of six stages of sleep using non-linearparameters. Fell et al. [27] used a variety of spectral and non-linear measurements from EEG signals

Int. J. Environ. Res. Public Health 2019, 16, 599 3 of 21
for the discrimination of sleep stages. They reported that the combinations of these measurementswould produce better results than the previous studies, as indicated in the literature. In another study,Alickovic and Subasi [3] proposed a three-module structure for the same problem. In the first moduleof their solution, the signals obtained from the Pz–Oz channel were de-noised using multi-scaleprincipal component analysis (PCA). In the second module, feature extraction was performed by usingstatistical methods on the signals separated to sub-bands by the DWT. Finally, in the third module,rotational SVM was used to classify the data into five-stage sleep data with an accuracy of 91.1%.
Imtiaz et al. [28] suggested a small decision tree (DT) driven by a class machine for theautomated scoring of sleep stages. They reported 82% and 79% accuracy rates during training andtesting, respectively. Silveria et al. [29] applied the DWT method on EEG signals and performedsleep-stage classification using the random forest (RF) classifier on kurtosis, skewness, and variances.Sen et al. [15] collected 41 attributes under four categories for the feature-extraction stage, and thenused a variety of feature selection methods to select the useful features from these collected attributes.Memar and Faradji [30] also proposed a system for the classification of the wake and sleep stages.During the feature-extraction stage, they decomposed each EEG sample into eight sub-bands withdifferent frequency contents, and then classified the extracted features using the random forest classifier.Yulita et al. [31] used a fast-convolutional method-based feature learning and softmax classifier forautomatic sleep stage classification. Vural et al. [32] constructed an EEG-based classification structureusing principal component analysis (PCA).
In the given state-of-the-art for the sleep stage classification methods, all of the feature extraction,selection, and classification tasks are performed on the data as separate processes. Recent developmentsin the field in the machine learning area have led to the emergence of end-to-end deep structureswith the capability to perform these separated tasks together in a more efficient way [33–36].Deep learning methods have already demonstrated their success in various research areas suchas image recognition, sound processing, and natural language processing. Accordingly, deep modelsalready have a widespread application in the biomedical area. There has been a notable increasein the use of deep learning approaches for the evaluation of biomedical signals (EEG, ECG, EMG,and EOG) [37]. Deep learning methodologies were employed on many challenging topics such ascomputer-based evaluations of ECG data for heart diseases [38–41] and the detection of neurologicaldisorders using EEG signals [42–45]. There are also few studies in the literature where deep learningmodels have been used for the sleep stage classification. Supratak et al. [46] conducted a study onDeepSleepNet by combining a convolutional neural network (CNN) and bidirectional long short- termmemory (BLSTM) for the sleep stage classification. DeepSleepNet contains a CNN and BLSTM asconsecutive steps. The learning process was completed in the CNN part, and a sequence of residuallearning was realized in the BLSTM part. Tsinalis et al. [12] categorized more than 20 healthy subject’sdata by using a CNN model on single EEG channel data. They achieved an average performance of74% accuracy for five-stage sleep classification. Tripathy and Acharya [47] classified sleep stages byusing an RR-time series and EEG signals with a deep neural network (DNN). Chambon et al. [48]proposed an 11-layer two-dimensional (2D) CNN model for sleep stage classification. In this model,EEG/EOG and EMG PSG signals are used as the input. They reported that the usage of limited EEGchannels (six channels) on their model showed similar performances with the use of 20 channels ofEEG data. Michielli et al. [49] proposed a cascaded LSTM architecture for automated sleep stageclassification using single-channel EEG signals.
In this study, a new deep learning model based on a one-dimensional convolutional neuralnetwork (1D-CNN) is proposed for automated sleep stage classification. This model helps constructan end-to-end structure where no handcrafted feature is used for sleep stage recognition with raw PSGsignals. One of the most important contributions of the study is that the proposed deep model canbe used without changing any of its layer parameters for two to six sleep classes and other types ofPSG signals. Hence, our model is flexible and developed using two popular sleep databases that areavailable in the literature.

Int. J. Environ. Res. Public Health 2019, 16, 599 4 of 21
2. Materials and Methods
This section presents detailed information about the architecture of the proposed 1D-CNN model,and also provides information about the sleep datasets used in the study.
2.1. Sleep Datasets
In this study, the two most common public sleep datasets have been used to evaluate the proposeddeep CNN model. The first of one is the sleep-edf [50] dataset, which contains eight healthy malesand females’ polysomnograms (PSG) records. These PSG recordings include two EEG channels: onehorizontal EOG signal (Fpz–Cz) and one submental chin EMG signal (Pz–Oz). These signals wereobtained with a sampling rate of 100 Hz, and each 30-s fragment was scored based on the R&K manual.In the dataset, there are also hypnogram files, which contain annotations of sleep patterns for eachsubject according to PSGs. These patterns are labeled for sleep stages as W, S1, S2, S3, S4, REM, M, and ?(not scored). The second dataset, sleep-edfx [51], is the extended version of the sleep-edf database.The sleep-edfx dataset contains the PSG records of 61 subjects. In this work, *.edf records are dividedinto two different groups: Sc* and St*. The Sc* records include PSG records of a 24-hour routine ofthe subjects, and the St* records include one-night data from the hospital collected with a miniaturetelemetry system. Each dataset contains scored recordings for six sleep stages. Table 1 shows thedetailed information of the used sleep records. It may be noted that no filtering was performed onthe data, which is the significant difference compared to the other reported studies. Only ambiguousrecordings are filtered out so that the number of records used is higher than the rest of the studiesusing this dataset.
Table 1. Detailed information about the sleep database records used in this study.
DatabaseSleep Stages Total Samples
Wake (W) S1 S2 S3 S4 REM (R)
sleep-edf 8055(53.03%)
604(3.97%)
3621(23.84%)
672(4.42%)
627(4.12%)
1609(10.59%) 15,188
sleep-edfx 74,676(58.56%)
4848(3.8%)
27,292(21.4%)
5075(3.9%)
3773(2.9%)
11,848(9.2%) 127,512
In both datasets, more than 50% of the records belong to wake (W) sleep stages, and the secondhighest number of records belongs to the class S1. In Figure 1, one segment of the PSG signal sampleof the sc4002e0 record is shown for two stages (wake stage and rapid eye movement-REM stage).This record is chosen from the sleep-edf dataset, and the figure shows the hypnogram recording of thesame (sc4002e0) record for the time of 22:20–06:10.
Int. J. Environ. Res. Public Health 2019, 15, x 4 of 22
2.1. Sleep Datasets
In this study, the two most common public sleep datasets have been used to evaluate the proposed deep CNN model. The first of one is the sleep-edf [50] dataset, which contains eight healthy males and females’ polysomnograms (PSG) records. These PSG recordings include two EEG channels: one horizontal EOG signal (Fpz–Cz) and one submental chin EMG signal (Pz–Oz). These signals were obtained with a sampling rate of 100 Hz, and each 30-s fragment was scored based on the R&K manual. In the dataset, there are also hypnogram files, which contain annotations of sleep patterns for each subject according to PSGs. These patterns are labeled for sleep stages as W, S1, S2, S3, S4, REM, M, and ? (not scored). The second dataset, sleep-edfx [51], is the extended version of the sleep-edf database. The sleep-edfx dataset contains the PSG records of 61 subjects. In this work, *.edf records are divided into two different groups: Sc* and St*. The Sc* records include PSG records of a 24-hour routine of the subjects, and the St* records include one-night data from the hospital collected with a miniature telemetry system. Each dataset contains scored recordings for six sleep stages. Table 1 shows the detailed information of the used sleep records. It may be noted that no filtering was performed on the data, which is the significant difference compared to the other reported studies. Only ambiguous recordings are filtered out so that the number of records used is higher than the rest of the studies using this dataset.
Table 1. Detailed information about the sleep database records used in this study.
Database Sleep Stages
Total Samples Wake (W) S1 S2 S3 S4 REM (R)
sleep-edf 8055 (53.03%)
604 (3.97%)
3621 (23.84%)
672 (4.42%)
627 (4.12%)
1609 (10.59%) 15,188
sleep-edfx 74,676 (58.56%)
4848 (3.8%)
27,292 (21.4%)
5075 (3.9%)
3773 (2.9%)
11,848 (9.2%) 127,512
In both datasets, more than 50% of the records belong to wake (W) sleep stages, and the second highest number of records belongs to the class S1. In Figure 1, one segment of the PSG signal sample of the sc4002e0 record is shown for two stages (wake stage and rapid eye movement-REM stage). This record is chosen from the sleep-edf dataset, and the figure shows the hypnogram recording of the same (sc4002e0) record for the time of 22:20–06:10.
0 500 1000 1500 2000 2500 3000-500
0
500-100
0
100-200
0
200
22:20 23:10 00:00 00:50 01:40 02:30 03:20 04:10 04:30 05:20 06:10
Wake
S1
S2
S3
S4
REM
Time
Slee
p St
ages
Record: sc4002e0.hyp
-50
0
50
-500
50
0 500 1000 1500 2000 2500 3000-200
0
200
EEG Fpz-Cz
Am
plitu
de (µ
V)
Am
plitu
de (µ
V)
Wake Stage REM Stage
EEG Pz-Oz
Horizontal EOG
EEG Fpz-Cz
EEG Pz-Oz
Horizontal EOG
(a) (b)
(c)
Figure 1. Cont.

Int. J. Environ. Res. Public Health 2019, 16, 599 5 of 21
Int. J. Environ. Res. Public Health 2019, 15, x 4 of 22
2.1. Sleep Datasets
In this study, the two most common public sleep datasets have been used to evaluate the proposed deep CNN model. The first of one is the sleep-edf [50] dataset, which contains eight healthy males and females’ polysomnograms (PSG) records. These PSG recordings include two EEG channels: one horizontal EOG signal (Fpz–Cz) and one submental chin EMG signal (Pz–Oz). These signals were obtained with a sampling rate of 100 Hz, and each 30-s fragment was scored based on the R&K manual. In the dataset, there are also hypnogram files, which contain annotations of sleep patterns for each subject according to PSGs. These patterns are labeled for sleep stages as W, S1, S2, S3, S4, REM, M, and ? (not scored). The second dataset, sleep-edfx [51], is the extended version of the sleep-edf database. The sleep-edfx dataset contains the PSG records of 61 subjects. In this work, *.edf records are divided into two different groups: Sc* and St*. The Sc* records include PSG records of a 24-hour routine of the subjects, and the St* records include one-night data from the hospital collected with a miniature telemetry system. Each dataset contains scored recordings for six sleep stages. Table 1 shows the detailed information of the used sleep records. It may be noted that no filtering was performed on the data, which is the significant difference compared to the other reported studies. Only ambiguous recordings are filtered out so that the number of records used is higher than the rest of the studies using this dataset.
Table 1. Detailed information about the sleep database records used in this study.
Database Sleep Stages
Total Samples Wake (W) S1 S2 S3 S4 REM (R)
sleep-edf 8055 (53.03%)
604 (3.97%)
3621 (23.84%)
672 (4.42%)
627 (4.12%)
1609 (10.59%) 15,188
sleep-edfx 74,676 (58.56%)
4848 (3.8%)
27,292 (21.4%)
5075 (3.9%)
3773 (2.9%)
11,848 (9.2%) 127,512
In both datasets, more than 50% of the records belong to wake (W) sleep stages, and the second highest number of records belongs to the class S1. In Figure 1, one segment of the PSG signal sample of the sc4002e0 record is shown for two stages (wake stage and rapid eye movement-REM stage). This record is chosen from the sleep-edf dataset, and the figure shows the hypnogram recording of the same (sc4002e0) record for the time of 22:20–06:10.
0 500 1000 1500 2000 2500 3000-500
0
500-100
0
100-200
0
200
22:20 23:10 00:00 00:50 01:40 02:30 03:20 04:10 04:30 05:20 06:10
Wake
S1
S2
S3
S4
REM
Time
Slee
p St
ages
Record: sc4002e0.hyp
-50
0
50
-500
50
0 500 1000 1500 2000 2500 3000-200
0
200
EEG Fpz-Cz
Am
plitu
de (µ
V)
Am
plitu
de (µ
V)
Wake Stage REM Stage
EEG Pz-Oz
Horizontal EOG
EEG Fpz-Cz
EEG Pz-Oz
Horizontal EOG
(a) (b)
(c) Figure 1. Sample polysomnogram (PSG) signals and scored hypnogram records obtained from thesleep-edf database: (a) wake stage, (b) rapid eye movement (REM) stage, and (c) hypnogram forsc40020 record between 22:20 and 06:10.
2.2. Deep Model Architecture
CNN models are frequently used to recognize the two-dimensional images [52]. However,the usage of CNN models is not limited to two-dimensional or three-dimensional recognition tasks.1D-CNN shares the same properties with other CNN models. The only difference is in the convolutionoperation, which is called as the 1D convolution operation, and is known to be suitable for input data inone dimension, such as biomedical signals [37]. For a 1D input signal, S, and kernel W, the convolutionoperation is defined as follows:
(S ∗W)n =|W|
∑i=1
W(i)S(i + n− 1) (1)
In this equation, the ∗ operator denotes the discrete convolution operation. It is to be noted thatthe kernel, which is also called weights, slides over the input. The output of the convolution process iscalled a feature map. Let (S|W(i,j))n
be the restricted matrix of the input matrix to the weight matrix.The elements of (S|W(i,j))n
represent the elements of S from n to the dimension of W(i,j). Thus, the outputmatrix can be represented by a general formula, which is given in Equation (2):
Oln =
(S|W(i,j) ∗W(i, j)
)n
(2)
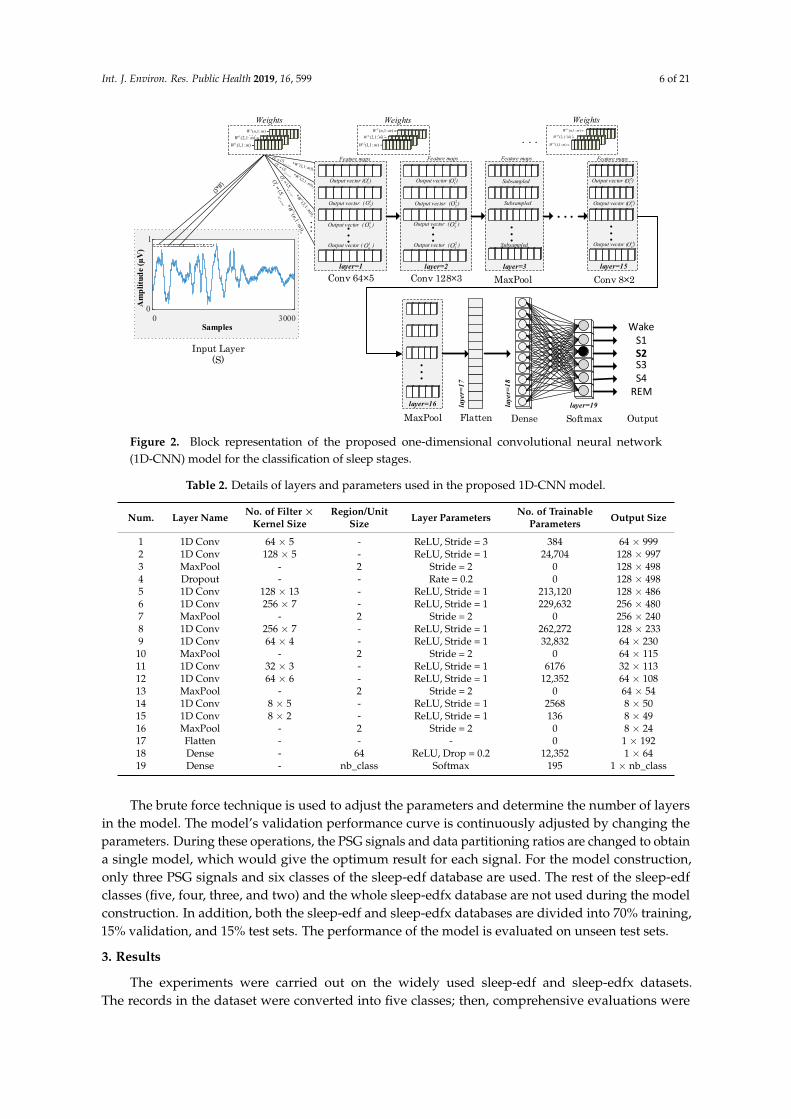
This convolution layer operation is similar to the feature extraction stage, and its output producesa feature map of the input. Either feature maps can be sub-sampled into a pooling layer that is placedinside the model, or they can be processed in consecutive convolution layers. The final layer of theCNN model usually contains a neural network layer, which is called a fully connected layer, and thislayer performs the classification task. Figure 2 presents the block diagram of the proposed 19-layered1D-CNN model for the automated recognition of sleep stages.
The preprocessed PSG signal segments with 3000 samples are used as input. These PSG signals areconvoluted in the first layer of the model with 64 × 5 filters and three stride ratios to produce featuremaps in 64 × 999 sizes. The second layer of the model is another convolution layer with 128 × 5 filters.This layer generates new feature maps in 128 × 997 sizes by using the output of the previous layer.In the MaxPool layer, the maximum values in two unit regions of the two output vectors are reduced toa single value. Thus, the input feature maps are reduced to 128 × 498 dimensions. In the consecutivelayers of the model, these processes are repeated in a similar fashion, but with filters of different sizes.Dropout layers are placed in the model to prevent the overfitting problem. The dimensions of theinput vectors in the flattened layer are converted to the appropriate dimensions for the dense layers.Finally, in the softmax layer, the input signals are mapped to the output signals. Therefore, the numberof units in this layer is the same as the number of classes (nb_class). All of the layers of the model anddetailed parameter representations of these layers are given in Table 2.
Int. J. Environ. Res. Public Health 2019, 16, 599 6 of 21
Int. J. Environ. Res. Public Health 2019, 15, x 5 of 22
Figure 1. Sample polysomnogram (PSG) signals and scored hypnogram records obtained from the sleep-edf database: (a) wake stage, (b) rapid eye movement (REM) stage, and (c) hypnogram for sc40020 record between 22:20 and 06:10.
2.2. Deep Model Architecture
CNN models are frequently used to recognize the two-dimensional images [52]. However, the usage of CNN models is not limited to two-dimensional or three-dimensional recognition tasks. 1D-CNN shares the same properties with other CNN models. The only difference is in the convolution operation, which is called as the 1D convolution operation, and is known to be suitable for input data in one dimension, such as biomedical signals [37]. For a 1D input signal, S, and kernel W, the convolution operation is defined as follows:
1( * ) ( ) ( 1)
W
ni
S W W i S i n
(1)
In this equation, the * operator denotes the discrete convolution operation. It is to be noted that the kernel, which is also called weights, slides over the input. The output of the convolution process is called a feature map. Let
( , )|( )W i j nS be the restricted matrix of the input matrix to the weight matrix.
The elements of ( , )|( )
W i j nS represent the elements of S from n to the dimension of W(i,j). Thus, the
output matrix can be represented by a general formula, which is given in Equation (2):
( , )| * ( , )W i j
ln n
O S W i j (2)
This convolution layer operation is similar to the feature extraction stage, and its output produces a feature map of the input. Either feature maps can be sub-sampled into a pooling layer that is placed inside the model, or they can be processed in consecutive convolution layers. The final layer of the CNN model usually contains a neural network layer, which is called a fully connected layer, and this layer performs the classification task. Figure 2 presents the block diagram of the proposed 19-layered 1D-CNN model for the automated recognition of sleep stages.
0 30000
1
Conv 64×5 Conv 128×3 MaxPool Conv 8×2
MaxPool Flatten Dense Softmax
Input Layer (S)
layer=1
Weights
Am
plitu
de (µ
V)
. . .
. . .
. . .
. . .
. . .
. . .
WakeS1S2S3S4REM
Output
Samples
layer=2 layer=3
laye
r=17
laye
r=18
layer=19
layer=15
layer=16
Feature maps
Output vector ( )
Output vector ( )
Output vector ( )
Feature maps Feature maps
1(1,1: )W m
1(1,1: )
1
11
|
1
(* (1,1: ))
Wm
O SW
m
1(2,1: )
1
1
2
|
2
(*
(2,1: ))
W
m
OS
W
m
1(3,1:
)
1
1
3
|
3
(
*(3,1:
))
W
m
OS
W
m
1
(,1:
)
1
1
|(
*(
,1:))
Wn
m
n
n
OS
Wn
m
1(2,1: )W m
1( ,1: )W n m . . .
Weights
2 (1,1: )W m
2 (2,1: )W m
2 ( ,1: )W n m . . .
11O
12O
13O
Output vector ( )1nO
Output vector ( )21O
Output vector ( )22O
Output vector ( )23O
Output vector ( )23O
Weights
15 (1,1: )W m
15 (2,1: )W m
15 ( ,1: )W n m . . .
Output vector ( )151O
Output vector ( )152O
Output vector ( )15nO
( * )S W
Subsampled
Subsampled
Subsampled
Feature maps
. . .
. . .
Figure 2. Block representation of the proposed one-dimensional convolutional neural network (1D-CNN) model for the classification of sleep stages.
Figure 2. Block representation of the proposed one-dimensional convolutional neural network(1D-CNN) model for the classification of sleep stages.
Table 2. Details of layers and parameters used in the proposed 1D-CNN model.
Num. Layer Name No. of Filter ×Kernel Size
Region/UnitSize Layer Parameters No. of Trainable
Parameters Output Size
1 1D Conv 64 × 5 - ReLU, Stride = 3 384 64 × 9992 1D Conv 128 × 5 - ReLU, Stride = 1 24,704 128 × 9973 MaxPool - 2 Stride = 2 0 128 × 4984 Dropout - - Rate = 0.2 0 128 × 4985 1D Conv 128 × 13 - ReLU, Stride = 1 213,120 128 × 4866 1D Conv 256 × 7 - ReLU, Stride = 1 229,632 256 × 4807 MaxPool - 2 Stride = 2 0 256 × 2408 1D Conv 256 × 7 - ReLU, Stride = 1 262,272 128 × 2339 1D Conv 64 × 4 - ReLU, Stride = 1 32,832 64 × 230
10 MaxPool - 2 Stride = 2 0 64 × 11511 1D Conv 32 × 3 - ReLU, Stride = 1 6176 32 × 11312 1D Conv 64 × 6 - ReLU, Stride = 1 12,352 64 × 10813 MaxPool - 2 Stride = 2 0 64 × 5414 1D Conv 8 × 5 - ReLU, Stride = 1 2568 8 × 5015 1D Conv 8 × 2 - ReLU, Stride = 1 136 8 × 4916 MaxPool - 2 Stride = 2 0 8 × 2417 Flatten - - - 0 1 × 19218 Dense - 64 ReLU, Drop = 0.2 12,352 1 × 6419 Dense - nb_class Softmax 195 1 × nb_class
The brute force technique is used to adjust the parameters and determine the number of layersin the model. The model’s validation performance curve is continuously adjusted by changing theparameters. During these operations, the PSG signals and data partitioning ratios are changed to obtaina single model, which would give the optimum result for each signal. For the model construction,only three PSG signals and six classes of the sleep-edf database are used. The rest of the sleep-edfclasses (five, four, three, and two) and the whole sleep-edfx database are not used during the modelconstruction. In addition, both the sleep-edf and sleep-edfx databases are divided into 70% training,15% validation, and 15% test sets. The performance of the model is evaluated on unseen test sets.
3. Results
The experiments were carried out on the widely used sleep-edf and sleep-edfx datasets.The records in the dataset were converted into five classes; then, comprehensive evaluations were

Int. J. Environ. Res. Public Health 2019, 16, 599 7 of 21
performed on the data. In this section, detailed information on the experimental setup and resultsare presented.
3.1. Experimental Setups
Raw PSG signals in the database were divided into 30-s segments. Thus, PSG segments with3000 samples were used for each hypnogram value. In the experimental studies, the results wereevaluated using different PSG signals taken from both sleep databases. We have analyzed thedatabase using the following combinations of PSG signals: single-channel EOG, single-channelEEG, and single-channel EOG + single-channel EEG. Single-channel EOG channel signals containone horizontal EOG signal in the recordings. The single EEG consists of the Fpz–Cz channel signalproposed in the literature [12,46,53] for each record. For the single-channel EOG + single-channelEEG, one horizontal EOG and Fpz–Cz EEG signal was used for each recording. When these signalswere given as input to the CNN model, sample elimination was performed for the ambiguousscores (‘X’, ‘?’, so on). Additionally, no more filtering operations were performed, such as removingnoisy signals from a certain range of amplitude. The preprocessing operations on signals containthe standardization and the normalization of signals to the zero to one range. The entire datasetwas divided into three parts of 70%, 15%, and 15% for training, validation, and testing, respectively.Training and validation datasets were used to determine the layer parameters during the trainingphase of the model. The testing data was a new dataset that the model had not used or seen before.The test performance of the model was carried out on the trained model.
In order to ensure the consistency of the results, the random seed values were kept constant in thedata-splitting processes. For all the experimental results, the training phase of the 1D-CNN modelwas carried out for 100 epochs, and the same hyperparameters of the model were used for all of thedatasets. These hyperparameters are as follows: the Adam optimizer, the learning rate was 0.0001,and the decay was 0.003. Figure 3 illustrates the experimental steps.
Int. J. Environ. Res. Public Health 2019, 15, x 7 of 22
database using the following combinations of PSG signals: single-channel EOG, single-channel EEG, and single-channel EOG + single-channel EEG. Single-channel EOG channel signals contain one horizontal EOG signal in the recordings. The single EEG consists of the Fpz–Cz channel signal proposed in the literature [12,46,53] for each record. For the single-channel EOG + single-channel EEG, one horizontal EOG and Fpz–Cz EEG signal was used for each recording. When these signals were given as input to the CNN model, sample elimination was performed for the ambiguous scores (‘X’, ‘?’, so on). Additionally, no more filtering operations were performed, such as removing noisy signals from a certain range of amplitude. The preprocessing operations on signals contain the standardization and the normalization of signals to the zero to one range. The entire dataset was divided into three parts of 70%, 15%, and 15% for training, validation, and testing, respectively. Training and validation datasets were used to determine the layer parameters during the training phase of the model. The testing data was a new dataset that the model had not used or seen before. The test performance of the model was carried out on the trained model.
In order to ensure the consistency of the results, the random seed values were kept constant in the data-splitting processes. For all the experimental results, the training phase of the 1D-CNN model was carried out for 100 epochs, and the same hyperparameters of the model were used for all of the datasets. These hyperparameters are as follows: the Adam optimizer, the learning rate was 0.0001, and the decay was 0.003. Figure 3 illustrates the experimental steps.
0 50s 100s ...-500
0
500
0 3000-400
0
400
0 3000-400
0
400
0 30s-400
0
400
30s 30s 30s
Normalization and Standardize
1D-CNN Model
Raw
PSG
Sig
nals
Segm
enta
tion
Pre-
Proc
essi
ng
70%Train Data
15%Validation
Data
15%Test Data
Dat
a Sp
littin
g
Training Testing
Clas
sific
atio
n
Figure 3. An illustration of experimental steps.
Deep learning implementation was realized by using the Python programming language. Keras was used to create the model and collect the experimental results, and Tensorflow was used as the backend. For testing, a computer with Intel Core i7-7700HQ 2.81GHz CPU, 16 GB RAM, and a NVIDIA GeForce GTX 1070 8 GB graphics card was used. Experimental results were obtained for five different sleep classes. Definitions of these classes are given in Table 3.
Table 3. Notations used for sleep classes in this work.
Figure 3. An illustration of experimental steps.

Int. J. Environ. Res. Public Health 2019, 16, 599 8 of 21
Deep learning implementation was realized by using the Python programming language.Keras was used to create the model and collect the experimental results, and Tensorflow was used as thebackend. For testing, a computer with Intel Core i7-7700HQ 2.81GHz CPU, 16 GB RAM, and a NVIDIAGeForce GTX 1070 8 GB graphics card was used. Experimental results were obtained for five differentsleep classes. Definitions of these classes are given in Table 3.
Table 3. Notations used for sleep classes in this work.
Sleep Classes (C) Sleep Stages
6 Wake—S1—S2—S3—S4—REM5 Wake—S1—S2—SWS{S3 + S4}—REM4 Wake—{S1 + S2}—SWS{S3 + S4}—REM3 Wake—{S1 + S2 + S3 + S4}—REM2 Wake—Sleep {S1 + S2 + S3 + S4 + REM}
3.2. Results
The experimental results were collected separately for the sleep-edf and sleep-edfx datasets.In addition to comprehensive evaluations with these datasets, further experimental results werepresented according to PSG signals and two to six sleep classes. In these studies, we have usedstandard single-channel EEG and single channel EOG signals [22,23,32,54].
3.2.1. Results of Sleep-edf Database
Sleep-stage estimations were performed on eight subject records of the sleep-edf database usingdifferent PSG signals. The PSG signals that were used in this database are, single-channel EOG(one horizontal EOG), single-channel EEG (Fpz–Cz channel), and single-channel EOG + single-channelEEG, which is a combination of the single-channel EOG and single-channel EEG, respectively. There are15,188 samples in this database. The distribution of these samples for training, validation, and testingare 10,630 (70%), 2279 (15%), and 2279 (15%), respectively.
Using Single EOG Signal
In the sleep-edf dataset experiment, the proposed 1D-CNN model was trained for the automatedrecognition of sleep stages by only using the EOG channel of the subjects. The layer parameters andhyperparameters of the model remained unchanged for all two to six classes. Figure 4 shows theperformance graphs of the proposed 1D-CNN model during the training of each class.
As can be seen from the performance graphs, no overfitting problem occurred for all of the classes.The training and validation accuracy curves indicate positive learning. The highest recognition for theperformance was observed for the second class, and the lowest performance was received with thesixth class. The model for which each class is individually trained has been applied for the test data ofthese classes. These test sets consist of data that the model has never seen before. Table 4 presents theaccuracy values of the 1D-CNN model for each class in the training and testing stages.
Table 4. Performance values for sleep-edf data of the model for two to six classes using a singleelectrooculogram (EOG) signal.
Sleep Classes (C)Model Accuracy Rate (%)
Training Validation Testing
2 98.87 98.02 98.063 95.66 93.76 93.764 92.48 90.38 91.885 90.76 88.14 89.786 89.39 87.84 88.28

Int. J. Environ. Res. Public Health 2019, 16, 599 9 of 21Int. J. Environ. Res. Public Health 2019, 15, x 9 of 22
20 40 60 80 100
80
90
100
20 40 60 80 100
70
80
90
100
0 20 40 60 80 1000.4
60
80
100
20 40 60 80 100
60
80
100
20 40 60 80 100
60
80
100
00
20 40 60 80 100
70
80
90
100
2-class3-class4-class5-class6-class
00 0
Train-accVal-acc
Train-accVal-acc
Train-accVal-acc
Train-accVal-acc
Train-accVal-acc
Acc
urac
y (%
)
Epochs(a)
2-class
Acc
urac
y (%
)
Epochs
3-class
Acc
urac
y (%
)
Epochs
4-class
(b) (c)
Acc
urac
y (%
)
Epochs(d)
5-class
Acc
urac
y (%
)
Epochs(e)
6-class
Acc
urac
y (%
)
Epochs(f)
2-6 classes
Figure 4. Performance graphs of the proposed 1D-CNN model with the single EOG signal for the sleep-edf dataset: (a) two-class model, (b) three-class model, (c) four-class model, (d) five-class model, (e) six-class model, and (f) validation accuracy for the models with two to six classes.
The testing data had never been used during training. As can be seen in Table 4, the training and testing accuracy values are close to each other. Hence, it implies that the proposed model has good generalization ability. It can be seen from Table 4 that the highest recognition performance for both the training and testing phase was obtained for two classes, which contained two sleep stage classes. The model has provided 98.06% accuracy on the test data for this class. The lowest recognition rates were obtained for the six-class and five-class datasets. Figure 5 shows the confusion matrixes obtained for six-class and five-class test data.
Accuracy: 88.28%
98.36%1196
0.58%7
0.16%2
0.58%7
0.16%2
0.16%2
16.07%9
60.71%34
10.71%6
0.0%0
1.79%1
10.71%6
0.92%5
4.03%22
83.52%456
4.95%27
0.55%3
6.04%33
0.0%0
0.0%0
21.88%14
51.56%33
26.56%17
0.0%0
1.7%2
0.0%0
6.6%8
23.1%28
68.60%83
0.0%0
6.52%18
7.25%20
10.14%28
0.0%0
0.0%0
76.09%210
Target Class
Wake
S1
S2
S3
S4
REM
Out
put C
lass
Wake S1 S2 S3 S4 REM
(b)
Accuracy: 89.78%
97.87%1195
0.98%12
0.33%4
0.57%7
0.25%3
21.62%16
54.05%40
16.22%12
1.35%1
6.76%5
0.59%3
2.57%13
85.57%433
7.31%37
3.95%20
0.57%1
0.57%1
10.8%19
88.07%155
0.0%0
4.97%15
5.63%17
15.23%46
0.33%1
73.84%223
Wake
S1
S2
SWS
REM
Wake S1 S2 SWS REMTarget Class
Out
put C
lass
(a) Figure 5. Confusion matrix obtained using single-channel EOG input signals for the sleep-edf data for: (a) five-class test data and (b) six-class test data.
The values in the confusion matrix cells are the precision ratio and the number of samples. The values in the diagonal line represent the stages that are correctly recognized, and the values outside the diagonal region represent the incorrect recognition. For example, 1196 of the 1230 test data of the wake (W) stage were correctly recognized, while 34 were incorrectly classified into other stages. In Table 5, various performance evaluation parameters obtained from 2550 of the test data values of these classes are presented.
Figure 4. Performance graphs of the proposed 1D-CNN model with the single EOG signal for thesleep-edf dataset: (a) two-class model, (b) three-class model, (c) four-class model, (d) five-class model,(e) six-class model, and (f) validation accuracy for the models with two to six classes.
The testing data had never been used during training. As can be seen in Table 4, the training andtesting accuracy values are close to each other. Hence, it implies that the proposed model has goodgeneralization ability. It can be seen from Table 4 that the highest recognition performance for boththe training and testing phase was obtained for two classes, which contained two sleep stage classes.The model has provided 98.06% accuracy on the test data for this class. The lowest recognition rateswere obtained for the six-class and five-class datasets. Figure 5 shows the confusion matrixes obtainedfor six-class and five-class test data.
Int. J. Environ. Res. Public Health 2019, 15, x 9 of 22
20 40 60 80 100
80
90
100
20 40 60 80 100
70
80
90
100
0 20 40 60 80 1000.4
60
80
100
20 40 60 80 100
60
80
100
20 40 60 80 100
60
80
100
00
20 40 60 80 100
70
80
90
100
2-class3-class4-class5-class6-class
00 0
Train-accVal-acc
Train-accVal-acc
Train-accVal-acc
Train-accVal-acc
Train-accVal-acc
Acc
urac
y (%
)
Epochs(a)
2-class
Acc
urac
y (%
)
Epochs
3-class
Acc
urac
y (%
)
Epochs
4-class
(b) (c)
Acc
urac
y (%
)
Epochs(d)
5-class
Acc
urac
y (%
)
Epochs(e)
6-class
Acc
urac
y (%
)
Epochs(f)
2-6 classes
Figure 4. Performance graphs of the proposed 1D-CNN model with the single EOG signal for the sleep-edf dataset: (a) two-class model, (b) three-class model, (c) four-class model, (d) five-class model, (e) six-class model, and (f) validation accuracy for the models with two to six classes.
The testing data had never been used during training. As can be seen in Table 4, the training and testing accuracy values are close to each other. Hence, it implies that the proposed model has good generalization ability. It can be seen from Table 4 that the highest recognition performance for both the training and testing phase was obtained for two classes, which contained two sleep stage classes. The model has provided 98.06% accuracy on the test data for this class. The lowest recognition rates were obtained for the six-class and five-class datasets. Figure 5 shows the confusion matrixes obtained for six-class and five-class test data.
Accuracy: 88.28%
98.36%1196
0.58%7
0.16%2
0.58%7
0.16%2
0.16%2
16.07%9
60.71%34
10.71%6
0.0%0
1.79%1
10.71%6
0.92%5
4.03%22
83.52%456
4.95%27
0.55%3
6.04%33
0.0%0
0.0%0
21.88%14
51.56%33
26.56%17
0.0%0
1.7%2
0.0%0
6.6%8
23.1%28
68.60%83
0.0%0
6.52%18
7.25%20
10.14%28
0.0%0
0.0%0
76.09%210
Target Class
Wake
S1
S2
S3
S4
REM
Out
put C
lass
Wake S1 S2 S3 S4 REM
(b)
Accuracy: 89.78%
97.87%1195
0.98%12
0.33%4
0.57%7
0.25%3
21.62%16
54.05%40
16.22%12
1.35%1
6.76%5
0.59%3
2.57%13
85.57%433
7.31%37
3.95%20
0.57%1
0.57%1
10.8%19
88.07%155
0.0%0
4.97%15
5.63%17
15.23%46
0.33%1
73.84%223
Wake
S1
S2
SWS
REM
Wake S1 S2 SWS REMTarget Class
Out
put C
lass
(a) Figure 5. Confusion matrix obtained using single-channel EOG input signals for the sleep-edf data for: (a) five-class test data and (b) six-class test data.
The values in the confusion matrix cells are the precision ratio and the number of samples. The values in the diagonal line represent the stages that are correctly recognized, and the values outside the diagonal region represent the incorrect recognition. For example, 1196 of the 1230 test data of the wake (W) stage were correctly recognized, while 34 were incorrectly classified into other stages. In Table 5, various performance evaluation parameters obtained from 2550 of the test data values of these classes are presented.
Figure 5. Confusion matrix obtained using single-channel EOG input signals for the sleep-edf data for:(a) five-class test data and (b) six-class test data.
The values in the confusion matrix cells are the precision ratio and the number of samples.The values in the diagonal line represent the stages that are correctly recognized, and the valuesoutside the diagonal region represent the incorrect recognition. For example, 1196 of the 1230 test dataof the wake (W) stage were correctly recognized, while 34 were incorrectly classified into other stages.In Table 5, various performance evaluation parameters obtained from 2550 of the test data values ofthese classes are presented.

Int. J. Environ. Res. Public Health 2019, 16, 599 10 of 21
Table 5. Various performance values obtained for five-class and six-class test data using a sleep-edfdatabase with single-channel EOG.
Classes Sleep Stages Precision Sensitivity F1-Score Number of Data
5-class
Wake 0.98 0.97 0.98 1230S1 0.54 0.48 0.51 83S2 0.86 0.84 0.85 514
SWS 0.88 0.77 0.82 201REM 0.74 0.89 0.81 251
6-class
Wake 0.98 0.97 0.98 1230S1 0.61 0.41 0.49 83S2 0.84 0.89 0.86 514S3 0.52 0.35 0.42 96S4 0.69 0.78 0.73 106
REM 0.76 0.84 0.80 251
A sensitivity of 0.97 was obtained for the wake sleep stage. Since the majority of data belong tothis stage, the learning model showed a trend toward learning the data in this stage. The lowest rateof sensitivity was observed in the stage S1 as 0.48. The amount of data in stage S1 is less than others,so that the proposed model had difficulty in learning this stage. The five-class and six-class modelsachieved 89.78% and 88.28% accuracy rates, respectively.
Using Single-Channel EEG Signal
Few studies in the literature have obtained results using only one EEG channel from the PSGsignals. For this reason, performance evaluation of the model using the EEG signal of the Fpz–Czchannel is given for the sleep-edf data. The parameters and data (training, validation, and test) of the1D-CNN model for the single EOG signal remained unchanged, and the model was applied to theEEG signal. Figure 6 presents the training and validation accuracy graphs of the proposed model fortwo to six classes using the sleep-edf dataset. Compared to similar graphs obtained in Figure 4 forthe single-channel EOG, it can be seen that the training and validation curves in Figure 6 are closeto each other. The proposed model for this PSG signal did not show any overfitting or underfittingproblems during training, and the training performance is higher than the one obtained using EOGsignals. Table 6 shows the performance values of the model for training and testing with single-channelEEG signals.
Table 6. Performance values for the sleep-edf data of the model for two to six sleep classes usinga single electroencephalogram (EEG).
Sleep Classes (C)Model Accuracy Rate (%)
Training Validation Testing
2 98.93 98.63 98.333 96.03 94.60 94.204 92.92 90.86 91.395 92.07 90.25 90.836 90.01 88.32 89.51
For single-channel EEG signals, the model has captured the highest test accuracy rate as 98.33%for the two-class model, which consisted of only two sleep stages. The accuracy rate for the five-classmodel was 90.83%, and for the six-class model, it was 89.51%. Figure 7 shows the confusion matrixesobtained from the test data of the five-class and six-class datasets.

Int. J. Environ. Res. Public Health 2019, 16, 599 11 of 21Int. J. Environ. Res. Public Health 2019, 15, x 11 of 22
0 20 40 60 80 10070
80
90
100
0 20 40 60 80 10040
60
80
100
0 20 40 60 80 10040
60
80
100
0 20 40 60 80 10040
60
80
100
0 20 40 60 80 10040
60
80
100
0 20 40 60 80 10040
60
80
100
Train-accVal-acc
Train-accVal-acc
Train-accVal-acc
Train-accVal-acc
Train-accVal-acc
Acc
urac
y (%
)
Epochs(a)
2-class
Acc
urac
y (%
)
Epochs
3-class
Acc
urac
y (%
)
Epochs
4-class
(b) (c)
Acc
urac
y (%
)
Epochs(d)
5-class
Acc
urac
y (%
)
Epochs(e)
6-class
Acc
urac
y (%
)
Epochs(f)
2-6 classes
2-class3-class4-class5-class6-class
Figure 6. Performance graphs of the proposed 1D-CNN model with the single channel EOG signal for the sleep-edf dataset: (a) two-class model, (b) three-class model, (c) four-class model, (d) five-class model, (e) six-class model, and (f) validation accuracy for the models with two to six classes.
For single-channel EEG signals, the model has captured the highest test accuracy rate as 98.33% for the two-class model, which consisted of only two sleep stages. The accuracy rate for the five-class model was 90.83%, and for the six-class model, it was 89.51%. Figure 7 shows the confusion matrixes obtained from the test data of the five-class and six-class datasets.
Wake
S1
S2
SWS
REM
Wake S1 S2 SWS REM
Accuracy: 90.83%
Target Class
Out
put C
lass
(a)
98.43%1195
1.07%13
0.0%0
0.33%4
0.16%2
42.22%19
35.56%16
8.89%4
0.0%0
13.33%6
0.0%0
3.51%19
86.89%471
4.24%23
5.35%29
0.0%0
1.0%2
12.0%24
87.0%174
0.0%0
5.76%16
11.87%33
5.4%15
0.0%0
76.98%214
98.84%1192
0.91%11
0.08%1
0.08%1
0.0%0
0.08%1
41.67%30
34.72%25
6.94%5
2.78%2
0.0%0
13.89%10
0.36%2
3.1%17
85.77%470
4.38%24
0.18%1
6.2%34
0.0%0
1.09%1
25.0%23
59.78%55
14.13%13
0.0%0
0.0%0
0.0%0
2.78%3
12.04%13
85.19%92
0.0%0
2.37%6
11.46%29
4.74%12
0.0%0
0.0%0
81.42%206
Accuracy: 89.51%
Target Class
Wake
S1
S2
S3
S4
REM
Out
put C
lass
Wake S1 S2 S3 S4 REM
(b)
Figure 7. Confusion matrix obtained for single-channel EEG input signals of the sleep-edf data: (a) five-class test data and (b) six-class test data.
For wake stage, 98.4% accuracy was obtained for the five-class model, and 98.8% accuracy was obtained for the six-class model. In stage S1, 35.6% and 34.7% accuracy rates were observed for the five-class and six-class models, respectively. The accuracy rate for the five-class model of the REM stage was 4.4% lower than the six-class model. The detailed values of the evaluation parameters for these classes are given in Table 7.
Figure 6. Performance graphs of the proposed 1D-CNN model with the single channel EOG signalfor the sleep-edf dataset: (a) two-class model, (b) three-class model, (c) four-class model, (d) five-classmodel, (e) six-class model, and (f) validation accuracy for the models with two to six classes.
Int. J. Environ. Res. Public Health 2019, 15, x 11 of 22
0 20 40 60 80 10070
80
90
100
0 20 40 60 80 10040
60
80
100
0 20 40 60 80 10040
60
80
100
0 20 40 60 80 10040
60
80
100
0 20 40 60 80 10040
60
80
100
0 20 40 60 80 10040
60
80
100
Train-accVal-acc
Train-accVal-acc
Train-accVal-acc
Train-accVal-acc
Train-accVal-acc
Acc
urac
y (%
)
Epochs(a)
2-class
Acc
urac
y (%
)
Epochs
3-class
Acc
urac
y (%
)
Epochs
4-class
(b) (c)
Acc
urac
y (%
)
Epochs(d)
5-class
Acc
urac
y (%
)Epochs
(e)
6-class
Acc
urac
y (%
)
Epochs(f)
2-6 classes
2-class3-class4-class5-class6-class
Figure 6. Performance graphs of the proposed 1D-CNN model with the single channel EOG signal for the sleep-edf dataset: (a) two-class model, (b) three-class model, (c) four-class model, (d) five-class model, (e) six-class model, and (f) validation accuracy for the models with two to six classes.
For single-channel EEG signals, the model has captured the highest test accuracy rate as 98.33% for the two-class model, which consisted of only two sleep stages. The accuracy rate for the five-class model was 90.83%, and for the six-class model, it was 89.51%. Figure 7 shows the confusion matrixes obtained from the test data of the five-class and six-class datasets.
Wake
S1
S2
SWS
REM
Wake S1 S2 SWS REM
Accuracy: 90.83%
Target Class
Out
put C
lass
(a)
98.43%1195
1.07%13
0.0%0
0.33%4
0.16%2
42.22%19
35.56%16
8.89%4
0.0%0
13.33%6
0.0%0
3.51%19
86.89%471
4.24%23
5.35%29
0.0%0
1.0%2
12.0%24
87.0%174
0.0%0
5.76%16
11.87%33
5.4%15
0.0%0
76.98%214
98.84%1192
0.91%11
0.08%1
0.08%1
0.0%0
0.08%1
41.67%30
34.72%25
6.94%5
2.78%2
0.0%0
13.89%10
0.36%2
3.1%17
85.77%470
4.38%24
0.18%1
6.2%34
0.0%0
1.09%1
25.0%23
59.78%55
14.13%13
0.0%0
0.0%0
0.0%0
2.78%3
12.04%13
85.19%92
0.0%0
2.37%6
11.46%29
4.74%12
0.0%0
0.0%0
81.42%206
Accuracy: 89.51%
Target Class
Wake
S1
S2
S3
S4
REM
Out
put C
lass
Wake S1 S2 S3 S4 REM
(b)
Figure 7. Confusion matrix obtained for single-channel EEG input signals of the sleep-edf data: (a) five-class test data and (b) six-class test data.
For wake stage, 98.4% accuracy was obtained for the five-class model, and 98.8% accuracy was obtained for the six-class model. In stage S1, 35.6% and 34.7% accuracy rates were observed for the five-class and six-class models, respectively. The accuracy rate for the five-class model of the REM stage was 4.4% lower than the six-class model. The detailed values of the evaluation parameters for these classes are given in Table 7.
Figure 7. Confusion matrix obtained for single-channel EEG input signals of the sleep-edf data:(a) five-class test data and (b) six-class test data.
For wake stage, 98.4% accuracy was obtained for the five-class model, and 98.8% accuracy wasobtained for the six-class model. In stage S1, 35.6% and 34.7% accuracy rates were observed for thefive-class and six-class models, respectively. The accuracy rate for the five-class model of the REMstage was 4.4% lower than the six-class model. The detailed values of the evaluation parameters forthese classes are given in Table 7.

Int. J. Environ. Res. Public Health 2019, 16, 599 12 of 21
Table 7. The performance values obtained for the five-class and six-class test data using the sleep-edfdataset with a single-channel EEG signal. SWS: slow-wave sleep.
Classes Sleep Stages Precision Sensitivity F1-Score Amount of Data
5-class
Wake 0.98 0.97 0.98 1230S1 0.36 0.19 0.25 83S2 0.87 0.92 0.89 514
SWS 0.87 0.87 0.87 201REM 0.77 0.85 0.81 251
6-class
Wake 0.99 0.97 0.98 1230S1 0.35 0.30 0.32 83S2 0.86 0.91 0.89 514S3 0.60 0.58 0.59 95S4 0.85 0.87 0.86 106
REM 0.81 0.82 0.82 251
Using Single EOG + EEG Signals
The final experiment with the sleep-edf database contained a combination of EOG and EEGsignals, unlike the other studies in the literature. For this purpose, the EEG and Fpz–Cz channel EEGsignals from each instance of PSG signals were chosen as the inputs to the proposed model.
For these PSG signals, the performance of the model during the training phase increased comparedto the other signals (see Figure 8). There was a noticeable increase in the training performance of themodel, so the difference between the training and validation curves increased. Table 8 shows thetraining and testing performance values of the proposed model for all of the classes using the EOG+ EEG input signals. The accuracy value for the five-class test data was increased to 91.22%. For thesix-class test data, less than 90% accuracy was observed with the previous signals, but here, it increasedto 91.00% with PSG signals. The main reason for this may be the use of two different PSG signals inthe input layer of the model, which lead to more distinctive features for the classes.
Int. J. Environ. Res. Public Health 2019, 15, x 12 of 22
Table 7. The performance values obtained for the five-class and six-class test data using the sleep-edf dataset with a single-channel EEG signal. SWS: slow-wave sleep.
Classes Sleep Stages Precision Sensitivity F1-Score Amount of Data
5-class
Wake 0.98 0.97 0.98 1230 S1 0.36 0.19 0.25 83 S2 0.87 0.92 0.89 514
SWS 0.87 0.87 0.87 201 REM 0.77 0.85 0.81 251
6-class
Wake 0.99 0.97 0.98 1230 S1 0.35 0.30 0.32 83 S2 0.86 0.91 0.89 514 S3 0.60 0.58 0.59 95 S4 0.85 0.87 0.86 106
REM 0.81 0.82 0.82 251
Using Single EOG + EEG Signals
The final experiment with the sleep-edf database contained a combination of EOG and EEG signals, unlike the other studies in the literature. For this purpose, the EEG and Fpz–Cz channel EEG signals from each instance of PSG signals were chosen as the inputs to the proposed model.
0 20 40 60 80 10070
80
90
100
0 20 40 60 80 10060
70
80
90
100
0 20 40 60 80 10040
60
80
100
0 20 40 60 80 10040
60
80
100
Acc
urac
y (%
)
Epochs
2-class
(a)
Train-accVal-acc
Acc
urac
y (%
)
Epochs
3-class
(b)
Train-accVal-acc
(c)
Acc
urac
y (%
)
Epochs
5-class
(d)
Train-accVal-acc
Acc
urac
y (%
)
Epochs
6-class
(e)
Train-accVal-acc
0 20 40 60 80 10040
60
80
100
Acc
urac
y (%
)
Epochs
4-class
Train-accVal-acc
0 20 40 60 80 10060
70
80
90
100
2-class3-class4-class5-class6-class
Acc
urac
y (%
)
Epochs
2-6 classes
(f) Figure 8. Performance graphs of the proposed 1D-CNN model with a single-channel EOG+EEG signal for the sleep-edf dataset: (a) two-class model, (b) three-class model, (c) four-class model, (d) five-class model, (e) six-class model, and (f) validation accuracy for the models with two to six classes.
For these PSG signals, the performance of the model during the training phase increased compared to the other signals (see Figure 8). There was a noticeable increase in the training performance of the model, so the difference between the training and validation curves increased. Table 8 shows the training and testing performance values of the proposed model for all of the classes using the EOG + EEG input signals. The accuracy value for the five-class test data was increased to 91.22%. For the six-class test data, less than 90% accuracy was observed with the previous signals, but here, it increased to 91.00% with PSG signals. The main reason for this may be the use of two different PSG signals in the input layer of the model, which lead to more distinctive features for the classes.
Figure 8. Performance graphs of the proposed 1D-CNN model with a single-channel EOG+EEG signalfor the sleep-edf dataset: (a) two-class model, (b) three-class model, (c) four-class model, (d) five-classmodel, (e) six-class model, and (f) validation accuracy for the models with two to six classes.

Int. J. Environ. Res. Public Health 2019, 16, 599 13 of 21
Table 8. Performance values using sleep-edf data of the models featuring two to six-classes of sleepstages with a single-channel EEG + EOG signal.
Sleep Classes (C)Model Accuracy Rate (%)
Training Validation Testing
2 99.41 98.24 98.063 97.19 94.29 94.644 94.89 91.79 92.365 93.27 90.03 91.226 92.22 89.72 91.00
3.2.2. Results on Sleep-edfx Database
Sleep-edfx, which is an extended version of the sleep-edf database, contains sleep data for 61subjects. Experimental studies were carried out for three separate signals as single-channel EEG,single-channel EEG, and single-channel EEG + EOG using sleep-edfx data. The sleep-edfx databasecontains 127,512 samples. In the experimental studies, 70% (89,258) of the data was used for training,15% (approximately 19,127) of the data was used for validation, and the remaining 15% (19,127) of thedata was used for testing.
Single-Channel EOG
Training and testing of the 1D-CNN model were carried out using only one horizontal EOGchannel belonging to 61 instances. The same model layer parameters (used for the previous database)were used without any changes for this database also. Figure 9 shows the performance graphs of theproposed model obtained during the training phase with the EOG signal.
Int. J. Environ. Res. Public Health 2019, 15, x 14 of 22
Table 8. Performance values using sleep-edf data of the models featuring two to six-classes of sleep stages with a single-channel EEG + EOG signal.
Sleep Classes (C) Model Accuracy Rate (%)
Training Validation Testing 2 99.41 98.24 98.06 3 97.19 94.29 94.64 4 94.89 91.79 92.36 5 93.27 90.03 91.22 6 92.22 89.72 91.00
3.2.2. Results on Sleep-edfx Database
Sleep-edfx, which is an extended version of the sleep-edf database, contains sleep data for 61 subjects. Experimental studies were carried out for three separate signals as single-channel EEG, single-channel EEG, and single-channel EEG + EOG using sleep-edfx data. The sleep-edfx database contains 127,512 samples. In the experimental studies, 70% (89,258) of the data was used for training, 15% (approximately 19,127) of the data was used for validation, and the remaining 15% (19,127) of the data was used for testing.
Single-Channel EOG
Training and testing of the 1D-CNN model were carried out using only one horizontal EOG channel belonging to 61 instances. The same model layer parameters (used for the previous database) were used without any changes for this database also. Figure 9 shows the performance graphs of the proposed model obtained during the training phase with the EOG signal.
10 20 30 40 50 60 70 80 90 1000
75
80
85
90
95
100
Acc
urac
y (%
)
Epochs(a)
10 20 30 40 50 60 70 80 90 100
80
85
90
95
100
0
Training Accuracy Validation Accuracy
2-class3-class4-class5-class6-class
2-class3-class4-class5-class6-class
Acc
urac
y (%
)
Epochs(b)
Figure 9. Training performance graphs obtained for different classes when the proposed model used the single-channel EOG from the sleep-edfx database: (a) training accuracy and (b) validation accuracy.
The proposed model has obtained the highest training and validation accuracy values for the two-class experiments. The training and validation performances of the model for all the two-class, three-class, and four-class experiments were obtained over 90%. The detailed numerical values of the experiments are given in Table 9.
Table 9. Performance values for the sleep-edfx data of the models featuring two to six classes using single-channel EOG.
Sleep Classes (C) Model Accuracy Rate (%)
Training Validation Testing 2 98.28 97.03 97.13 3 94.45 93.60 93.35
Figure 9. Training performance graphs obtained for different classes when the proposed model usedthe single-channel EOG from the sleep-edfx database: (a) training accuracy and (b) validation accuracy.
The proposed model has obtained the highest training and validation accuracy values for thetwo-class experiments. The training and validation performances of the model for all the two-class,three-class, and four-class experiments were obtained over 90%. The detailed numerical values of theexperiments are given in Table 9.

Int. J. Environ. Res. Public Health 2019, 16, 599 14 of 21
Table 9. Performance values for the sleep-edfx data of the models featuring two to six classes usingsingle-channel EOG.
Sleep Classes (C)Model Accuracy Rate (%)
Training Validation Testing
2 98.28 97.03 97.133 94.45 93.60 93.354 91.42 90.29 90.195 89.86 89.02 88.756 87.79 87.43 87.08
The trained model achieved 97.13% performance for the two-class dataset when fed withthe unseen data. The lowest test performance of 87.08% was obtained for the six-class dataset,which contained the six different sleep stages. For this class, the values of the performance criteriawere obtained using the test data, which is given in Figure 10, in detail.
Int. J. Environ. Res. Public Health 2019, 15, x 15 of 22
4 91.42 90.29 90.19 5 89.86 89.02 88.75 6 87.79 87.43 87.08
The trained model achieved 97.13% performance for the two-class dataset when fed with the unseen data. The lowest test performance of 87.08% was obtained for the six-class dataset, which contained the six different sleep stages. For this class, the values of the performance criteria were obtained using the test data, which is given in Figure 10, in detail.
Wake S1 S2 S3 S4 REM0
20
40
60
80
1006-class Test Data
Sleep Stages
Perf
orm
ance
Val
ue
Precision (%)
Sensitivity (%)
F1-Score (%)
Figure 10. Graphs of performances obtained using the six-class testing data.
The highest values of the evaluation performance were obtained for the wake stage where the precision, sensitivity, and F1-score values were 97%, 98%, and 97% respectively. The S1 and S3 stages produced the lowest performance values. The precision value for stage S1 was 45%, and the sensitivity value for this stage was 30%. For the S3 stage, these values were calculated as 50% and 37%, respectively. The most critical factor for these low performance scores was the imbalance in the distribution of data in each stage. For example, there is a big difference in the distribution of the test data for the wake, S1, and S2 stages. In the test data, 11,257 samples belonged to the wake stage, while the data belonging to stages S1 and S2 included 707 and 799 samples, respectively.
Single-Channel EEG
The final experimental study for the sleep-edfx database was the use of the single-channel EEG signal (of the Fpz–Cz channel from the PSG signals). The single-channel EEG data was used to train the model. Figure 11 shows the performance graphs of the 1D-CNN model presented for a 100 epoch period. These graphs were generated for the training phase of all the classes using the single EEG database.
Figure 10. Graphs of performances obtained using the six-class testing data.
The highest values of the evaluation performance were obtained for the wake stage where theprecision, sensitivity, and F1-score values were 97%, 98%, and 97% respectively. The S1 and S3 stagesproduced the lowest performance values. The precision value for stage S1 was 45%, and the sensitivityvalue for this stage was 30%. For the S3 stage, these values were calculated as 50% and 37%, respectively.The most critical factor for these low performance scores was the imbalance in the distribution of datain each stage. For example, there is a big difference in the distribution of the test data for the wake, S1,and S2 stages. In the test data, 11,257 samples belonged to the wake stage, while the data belonging tostages S1 and S2 included 707 and 799 samples, respectively.
Single-Channel EEG
The final experimental study for the sleep-edfx database was the use of the single-channelEEG signal (of the Fpz–Cz channel from the PSG signals). The single-channel EEG data was usedto train the model. Figure 11 shows the performance graphs of the 1D-CNN model presented fora 100 epoch period. These graphs were generated for the training phase of all the classes using thesingle EEG database.

Int. J. Environ. Res. Public Health 2019, 16, 599 15 of 21Int. J. Environ. Res. Public Health 2019, 15, x 16 of 22
10 20 30 40 50 60 70 80 90 10070
75
80
85
90
95
100
10 20 30 40 50 60 70 80 90 10070
75
80
85
90
95
100
Acc
urac
y (%
)
Epochs(a)
Training Accuracy
2-class3-class4-class5-class6-class
Validation Accuracy
Acc
urac
y (%
)
Epochs(b)
2-class3-class4-class5-class6-class
Figure 11. Performance graphs obtained for the proposed model using sleep-edfx database with single-channel EEG: (a) training accuracy, and (b) validation accuracy.
When the performance graphs of the single-channel EEG experiments were examined, performance improvement could be observed for both the training and validation phases. The training performance for the two-class model reached 99.21%, while the validation accuracy increased to 98.09%. Similarly, an increase of around 2% was observed for the other classes. Table 10 shows the training and testing performances of the proposed model using the sleep-edfx database with a single EEG signal.
Table 10. Performance values achieved by the proposed models for two to six classes using the sleep-edfx database with a single-channel EEG signal.
Sleep Classes (C) Model Accuracy Rates (%)
Training Validation Testing 2 99.21 98.09 97.85 3 95.77 94.52 94.23 4 93.72 92.33 92.24 5 91.85 90.75 90.48 6 90.59 89.50 89.43
It can be seen from the test performances that the trained model showed a performance of more than 90% in all the other sets, except for the six-class set (Table 10). The accuracy rate of 87.08% with a single-channel EOG increased to 89.43% with the use of the EEG signal for the six-class dataset. Figure 12 shows the precision, sensitivity, and F1-score graphs belonging to the various sleep classes during testing class for the six-class dataset. Values of 99% precision and 98% sensitivity were obtained for the wake stage during the testing phase with single-channel EEG input. We have obtained 48% precision and 32% sensitivity for stage S1. The obtained results with this data are better than the ones using single-channel EOG data.
Figure 11. Performance graphs obtained for the proposed model using sleep-edfx database withsingle-channel EEG: (a) training accuracy, and (b) validation accuracy.
When the performance graphs of the single-channel EEG experiments were examined,performance improvement could be observed for both the training and validation phases. The trainingperformance for the two-class model reached 99.21%, while the validation accuracy increased to 98.09%.Similarly, an increase of around 2% was observed for the other classes. Table 10 shows the training andtesting performances of the proposed model using the sleep-edfx database with a single EEG signal.
Table 10. Performance values achieved by the proposed models for two to six classes using thesleep-edfx database with a single-channel EEG signal.
Sleep Classes (C)Model Accuracy Rates (%)
Training Validation Testing
2 99.21 98.09 97.853 95.77 94.52 94.234 93.72 92.33 92.245 91.85 90.75 90.486 90.59 89.50 89.43
It can be seen from the test performances that the trained model showed a performance of morethan 90% in all the other sets, except for the six-class set (Table 10). The accuracy rate of 87.08% witha single-channel EOG increased to 89.43% with the use of the EEG signal for the six-class dataset.Figure 12 shows the precision, sensitivity, and F1-score graphs belonging to the various sleep classesduring testing class for the six-class dataset. Values of 99% precision and 98% sensitivity were obtainedfor the wake stage during the testing phase with single-channel EEG input. We have obtained 48%precision and 32% sensitivity for stage S1. The obtained results with this data are better than the onesusing single-channel EOG data.

Int. J. Environ. Res. Public Health 2019, 16, 599 16 of 21Int. J. Environ. Res. Public Health 2019, 15, x 17 of 22
0
20
40
60
80
100 Precision (%)
Sensitivity (%)
F1-Score (%)
6-class Test Data
Sleep Stages
Perf
orm
ance
Val
ue
Wake S1 S2 S3 S4 REM
Figure 12. Graphs of performance measures for the six-class model during the testing phase with single-channel EEG signals obtained from the sleep-edfx database.
3.2.3. Summary of Results
In this study, two popular datasets—sleep-edf, and sleep-edfx—were used. Five different sleep classes (two to six) were created from these datasets. Comprehensive experimental results were presented using different PSG signals. In all of the experimental studies, only a single model was used without any change in the layer parameters. Thus, an effective end-to-end model was created without any manual feature extraction or selection procedure for sleep scoring. Table 11 presents the summary of results that was obtained for the various combinations of the used data and the sleep stage using the same CNN model.
Table 11. Summary of results obtained for various combinations of data used and sleep stages.
Database PSG Signals Accuracy Rates (%) Sleep Classes (C)
C = 2 C = 3 C = 4 C = 5 C = 6
Sleep-edf Single-channel EOG 98.06 93.76 91.88 89.77 88.28 Single-channel EEG 98.33 94.20 91.39 90.82 89.51
Single-channel EEG+EOG 98.06 94.64 92.36 91.22 91.00
Sleep-edfx Single-channel EOG 97.13 93.35 90.19 88.75 87.08 Single-channel EEG 97.85 94.23 92.24 90.48 89.43
Single-channel EEG+EOG 97.62 94.34 92.33 90.98 89.54
The highest recognition rate of 98.33% was obtained for the two-class (C = 2) dataset using single-channel EEG signals with the sleep-edf dataset. For the rest of the classes, the highest results were obtained when the EEG and EOG signals were used together. A recognition performance of 91.00% was achieved for the dataset with six classes. The highest accuracy for each class was obtained using the sleep-edfx database with the use of single-channel EEG data. The highest recognition rate for the six-class stages in this database was 89.43%.
4. Discussion
Many studies have been conducted on the sleep stage classification using sleep-edf and sleep-edfx datasets using machine-learning techniques, and so far, very few of them have used deep
Figure 12. Graphs of performance measures for the six-class model during the testing phase withsingle-channel EEG signals obtained from the sleep-edfx database.
3.2.3. Summary of Results
In this study, two popular datasets—sleep-edf, and sleep-edfx—were used. Five different sleepclasses (two to six) were created from these datasets. Comprehensive experimental results werepresented using different PSG signals. In all of the experimental studies, only a single model was usedwithout any change in the layer parameters. Thus, an effective end-to-end model was created withoutany manual feature extraction or selection procedure for sleep scoring. Table 11 presents the summaryof results that was obtained for the various combinations of the used data and the sleep stage usingthe same CNN model.
Table 11. Summary of results obtained for various combinations of data used and sleep stages.
Database PSG SignalsAccuracy Rates (%)
Sleep Classes (C)
C = 2 C = 3 C = 4 C = 5 C = 6
Sleep-edfSingle-channel EOG 98.06 93.76 91.88 89.77 88.28Single-channel EEG 98.33 94.20 91.39 90.82 89.51
Single-channel EEG + EOG 98.06 94.64 92.36 91.22 91.00
Sleep-edfxSingle-channel EOG 97.13 93.35 90.19 88.75 87.08Single-channel EEG 97.85 94.23 92.24 90.48 89.43
Single-channel EEG + EOG 97.62 94.34 92.33 90.98 89.54
The highest recognition rate of 98.33% was obtained for the two-class (C = 2) dataset usingsingle-channel EEG signals with the sleep-edf dataset. For the rest of the classes, the highest resultswere obtained when the EEG and EOG signals were used together. A recognition performance of91.00% was achieved for the dataset with six classes. The highest accuracy for each class was obtainedusing the sleep-edfx database with the use of single-channel EEG data. The highest recognition ratefor the six-class stages in this database was 89.43%.
4. Discussion
Many studies have been conducted on the sleep stage classification using sleep-edf and sleep-edfxdatasets using machine-learning techniques, and so far, very few of them have used deep learning

Int. J. Environ. Res. Public Health 2019, 16, 599 17 of 21
models. We have summarized these studies in two different tables. Table 12 presents the comparisonof various studies carried out on the classification of sleep stages using sleep-edfx data.
Table 12. Summary of automated sleep stage classification using the sleep-edfx dataset. CNN:convolutional neural network, DWT: discrete wavelet transform, SVM: support vector machine.
StudyNumber ofChannel(s)/
Signals
Number ofSamples Method
Accuracy Rates (%)
Sleep Classes (C)
C = 2 C = 3 C = 4 C = 5 C = 6
Ref. [25] 1 EEG 126,699 MSFE + MSP + SVM - - - 93.8 -Ref. [23] 1 EEG 54,587 DWT + SVM - - - - 91.7Ref. [29] 1 EEG 106,376 DWT + RF - 93.9 92.3 91.5 90.5Ref. [28] 2 EEGs 59,316 SM + DT - - - 78.85 -Ref. [46] 1 EEG 41950 CNN + BLSTM - - - 82.00 -Proposed 1 EEG 127,512 1D-CNN 97.85 94.23 92.24 90.48 89.43Proposed 1 EOG 127,512 1D-CNN 97.13 93.35 90.19 88.75 87.08Proposed 1 EEG + 1 EOG 127,512 1D-CNN 97.62 94.34 92.33 90.98 89.54
In this study, we have used 127,512 samples of sleep-stage signals obtained from the sleep-edfxdataset. Our accuracies that were obtained by using single-channel EEG + EOG data for two to sixsleep classes were 97.62%, 94.34%, 92.33%, 90.98%, and 89.54%, respectively. The accuracy rates thatwere obtained using EEG + EOG signals were marginally better than the single-channel EEG andsingle-channel EOG signals.
Table 13 presents a summary of the automated classification of sleep stages using the sleep-edfdatabase. In this study, we used 15,188 samples of sleep-stage signals from the sleep-edfx dataset.Our accuracies that were obtained by using single-channel EEG data for two to six sleep classes were98.06%, 94.64%, 92.36%, 91.22%, and 91.00%, respectively. The accuracy rates that were obtained usingEEG signals were marginally better than the EOG signals.
Table 13. Summary of works conducted on the automated classification of sleep classes using thesleep-edf dataset.
StudyNumber ofChannel(s)/
Signals
Number ofSamples Method
Accuracy Rates (%)
Sleep Classes (C)
C = 2 C = 3 C = 4 C = 5 C = 6
Ref. [25] 1 EEG 14,995 MSFE + MSP + SVM - - - 93.8 -Ref. [32] 2 EEGs - PCA - - - - 69.98Ref. [21] 1 EEG 15,188 EEMD + RUSBoost 98.15 94.23 92.66 83.49 88.07
Ref. [55] 1 EEG 15,188 CEEMDAN +Bagging 99.48 94.10 92.14 90.69 86.89
Ref. [22] 1 EEG 14,963 (VG-HVG) + SVM 97.90 92.6 89.3 88.9 87.5Ref. [23] 1 EEG 15,188 DWT + SVM 98.24 94.10 92.89 91.02 90.26Ref. [23] 1 EOG 15,188 DWT + SVM - - - 92.60 91.70Ref. [7] 1 -EEG 15,139 Wavelet filter + SVM 97.8 93.5 90.7 89.9 89.5
Proposed 1 EEG 15,188 1D-CNN 98.33 94.20 91.39 90.82 89.51Proposed 1 EOG 15,188 1D-CNN 98.06 93.76 91.88 89.77 88.28Proposed 1 EEG + 1 EOG 15,188 1D-CNN 98.06 94.64 92.36 91.22 91.00
As can be seen from the comparison tables (Tables 12 and 13) that the number of sleep-edfxdataset samples differed from those of previous studies. There is no detailed information in thesestudies about this data elimination. Differently, we have used the highest number of samples for thisdatabase (127,512). Moreover, few of these methods have been evaluated only for five or six classes.The results show that the proposed method provided excellent performance for two to six classes onboth the datasets. In addition, most of the other studies used handcrafted feature extraction/selection

Int. J. Environ. Res. Public Health 2019, 16, 599 18 of 21
operations and shallow classifiers. From this perspective, the proposed model differs from the rest,and provides good potential as a complete end-to-end structure.
The advantages of the proposed study are given below:
• The proposed model is tested using two popular datasets for two to six sleep classes.• With a single model, without changing any layer or hyperparameter values, the detection
performance is significantly improved for five classes (two to six sleep classes) using differentPSG signals of both datasets.
• A complete end-to-end recognition structure is developed without the need for any manualfeature extraction stages.
The main disadvantages of the proposed classification system are as follows:
• Performance regarding distinguishing a few stages (especially S1) needs to be improved.One solution could be the use of more data in each stage.
• Elimination of noise from the PSG signals is a challenging task.
In future studies, the proposed model will be tested using different sleep databases. In this study,we have evaluated the performance of the model based on signal-level criteria. We will use patient-levelcriteria to evaluate the performances of the model for the future works. Furthermore, it increasing therecognition performance by using different deep learning approaches such as a combination of CNNand LSTM can be a further aim.
5. Conclusions
In this study, a 19-layer 1D-CNN model is proposed for the classification of sleep stages.This model has an end-to-end complete architecture, and does not require separated featureextraction/selection and classification stages. The application of this model produced high recognitionperformance on different sleep classes when popular PSG input signals such as EEG and EOG are used.For the evaluations, two popular public databases for the automated sleep stage classification are used.In the sleep-edf database, there are 15188 samples of six sleep stages. The second database sleep-edfxcontains 127512 samples. One major difference between this study and previous studies is the numberof used samples, which has not decreased too much with the preprocessing steps. Performancecomparisons using single-channel EEG, single-channel EOG, and a combination of EEG and EOGsignals are given. These results revealed that the proposed model achieved the highest classificationaccuracies for two to six sleep classes as 98.06%, 94.64%, 92.36%, 91.22%, and 91.00% respectively.In the future, the model will be employed on the detection of other sleep-related abnormalities.The development of such fully automatic recognition systems could replace the task of traditionalerror-prone manual expert inspection of large-scale PSG signals.
Author Contributions: The paper was a collaboration among all the authors. Conceptualization, O.Y., U.B.B.,and U.R.A.; methodology, O.Y., U.R.A; software, O.Y.; validation, O.Y., U.R.A; formal analysis, U.R.A; investigation,O.Y., U.B.B., and U.R.A.; resources, O.Y., U.R.A.; data curation, O.Y., and U.B.B.; writing—original draftpreparation, O.Y.; writing—review and editing, O.Y., U.B.B., and U.R.A.; visualization, O.Y.; supervision, U.R.A.
Funding: This research received no external funding.
Conflicts of Interest: The authors declare no conflict of interest. The funders had no role in the design of thestudy; in the collection, analyses, or interpretation of data; in the writing of the manuscript, or in the decision topublish the results.
References
1. Panossian, L.A.; Avidan, A.Y. Review of Sleep Disorders. Med. Clin. N. Am. 2009, 93, 407–425. [CrossRef][PubMed]
2. Hassan, A.R.; Hassan Bhuiyan, M.I. Automatic sleep scoring using statistical features in the EMD domainand ensemble methods. Biocybern. Biomed. Eng. 2016. [CrossRef]

Int. J. Environ. Res. Public Health 2019, 16, 599 19 of 21
3. Alickovic, E.; Subasi, A. Ensemble SVM method for automatic sleep stage classification. IEEE Trans.Instrum. Meas. 2018. [CrossRef]
4. Rodríguez-Sotelo, J.L.; Osorio-Forero, A.; Jiménez-Rodríguez, A.; Cuesta-Frau, D.; Cirugeda-Roldán, E.;Peluffo, D. Automatic sleep stages classification using EEG entropy features and unsupervised patternanalysis techniques. Entropy 2014. [CrossRef]
5. Rechtschaffen, A.; Kales, A. A Manual of Standardized Terminology, Techniques and Scoring Systems for SleepStages of Human Subjects; U.G.P. Office, Public Health Service: Washington, DC, USA, 1968.
6. Iber, C.; Ancoli-Israel, S.; Chesson, A.L.; Quan, S.F. The AASM Manual for the Scoring of Sleep and AssociatedEvents: Rules, Terminology and Technical Specification; American Academy of Sleep Medicine: Westchester, NY,USA, 2007.
7. Sharma, M.; Goyal, D.; Achuth, P.V.; Acharya, U.R. An accurate sleep stages classification system usinga new class of optimally time-frequency localized three-band wavelet filter bank. Comput. Biol. Med. 2018.[CrossRef] [PubMed]
8. Hassan, A.R.; Subasi, A. A decision support system for automated identification of sleep stages fromsingle-channel EEG signals. Knowl.-Based Syst. 2017. [CrossRef]
9. Huang, C.S.; Lin, C.L.; Ko, L.W.; Liu, S.Y.; Su, T.P.; Lin, C.T. Knowledge-based identification of sleep stagesbased on two forehead electroencephalogram channels. Front. Neurosci. 2014. [CrossRef]
10. Acharya, U.R.; Bhat, S.; Faust, O.; Adeli, H.; Chua, E.C.P.; Lim, W.J.E.; Koh, J.E.W. Nonlinear dynamicsmeasures for automated EEG-based sleep stage detection. Eur. Neurol. 2015, 74, 268–287. [CrossRef]
11. Cogan, D.; Birjandtalab, J.; Nourani, M.; Harvey, J.; Nagaraddi, V. Multi-Biosignal Analysis for EpilepticSeizure Monitoring. Int. J. Neural Syst. 2017. [CrossRef]
12. Tsinalis, O.; Matthews, P.M.; Guo, Y. Automatic Sleep Stage Scoring Using Time-Frequency Analysis andStacked Sparse Autoencoders. Ann. Biomed. Eng. 2016. [CrossRef]
13. Acharya, U.R.; Hagiwara, Y.; Adeli, H. Automated seizure prediction. Epilepsy Behav. 2018, 88, 251–261.[CrossRef] [PubMed]
14. Ronzhina, M.; Janoušek, O.; Kolárová, J.; Nováková, M.; Honzík, P.; Provazník, I. Sleep scoring using artificialneural networks. Sleep Med. Rev. 2012, 16, 251–263. [CrossRef] [PubMed]
15. Sen, B.; Peker, M.; Çavusoglu, A.; Çelebi, F.V. A comparative study on classification of sleep stage based onEEG signals using feature selection and classification algorithms. J. Med. Syst. 2014. [CrossRef] [PubMed]
16. Sereshkeh, A.R.; Trott, R.; Bricout, A.; Chau, T. Online EEG classification of covert speech for brain–computerinterfacing. Int. J. Neural Syst. 2017. [CrossRef] [PubMed]
17. Tzimourta, K.D.; Tsilimbaris, A.; Tzioukalia, K.; Tzallas, A.T.; Tsipouras, M.G.; Astrakas, L.G.; Giannakeas, N.EEG-based automatic sleep stage classification. Biomed. J. Sci. Technol. Res. 2018, 7, 1–6.
18. Dereymaeker, A.; Pillay, K.; Vervisch, J.; Van Huffel, S.; Naulaers, G.; Jansen, K.; De Vos, M. An AutomatedQuiet Sleep Detection Approach in Preterm Infants as a Gateway to Assess Brain Maturation. Int. J.Neural Syst. 2017. [CrossRef] [PubMed]
19. Pławiak, P. Novel genetic ensembles of classifiers applied to myocardium dysfunction recognition based onECG signals. Swarm Evol. Comput. 2018. [CrossRef]
20. Acharya, U.R.; Chua, E.C.-P.; Chua, K.C.; MIin, L.C.; Tamura, T. Analysis and automatic identification ofsleep stages using higher order spectra. Int. J. Neural Syst. 2010. [CrossRef] [PubMed]
21. Hassan, A.R.; Bhuiyan, M.I.H. Automated identification of sleep states from EEG signals by means ofensemble empirical mode decomposition and random under sampling boosting. Comput. Methods ProgramsBiomed. 2017. [CrossRef] [PubMed]
22. Zhu, G.; Li, Y.; Wen, P.P. Analysis and classification of sleep stages based on difference visibility graphs froma single-channel EEG signal. IEEE J. Biomed. Health Inform. 2014. [CrossRef] [PubMed]
23. Rahman, M.M.; Bhuiyan, M.I.H.; Hassan, A.R. Sleep stage classification using single-channel EOG.Comput. Biol. Med. 2018. [CrossRef] [PubMed]
24. Bajaj, V.; Pachori, R.B. Automatic classification of sleep stages based on the time-frequency image of EEGsignals. Comput. Methods Programs Biomed. 2013. [CrossRef] [PubMed]
25. Nakamura, T.; Adjei, T.; Alqurashi, Y.; Looney, D.; Morrell, M.J.; Mandic, D.P. Complexity science for sleepstage classification from EEG. In Proceedings of the International Joint Conference on Neural Networks,Anchorage, AK, USA, 14–19 May 2017.

Int. J. Environ. Res. Public Health 2019, 16, 599 20 of 21
26. Acharya, U.R.; Faust, O.; Kannathal, N.; Chua, T.; Laxminarayan, S. Non-linear analysis of EEG signals atvarious sleep stages. Comput. Methods Programs Biomed. 2005. [CrossRef] [PubMed]
27. Fell, J.; Röschke, J.; Mann, K.; Schäffner, C. Discrimination of sleep stages: A comparison between spectraland nonlinear EEG measures. Electroencephalogr. Clin. Neurophysiol. 1996. [CrossRef]
28. Imtiaz, S.A.; Rodriguez-Villegas, E. Automatic sleep staging using class machine-controlled decision trees.In Proceedings of the 2015 37th Annual International Conference of the IEEE Engineering in Medicine andBiology Society (EMBC), Milan, Italy, 25–29 August 2015. [CrossRef]
29. da Silveira, T.L.T.; Kozakevicius, A.J.; Rodrigues, C.R. Single-channel EEG sleep stage classification basedon a streamlined set of statistical features in wavelet domain. Med. Biol. Eng. Comput. 2017. [CrossRef][PubMed]
30. Memar, P.; Faradji, F. A Novel Multi-Class EEG-Based Sleep Stage Classification System. IEEE Trans. NeuralSyst. Rehabil. Eng. 2018. [CrossRef] [PubMed]
31. Yulita, I.N.; Fanany, M.I.; Arymurthy, A.M. Fast convolutional method for automatic sleep stage classification.Healthc. Inform. Res. 2018. [CrossRef]
32. Vural, C.; Yildiz, M. Determination of sleep stage separation ability of features extracted from eeg signalsusing principle component analysis. J. Med. Syst. 2010. [CrossRef]
33. Lecun, Y.; Bengio, Y.; Hinton, G. Deep learning. Nature 2015. [CrossRef]34. Goodfellow, I.; Yoshua, B.; Aaron, C. Deep Learning. Deep Learn. 2016, 785. [CrossRef]35. Schmidhuber, J. Deep Learning in neural networks: An overview. Neural Netw. 2015. [CrossRef] [PubMed]36. Talo, M.; Baloglu, U.B.; Yıldırım, Ö.; Acharya, U.R. Application of deep transfer learning for automated
brain abnormality classification using MR images. Cogn. Syst. Res. 2019, 54, 176–188. [CrossRef]37. Faust, O.; Hagiwara, Y.; Hong, T.J.; Lih, S.; Acharya, R. Deep learning for healthcare applications based on
physiological signals: A review. Comput. Methods Programs Biomed. 2018. [CrossRef] [PubMed]38. Yildirim, Ö. A novel wavelet sequence based on deep bidirectional LSTM network model for ECG signal
classification. Comput. Biol. Med. 2018. [CrossRef] [PubMed]39. Acharya, U.R.; Oh, S.L.; Hagiwara, Y.; Tan, J.H.; Adam, M.; Gertych, A.; Tan, R.S. A deep convolutional
neural network model to classify heartbeats. Comput. Biol. Med. 2017, 89, 389–396. [CrossRef] [PubMed]40. Yıldırım, Ö.; Pławiak, P.; Tan, R.S.; Acharya, U.R. Arrhythmia detection using deep convolutional neural
network with long duration ECG signals. Comput. Biol. Med. 2018, 102, 411–420. [CrossRef] [PubMed]41. Oh, S.L.; Ng, E.Y.K.; Tan, R.S.; Acharya, U.R. Automated diagnosis of arrhythmia using combination of CNN
and LSTM techniques with variable length heart beats. Comput. Biol. Med. 2018, 102, 278–287. [CrossRef]42. Oh, S.L.; Hagiwara, Y.; Raghavendra, U.; Yuvaraj, R.; Arunkumar, N.; Murugappan, M.; Acharya, U.R.
A deep learning approach for Parkinson’s disease diagnosis from EEG signals. Neural Comput. Appl. 2018.[CrossRef]
43. Acharya, U.R.; Oh, S.L.; Hagiwara, Y.; Tan, J.H.; Adeli, H. Deep convolutional neural network for theautomated detection and diagnosis of seizure using EEG signals. Comput. Biol. Med. 2017, 100, 270–278.[CrossRef]
44. Yıldırım, Ö.; Baloglu, U.B.; Acharya, U.R. A deep convolutional neural network model for automatedidentification of abnormal EEG signals. Neural Comput. Appl. 2018. [CrossRef]
45. Antoniades, A.; Spyrou, L.; Martin-Lopez, D.; Valentin, A.; Alarcon, G.; Sanei, S.; Took, C.C. Deep NeuralArchitectures for Mapping Scalp to Intracranial EEG. Int. J. Neural Syst. 2018. [CrossRef] [PubMed]
46. Supratak, A.; Dong, H.; Wu, C.; Guo, Y. DeepSleepNet: A model for automatic sleep stage scoring based onraw single-channel EEG. IEEE Trans. Neural Syst. Rehabil. Eng. 2017. [CrossRef] [PubMed]
47. Tripathy, R.K.; Rajendra Acharya, U. Use of features from RR-time series and EEG signals for automatedclassification of sleep stages in deep neural network framework. Biocybern. Biomed. Eng. 2018. [CrossRef]
48. Chambon, S.; Galtier, M.N.; Arnal, P.J.; Wainrib, G.; Gramfort, A. A Deep Learning Architecture for TemporalSleep Stage Classification Using Multivariate and Multimodal Time Series. IEEE Trans. Neural Syst. Rehabil.Eng. 2018. [CrossRef] [PubMed]
49. Michielli, N.; Acharya, U.R.; Molinari, F. Cascaded LSTM recurrent neural network for automated sleepstage classification using single-channel EEG signals. Comput. Biol. Med. 2019. [CrossRef] [PubMed]
50. PhysioNet, The Sleep-Edf Database. Available online: https://www.physionet.org/physiobank/database/sleep-edf/ (accessed on 19 November 2018).

Int. J. Environ. Res. Public Health 2019, 16, 599 21 of 21
51. PhysioNet, the Sleep-Edf (Expanded) Database. Available online: http://www.physionet.org/physiobank/database/sleep-edfx/ (accessed on 19 November 2018).
52. Krizhevsky, A.; Sutskever, I.; Hinton55, G.E. ImageNet Classification with Deep Convolutional NeuralNetworks. Adv. Neural Inf. Process. Syst. 2012. [CrossRef]
53. Doroshenkov, L.G.; Konyshev, V.A.; Selishchev, S.V. Classification of human sleep stages based on EEGprocessing using hidden Markov models. Biomed. Eng. 2007. [CrossRef]
54. Berthomier, C.; Drouot, X.; Herman-Stoïca, M.; Berthomier, P.; Prado, J.; Bokar-Thire, D.; Benoit, O.;Mattout, J.; D’Ortho, M.P. Automatic analysis of single-channel sleep EEG: Validation in healthy individuals.Sleep 2007. [CrossRef]
55. Hassan, A.R.; Bhuiyan, M.I.H. Computer-aided sleep staging using Complete Ensemble Empirical ModeDecomposition with Adaptive Noise and bootstrap aggregating. Biomed. Signal Process. Control 2016.[CrossRef]
© 2019 by the authors. Licensee MDPI, Basel, Switzerland. This article is an open accessarticle distributed under the terms and conditions of the Creative Commons Attribution(CC BY) license (http://creativecommons.org/licenses/by/4.0/).