SLEEPNET: Automated Sleep Staging System via … : Automated Sleep Staging System via Deep Learning...
17
SLEEPNET: Automated Sleep Staging System via Deep Learning Siddharth Biswal [email protected] Georgia Institute of Technology Joshua Kulas [email protected] Georgia Institute of Technology Haoqi Sun [email protected] Nanyang Technological University Balaji Goparaju [email protected] Massachusetts General Hospital M Brandon Westover [email protected] Massachusetts General Hospital Matt T Bianchi [email protected] Massachusetts General Hospital Jimeng Sun [email protected] Georgia Institute of Technology Abstract Sleep disorders, such as sleep apnea, parasomnias, and hypersomnia, affect 50-70 million adults in the United States (Hillman et al., 2006). Overnight polysomnography (PSG), including brain monitoring using electroencephalography (EEG), is a central component of the diagnostic evaluation for sleep disorders. While PSG is conventionally performed by trained technologists, the recent rise of powerful neural network learning algorithms combined with large physiological datasets offers the possibility of automation, potentially making expert-level sleep analysis more widely available. We propose SLEEPNET (Sleep EEG neural network), a deployed annotation tool for sleep staging. SLEEPNET uses a deep recurrent neural network trained on the largest sleep physiology database assembled to date, consisting of PSGs from over 10,000 patients from the Massachusetts General Hospital (MGH) Sleep Laboratory. SLEEPNET achieves human-level annotation performance on an independent test set of 1,000 EEGs, with an average accuracy of 85.76% and algorithm-expert inter-rater agreement (IRA) of κ = 79.46%, comparable to expert-expert IRA. Figure 1: Web interface of SLEEPNET. In top-panel 1 and 2 we plot the raw EEG data the corresponding spectrogram. Below them, we show the ground truth (staging performed by a clinical expert) and SLEEPNET predicted labels and algorithm’s confidence (red means low confidence while green means high confidence). On the right hand-side is a panel showing sleep related summary statistics. 1 arXiv:1707.08262v1 [cs.LG] 26 Jul 2017
Transcript of SLEEPNET: Automated Sleep Staging System via … : Automated Sleep Staging System via Deep Learning...

SLEEPNET: Automated Sleep Staging System via Deep Learning
Siddharth Biswal [email protected] Institute of Technology
Joshua Kulas [email protected] Institute of Technology
Haoqi Sun [email protected] Technological University
Balaji Goparaju [email protected] General Hospital
M Brandon Westover [email protected] General Hospital
Matt T Bianchi [email protected] General Hospital
Jimeng Sun [email protected] Institute of Technology
AbstractSleep disorders, such as sleep apnea, parasomnias, and hypersomnia, affect 50-70 million adults
in the United States (Hillman et al., 2006). Overnight polysomnography (PSG), including brainmonitoring using electroencephalography (EEG), is a central component of the diagnostic evaluationfor sleep disorders. While PSG is conventionally performed by trained technologists, the recent riseof powerful neural network learning algorithms combined with large physiological datasets offersthe possibility of automation, potentially making expert-level sleep analysis more widely available.
We propose SLEEPNET (Sleep EEG neural network), a deployed annotation tool for sleep staging.SLEEPNET uses a deep recurrent neural network trained on the largest sleep physiology databaseassembled to date, consisting of PSGs from over 10,000 patients from the Massachusetts GeneralHospital (MGH) Sleep Laboratory.
SLEEPNET achieves human-level annotation performance on an independent test set of 1,000EEGs, with an average accuracy of 85.76% and algorithm-expert inter-rater agreement (IRA) ofκ = 79.46%, comparable to expert-expert IRA.
Figure 1: Web interface of SLEEPNET. In top-panel 1 and 2 we plot the raw EEG data the correspondingspectrogram. Below them, we show the ground truth (staging performed by a clinical expert) andSLEEPNET predicted labels and algorithm’s confidence (red means low confidence while green meanshigh confidence). On the right hand-side is a panel showing sleep related summary statistics.
1
arX
iv:1
707.
0826
2v1
[cs
.LG
] 2
6 Ju
l 201
7

1. Introduction
Sleep disorders including sleep apnea are a significant health concern in the US and throughout theworld. An estimated 50-70 million people in the United States currently suffer from sleep relateddisorders(Hillman et al., 2006). The central diagnostic tool in the evaluation of sleep apnea isthe overnight sleep study, during which several physiological signals are recorded, including theelectroencephalogram (EEG); the overall recording is termed as polysomnogram (PSG). A centralpart of analyzing an overnight PSG is characterizing the patient’s sleeping pattern based upon visualscoring of the EEG.
Manual scoring carries limitations of inter-rater reliability and time demands of sleep technologists.An 8-hour PSG study can take over one hour of technologist’s time to generate complete sleep report.Much of that time is spent on manual annotation. Automation could alleviate those manual efforts ifperformance was sufficiently accurate to assist or even supplant manual staging. A major challengein automation is the vast heterogeneity observed in EEG time series data obtained during PSG.Theoretically, two approaches could be attempted to overcome this heterogeneity: either createmultiple algorithms and apply them to clinically defined sub-populations (by age, sex, sleep disorder,medication, etc) expected to have distinct EEG patterns, or train a single powerful algorithm ona large data set of PSGs that captures the heterogeneity across patients while still maintainingperformance accuracy. We undertook the latter challenge using a training and testing set of over10K subjects, chosen without regard to age, sex, sleep disorder, or treatment modality (3.2 TB rawEEG data). In this way, the clinical dataset in this work is large and heterogeneous, two orders ofmagnitudes larger than in previous studies.
In recent years deep neural networks have achieved impressive performance in several challengingreal-world tasks that were previously the exclusive domain of human experts including the ones inmedical fields Esteva et al. (2017); Gulshan et al. (2016). Availability of large amounts of data tolearn complex data distributions is a key reason for the success of neural networks. Most publishedwork to date comprise proof of concept research projects and limited effort has been devoted toactual deployment of deep neural networks into clinical practice.
In this paper, we propose a specialized clinical decision support tool, SLEEPNET, for automatedsleep-wake staging. SLEEPNET applies deep neural network modeling on EEG signal features derivedfrom routine clinical PSG data. The deployed algorithm presents the algorithm’s inferences along withthe raw EEG data and automatically calculates sleep quality statistics in an interactive web interfacefor clinicians and researchers. We experiment with many different variations of the algorithm andinput features. The best performing instance of SLEEPNET uses expert-defined features to representeach 30-sec interval and learns to annotate EEG using a recurrent neural network (RNN). To measureperformance of SLEEPNET, we compare automated staging results with the de facto gold standarddefined by sleep technologists’ manual annotations. Inter-rater agreement (IRA) for sleep staging(in terms of Cohen’s Kappa) between human experts is approximately 65-75%(Danker-hopfe et al.,2009). In this study, SLEEPNET achieves an expert-algorithm Kappa value of 79%, with an overallaccuracy of 86%, comparable to human-level scoring performance.
The main contributions of this work are as follows:
• We propose an end-to-end deep neural network, SLEEPNET, that learns to annotate sleep stagesbased on a large amount of PSG data. This is a novel deep neural network which can be extendedto other types of EEG annotation and classification tasks.
• We have evaluated our proposed SLEEPNET on 10,000 overnight PSGs containing about eighthours of data per patient (9,000 for training and 1,000 for testing). This is so far the largestevaluation on an EEG classification problem.
• We have deployed SLEEPNET at Massachusetts General Hospital (MGH) and have performedinitial quantitative and qualitative evaluations of the deployed model, which confirm the clinicaland research value of the proposed system.
2

After discussing the previous approaches to EEG classification and deep neural networks in Section2, we describe training and deployment of our proposed SLEEPNET system in Section 3. We presentexperiments evaluating the performance of SLEEPNET with both qualitative and quantitative evaluationin Section 4. In Section 5, we also present case studies of SLEEPNET deployed in two clinicallaboratories at MGH and conclude the work with discussion on future directions in Section 6.
2. Related work
EEG classification: Much of the work on EEG classification has focused on the problems of seizureprediction and detection, and brain computer interfaces (Mirowski et al., 2008; Shoeb and Guttag,2010). These efforts have employed a wide variety of machine learning methods (Subasi, 2007;Garrett et al., 2003; Mormann et al., 2007). Emphasis on feature engineering guided by physiologicalinsights is a common theme in this work.
Machine learning approaches for sleep stage annotation in EEG signals have been also previouslyproposed (Berthomier et al., 2007; Anderer et al., 2010; Fraiwan et al., 2010). Some of these haveapplied neural networks (Schaltenbrand et al., 1996). Commercial software has also been developedfor automatic sleep stage scoring (e.g. ZMachine R©) and evaluated in previous studies (Wang et al.,2015). However, most prior studies involve small numbers of subjects, usually <100. The largeststudy to date involved 590 recordings, thus these studies may not adequately address variabilitybetween subjects (Anderer et al., 2005). The small study datasets may not contain sufficient varietyto ensure generalization to broader populations.
Deep neural networks for healthcare applications: Deep neural networks have demon-strated performance gains in many challenging tasks such as image classification, speech recognition,image captioning (Krizhevsky et al., 2012; Hannun et al., 2014; Karpathy et al., 2014). Two pop-ular deep learning models, namely convolutional neural networks (CNN) and Recurrent neuralnetworks(RNN), have achieved considerable success in health applications. Among CNN variants,AlexNet was one of the first successful deep CNN to successfully classify 1000 different categories ofimages (Krizhevsky et al., 2012). Over time new architectures such as InceptionNet and ResNet havebeen proposed which use different key methods such as residual connections and multiple convolutionsto the same input (Szegedy et al., 2015; He et al., 2015). Various CNN models have been utilized foranalyzing medical images to achieve human level performance for diagnosis tasks (Gulshan et al.,2016; Esteva et al., 2017).
RNN is another powerful deep learning model specialized for sequential data such as continuoustime series and sequences of discrete events. RNNs have had great success in speech recognition,handwriting recognition, and machine translation (Sutskever et al., 2014; Graves, 2013; Graves et al.,2008). In health care applications, RNNs have also demonstrated success on predictive modelingproblems using electronic health records (Choi et al., 2016a,b; Lipton et al., 2015).
Following the recent development of deep neural networks, methods have been proposed tolearn feature representation from EEG data. Recently, a method was proposed to learn an EEGrepresentation by converting the signal into an image using the location of electrodes and applyingdeep a CNN to the image(Bashivan et al., 2015). Convolutional neural networks have also beenapplied to hand-chosen features for epileptic seizure recognition(Mirowski et al., 2008). CompactCNNs have been proposed to learn representation of EEG for brain computer interface tasks (Lawhernet al., 2016). These successful applications to EEG data suggest that deep learning methods havepotential for analyzing EEG data from PSGs to extract efficient representations for automaticsleep-wake stage annotation.
3. SLEEPNET System Description
In this section we present the overall system architecture of SLEEPNET in details.
3

Spectrogram features
Raw EEGfeatures
Expert defined features
Recurrent neural network
Convolutional neural network
Recurrent-Convolutional
neural network
Validation Application interface
Docker container
Best model
SoftwaredependencyMultilayer
perceptron
Logistic regression
Tree boosting
Basi
c M
LD
eep
lear
ning
FeatureExtraction Classification
Model store
Evaluation
Deployment
EEG Data and
Labels
Refinedannotations
(a) Analytic pipeline of SLEEPNET. The blue color components correspond to modeltraining module. The green color components belong to the model deployment module.
(b) Electrode locations of EEG record-ing
(c) EEG raw feature representation (d) Spectrogram representation
Figure 2: System architecture of SLEEPNET
3.1 System overview
SLEEPNET consists of a training module and a deployment module. The system architecture is depictedin Figure 2a.
Training module: The objective of the model training module is to find an accurate annotationalgorithm that can take the multi-channel EEG data as input and automatically output a sequenceof sleep stages, with one stage label assigned to each 30 second epoch. This sequence of stages isconventionally called a hypnogram. To generate such an annotation algorithm, the model trainingmodule extract features from the EEG data and then find classification algorithms to identify thebest feature and algorithm configuration. As we describe in more detail next, we find that the bestconfiguration among those explored is the combination of expert-defined features and a recurrentneural network (RNN) model. Model training is described in Sections 3.2 through 3.6.
Deployment module: The best performing model is deployed via a light-weight docker image atthe point of care at MGH via a web application. The deployment module can load new PSG filesgenerated from a clinic (e.g., sleep lab or neuro ICU) and automatically assign a sequence of sleepstages. A web interface is also developed to display the raw EEG data as well as the spectrogramand some key summary statistics based on the computed hypnogram. If human-assigned labels areavailable (e.g., labels created by technicians in the sleep lab), SLEEPNET displays both the humanlabels and algorithm predicted labels together and highlight regions of disagreement. Details of themodel deployment is described in Section 3.7.
4

3.2 Description of EEG data and Notations
EEG signals consist of local voltage potentials recorded over a brain region. Usually EEG signals arecollected from electrodes placed over multiple regions of the head, represented as different channelsin the EEG data. The length of EEG data collected varies depending on the clinical task. EEG datain PSG consists of data from 6 different channels, i.e. F3, F4, C3, C4, O1 and O2, each referencedto the contralateral mastoid indicated by M1 or M2(Böcker et al., 1994). For example, F3-M2 andF4-M1 represent two frontal EEG channels. In the Figure 2b., we show a schematic of the locationsof the electrodes.
For each 30 second epoch, the sleep EEG signals were annotated as belonging to one of five stages:wake(W), rapid eye movement(R), non-REM stage 1 (N1), non-REM stage 2 (N2), or non-REMstage 3(N3). All annotations of 10,000 PSG studies were performed by certified sleep technologistsaccording to American Academy of Sleep Medicine (AASM) standards (Iber et al., 2007).
Next we introduce some necessary notation: EEG signals for each patient are represented as amatrix Xt ∈ RNi×6 where Ni is the number of samples from 6 different channels of EEG for the i′thpatient. Sleep stages are represented as a sequence y ∈ Rni where ni is the number of 30 secondswindows in the entire recording, and y ∈ N1, N2, N3, R,W . Since the EEG signals are sampled at200Hz, ni and Ni have the following relationship: ni = Ni
200×30 . The classification task in modeltraining is to infer a hypnogram y ∈ Rni that is close to the ground-truth hypnogram y (i.e. ahypnogram that an expert would produce by conventional manual scoring of the EEG), such thatmisclassification between y and y is small.
Table 1: Basic Notations
Symbol Definition DimensionalityXt raw EEG time series Ni × 6Xf EEG into frequency domain niFR Raw EEG tensor feature 6000× 6× niFS Spectrogram tensor feature 29× 257× niFE Expert defined feature 96× niFor simplicity every notation is for a single patient
3.3 Feature Extraction
Now we describe different types feature representations for EEG signals which are computed in theSLEEPNET model training module. For simplicity, we describe each feature only for a single patient.
3.3.1 Raw EEG:
We consider the EEG data Xt for each 30-second epoch to create this raw EEG feature representation.This is represented as a 3-way tensor FR ∈ R6000×6×ni which includes 6000 samples from 6 differentchannels from the 30-second EEG data. Figure 2c shows a visualization of the raw EEG feature as a3-way tensor.
3.3.2 Spectrogram:
The EEG signal Xt can be represented in the frequency domain using the Fourier transform. Thefrequency domain representation is denoted as Xf and is obtained by Fast Fourier Transform(FFT).To perform robust power spectrum estimation, we have used multitaper spectral analysis (MTSA)(Thomson, 1982). The spectrogram is a way of representing the frequency content of the EEG overtime. Each 30-second epoch was segmented into 29 sub-epochs of that are 2 seconds long with1-second overlap. For each sub-epoch, we used MTSA to estimate power spectral density in 257
5

frequency bins from 0-100Hz. Further, the resulting spectrogram feature is denoted as another 3-waytensor FS ∈ R29×257×ni , where each spectrogram has dimension 29× 257 and ni is the number of30-second windows in the entire EEG signal. Figure 2d shows a 3-way tensor of spectrogram for one30-second EEG epoch.
3.3.3 Expert defined features:
We extract various time domain and frequency domain features from each 30-second epoch of EEGdata. In Table 2, we list the expert defined features extracted from both time and frequency domains.We also extracted two different types of time domain features. Line length is included as a measureof amplitude and frequency oscillations in the EEG(Esteller et al., 2001). Kurtosis is included tomeasure the presence of extreme values(Zoubek et al., 2007).
In order to extract frequency domain features, we first segment each 30-second epoch into 29sub-epochs of 2 seconds long with 1-second overlap and estimate the power spectral density of eachsub-epoch. This results in 6 spectrograms from 6 channels with 29× 257 dimensions. To reduce noisein spectral features we averaged spectrograms from contralateral channels, i.e. F3-M2 and F4-M1,C3-M2 and C4-M1, O1-M2 and O2-M1. which reduces the dimension to 3 averaged spectrogramof 29 × 257 dimension. Then we find indices for each of three frequency bands: delta (0.5-4Hz),theta (4-8Hz), alpha (8-12Hz) in the spectrogram matrix. We normalize these power estimates bythe total power from 0-20Hz. From the resulting matrix, we obtain 95th percentile (robust versionof maximum), minimum, mean and standard deviation. We also include features reflecting relativepower such as i.e. delta/theta, delta/alpha and theta/alpha ratios. The kurtosis of the spectrogramin the delta, theta, alpha and sigma (12-20Hz) bands were also extracted to capture transient burstssuch as sleep spindles.
The final dimension of the expert defined feature vectors are FE ∈ R96×ni .
Table 2: Expert Defined Feature List
Domain Feature #features
Time DomainLine length 6Kurtosis 6
Frequency Domain
delta-total power ratio 12theta-total power ratio 12alpha-total power ratio 12delta-theta power ratio 12theta-alpha power ratio 12delta-alpha power ratio 12
Kurtosis of delta band of spectrogram 3Kurtosis of theta band of spectrogram 3Kurtosis of alpha band of spectrogram 3Kurtosis of sigma band of spectrogram 3
3.4 Classification in SLEEPNET
Once the features are constructed, the model training module compares various classification modelsincluding basic machine learning methods such as logistic regression, tree boosting, multilayerperceptrons and deep learning methods. Next, we describe the deep learning methods in more detail.
3.4.1 Convolutional Neural Network:
Convolutional Neural Networks (CNNs), introduced by Le Cun et al.(LeCun et al., 1989) comprise aclass of neural network architecture which use a series of convolutional filters, non-linear activationfunctions and pooling layers to minimize a loss function. Given a feature matrix X, the convolutional
6

layer convolves X with k filters {Wi}k to produce preactivation maps H.
Hi = Wi ∗X+ bi, i = 1, ...., k (1)
where the symbol ∗ denotes the convolution operation and bias bi is a bias parameter. In SLEEPNET,we use Rectifier Linear Unit(ReLu) as non-linear activation functions(Glorot et al., 2011). Given asimple feature map Hi, a ReLu function is defined as Hi = max(0,Hi).
After the non-linear activation unit, we pass the features through a max-pooling layer to reducethe spatial size of the representation. Figure 3 shows a diagram of the CNN architecture used inour experiments. Our final model had stacked 32 3× 3 filters, 64 3× 3 filters, 128 3× 3 filters eachfollowed by max pooling layer and finally connected to a fully connected layer. We also tried otherfilter sizes (5× 5 and 7× 7) but 3× 3 filter gives the best test-set performance.
Figure 3: CNN with Spectrogram as input
In our experiments, we have used a 2D CNN for processing spectrograms which are of 29× 257dimension. The raw waveform from 6 channels were averaged to a single channel and passed to a 1DCNN for classification.
3.4.2 Recurrent Neural Networks:
RNNs are tailored toward modeling sequential data. Figure 4 illustrates the process of feeding RNNswith input features with every timestamp corresponding to a 30-second epoch. More specifically,we provide feature representation of EEG up to the current timestamp t, to classify the featurerepresentation at timestamp t. At timestamp t, nodes get input from the current time step xt andfrom previous hidden states ht−1 to provide output yt. The following equation specifies the simpleformulation of an RNN.
yt = Softmax(Wyhht + by) (2)ht = σ(Whxxt +Whhht−1 + bh) (3)
where Whh is the weight matrix associated with between hidden layers ,Whx is weight matrixassociated with between hidden layers and input layer and Why is the weight matrix associatedbetween hidden layer and output layer. σ is the activation function such as sigmoid or tanh. Thevectors bh and by are bias parameters associated with hidden layer and output layer. We implementedthe RNN formulation using Long Short Term Memory (LSTM) in Tensorflow(Graves, 2013; Hochreiterand Schmidhuber, 1997).
In order to incorporate regularization to avoid overfitting, we have added dropout(Srivastavaet al., 2014) to our multilayer RNN architecture. In our experiments, we have experimented withdifferent numbers of layers, activation functions, and dropout probability to optimize the structure ofthe RNN. Finally, our optimal model had 5 layers of LSTM cells with tanh activation function anddropout keep probability of 0.9. The size of the hidden layer was set to 1000.
7

Figure 4: Multi-layer RNN for SLEEPNET
3.4.3 Recurrent-Convolutional Neural Networks:
By combining a RNN with CNN, we can have a hybrid model, namely, Recurrent-ConvolutionalNeural Networks (RCNN), which is able to extract features present in a spectrogram and preservethe long-term temporal relationship present in the EEG data.
In RCNN model, a CNN first processes the spectrogram over all non-overlapping 30-secondwindows of EEG data to learn feature representation. Here CNN extracts the “spatial” features fromEEG which is time invariant and independent at each step. That feature representation is passed toa RNN model (LSTM in this case), which learns the temporal dependency present of the spatialfeature extracted by CNN. More specifically, RCNN model passes each 30-second spectrogram FS toa CNN model to produce a fixed-length spatial feature representation φit.
φt = CNN(FS) (4)
where t = 1, 2, . . . ni. φt is 4,352 dimensional vector after a 29× 257 spectrogram is passed through aCNN. The resulting spatial features over time become a sequence denoted by φ1, φ2 . . . φt. Taking theabove sequence as input, RNN maps an current input φt and previous time-step hidden state ht−1 tothe next hidden state ht. Then the hidden state ht pass to a softmax function to generate the finalsleep stage prediction y described in Eq 2. We use categorical cross-entropy as the loss function of theclassification step from spectrogram sequence to sleep stage. The entire model (including CNN andRNN) are trained together via backpropagation. We again use the Long Short Term Memory(LSTM)model as the implementation for the RNN (Graves, 2013).
3.5 Evaluation
The evaluation is done by splitting the data into train, validation and test set. And the best modelis persisted into the model store for deployment. For all classification methods, we use EEG from1K patients as the final test set. The remaining 9K patients are used for training and validation.For deep learning model, we use 300 patients as validation. Note that each patient corresponds to 8hours’ data about 950-1000 labels (one for each 30-second epoch).
We performed 50 iterations of random search over a set of parameter choices for hyper-parametertuning. Here are the parameter choices:
• Learning rate : [0.01, 0.001, 0.001, 0.0001, 0.00001]
• Look back steps in RNN : [3,5,10,20,30]
• Dropout rate : [0.0, 0.2,0.4,0.6, 0.8, 0.9]
• Number of hidden units in RNN : [100, 200, 400, 800, 1000,2000, 5000]
• Number of layers in RNN: [1,2,3,5,7,8,15]
• Filter Size in CNN : [(3× 3), (5× 5), (7× 7)]
We also experimented with normalization methods such as Batch normalization.(Ioffe and Szegedy,2015).
8

3.6 Implementation Details of Model Training Module
We implemented deep learning models of SLEEPNET with Tensorflow 0.12.1 (Team, 2015). For trainingmodels, we used a machine equipped with Intel Xeon E5-2640, 256GB RAM, four Nvidia Titan X andCUDA 8.0. We have used scikit-learn for logistic regression, Multi-layer perceptron (Pedregosa et al.,2011). We have used XGBoost which is an efficient implementation of Tree Boosting algorithm (Chenand Guestrin, 2016).
3.7 Model Deployment Module
Now we describe the preliminary deployment of SLEEPNET at Massachusetts General Hospital(MGH).All qualitative evaluations are performed by physicians (MTB, MBW).
3.7.1 Deployment Architecture
There are significant infrastructure differences between training and deployment environment. Themodel training phase was performed on a server with high performance GPU cards (NVIDIA TeslaPascal) to enable efficient iteration over model choices. To deploy the model at a commodity laptopor desktop at the point of care, we use Docker technology to ease the deployment effort. UsingDocker, we package our trained model with all the required parts as an image. We use the sameDocker image in the deployment environment at MGH to run an instance of the image.
3.7.2 Deployment Process at MGH
We developed a web application which runs the trained model in the backend using a Docker containerto score sleep EEG cases. To make software usage easy, clinicians just have to select a case, afterwhich the application runs the trained model in the backend and shows a report page with cleanvisualization.
A screenshot of the web application and visualization is shown in 1. The visualization has 4sub-panels. The first shows the EEG waveform, the 2nd and 3rd panels show the expert-assignedsleep stages and the stage labels predicted by the algorithm. The 4th sub-panel shows an averagespectrogram from 6 EEG channels. In the figure, a clinician has selected a particular 30-second epochfor closer inspection. The raw EEG signal and spectrogram are shown as zoomed-in views.
SLEEPNET automatically calculates and displays standard summary statistics for sleep EEG,including the number of minutes spent in each stage, sleep efficiency (time spent in sleep / totalrecording time, i.e. (N1+N2+N3+R)/( N1+N2+N3+R+W), and sleep fragmentation indices. Thesestatistics provide physicians with a quick summary of a patient’s sleep quality.
4. Experiments
4.1 Dataset Description
This dataset was collected at Massachusetts General Hospital Sleep Laboratory. This study wasapproved by Partners Institutional Review Board for retrospective analysis. EEG signals are usuallycollected with respect a reference electrode or chosen as the zero level. In our dataset EEG signalswere referenced to electrodes located M2 or M1 position. The EEG signals were sampled at 200 Hzfrom F3-M2 and F4-M1, C3-M2 and C4-M1, O1-M2 and O2-M1 channels each referenced to thecontralateral mastoid(M2 or M1)(Böcker et al., 1994). We included EEGs if three or more sleepstages were present.
EEG signals were annotated by PSG technicians in non-overlapping 30-second epochs according toAASM standards(Iber et al., 2007). Each epoch was labeled by a single experienced PSG technologistas one of five stages: wake (W), rapid eye movement (REM), Non-REM stage 1 (N1), Non-REMstage 2 (N2) and Non-REM stage 3 (N3). Table 3 provides the summary statistics.
9

Table 3: Descriptive statistics of dataset
Dataset Property NumberNumber of Patients 10,000Hours of EEG data 80,000Raw data storage 3.2 TB
We have represented EEG data using 3 different types of feature representation.
• Raw waveform(FR): In this representation, we feed the raw waveform from 6 channels ofeach 30-second EEG data segment to the models as input. The data dimensions for a 30-secondwindow are 6× 6000.
• Spectrogram (FS): Averaged spectrogram from multiple channels of EEG is provided as theinput feature to different models. Spectrogram dimensions are 29× 257.
• Expert-defined features(FE): Expert-defined features are fed as the input to different models.The dimension of the feature was 96 for a 30 second epoch of sleep EEG. The detailed featuredefinitions are presented in Section 3.3.3.
Classification Methods: We conduct evaluation using the following classification algorithms.
• Logistic Regression(LR): We train a logistic Regression(LR) model using input features fromeach 30-second epoch of EEG data and the sleep stage as the label.
• Tree Boosting(TB): We use the same setup as logistic regression model in a Tree boostingclassifier (Chen and Guestrin, 2016).
• MultiLayer Perceptron (MLP): We train a MLP with the setup as logistic regression. Weused cross entropy loss function and trained using backpropagation. The hidden layer had 800units.
• Convolutional Neural Network(CNN): We train a CNN with 2D convolutions to acceptfeature vector in terms of expert defined features or spectrogram of a 30-second epoch of sleepEEG data. In our experiments we have evaluated the effect of depth and different non-linearityoptions for building a deep CNN. We used a CNN with 1D convolutional layers to process rawEEG features. The details of the implmentation is presented in section 3.4.1.
• Recurrent Neural Network(RNN) : We have also trained a multi-layered RNN with LSTMcells to process sequence of features to produce sleep stage classes corresponding to the sequence.
• Recurrent-Convolutional Neural Network(RCNN): In this model, we process the spectro-grams using a convolutional neural network. The activation maps of the final layer of the CNNare passed to the 2-layer RNN for sleep stage classification.
4.2 Accurate Model Classification
We have chosen accuracy and Cohen’s kappa as performance metrics to evaluate of different combi-nations of feature representation and models. Cohen’s kappa is a common metric for sleep study,which measures agreement between raters each rating N items into C mutually exclusive categories.The formula for Cohen’s kappa is κ = p0−pe
1−pewhere po is the relative agreement between raters and
pe is the agreement probability by a random chance. In table 4, we show our results for differentcombinations of features and methods. Multilayer RNN with expert-defined features has the bestperformance, although RCNN also has very competitive performance. Overall, all the deep learningmodels consistently outperform the traditional classification methods such as logistic regression, tree
10

Expert Defined Features Spectrogram Features Waveform FeaturesModel Accuracy Kappa Accuracy Kappa Accuracy KappaLR 68.54 63.88 66.54 66.61 67.43 62.71TB 75.67 69.47 71.61 65.37 72.36 66.37MLP 72.23 68.41 70.23 66.71 69.56 64.21CNN – – 77.83 71.45 77.31 71.47RNN 85.76 79.46 79.21 73.83 79.46 72.46RCNN 81.67 76.38 81.47 74.37 79.81 73.52
Table 4: Performance of different feature representations with model combinations
boosting and MLP, which confirmed the power of deep learning on modeling EEG data. Note thatthe performance of Kappa 79.46% from RNN is significantly higher than many prior studies(Andereret al., 2005). More impressively, SLEEPNET actually performed well on a much larger and broadercohort of 10K patients, which is significantly larger than the prior works.
We also show the confusion matrix to illustrate the performance of the best performing RNNmodel in the figure 5. In the five different stages of sleep, N1 is hardest to classify, which aligns withclinical expectation.
N1 N2 N3 R WPredicted label
N1
N2
N3
R
W
Tru
e la
bel
0.562 0.186 0.006 0.039 0.208
0.032 0.884 0.053 0.019 0.013
0.001 0.145 0.854 0.001 0.0
0.001 0.032 0.036 0.92 0.012
0.004 0.041 0.097 0.013 0.845
Normalized confusion matrix
Figure 5: Normalized Confusion matrix for the performance of Expert defined features with RNN
4.3 Efficient Model Training and Model Scoring
We performed extensive experiments to evaluate the training and scoring time of different modeland feature representation combinations. Figure 6 shows the training time for different modelsover 9000 patients. This shows that more complex models with raw data input takes longer as thedimensionality of feature space is larger.
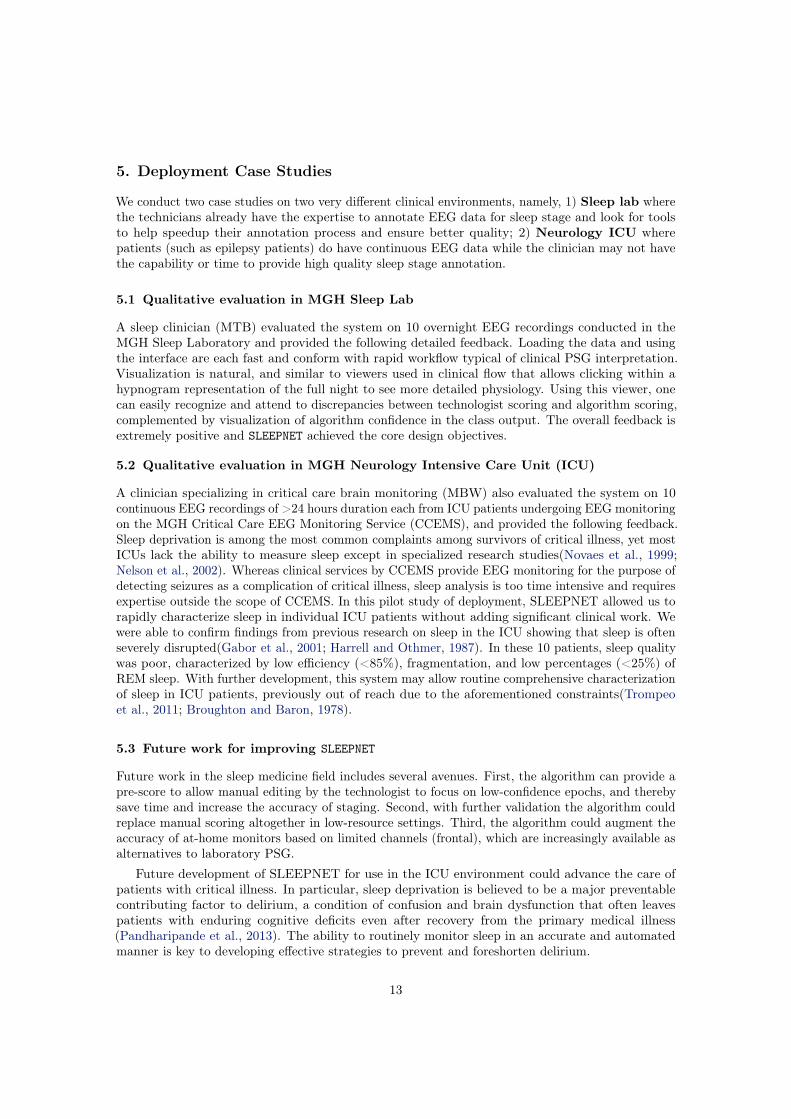
We also compared scoring time different models for the entire 8-hour EEG recording of a patient(including feature extraction time) in Figure 7. The overall time spent varies from 2 to 5 minutes,which is sufficiently small to satisfy the deployment requirement. Note that the annotation resultscan be progressively displayed as the scoring process applies to each 30-second epoch of EEG data.
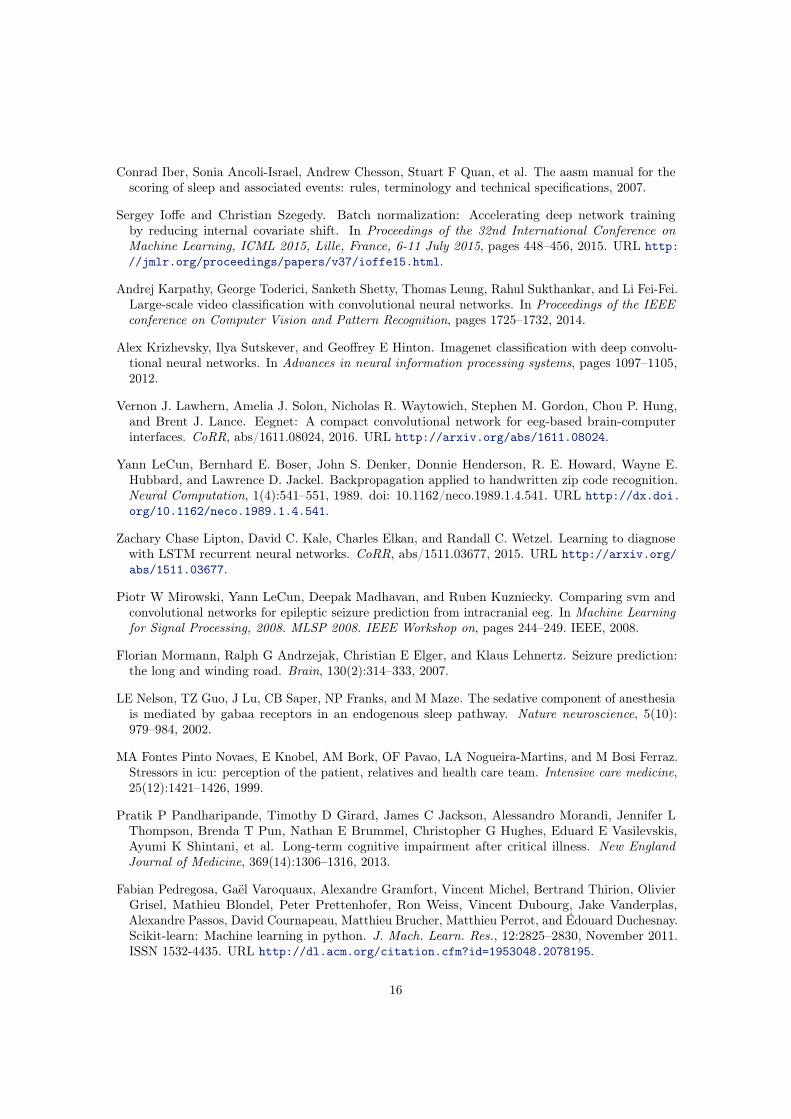
4.4 Sensitivity Analysis of Model Training
Long-term temporal dependency: We evaluate model performance with different look-back stepsin RNN. Figure 8a shows that performance of the model increases as the number of lookback steps.This indicates that long-term temporal dependency does help improving sleep stage classification.
11
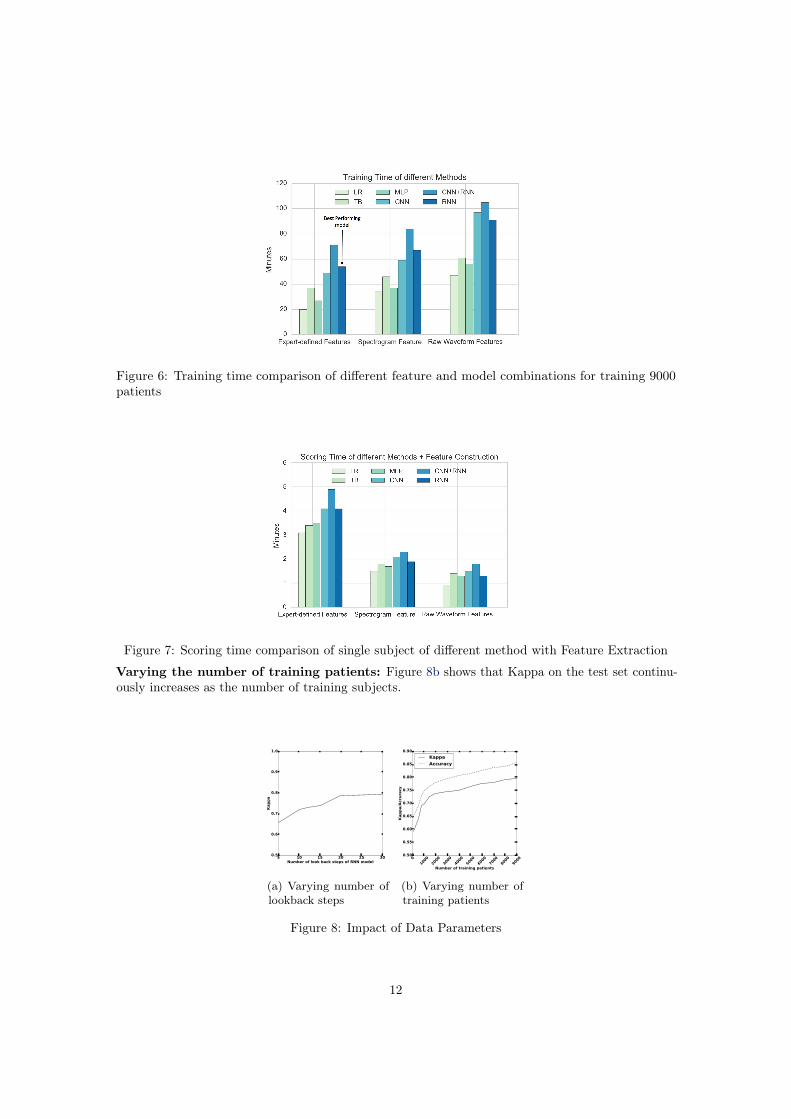
Figure 6: Training time comparison of different feature and model combinations for training 9000patients
Figure 7: Scoring time comparison of single subject of different method with Feature Extraction
Varying the number of training patients: Figure 8b shows that Kappa on the test set continu-ously increases as the number of training subjects.
5 10 15 20 25 30Number of look back steps of RNN model
0.5
0.6
0.7
0.8
0.9
1.0
Kappa
(a) Varying number oflookback steps
0
1000
2000
3000
4000
5000
6000
7000
8000
9000
Number of training patients
0.50
0.55
0.60
0.65
0.70
0.75
0.80
0.85
0.90
Kappa/Accuracy
Kappa
Accuracy
(b) Varying number oftraining patients
Figure 8: Impact of Data Parameters
12
5. Deployment Case Studies
We conduct two case studies on two very different clinical environments, namely, 1) Sleep lab wherethe technicians already have the expertise to annotate EEG data for sleep stage and look for toolsto help speedup their annotation process and ensure better quality; 2) Neurology ICU wherepatients (such as epilepsy patients) do have continuous EEG data while the clinician may not havethe capability or time to provide high quality sleep stage annotation.
5.1 Qualitative evaluation in MGH Sleep Lab
A sleep clinician (MTB) evaluated the system on 10 overnight EEG recordings conducted in theMGH Sleep Laboratory and provided the following detailed feedback. Loading the data and usingthe interface are each fast and conform with rapid workflow typical of clinical PSG interpretation.Visualization is natural, and similar to viewers used in clinical flow that allows clicking within ahypnogram representation of the full night to see more detailed physiology. Using this viewer, onecan easily recognize and attend to discrepancies between technologist scoring and algorithm scoring,complemented by visualization of algorithm confidence in the class output. The overall feedback isextremely positive and SLEEPNET achieved the core design objectives.
5.2 Qualitative evaluation in MGH Neurology Intensive Care Unit (ICU)
A clinician specializing in critical care brain monitoring (MBW) also evaluated the system on 10continuous EEG recordings of >24 hours duration each from ICU patients undergoing EEG monitoringon the MGH Critical Care EEG Monitoring Service (CCEMS), and provided the following feedback.Sleep deprivation is among the most common complaints among survivors of critical illness, yet mostICUs lack the ability to measure sleep except in specialized research studies(Novaes et al., 1999;Nelson et al., 2002). Whereas clinical services by CCEMS provide EEG monitoring for the purpose ofdetecting seizures as a complication of critical illness, sleep analysis is too time intensive and requiresexpertise outside the scope of CCEMS. In this pilot study of deployment, SLEEPNET allowed us torapidly characterize sleep in individual ICU patients without adding significant clinical work. Wewere able to confirm findings from previous research on sleep in the ICU showing that sleep is oftenseverely disrupted(Gabor et al., 2001; Harrell and Othmer, 1987). In these 10 patients, sleep qualitywas poor, characterized by low efficiency (<85%), fragmentation, and low percentages (<25%) ofREM sleep. With further development, this system may allow routine comprehensive characterizationof sleep in ICU patients, previously out of reach due to the aforementioned constraints(Trompeoet al., 2011; Broughton and Baron, 1978).
5.3 Future work for improving SLEEPNET
Future work in the sleep medicine field includes several avenues. First, the algorithm can provide apre-score to allow manual editing by the technologist to focus on low-confidence epochs, and therebysave time and increase the accuracy of staging. Second, with further validation the algorithm couldreplace manual scoring altogether in low-resource settings. Third, the algorithm could augment theaccuracy of at-home monitors based on limited channels (frontal), which are increasingly available asalternatives to laboratory PSG.
Future development of SLEEPNET for use in the ICU environment could advance the care ofpatients with critical illness. In particular, sleep deprivation is believed to be a major preventablecontributing factor to delirium, a condition of confusion and brain dysfunction that often leavespatients with enduring cognitive deficits even after recovery from the primary medical illness(Pandharipande et al., 2013). The ability to routinely monitor sleep in an accurate and automatedmanner is key to developing effective strategies to prevent and foreshorten delirium.
13

6. Conclusion
Using the largest archive assembled to date of real-world overnight sleep recordings, we have developedan automated sleep stage annotation system SLEEPNET, which trained a deep neural network toautomatically label sequential EEG epochs with the 5 conventional sleep stages used in sleep medicine.We evaluated many different combinations of feature representation and models. On 1000 held-outtesting patients, the best performing algorithm achieved an expert-algorithm level of inter-rateragreement of 85.76% with Kappa value 79.46%, exceeding previously reported levels of expert-expertinter-rater agreement for sleep EEG staging.
We have also developed a framework for model deployment to tackle inconsistent softwareconfiguration environments and the ease of use at the point of care in clinics. Our experience to datewith the deployed model suggests that with further development SLEEPNET has great potential to besmoothly incorporated into real-world clinical workflows in both traditional sleep laboratories and inneurocritical care settings. Additionally, by automating a task previously requiring human expertisethat is in short supply, SLEEPNET opens the way for extending the reach of sleep medicine beyond itscurrent bounds.
References
Peter Anderer, Georg Gruber, Silvia Parapatics, Michael Woertz, Tatiana Miazhynskaia, GerhardKlösch, Bernd Saletu, Josef Zeitlhofer, Manuel J Barbanoj, Heidi Danker-Hopfe, et al. An e-healthsolution for automatic sleep classification according to rechtschaffen and kales: validation study ofthe somnolyzer 24× 7 utilizing the siesta database. Neuropsychobiology, 51(3):115–133, 2005.
Peter Anderer, Arnaud Moreau, Michael Woertz, Marco Ross, Georg Gruber, Silvia Parapatics, ErnaLoretz, Esther Heller, Andrea Schmidt, Marion Boeck, et al. Computer-assisted sleep classificationaccording to the standard of the american academy of sleep medicine: validation study of the aasmversion of the somnolyzer 24× 7. Neuropsychobiology, 62(4):250–264, 2010.
Pouya Bashivan, Irina Rish, Mohammed Yeasin, and Noel Codella. Learning representations fromEEG with deep recurrent-convolutional neural networks. CoRR, abs/1511.06448, 2015. URLhttp://arxiv.org/abs/1511.06448.
Christian Berthomier, Xavier Drouot, Maria Herman-Stoïca, Pierre Berthomier, Jacques Prado,Djibril Bokar-Thire, Odile Benoit, Jérémie Mattout, and M d Ortho. Automatic analysis of single-channel sleep eeg: validation in healthy individuals. SLEEP-NEW YORK THEN WESTCHESTER-,30(11):1587, 2007.
Koen BE Böcker, Jurgen AG van Avermaete, and Margaretha MC van den Berg-Lenssen. Theinternational 10–20 system revisited: Cartesian and spherical co-ordinates. Brain Topography, 6(3):231–235, 1994.
Roger Broughton and Robert Baron. Sleep patterns in the intensive care unit and on the ward afteracute myocardial infarction. Electroencephalography and clinical neurophysiology, 45(3):348–360,1978.
Tianqi Chen and Carlos Guestrin. Xgboost: A scalable tree boosting system. CoRR, abs/1603.02754,2016. URL http://arxiv.org/abs/1603.02754.
Edward Choi, Mohammad Taha Bahadori, Andy Schuetz, Walter F Stewart, and Jimeng Sun. DoctorAI: Predicting clinical events via recurrent neural networks. In Machine Learning for HealthcareConference, pages 301–318, 10 December 2016a.
Edward Choi, Andy Schuetz, Walter F Stewart, and Jimeng Sun. Using recurrent neural networkmodels for early detection of heart failure onset. J. Am. Med. Inform. Assoc., 13 August 2016b.
14

Heidi Danker-hopfe, Peter Anderer, Josef Zeitlhofer, Marion Boeck, Hans Dorn, Georg Gruber, EstherHeller, Erna Loretz, Doris Moser, Silvia Parapatics, et al. Interrater reliability for sleep scoringaccording to the rechtschaffen & kales and the new aasm standard. Journal of sleep research, 18(1):74–84, 2009.
Rosana Esteller, Javier Echauz, T Tcheng, Brian Litt, and Benjamin Pless. Line length: anefficient feature for seizure onset detection. In Engineering in Medicine and Biology Society, 2001.Proceedings of the 23rd Annual International Conference of the IEEE, volume 2, pages 1707–1710.IEEE, 2001.
Andre Esteva, Brett Kuprel, Roberto A Novoa, Justin Ko, Susan M Swetter, Helen M Blau, andSebastian Thrun. Dermatologist-level classification of skin cancer with deep neural networks.Nature, 542(7639):115–118, 2 2017.
L Fraiwan, K Lweesy, N Khasawneh, M Fraiwan, H Wenz, H Dickhaus, et al. Classification of sleepstages using multi-wavelet time frequency entropy and lda. Methods of information in Medicine,49(3):230, 2010.
Jonathan Y Gabor, Andrew B Cooper, and Patrick J Hanly. Sleep disruption in the intensive careunit. Current opinion in critical care, 7(1):21–27, 2001.
Deon Garrett, David A Peterson, Charles W Anderson, and Michael H Thaut. Comparison of linear,nonlinear, and feature selection methods for eeg signal classification. IEEE Transactions on neuralsystems and rehabilitation engineering, 11(2):141–144, 2003.
Xavier Glorot, Antoine Bordes, and Yoshua Bengio. Deep sparse rectifier neural networks. In Aistats,volume 15, page 275, 2011.
Alex Graves. Generating sequences with recurrent neural networks. CoRR, abs/1308.0850, 2013.URL http://arxiv.org/abs/1308.0850.
Alex Graves, Marcus Liwicki, Horst Bunke, Jürgen Schmidhuber, and Santiago Fernández. Uncon-strained on-line handwriting recognition with recurrent neural networks. In Advances in NeuralInformation Processing Systems, pages 577–584, 2008.
Varun Gulshan, Lily Peng, Marc Coram, Martin C Stumpe, Derek Wu, Arunachalam Narayanaswamy,Subhashini Venugopalan, Kasumi Widner, Tom Madams, Jorge Cuadros, Ramasamy Kim, RajivRaman, Philip C Nelson, Jessica L Mega, and Dale R Webster. Development and validation of adeep learning algorithm for detection of diabetic retinopathy in retinal fundus photographs. JAMA,316(22):2402–2410, 13 December 2016.
Awni Y. Hannun, Carl Case, Jared Casper, Bryan Catanzaro, Greg Diamos, Erich Elsen, Ryan Prenger,Sanjeev Satheesh, Shubho Sengupta, Adam Coates, and Andrew Y. Ng. Deep speech: Scaling up end-to-end speech recognition. CoRR, abs/1412.5567, 2014. URL http://arxiv.org/abs/1412.5567.
Ruth G Harrell and Ekkehard Othmer. Postcardiotomy confusion and sleep loss. Journal of ClinicalPsychiatry, 1987.
Kaiming He, Xiangyu Zhang, Shaoqing Ren, and Jian Sun. Deep residual learning for imagerecognition. CoRR, abs/1512.03385, 2015. URL http://arxiv.org/abs/1512.03385.
David R Hillman, Anita Scott Murphy, and Lynne Pezzullo. The economic cost of sleep disorders.Sleep, 29(3):299–305, mar 2006. ISSN 0161-8105 (Print).
Sepp Hochreiter and Jürgen Schmidhuber. Long short-term memory. Neural Comput., 9(8):1735–1780,November 1997. ISSN 0899-7667. doi: 10.1162/neco.1997.9.8.1735. URL http://dx.doi.org/10.1162/neco.1997.9.8.1735.
15
Conrad Iber, Sonia Ancoli-Israel, Andrew Chesson, Stuart F Quan, et al. The aasm manual for thescoring of sleep and associated events: rules, terminology and technical specifications, 2007.
Sergey Ioffe and Christian Szegedy. Batch normalization: Accelerating deep network trainingby reducing internal covariate shift. In Proceedings of the 32nd International Conference onMachine Learning, ICML 2015, Lille, France, 6-11 July 2015, pages 448–456, 2015. URL http://jmlr.org/proceedings/papers/v37/ioffe15.html.
Andrej Karpathy, George Toderici, Sanketh Shetty, Thomas Leung, Rahul Sukthankar, and Li Fei-Fei.Large-scale video classification with convolutional neural networks. In Proceedings of the IEEEconference on Computer Vision and Pattern Recognition, pages 1725–1732, 2014.
Alex Krizhevsky, Ilya Sutskever, and Geoffrey E Hinton. Imagenet classification with deep convolu-tional neural networks. In Advances in neural information processing systems, pages 1097–1105,2012.
Vernon J. Lawhern, Amelia J. Solon, Nicholas R. Waytowich, Stephen M. Gordon, Chou P. Hung,and Brent J. Lance. Eegnet: A compact convolutional network for eeg-based brain-computerinterfaces. CoRR, abs/1611.08024, 2016. URL http://arxiv.org/abs/1611.08024.
Yann LeCun, Bernhard E. Boser, John S. Denker, Donnie Henderson, R. E. Howard, Wayne E.Hubbard, and Lawrence D. Jackel. Backpropagation applied to handwritten zip code recognition.Neural Computation, 1(4):541–551, 1989. doi: 10.1162/neco.1989.1.4.541. URL http://dx.doi.org/10.1162/neco.1989.1.4.541.
Zachary Chase Lipton, David C. Kale, Charles Elkan, and Randall C. Wetzel. Learning to diagnosewith LSTM recurrent neural networks. CoRR, abs/1511.03677, 2015. URL http://arxiv.org/abs/1511.03677.
Piotr W Mirowski, Yann LeCun, Deepak Madhavan, and Ruben Kuzniecky. Comparing svm andconvolutional networks for epileptic seizure prediction from intracranial eeg. In Machine Learningfor Signal Processing, 2008. MLSP 2008. IEEE Workshop on, pages 244–249. IEEE, 2008.
Florian Mormann, Ralph G Andrzejak, Christian E Elger, and Klaus Lehnertz. Seizure prediction:the long and winding road. Brain, 130(2):314–333, 2007.
LE Nelson, TZ Guo, J Lu, CB Saper, NP Franks, and M Maze. The sedative component of anesthesiais mediated by gabaa receptors in an endogenous sleep pathway. Nature neuroscience, 5(10):979–984, 2002.
MA Fontes Pinto Novaes, E Knobel, AM Bork, OF Pavao, LA Nogueira-Martins, and M Bosi Ferraz.Stressors in icu: perception of the patient, relatives and health care team. Intensive care medicine,25(12):1421–1426, 1999.
Pratik P Pandharipande, Timothy D Girard, James C Jackson, Alessandro Morandi, Jennifer LThompson, Brenda T Pun, Nathan E Brummel, Christopher G Hughes, Eduard E Vasilevskis,Ayumi K Shintani, et al. Long-term cognitive impairment after critical illness. New EnglandJournal of Medicine, 369(14):1306–1316, 2013.
Fabian Pedregosa, Gaël Varoquaux, Alexandre Gramfort, Vincent Michel, Bertrand Thirion, OlivierGrisel, Mathieu Blondel, Peter Prettenhofer, Ron Weiss, Vincent Dubourg, Jake Vanderplas,Alexandre Passos, David Cournapeau, Matthieu Brucher, Matthieu Perrot, and Édouard Duchesnay.Scikit-learn: Machine learning in python. J. Mach. Learn. Res., 12:2825–2830, November 2011.ISSN 1532-4435. URL http://dl.acm.org/citation.cfm?id=1953048.2078195.
16
Nicolas Schaltenbrand, Régis Lengelle, M Toussaint, R Luthringer, G Carelli, A Jacqmin, E Lainey,Alain Muzet, and Jean-Paul Macher. Sleep stage scoring using the neural network model: compari-son between visual and automatic analysis in normal subjects and patients. Sleep, 19(1):26–35,1996.
Ali H Shoeb and John V Guttag. Application of machine learning to epileptic seizure detection. InProceedings of the 27th International Conference on Machine Learning (ICML-10), pages 975–982,2010.
Nitish Srivastava, Geoffrey E Hinton, Alex Krizhevsky, Ilya Sutskever, and Ruslan Salakhutdinov.Dropout: a simple way to prevent neural networks from overfitting. Journal of Machine LearningResearch, 15(1):1929–1958, 2014.
Abdulhamit Subasi. Eeg signal classification using wavelet feature extraction and a mixture of expertmodel. Expert Systems with Applications, 32(4):1084–1093, 2007.
Ilya Sutskever, Oriol Vinyals, and Quoc V Le. Sequence to sequence learning with neural networks.In Advances in neural information processing systems, pages 3104–3112, 2014.
Christian Szegedy, Vincent Vanhoucke, Sergey Ioffe, Jonathon Shlens, and Zbigniew Wojna. Re-thinking the inception architecture for computer vision. CoRR, abs/1512.00567, 2015. URLhttp://arxiv.org/abs/1512.00567.
Tensorflow Team. TensorFlow: Large-scale machine learning on heterogeneous systems, 2015. URLhttp://tensorflow.org/. Software available from tensorflow.org.
David J Thomson. Spectrum estimation and harmonic analysis. Proceedings of the IEEE, 70(9):1055–1096, 1982.
AC Trompeo, Y Vidi, MD Locane, A Braghiroli, L Mascia, K Bosma, and VM Ranieri. Sleep distur-bances in the critically ill patients: role of delirium and sedative agents. Minerva anestesiologica,77(6):604, 2011.
Ying Wang, Kenneth A Loparo, Monica R Kelly, and Richard F Kaplan. Evaluation of an automatedsingle-channel sleep staging algorithm. Nature and science of sleep, 7:101, 2015.
Lukáš Zoubek, Sylvie Charbonnier, Suzanne Lesecq, Alain Buguet, and Florian Chapotot. Fea-ture selection for sleep/wake stages classification using data driven methods. Biomedical SignalProcessing and Control, 2(3):171–179, 2007.
17