A DECADE OF FORECLOSURES AND THE CRISIS s Homeownership Preservation Program advocates ... The...
44
A DECADE OF FORECLOSURES AND THE CRISIS CONTINUES: A STUDY OF FORECLOSURES IN HAMILTON COUNTY, OHIO IN 2012 2,931 MORTGAGE F ORECLOSURES COMPLETED IN HAMILTON COUNTY IN 2012 1814 Dreman Avenue, Cincinnati, OH 45223 (513) 541-4109 www.wincincy.org
Transcript of A DECADE OF FORECLOSURES AND THE CRISIS s Homeownership Preservation Program advocates ... The...

A DECADE OF FORECLOSURES AND THE CRISIS CONTINUES:
A STUDY OF FORECLOSURES IN HAMILTON COUNTY, OHIO IN 2012
2,931 MORTGAGE FORECLOSURES COMPLETED IN HAMILTON COUNTY IN 2012
1814 Dreman Avenue, Cincinnati, OH 45223
(513) 541-4109 www.wincincy.org
2
EXECUTIVE SUMMARY
INTRODUCTION
For thirty-five years, Working In Neighborhoods (WIN) has worked to build strong, livable, stable
communities in Greater Cincinnati. We partner with community and neighborhood organizations, public
officials, lenders and other stakeholders to identify issues and seek solutions around foreclosure and
homeownership. WIN’s Homeownership Preservation Program advocates and intervenes on behalf of
distressed borrowers working to save their homes.
A Decade of Foreclosures and the Crisis Continues: A Study of Foreclosures in Hamilton County, Ohio in
2012 is Working in Neighborhoods’ tenth foreclosure study in the past eleven years. Our first study was
created for a “Foreclosure Crisis Forum” in May, 2002. Since then, WIN has released annual follow-up
studies and hosted yearly foreclosure forums.
When WIN began collecting foreclosure data in Hamilton County, we wanted to better understand the
increasing requests for assistance by community members who were struggling to keep their homes
after being targeted by predatory lenders. Since 2002, WIN has continued to track Hamilton County
Sheriff’s Sale activity, including Sheriff’s Sale listings and completed foreclosure sales, geocoding
addresses to monitor neighborhood impacts, and documenting lender behavior.
This report includes information on the cumulative impact of foreclosure on our neighborhoods and
municipalities since 2006. Our neighborhood case studies examine Sheriff’s Sale activity between 2010
and 2012, as well as existing housing conditions in three communities: Northside, College Hill, and the
Village of Elmwood Place. These case studies help shed more light on the ways that foreclosure and
vacancy have impacted each of these neighborhoods differently and to examine factors affecting each
community’s ability to recover and rebuild moving forward.
3
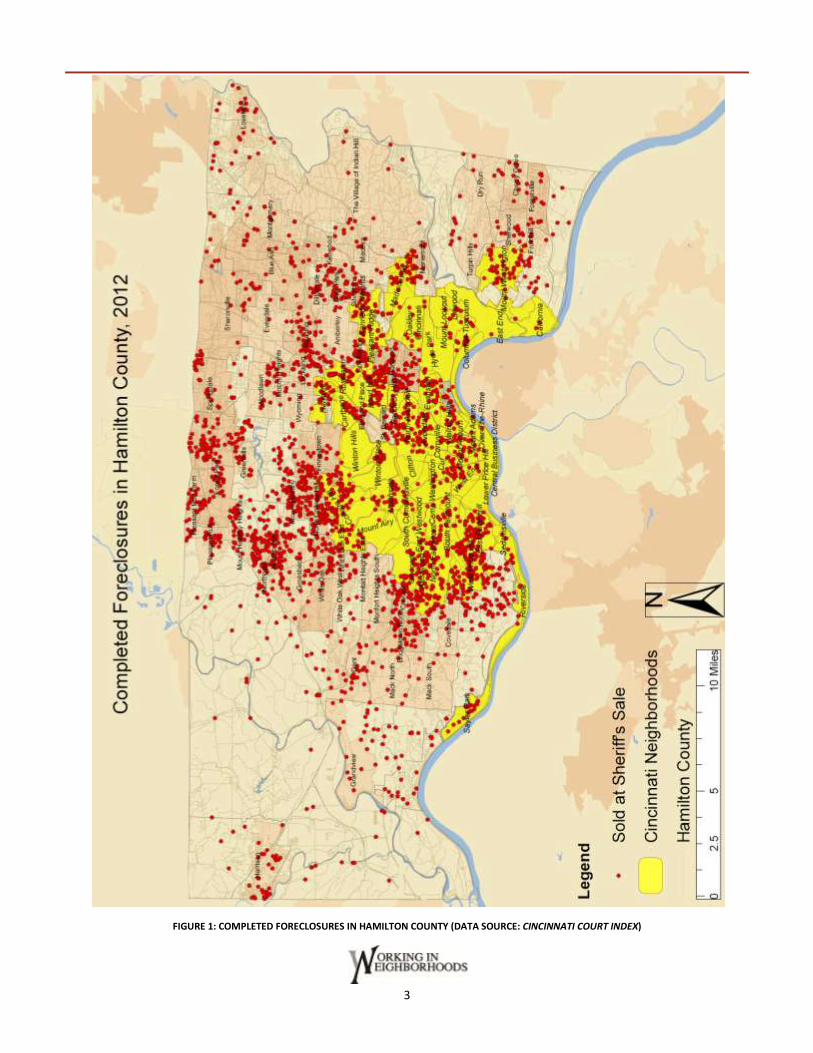
FIGURE 1: COMPLETED FORECLOSURES IN HAMILTON COUNTY (DATA SOURCE: CINCINNATI COURT INDEX)
4
MAJOR FINDINGS
The number of completed Sheriff’s Sales in Hamilton County in rose from 2,018 in 2011 to 2,931
in 2012, rising 45.2 percent
The number of Hamilton County properties sold at Sheriff’s Sale between 2006 and 2012 totaled
19,772
In the City of Cincinnati alone, there were 8,652 properties sold at Sheriff’s Sale between 2006
and 2012
The share of Hamilton County’s completed foreclosure sales occurring outside the City of
Cincinnati has risen from 45 percent in 2006 to 63 percent in 2012
Bank of America and JP Morgan Chase together seized 806 Hamilton County properties at
Sheriff’s Sale in 2012 compared to 200 properties in 2011—a combined increase of 603
properties; these two lenders alone account for two-thirds of the total increase (913) in Hamilton
County’s completed Sheriff’s Sales in 2012 over the previous year
The number of Hamilton County properties sold at Sheriff’s Sale due to property tax foreclosure
increased 162 percent between 2011 (21 properties) and 2012 (55 properties)
When WIN released our first foreclosure report in 2002, we reported that 1,371 completed Sheriff’s
Sales had occurred in Hamilton County. Since 2002, the number of completed foreclosures has
continued to rise, reaching a peak of 3,086 in 2008 and then declining over subsequent years. In 2012,
Hamilton County lost 2,931 properties at Sheriff’s Sale, 913 more than occurred the previous year. This
number is a slightly lower than the 2,940 completed Sheriff’s Sales in 2010. Sheriff’s Sale listings
(scheduled sales) increased from 3,391 in 2011 to 5,156 in 2012—a rise of 52 percent. However, the
number of Sheriff’s Sale listings in 2012 is substantially less than the 5,849 listings in 2010 (Figure 2).
Nationally, trends for new foreclosure filings in the United Sates fell by 2.7 percent between 2011 and
2012. Nonetheless, the State of Ohio experienced a 12.8 percent increase in foreclosure filings between
2011 and 2012; Ohio was one of 25 states with an increase in foreclosure activity. Hamilton County’s 5.7
percent increase in new foreclosure filings was not as dramatic as the statewide rise (Realty Trac).
Hamilton County’s increase in foreclosure activity in 2012 is disappointing, particularly given the
substantial decline that occurred in 2011. A reasonable explanation for the drop that occurred that year
is that foreclosure proceedings stalled between 2010 and 2011 while a settlement between the nation’s
five biggest lenders—Bank of America Corp., JPMorgan Chase & Co., Wells Fargo & Co., Citigroup Inc.
and Ally Financial Inc. (formerly GMAC)—and forty-nine state Attorneys General worked its way through
the courts. The case reached a conclusion in February 2012, resulting in a $25 billion judgment against
the lenders. Once the settlement was reached, foreclosure rates climbed again as banks worked through
the backlog of unresolved foreclosure cases.

5
One positive interpretation of the data is that, in comparing Hamilton County’s foreclosure activity in
2012 to 2010, the numbers appear to continue an overall downward trend from peaks that occurred
between 2008 and 2010 (Figure 2).
FIGURE 2: HAMILTON COUNTY FORECLOSURES, 2006 – 2012 (DATA SOURCES: CINCINNATI COURT INDEX; REALTY TRAC)
The map in Figure 1 (page 3) shows the geographic distribution of Hamilton County’s 2,931 completed
Sheriff’s Sales in 2012, and the graph in Figure 2 shows annual changes between 2006 and 2012.
Municipalities (excluding the City of Cincinnati) with the highest number of completed Sheriff’s Sales in
2012 include:
Colerain Township: 311
Springfield Township: 189
Green Township: 164
Forest Park: 106
Delhi Township: 94
There were 1,087 completed Sheriff’s Sales in the City of Cincinnati. Neighborhoods with the highest
foreclosure sale numbers include:
Westwood: 137
West Price Hill: 118
5876
6277
6673 6714 6556
5696 6020
4727 4946
5382 5679
5849
3391
5156
3030 3076 3086
2640 2940
2018
2931
0
1000
2000
3000
4000
5000
6000
7000
2006 2007 2008 2009 2010 2011 2012
Hamilton County Foreclosure Trends, 2006-2012
Filings
Listings
Sales
6
College Hill: 71
East Price Hill: 62
Bond Hill: 57
Foreclosures in 2012 were not evenly distributed across all communities in Hamilton County, and have
had varying impacts depending on the size of the community. Focusing on total foreclosure numbers
alone masks impacts on small communities, which are frequently overlooked. We compared completed
foreclosures to the number of housing units to get a better understanding of how foreclosures have
affected communities regardless of size.
In 2012, the top 5 most heavily impacted Hamilton County municipalities were, based on number of
completed Sheriff’s Sales/number of housing units were:
Arlington Heights (11 sales/382 units: 2.88%, or 1 in 35 homes)
North College Hill (81 sales/4,267 units: 1.90%, or 1 in 53 homes)
Golf Manor (33 sales/1,837 units: 1.80%, or 1 in 56 homes)
Addyston (8 sales/448 units: 1.79%, or 1 in 56 homes)
Mount Healthy (50 sales/3,034 units: 1.65%, or 1 in 61 homes)
Within the City of Cincinnati, the most impacted neighborhoods in 2012 were:
Columbia Tusculum (16 sales/751 units: 2.13%, or 1 in 47 homes)
Spring Grove Village (19 sales/924 units: 2.06%, or 1 in 49 homes)
California (4 sales/217 units: 1.84%, or 1 in 54 homes)
Linwood (7 sales/402 units: 1.74%, or 1 in 57 homes)
Paddock Hills (9 sales/549 units: 1.64%, or 1 in 61 homes)
Regarding the long-term cumulative effect of foreclosure and vacancy in Hamilton County between 2006
and 2012, the number of properties lost to Sheriff’s Sale has reached 19,772. The City of Cincinnati
accounts for 8,652 of these. The share of completed foreclosures outside of the City of Cincinnati has
grown from 45 percent of the one-year total in 2006 to 63 percent in 2012. In other words, the
foreclosure crisis that hit more urban, low-moderate income neighborhoods early on has increasingly
spread to the suburbs over time. More detailed information for completed foreclosure sales by
municipality and Cincinnati neighborhood can be found in the “Foreclosure in Our Communities” section
of this report, including cumulative totals and foreclosure-impact based on community size and in
Appendix B, pages 38-41.
Eight lenders completed more than one hundred Sheriff’s Sales in Hamilton County in 2012. These
include:
Bank of America (476)
J.P. Morgan Chase (327)

7
Wells Fargo (254)
US Bank (233)
Citi (203)
Fifth Third Bank (181)
Bank of New York (122)
Deutsche Bank (110)
Together, the top five banks combined were responsible for 1,493 completed foreclosures, more than
half of the year’s total (51 percent). Bank of America alone was responsible for 16.2 percent—or about
one in six—of Hamilton County’s completed foreclosures in 2012.
FORECLOSURE IN OUR COMMUNITIES Completed foreclosures sales throughout Hamilton County increased an average of 45.2 percent. That
increase was steeper in areas outside of Cincinnati’s city limits (49.8 percent) compared to the increase
within the City of Cincinnati (38.1 percent).
HAMILTON COUNTY MUNICIPALITIES
The 15 communities in Hamilton County with the highest foreclosure numbers in 2012 are shown in
Figure 3 (Complete rankings for all Hamilton County municipalities can be found in Appendix A, Table 1
on p.34). Rankings for the previous two years, followed by number of completed foreclosures for the
year in parentheses, are also provided for comparison. The rankings of the top five municipalities have
remained relatively stable over the past three years, but shifts further down the ranking are notable,
Rank Municipality 2012 Completed
Foreclosures 2011 Rank (Number) 2010 Rank (Number)
1st
Cincinnati 1087 1st
(787) 1st
(1205)
2nd
Colerain Township 311 2nd
(168) 2nd
(295)
3rd
Springfield Township 189 3rd
(133) 3rd
(201)
4th
Green Township 164 4th
(101) 4th
(145)
5th
Forest Park 106 6th
(75) 5th
(125)
6th
Delhi Township 94 5th
(76) 7th
(81)
7th
Norwood 91 8th
(56) 6th
(87)
8th
Anderson Township 86 9th
(53) 8th
(75)
9th
North College Hill 81 7th
(57) 9th
(68)
10th
Reading 56 14th
(22) 12th
(38)
11th
Mount Healthy 50 15th
(20) 15th
(30)
12th
Springdale 46 13th
(26) 18th
(25)
13th
Cheviot 44 11th
(35) 10th
(50)
14th
Harrison* 43 14th
(22) 11th
(45)
14th
Sycamore Township 43 10th
(37) 13th
(37) FIGURE 3: TOP 15 HAMILTON COUNTY MUNICIPALITIES BY NUMBER OF COMPLETED FORECLOSURES IN 2012, WITH INFORMATION FROM 2010-2011
(DATA SOURCES: CINCINNATI COURT INDEX; HAMILTON COUNTY AUDITOR) * “HARRISON” INCLUDES BOTH THE VILLAGE OF HARRISON AND HARRISON TOWNSHIP

8
particularly Reading, Mount Healthy, and Springdale. Sheriff’s Sales in some municipalities increased
sharply between 2011 and 2012. These include:
Reading—up 155 percent, from 22 sales in 2011 to 56 sales in 2012
Mount Healthy—up 150 percent, from 20 sales in 2011 to 50 sales in 2012
Harrison—up 95 percent, from 22 sales in 2011 to 43 sales in 2012
Colerain Township—up 85 percent, from 168 sales in 2011 to 311 sales in 2012
CITY OF CINCINNATI NEIGHBORHOODS
Sheriff’s Sales rose in five out of every six Cincinnati neighborhoods in 2012. The four neighborhoods
with the highest completed foreclosures in 2012 remained the same—Westwood, West Price Hill, East
Price Hill and College Hill—though College Hill and East Price Hill have switched positions for third and
fourth. Mount Washington, CUF, Avondale, Roselawn and Pleasant Ridge moved up the ranking, while
Madisonville, Evanston, and Kennedy Heights fell. Figure 4 provides more detailed information about the
top 15 Cincinnati neighborhoods by number of completed foreclosures in 2012 including additional
information from 2010 and 2011 (Complete rankings for all Cincinnati Neighborhoods can be found in
Appendix A, Table 2 on p.35).
Rank Neighborhood 2012 Completed
Foreclosures 2011 Rank (Number) 2010 Rank (Number)
1st
Westwood 137 1st
(103) 1st
(137)
2nd
West Price Hill 118 2nd
(80) 2nd
(118)
3rd
College Hill 71 4th
(48) 5th
(67)
4th
East Price Hill 62 3rd
(54) 3rd
(83)
5th
Bond Hill 57 5th
(42) 8th
(43)
6th
Avondale 49 7th
(31) 11th
(37)
7th
Madisonville 47 6th
(35) 4th
(78)
8th
Mt. Washington 43 11th
(21) 13th
(31)
9th
Northside 35 9th
(29) 6th
(56)
10th
Roselawn 34 14th
(20) 9th
(42)
11th
Mt. Airy 31 11th
(21) 7th
(46)
12th
CUF 30 20th
(12) 20th
(18)
13th
Evanston 28 8th
(30) 10th
(40)
14th
Kennedy Heights 24 11th
(21) 12th
(34)
15th
North Avondale 22 17th
(18) 13th
(31)
15th
Pleasant Ridge 22 16th
(19) 17th
(24) FIGURE 4: TOP 15 CINCINNATI NEIGHBORHOODS, COMPLETED FORECLOSURES 2012, WITH INFORMATION FROM 2010-2011
(DATA SOURCES: CINCINNATI COURT INDEX; HAMILTON COUNTY AUDITOR)
CUMULATIVE FORECLOSURE IMPACTS IN HAMILTON COUNTY AND THE CITY OF CINCINNATI
HAMILTON COUNTY FORECLOSURE TOTALS, 2006-2012
Between 2006 and 2012, Hamilton County lost 19,721 properties to foreclosure. The table in Figure 5
shows the fifteen Hamilton County municipalities where the highest numbers of completed foreclosures
occurred between 2006 and 2012, excluding the City of Cincinnati.
9
Rank City/Township 2012 2011 2010 2009 2008 2007 2006 Total 2006-2012
1 Colerain Township 311 168 295 229 315 267 233 1,818
2 Springfield Township 189 133 201 124 217 197 174 1,235
3 Green Township 164 101 145 121 147 114 85 877
4 Forest Park 106 75 125 79 137 143 133 798
5 Norwood 91 56 87 64 94 91 97 580
6 Delhi Township 94 76 81 58 81 72 74 536
7 North College Hill 81 57 68 89 67 78 75 515
8 Anderson Township 86 53 75 56 47 49 42 408
9 Cheviot 44 35 50 132 43 56 37 397
10 Sycamore Township 43 37 37 46 32 48 40 283
11 Harrison* 43 22 45 31 42 43 33 259
12 Mount Healthy 50 20 30 20 37 37 33 227
13 Reading 56 22 38 30 20 30 24 220
14 Golf Manor 33 29 28 23 36 42 28 219
15 Springdale 46 26 25 36 33 25 26 217 FIGURE 5: HAMILTON COUNTY MUNICIPALITIES (EXCLUDING THE CITY OF CINCINNATI) WITH MOST COMPLETED FORECLOSURES FROM 2006-2012
(DATA SOURCE: CINCINNATI COURT INDEX) * “HARRISON” INCLUDES BOTH THE VILLAGE OF HARRISON AND HARRISON TOWNSHIP
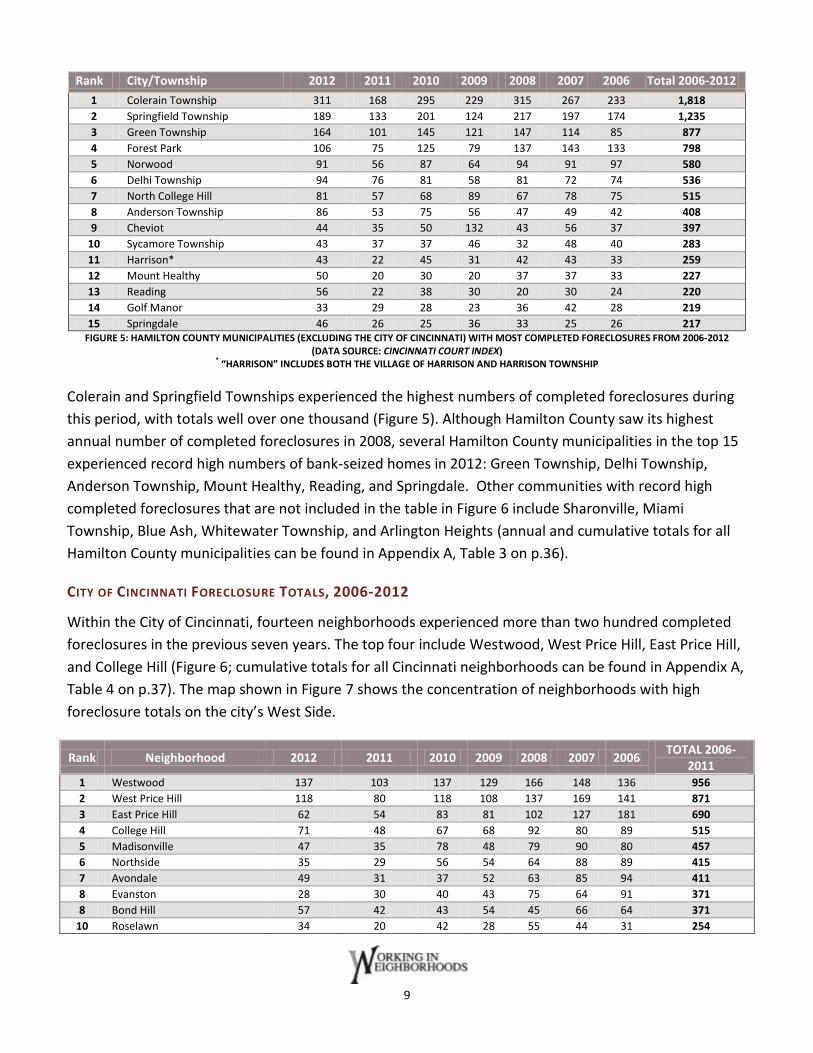
Colerain and Springfield Townships experienced the highest numbers of completed foreclosures during
this period, with totals well over one thousand (Figure 5). Although Hamilton County saw its highest
annual number of completed foreclosures in 2008, several Hamilton County municipalities in the top 15
experienced record high numbers of bank-seized homes in 2012: Green Township, Delhi Township,
Anderson Township, Mount Healthy, Reading, and Springdale. Other communities with record high
completed foreclosures that are not included in the table in Figure 6 include Sharonville, Miami
Township, Blue Ash, Whitewater Township, and Arlington Heights (annual and cumulative totals for all
Hamilton County municipalities can be found in Appendix A, Table 3 on p.36).
CITY OF CINCINNATI FORECLOSURE TOTALS, 2006-2012
Within the City of Cincinnati, fourteen neighborhoods experienced more than two hundred completed
foreclosures in the previous seven years. The top four include Westwood, West Price Hill, East Price Hill,
and College Hill (Figure 6; cumulative totals for all Cincinnati neighborhoods can be found in Appendix A,
Table 4 on p.37). The map shown in Figure 7 shows the concentration of neighborhoods with high
foreclosure totals on the city’s West Side.
Rank Neighborhood 2012 2011 2010 2009 2008 2007 2006 TOTAL 2006-
2011 1 Westwood 137 103 137 129 166 148 136 956
2 West Price Hill 118 80 118 108 137 169 141 871
3 East Price Hill 62 54 83 81 102 127 181 690
4 College Hill 71 48 67 68 92 80 89 515
5 Madisonville 47 35 78 48 79 90 80 457
6 Northside 35 29 56 54 64 88 89 415
7 Avondale 49 31 37 52 63 85 94 411
8 Evanston 28 30 40 43 75 64 91 371
8 Bond Hill 57 42 43 54 45 66 64 371
10 Roselawn 34 20 42 28 55 44 31 254

10
11 Mount Auburn 19 24 30 29 44 41 46 233
12 South Fairmount 15 6 18 40 33 45 70 227
13 Mount Airy 31 21 46 36 33 32 21 220
14 Kennedy Heights 24 21 34 21 21 36 45 202 FIGURE 6: CINCINNATI NEIGHBORHOODS WITH MORE THAN 200 COMPLETED FORECLOSURES BETWEEN 2006-2012
(DATA SOURCES: CINCINNATI COURT INDEX; HAMILTON COUNTY AUDITOR)
FIGURE 7: COMPLETED FORECLOSURES IN CINCINNATI NEIGHBORHOODS BETWEEN JAN., 2006-DEC. 2012
(DATA SOURCES: CINCINNATI COURT INDEX; HAMILTON COUNTY AUDITOR)
FORECLOSURE IMPACT BY COMMUNITY SIZE—2012
Tracking the total number of completed foreclosures by municipality and neighborhood does not take
into consideration the significant differences in population and housing units within each community.
The impact of ten foreclosures in a township of 24,000 homes is very different than it would be in a
village of 400 homes. For this reason, we compared 2010 US Census information (number of housing
units) to the number of completed foreclosures for each municipality and neighborhood to study
community impact in a way that allowed us to compare communities of different sizes.
This simple ratio does not take every important variable into account, however. A community’s vacancy
rate, homeownership rate, or whether “housing units” are single-family homes or multi-family
apartments, for example, are also important factors. These limitations aside, the “impact ratio” does
allow for consideration of a community’s size and the relative impact of foreclosure on it.

11
HAMILTON COUNTY FORECLOSURE IMPACT, 2012
The table in Figure 8 shows the top 15 Hamilton County municipalities ranked by estimated foreclosure
impact. These communities range in size from tiny Arlington Heights (382 housing units) to sprawling
Colerain Township (24,015 housing units). This table includes many of the same communities included in
the top 15 for total completed Sheriff’s Sales, but also includes much smaller, though still heavily
impacted, communities that would otherwise be overlooked, such as Arlington Heights, Golf Manor,
Saint Bernard, Lockland, Silverton, and Cleves (2012 Foreclosure impacts for all Hamilton County
municipalities can be found in Appendix B, Table 1 on p.38).
Rank City/Township 2012 Completed
Foreclosures Total Housing Units,
2010 US Census Estimated One-Year Foreclosure Impact
1 Arlington Heights 11 382 2.88%
2 North College Hill 81 4,267 1.90%
3 Golf Manor 33 1,837 1.80%
4 Addyston 8 448 1.79%
5 Mount Healthy 50 3,034 1.65%
6 Forest Park 106 7,854 1.35%
7 Saint Bernard 28 2,128 1.32%
8 Colerain Township 311 24,015 1.30%
9 Springfield Township 189 15,091 1.25%
10 Lockland 20 1,738 1.15%
11 Reading 56 4,962 1.13%
12 Harrison* 43 4,054 1.06%
13 Silverton 27 2,626 1.03%
14 Cheviot 44 4,303 1.02%
15 Cleves 12 1,190 1.01% FIGURE 8: TOP 15 IMPACTED HAMILTON COUNTY COMMUNITIES, BASED ON NUMBER OF HOUSING UNITS
(DATA SOURCES: CINCINNATI COURT INDEX; HAMILTON COUNTY AUDITOR; 2010 US CENSUS) * “HARRISON” INCLUDES BOTH THE VILLAGE OF HARRISON AND HARRISON TOWNSHIP
CITY OF CINCINNATI NEIGHBORHOOD IMPACT, 2012
Cincinnati’s 52 neighborhoods vary widely by population and housing units. Figure 9 ranks 15 City of
Cincinnati neighborhoods by completed foreclosures as a percentage of total housing units (2012
Foreclosure impacts for all Cincinnati neighborhoods can be found in Appendix B, Table 2 on p.39). The
fifteen most heavily impacted neighborhoods range from California’s 217 housing units to West Price
Hill’s 8,154. Many of the neighborhoods with the highest total completed foreclosure sales in 2012 are
also seen here, including West Price Hill, College Hill and Bond Hill. However, neighborhoods with fewer
than 1,000 housing units filled the top five slots—Columbia Tusculum, Spring Grove Village, California,
Paddock Hills, and South Cumminsville—highlighting heavy impacts on small neighborhoods that we
would have otherwise overlooked.

12
Rank Neighborhood 2012 Completed
Foreclosures Total Housing Units,
2010 US Census Estimated One-Year Foreclosure Impact
1 Columbia Tusculum 16 751 2.13%
2 Spring Grove Village 19 924 2.06%
3 California 4 217 1.84%
4 Linwood 7 402 1.74%
5 Paddock Hills 9 549 1.64%
6 Carthage 21 1,298 1.62%
7 Bond Hill 57 3,546 1.61%
8 West Price Hill 118 8,154 1.45%
9 South Cumminsville 6 422 1.42%
10 Sayler Park 18 1,287 1.40%
11 North Avondale 22 1,784 1.23%
12 South Fairmount 15 1,344 1.12%
13 College Hill 71 7,102 1.00%
14 Roselawn 34 3,474 0.98%
15 Kennedy Heights 24 2,581 0.93% FIGURE 9: TOP 15 IMPACTED CITY OF CINCINNATI NEIGHBORHOODS, BASED ON NUMBER OF HOUSING UNITS
(DATA SOURCES: CINCINNATI COURT INDEX; HAMILTON COUNTY AUDITOR; 2010 US CENSUS)
CUMULATIVE FORECLOSURE IMPACT BY COMMUNITY SIZE
We ranked communities based on cumulative foreclosure numbers (2006-2012) after applying our
simple “impact ratio” (number of completed foreclosure sales/total housing units). When we saw the
communities at the top our list, we saw that they also experienced the largest population declines in the
last decade and have the highest vacancy rates in the County (2010 US Census Data).
HAMILTON COUNTY FORECLOSURE IMPACT, 2006-2012
The effects of years of high foreclosure rates have built up over time. Figure 10 ranks Hamilton County
municipalities based on both foreclosure sales relative to the size of the community and the cumulative
number of foreclosures occurring there since 2006. North College Hill, Golf Manor, and Elmwood Place,
Addyston, Cleves, and Forest Park have experienced so many foreclosures over the last seven years that
the number is equivalent to more than ten percent of the total housing units in those communities (the
cumulative foreclosure impact for all Hamilton County municipalities can be found in Appendix B, Table
3 on p.40).
Rank City/Township Total Completed
Foreclosures, 2006-2012 Total Housing Units,
2010 US Census 7-year Impact
2006-2012 1 North College Hill 515 4,267 12.07%
2 Golf Manor 219 1,837 11.92%
3 Elmwood Place 124 1,099 11.28%
4 Addyston 49 448 10.94%
5 Cleves 127 1,190 10.67%
6 Forest Park 798 7,854 10.16%
7 Cheviot 397 4,303 9.23%
8 Arlington Heights 33 382 8.64%
9 Saint Bernard 179 2,128 8.41%
10 Springfield Township 1,235 15,091 8.18%
11 Lockland 139 1,738 8.00%
12 Colerain Township 1,818 24,015 7.57%
13
13 Mount Healthy 227 3,034 7.48%
14 Lincoln Heights 115 1,564 7.35%
15 Fairfax 56 778 7.20% FIGURE 10: TOP 15 HAMILTON COUNTY MUNICIPALITIES WITH HIGHEST RATE OF COMPLETED FORECLOSURES BETWEEN 2006-2012
(DATA SOURCES: CINCINNATI COURT INDEX; HAMILTON COUNTY AUDITOR; 2010 US CENSUS)
CITY OF CINCINNATI FORECLOSURE IMPACT, 2006-2012
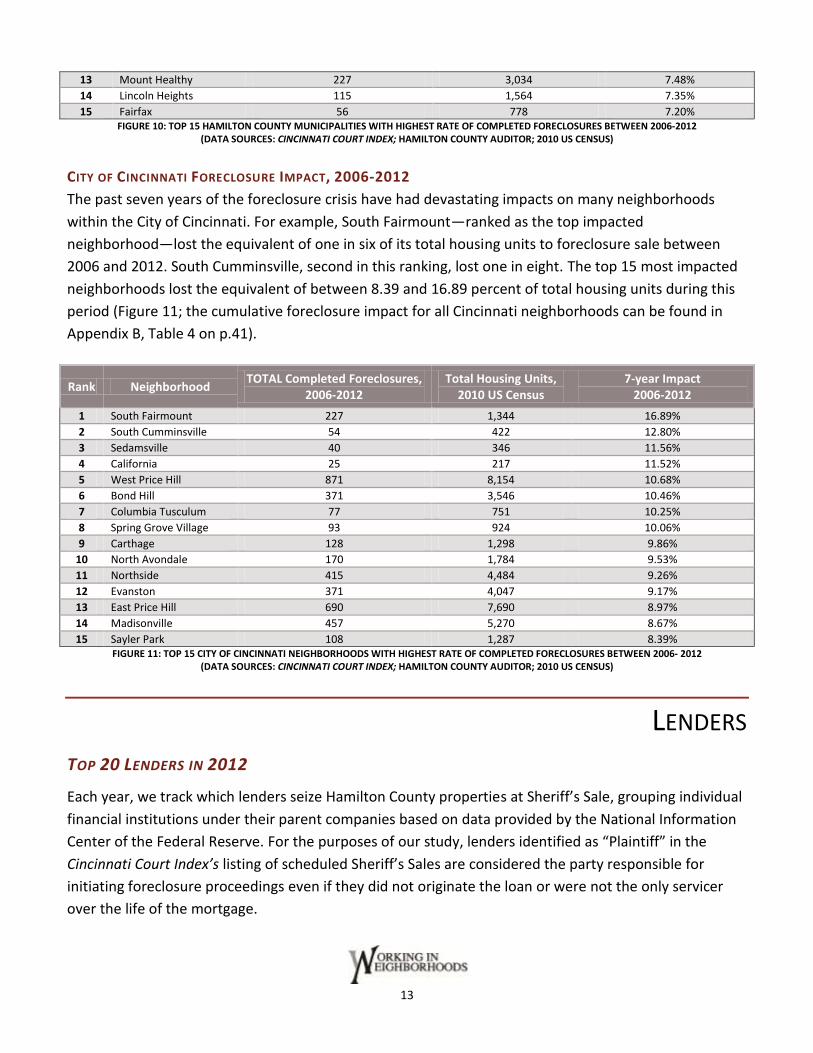
The past seven years of the foreclosure crisis have had devastating impacts on many neighborhoods
within the City of Cincinnati. For example, South Fairmount—ranked as the top impacted
neighborhood—lost the equivalent of one in six of its total housing units to foreclosure sale between
2006 and 2012. South Cumminsville, second in this ranking, lost one in eight. The top 15 most impacted
neighborhoods lost the equivalent of between 8.39 and 16.89 percent of total housing units during this
period (Figure 11; the cumulative foreclosure impact for all Cincinnati neighborhoods can be found in
Appendix B, Table 4 on p.41).
Rank Neighborhood TOTAL Completed Foreclosures,
2006-2012 Total Housing Units,
2010 US Census 7-year Impact
2006-2012
1 South Fairmount 227 1,344 16.89%
2 South Cumminsville 54 422 12.80%
3 Sedamsville 40 346 11.56%
4 California 25 217 11.52%
5 West Price Hill 871 8,154 10.68%
6 Bond Hill 371 3,546 10.46%
7 Columbia Tusculum 77 751 10.25%
8 Spring Grove Village 93 924 10.06%
9 Carthage 128 1,298 9.86%
10 North Avondale 170 1,784 9.53%
11 Northside 415 4,484 9.26%
12 Evanston 371 4,047 9.17%
13 East Price Hill 690 7,690 8.97%
14 Madisonville 457 5,270 8.67%
15 Sayler Park 108 1,287 8.39% FIGURE 11: TOP 15 CITY OF CINCINNATI NEIGHBORHOODS WITH HIGHEST RATE OF COMPLETED FORECLOSURES BETWEEN 2006- 2012
(DATA SOURCES: CINCINNATI COURT INDEX; HAMILTON COUNTY AUDITOR; 2010 US CENSUS)
LENDERS TOP 20 LENDERS IN 2012
Each year, we track which lenders seize Hamilton County properties at Sheriff’s Sale, grouping individual
financial institutions under their parent companies based on data provided by the National Information
Center of the Federal Reserve. For the purposes of our study, lenders identified as “Plaintiff” in the
Cincinnati Court Index’s listing of scheduled Sheriff’s Sales are considered the party responsible for
initiating foreclosure proceedings even if they did not originate the loan or were not the only servicer
over the life of the mortgage.

14
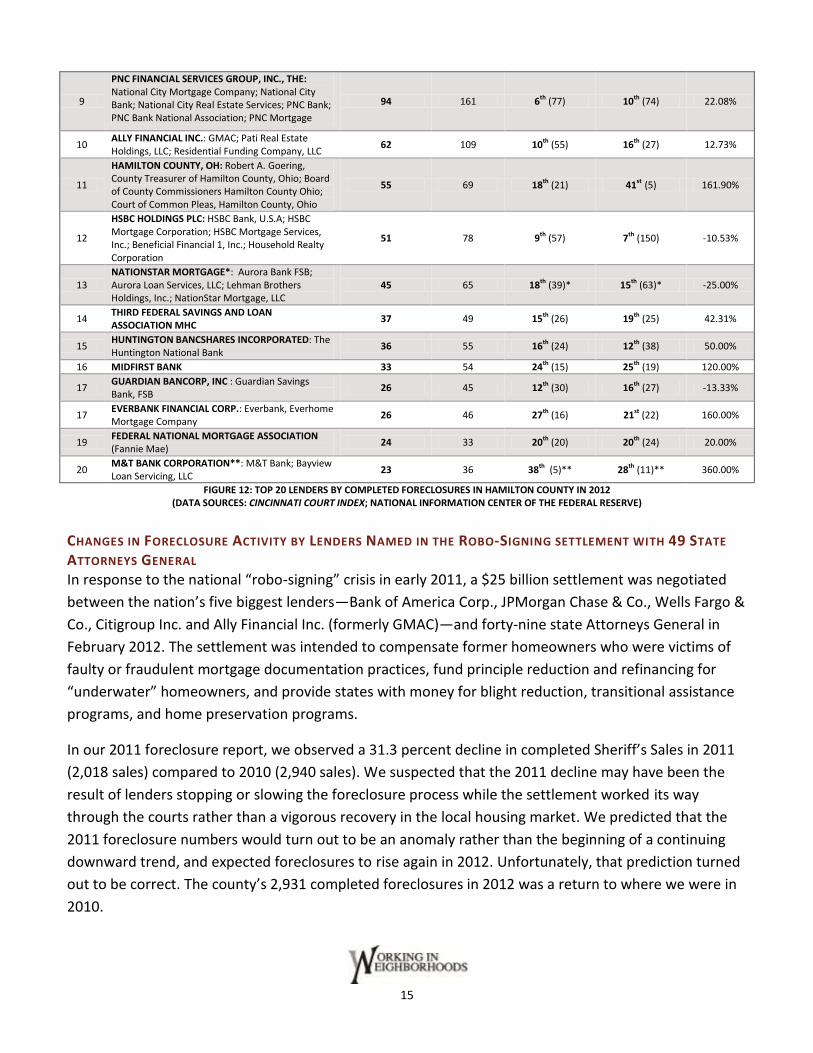
The table shown in Figure 12 shows the 20 lenders that completed the most Sheriff’s Sales in 2012, with
additional information on the number of Sheriff’s Sale listings and total sales in 2010 and 2011. Two
lenders in particular showed striking increases in the number of foreclosures completed in 2012
compared to 2011. Bank of America, which completed 163 Sheriff’s Sales in 2011, nearly tripled that
number in 2012 to 476. Completed Sheriff’s Sales by JP Morgan Chases increased 784 percent, from 37
to 327 completed foreclosure sales. Wells Fargo, Bank of New York Mellon and Deutsche Bank increased
their completed foreclosures by 40 percent or more in 2012 (the complete list of all Lenders completing
five or more Sheriff’s Sales in 2012 can be found in Appendix C, pp. 42-44).
We also observed a steep rise in Hamilton County tax foreclosure sales in 2012, from 21 in 2011 to 55 in
2012; there were only 5 in 2010. How are seniors and other homeowners on fixed incomes impacted? At
this time, we do not know what accounts for this increase and more information is needed to
understand this trend.
Rank Lending Institution
2012 Completed Foreclosure
Sales
2012 Sheriff's
Sales Listed
2011 Ranking (Completed
Foreclosures)
2010 Ranking (Completed
Foreclosures)
% Change 2011 to
2012
1
BANK OF AMERICA CORPORATION: BAC Home Loan Servicing; Bank of America; Bank of America National Association; Countrywide Home Loans Servicing, L.P.; Countrywide Bank FSB; LaSalle Bank Midwest; LaSalle Bank National Association; Nationscredit Financial Services Corporation
476 814 5th (163) 2nd (362) 192.02%
2
JPMORGAN CHASE & CO: Chase Home Finance, LLC; Chase Manhattan Mortgage Company; EMC Mortgage Corporation; J.P. Morgan Chase Bank, N.A.; J.P. Morgan Mortgage Acquisition Corporation; JPMC Specialty Mortgage, LLC; Plymouth Park Tax Services, Inc.; Washington Mutual Bank, FA
327 667 11th (37) 5th (184) 783.78%
3
WELLS FARGO BANK, NATIONAL ASSOCIATION; Wachovia Bank of Delaware; Wachovia Mortgage; Wells Fargo Bank; Wells Fargo Bank Minnesota; Wells Fargo Financial Ohio 1, Inc.; Wells Fargo Financial Ohio, Inc.
254 476 4th (177) 4th (272) 43.50%
4 U.S. BANK NATIONAL ASSOCIATION; U.S. Bank; The Leader Mortgage Company; Firstar Bank, N.A.
233 505 1st (279) 1st (379) -16.49%
5
CITIGROUP INC: Citi Bank, N.A.; Citicorp Trust Bank FSB; CitiFinancial, Inc.; CitiFinancial Mortgage Company, Inc.; CitiMortgage Inc.; ABN AMRO Mortgage Group, Inc.
203 359 2nd (208) 3rd (324) -2.40%
6
FIFTH THIRD BANCORP: Fifth Third Bank; Fifth Third Bank Madisonville Operations; Fifth Third Mortgage Company; CitFed Mortgage Corporation; Enterprise Federal Savings Bank
181 275 3rd (187) 6th (174) -3.21%
7
BANK OF NEW YORK MELLON CORPORATION, THE: The Bank of New York; Bank of New York Mellon Trust Co.; The Bank of New York Mellon; SAMI 2004-AR6 Bank of New York; The Bank of New York Trust Company, N.A.
122 280 6th (77) 9th (88) 58.44%
8
DEUTSCHE BANK AKTIENGESELLSCHAFT: Deutsche Bank; Deutsche Bank National Trust Company; Deutsche Trustee Company Limited; Deutsche Bank National Trust Company Series FF
110 235 6th (77) 8th (127) 42.86%
15
CHANGES IN FORECLOSURE ACTIVITY BY LENDERS NAMED IN THE ROBO-SIGNING SETTLEMENT WITH 49 STATE
ATTORNEYS GENERAL In response to the national “robo-signing” crisis in early 2011, a $25 billion settlement was negotiated
between the nation’s five biggest lenders—Bank of America Corp., JPMorgan Chase & Co., Wells Fargo &
Co., Citigroup Inc. and Ally Financial Inc. (formerly GMAC)—and forty-nine state Attorneys General in
February 2012. The settlement was intended to compensate former homeowners who were victims of
faulty or fraudulent mortgage documentation practices, fund principle reduction and refinancing for
“underwater” homeowners, and provide states with money for blight reduction, transitional assistance
programs, and home preservation programs.
In our 2011 foreclosure report, we observed a 31.3 percent decline in completed Sheriff’s Sales in 2011
(2,018 sales) compared to 2010 (2,940 sales). We suspected that the 2011 decline may have been the
result of lenders stopping or slowing the foreclosure process while the settlement worked its way
through the courts rather than a vigorous recovery in the local housing market. We predicted that the
2011 foreclosure numbers would turn out to be an anomaly rather than the beginning of a continuing
downward trend, and expected foreclosures to rise again in 2012. Unfortunately, that prediction turned
out to be correct. The county’s 2,931 completed foreclosures in 2012 was a return to where we were in
2010.
9
PNC FINANCIAL SERVICES GROUP, INC., THE: National City Mortgage Company; National City Bank; National City Real Estate Services; PNC Bank; PNC Bank National Association; PNC Mortgage
94 161 6th (77) 10th (74) 22.08%
10 ALLY FINANCIAL INC.: GMAC; Pati Real Estate Holdings, LLC; Residential Funding Company, LLC
62 109 10th (55) 16th (27) 12.73%
11
HAMILTON COUNTY, OH: Robert A. Goering, County Treasurer of Hamilton County, Ohio; Board of County Commissioners Hamilton County Ohio; Court of Common Pleas, Hamilton County, Ohio
55 69 18th (21) 41st (5) 161.90%
12
HSBC HOLDINGS PLC: HSBC Bank, U.S.A; HSBC Mortgage Corporation; HSBC Mortgage Services, Inc.; Beneficial Financial 1, Inc.; Household Realty Corporation
51 78 9th (57) 7th (150) -10.53%
13 NATIONSTAR MORTGAGE*: Aurora Bank FSB; Aurora Loan Services, LLC; Lehman Brothers Holdings, Inc.; NationStar Mortgage, LLC
45 65 18th (39)* 15th (63)* -25.00%
14 THIRD FEDERAL SAVINGS AND LOAN ASSOCIATION MHC
37 49 15th (26) 19th (25) 42.31%
15 HUNTINGTON BANCSHARES INCORPORATED: The Huntington National Bank
36 55 16th (24) 12th (38) 50.00%
16 MIDFIRST BANK 33 54 24th (15) 25th (19) 120.00%
17 GUARDIAN BANCORP, INC : Guardian Savings Bank, FSB
26 45 12th (30) 16th (27) -13.33%
17 EVERBANK FINANCIAL CORP.: Everbank, Everhome Mortgage Company
26 46 27th (16) 21st (22) 160.00%
19 FEDERAL NATIONAL MORTGAGE ASSOCIATION (Fannie Mae)
24 33 20th (20) 20th (24) 20.00%
20 M&T BANK CORPORATION**: M&T Bank; Bayview Loan Servicing, LLC
23 36 38th (5)** 28th (11)** 360.00%
FIGURE 12: TOP 20 LENDERS BY COMPLETED FORECLOSURES IN HAMILTON COUNTY IN 2012 (DATA SOURCES: CINCINNATI COURT INDEX; NATIONAL INFORMATION CENTER OF THE FEDERAL RESERVE)

16
When we isolated the five lenders involved in the AG settlement in February of 2012—Bank of America,
JP Morgan Chase, Wells Fargo, Citi, and Ally Financial—we found that completed foreclosures by these
lenders in 2011 (before the settlement) totaled 640, or 31.7 percent of the 2,018 completed
foreclosures that year. In 2012, these five lenders completed 1,322 foreclosure sales—increasing by
106.5 percent over 2011. The 642 additional foreclosures completed by the five lenders involved in the
AG settlement accounted for 74.8 percent of the overall rise of completed foreclosures in Hamilton
County in 2012. Increased foreclosures by two lenders in particular—Bank of America and JP Morgan
Chase—contributed the most additional foreclosures to this share–603, or two-thirds of the total
increase in foreclosure sales in Hamilton County in 2012 (Figure 13).
FIGURE 13: (DATA SOURCES: CINCINNATI COURT INDEX; NATIONAL INFORMATION CENTER OF THE FEDERAL RESERVE)
CUMULATIVE FORECLOSURE ACTIVITY BETWEEN 2006 AND 2012: TOP 10 LENDERS
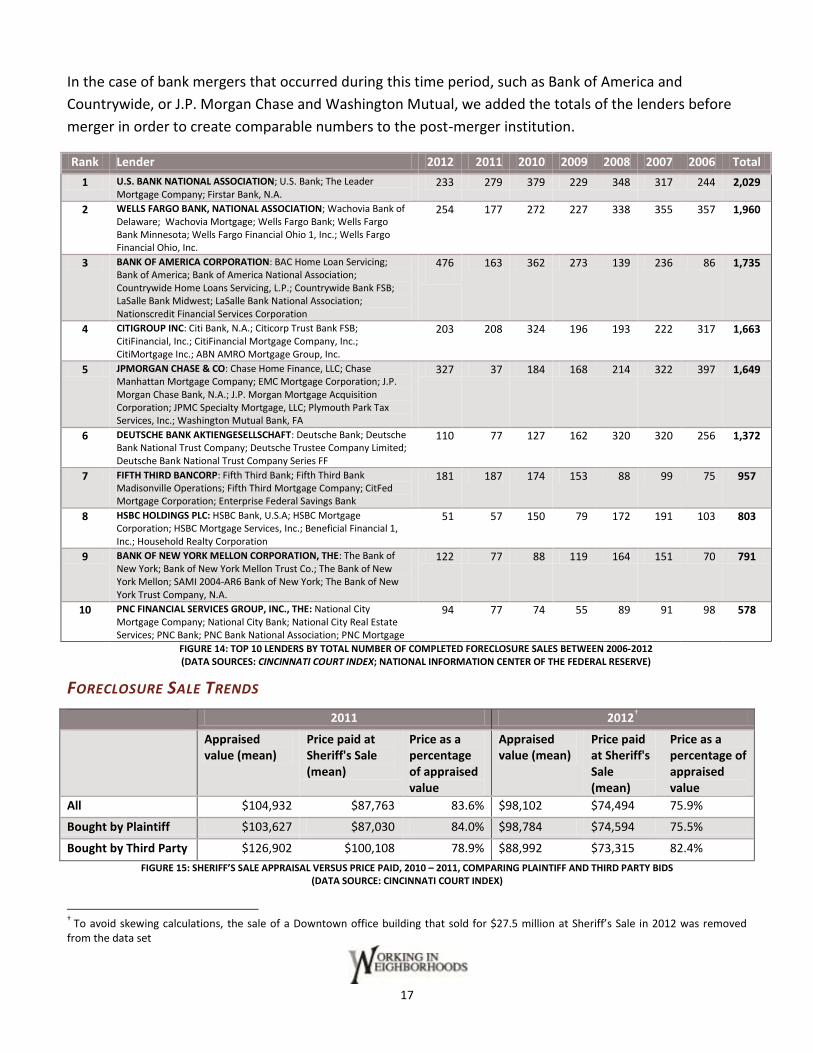
The table in Figure 14 ranks lenders by their total number of completed foreclosures between 2006 and
2012. Over this period, US Bank seized over 2,000 properties at Sheriff’s Sale in Hamilton County. An
additional five lenders seized more than 1,000: Wells Fargo (1,960); Bank of America (1,735); CitiGroup
(1,663); JP Morgan Chase (1,649) and Deutsche Bank (1,372). The top ten banks completed 13,537
Sheriff’s Sales in Hamilton County between 2006 and 2012, accounting for 68.5 percent of all completed
foreclosures during this time.
Bank of America 313
34.3%
JP Morgan Chase 290
31.8%
Wells Fargo Bank 77
8.4%
Citigroup 0
0.0%
Ally Financial, Inc 7
0.8%
All Other Lenders 226
24.8%
Share of Increase in Completed Sheriff's Sales between 2011 and 2012 by Lender
17
In the case of bank mergers that occurred during this time period, such as Bank of America and
Countrywide, or J.P. Morgan Chase and Washington Mutual, we added the totals of the lenders before
merger in order to create comparable numbers to the post-merger institution.
Rank Lender 2012 2011 2010 2009 2008 2007 2006 Total
1 U.S. BANK NATIONAL ASSOCIATION; U.S. Bank; The Leader Mortgage Company; Firstar Bank, N.A.
233 279 379 229 348 317 244 2,029
2 WELLS FARGO BANK, NATIONAL ASSOCIATION; Wachovia Bank of Delaware; Wachovia Mortgage; Wells Fargo Bank; Wells Fargo Bank Minnesota; Wells Fargo Financial Ohio 1, Inc.; Wells Fargo Financial Ohio, Inc.
254 177 272 227 338 355 357 1,960
3 BANK OF AMERICA CORPORATION: BAC Home Loan Servicing; Bank of America; Bank of America National Association; Countrywide Home Loans Servicing, L.P.; Countrywide Bank FSB; LaSalle Bank Midwest; LaSalle Bank National Association; Nationscredit Financial Services Corporation
476
163 362 273 139 236 86 1,735
4 CITIGROUP INC: Citi Bank, N.A.; Citicorp Trust Bank FSB; CitiFinancial, Inc.; CitiFinancial Mortgage Company, Inc.; CitiMortgage Inc.; ABN AMRO Mortgage Group, Inc.
203 208 324 196 193 222 317 1,663
5 JPMORGAN CHASE & CO: Chase Home Finance, LLC; Chase Manhattan Mortgage Company; EMC Mortgage Corporation; J.P. Morgan Chase Bank, N.A.; J.P. Morgan Mortgage Acquisition Corporation; JPMC Specialty Mortgage, LLC; Plymouth Park Tax Services, Inc.; Washington Mutual Bank, FA
327 37 184 168 214 322 397 1,649
6 DEUTSCHE BANK AKTIENGESELLSCHAFT: Deutsche Bank; Deutsche Bank National Trust Company; Deutsche Trustee Company Limited; Deutsche Bank National Trust Company Series FF
110 77 127 162 320 320 256 1,372
7 FIFTH THIRD BANCORP: Fifth Third Bank; Fifth Third Bank Madisonville Operations; Fifth Third Mortgage Company; CitFed Mortgage Corporation; Enterprise Federal Savings Bank
181 187 174 153 88 99 75 957
8 HSBC HOLDINGS PLC: HSBC Bank, U.S.A; HSBC Mortgage Corporation; HSBC Mortgage Services, Inc.; Beneficial Financial 1, Inc.; Household Realty Corporation
51 57 150 79 172 191 103 803
9 BANK OF NEW YORK MELLON CORPORATION, THE: The Bank of New York; Bank of New York Mellon Trust Co.; The Bank of New York Mellon; SAMI 2004-AR6 Bank of New York; The Bank of New York Trust Company, N.A.
122 77 88 119 164 151 70 791
10 PNC FINANCIAL SERVICES GROUP, INC., THE: National City Mortgage Company; National City Bank; National City Real Estate Services; PNC Bank; PNC Bank National Association; PNC Mortgage
94 77 74 55 89 91 98 578
FIGURE 14: TOP 10 LENDERS BY TOTAL NUMBER OF COMPLETED FORECLOSURE SALES BETWEEN 2006-2012 (DATA SOURCES: CINCINNATI COURT INDEX; NATIONAL INFORMATION CENTER OF THE FEDERAL RESERVE)
FORECLOSURE SALE TRENDS
† To avoid skewing calculations, the sale of a Downtown office building that sold for $27.5 million at Sheriff’s Sale in 2012 was removed
from the data set
2011 2012†
Appraised value (mean)
Price paid at Sheriff's Sale (mean)
Price as a percentage of appraised value
Appraised value (mean)
Price paid at Sheriff's Sale (mean)
Price as a percentage of appraised value
All $104,932 $87,763 83.6% $98,102 $74,494 75.9%
Bought by Plaintiff $103,627 $87,030 84.0% $98,784 $74,594 75.5%
Bought by Third Party $126,902 $100,108 78.9% $88,992 $73,315 82.4%
FIGURE 15: SHERIFF’S SALE APPRAISAL VERSUS PRICE PAID, 2010 – 2011, COMPARING PLAINTIFF AND THIRD PARTY BIDS (DATA SOURCE: CINCINNATI COURT INDEX)

18
In 2010, WIN began tracking additional sales information about foreclosed properties in Hamilton
County, including the appraisal value of properties listed for Sheriff’s Sale and the final sale amount of
those sold. The table in Figure 15 shows the mean appraised value of all Hamilton County properties
sold at Sheriff’s Sale declined from $104,932 in 2011 to $98,102 in 2012 (6.5%). The mean price paid at
Sheriff’s Sale for all properties fell from $87,763 in 2011 to $74,494 in 2012 (15.1%).
The Plaintiff, or entity that initiated the foreclosure proceedings (generally the lender or loan servicer),
purchased 92.1 percent of all properties sold at Sheriff’s Sale in 2012. Properties purchased by the
plaintiff are known as “real estate owned” properties, or REOs. In past years, only about 5% of
properties sold at Sheriff’s Sale were purchased by third-party buyers. The increase to nearly 8% in 2012
is notable.
The mean appraisal value of homes purchased by the plaintiff (REOs) fell 4.7 percent between 2011 and
2012, from $103,627 to $98,784. The mean appraised value of properties purchased by a third party at
Sheriff’s Sale fell more steeply, from $126,902 to $88,992 a decline of 29.9 percent between 2011 and
2012 (Figure 15).
SHERIFF’S SALE RE-LISTINGS
For the last four years, WIN continues to monitor a particular lender behavior: “re-listing.” Many
properties listed for Sheriff’s Sale are withdrawn and relisted multiple times over the course of a year. Of
the 5,156 Sheriff’s Sales scheduled and published in the Court Index, or “listed”, there were 702
properties that were withdrawn and then “relisted” at least once over the course of 2012. This number
does not include duplicate listings carried over from previous years. Figure 16 shows the total Sheriff’s
Sale listings, the number of unique properties scheduled for Sheriff’s Sale and the total sales for lenders
with 50 or more completed Sheriff’s Sales in Hamilton County in 2012.
Lender Listings Unique
Properties Sales
%Unique Properties
Unsold
#Re-listings
%Duplicate Listings
U.S. BANK NATIONAL ASSOCIATION; U.S. Bank; The Leader Mortgage Company; Firstar Bank, N.A.
505 389 233 40.10% 116 22.97%
BANK OF NEW YORK MELLON CORPORATION, THE: The Bank of New York; Bank of New York Mellon Trust Co.; The Bank of New York Mellon; SAMI 2004-AR6 Bank of New York; The Bank of New York Trust Company, N.A.
280 201 122 39.30% 79 28.21%
DEUTSCHE BANK AKTIENGESELLSCHAFT: Deutsche Bank; Deutsche Bank National Trust Company; Deutsche Trustee Company Limited; Deutsche Bank National Trust Company Series FF
235 180 110 38.89% 55 23.40%
WELLS FARGO BANK, NATIONAL ASSOCIATION; Wachovia Bank of Delaware; Wachovia Mortgage; Wells Fargo Bank; Wells Fargo Bank Minnesota; Wells Fargo Financial Ohio 1, Inc.; Wells Fargo Financial Ohio, Inc.
476 401 254 36.66% 75 15.76%
JPMORGAN CHASE & CO: Chase Home Finance, LLC; Chase Manhattan Mortgage Company; EMC Mortgage Corporation; J.P. Morgan Chase Bank, N.A.; J.P. Morgan Mortgage Acquisition Corporation; JPMC Specialty Mortgage, LLC; Plymouth Park Tax Services, Inc.; Washington Mutual Bank, FA
667 500 327 34.60% 167 25.04%

19
One potential outcome of withdrawn Sheriff’s Sales is described in a recent Reuter’s article (“Special
Report: The latest foreclosure horror: the zombie title.” Reuters. January 10, 2013), in which Michelle
Conlin writes about thousands of homeowners “finding themselves legally liable for houses they didn't
know they still owned after banks decided it wasn't worth their while to complete foreclosures on
them.” Conlin describes how homeowners leave believing the lender seized their property at foreclosure
sale, learning that the scheduled foreclosure sale was withdrawn only when they receive bills for back-
taxes, citations for housing code violations, or bills for clean-up and demolition.
We still do not know why so many properties are re-listed. Some may be withdrawn to address
problems with the foreclosure process or to assess the validity of the plaintiff’s claim (e.g., mortgages
affected by the “robo-signing” case). Some lenders may be withdrawing properties from sale to allow
borrowers the opportunity to take advantage of mortgage modification and foreclosure rescue
programs, such as the Federal Home Affordable Modification Program (HAMP) or the State of Ohio’s
Save the Dream Restoring Stability Program. Others may have accepted a deed-in-lieu of foreclosure or
allowed the borrower to sell the property at short sale, agreeing to accept less than the borrowed
amount from a third-party buyer. Some lenders may have withdrawn the property from Sheriff’s Sale to
avoid responsibility for maintenance costs, code violations and/or property tax payments on homes that
are in poor condition, have been vacant for some time, or are located in areas where home values have
dropped substantially and are difficult to resell. Borrowers’ names may remain on the ownership record
after they have vacated with the belief that the lender has taken possession of the property, leaving the
actual ownership of and responsibility for the home in limbo.
CITIGROUP INC: Citi Bank, N.A.; Citicorp Trust Bank FSB; CitiFinancial, Inc.; CitiFinancial Mortgage Company, Inc.; CitiMortgage Inc.; ABN AMRO Mortgage Group, Inc.
359 305 203 33.44% 54 15.04%
PNC FINANCIAL SERVICES GROUP, INC., THE: National City Mortgage Company; National City Bank; National City Real Estate Services; PNC Bank; PNC Bank National Association; PNC Mortgage
161 137 94 31.39% 24 14.91%
BANK OF AMERICA CORPORATION: BAC Home Loan Servicing; Bank of America; Bank of America National Association; Countrywide Home Loans Servicing, L.P.; Countrywide Bank FSB; LaSalle Bank Midwest; LaSalle Bank National Association; Nationscredit Financial Services Corporation
814 676 476 29.59% 138 16.95%
HSBC HOLDINGS PLC: HSBC Bank, U.S.A; HSBC Mortgage Corporation; HSBC Mortgage Services, Inc.; Beneficial Financial 1, Inc.; Household Realty Corporation
78 71 51 28.17% 7 8.97%
ALLY FINANCIAL INC: GMAC; Pati Real Estate Holdings, LLC; Residential Funding Company, LLC
109 84 62 26.19% 9 22.94%
FIFTH THIRD BANCORP: Fifth Third Bank; Fifth Third Bank Madisonville Operations; Fifth Third Mortgage Company; CitFed Mortgage Corporation; Enterprise Federal Savings Bank
275 245 181 26.12% 30 10.91%
HAMILTON COUNTY, OH: Robert A. Goering, County Treasurer of Hamilton County, Ohio; Board of County Commissioners Hamilton County Ohio; Court of Common Pleas, Hamilton County, Ohio
69 68 55 19.12% 1 1.45%
FIGURE 16: RE-LISTING FREQUENCY FOR LENDERS WITH >50 COMPLETED FORECLOSURES IN HAMILTON COUNTY IN 2012 (DATA SOURCES: CINCINNATI COURT INDEX; NATIONAL INFORMATION CENTER OF THE FEDERAL RESERVE)

20
What we have found is that properties became more and more likely to be withdrawn from sale (and
less likely to be sold at Sheriff’s Sale) the more times they were re-listed over the course of the year.
Figure 17 shows this relationship between re-listed properties and completed Sheriff’s Sales in 2012.
# Properties # Properties Sold
Percentage Sold
Listed Once 3,561 2,519 70.74%
Listed 2 times 554 334 60.29%
Listed 3 times 115 57 49.57%
Listed 4 times 29 10 34.48%
Listed 5 times 4 1 25.00% FIGURE 17: COMPLETED SALES FOR DUPLICATE LISTINGS, 2012
(DATA SOURCE: CINCINNATI COURT INDEX)
NEIGHBORHOOD CASE STUDIES This year, we’ve included three neighborhood case studies. These include two Cincinnati
neighborhoods—Northside and College Hill—and one community outside the City of Cincinnati, the
Village of Elmwood Place. In large part, we chose to focus on these communities because of WIN’s
ongoing community development work there, including homeownership and home preservation efforts.
We examined 2010 US Census Data to better understand the demographics, economic status, and
housing conditions particular to each community, including data related to homeownership, vacancy
rates, and age of existing housing stocks. We also compiled detailed information on properties in these
target neighborhoods that were sold at Sheriff’s Sale over a three year period, from January 1, 2010
through December 31, 2012. We were able to determine what types of properties were lost to Sheriff’s
sale, such as single family homes versus multifamily apartment buildings, or commercial versus
residential uses.
We also collected additional data about the borrowers who lost property at Sheriff’s Sale between 2010-
2012, including the year they purchased their property and how much they paid. Finally, we collected
information about what happened to the property after the foreclosure sale occurred, whether it was
still held by the lender (REO), if it was purchased as an investment or rental property, or was owner-
occupied.
NORTHSIDE
Northside has built a reputation as a diverse, tolerant, and affordable place to live. Over the past
decade, the business district has experienced a renaissance; new bars, restaurants, and independently-
owned retail stores have thrived along Hamilton Avenue. As a result, the more than half of its population
of 7,467 is under 40 years of age. Most of Northside’s housing stock is quite old—more than two-thirds
was built before 1940 and only about 5 percent of its housing was constructed after 1980 (Figure 18).

21
89 88
64 54 56
29 35
0
10
20
30
40
50
60
70
80
90
100
2006 2007 2008 2009 2010 2011 2012
Northside Completed Sheriff's Sales 2006-2012
However, Northside was one of the hardest-
hit neighborhoods by the housing crisis in the
City of Cincinnati, especially early on.
Between 2006 and 2012, Northside lost 415
properties at Sheriff’s Sale (Figure 19), was
one of the top five neighborhoods with the
highest number of completed foreclosures
until 2010; the most recent US Census data
showed a vacancy rate of more than 25
percent (Figure 18).
For the past three years, completed Sheriff’s
Sales in Northside have been trending
downward. Between 2010 and 2012, 120
properties were sold at Sheriff’s Sale: many of
these occurred along Chase Avenue (13
properties), Hamilton Avenue (10), Kirby
Northside at a Glance (2010 US Census)
Population: 7,467 Minority Population: 40.78% Median Household Income: $34,495 Number of Housing Units: 4,484 Vacancy Rate: 25.38% Owner-Occupancy Rate (of occupied units): 46.69% % Households without a vehicle available: 12.90% Northside Residents by Age
Under 20 years 22.43%
Between 20-39 years 31.94%
Between 40-64 years 30.61%
65 years and older 15.01%
FIGURE 18: CITY OF CINCINNATI MAP HIGHLIGHTING NORTHSIDE’S LOCATION WITH SELCETED DATA FROM 2010 US CENSUS (BASE MAP: WIKIPEDIA)
FIGURE 19: DATA SOURCES: CINCINNATI COURT INDEX; HAMILTON COUNTY AUDITOR
Built 2005 or later
0.08%
Built 2000 to 2004 1.49%
Built 1990 to 1999 1.82%
Built 1980 to 1989 2.00%
Built 1970 to 1979 4.73%
Built 1960 to 1969 9.77%
Built 1950 to 1959 7.67%
Built 1940 to 1949 5.29%
Built 1939 or earlier 67.15%
Age of Northside Housing Stock

22
Avenue (15) and Langland Street (7). Figure
20 shows the geographic distribution of
completed Sheriff’s Sales in Northside
during this period.
Of the three case studies completed for
this report, Northside had the lowest
percentage of single-family homes lost at
Sheriff’s Sale. Of the 120 properties sold
between 2010 and 2012, only 73 percent
were single family homes. Most of the
remaining sales consist of multi-family
residential properties, along with a small
number of commercial properties and
vacant land (Figure 21). At foreclosure, the
median value of the properties sold was
$48,000 and the median purchase amount
at Sheriff’s Sale was $38,000 (Cincinnati
Court Index).
FIGURE 20: DISTRIBUTION OF COMPLETED FORECLOSURES IN NORTHSIDE, 2010 –2012 (DATA SOURCES: CINCINNATI COURT INDEX; HAMILTON COUNTY AUDITOR; BASE MAP: GOOGLE MAPS)
FIGURE 21: DATA SOURCES, CINCINNATI COURT INDEX; HAMILTON COUNTY AUDITOR
FIGURE 22: DATA SOURCES, CINCINNATI COURT INDEX; HAMILTON COUNTY AUDITOR
Apts - 4 to 19 rental
units 4.96%
Commercial 3.31% Residential
vacant land 2.48%
Single family Dwlg
72.73%
Three family Dwlg
2.48%
Two family Dwlg
14.05%
Northside: Land Use of Property Sold at Sheriff's Sale, 2010-2012
Investment/ Rental
Property 45.45%
Owner Occupied 28.81%
REO 24.58%
Northside: Current Ownership Status of Property Sold at Sheriff's Sale, 2010-2012 (as of March 2013)
23
While nearly all were purchased by the lender initially, fewer than one in four remained bank-owned
(REO) as of March, 2013 (Figure 22). The remaining three-quarters purchased by third parties, either as
owner-occupied homes or by investors interested in renting or re-selling.
Given the combination of sustained high foreclosure rates, large number of vacant buildings, advanced
age of its housing stock, and current condition of the structures, many of these buildings will probably
require expensive renovation to become habitable again; it may require some to be torn down.
There were two interesting trends we noticed while examining the County Auditor’s property transfer
information on Northside’s completed Sheriff’s Sales from the past three years. First, we found several
properties were bank-owned more than once in the past few years. Many of these were purchased by
real estate investors or landlords who then went into foreclosure themselves.
Second, when comparing completed Sheriff’s Sales reported in the Court Index between 2010 and 2012
to owners listed by the County Auditor, we found a small number of properties (4) that have been bank-
owned for more than a year but are still listed in the names of people who no longer own them. We
don’t know how many other Hamilton County properties sold at past Sheriff’s Sales are still in the names
of former owners, but the few cases we did find are concerning. If the building is not maintained, if there
code violations, or if property taxes become delinquent, the City and County may inadvertently penalize
someone who no longer owns the property.
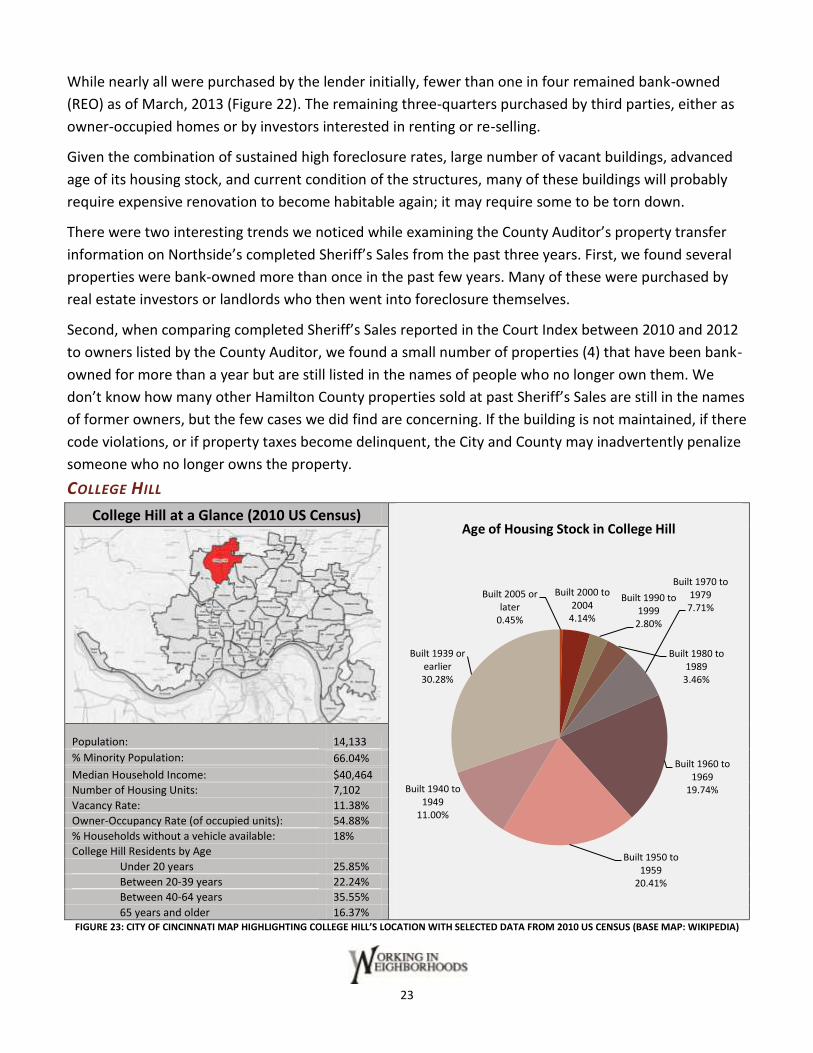
COLLEGE HILL
College Hill at a Glance (2010 US Census)
Population: 14,133
% Minority Population: 66.04%
Median Household Income: $40,464
Number of Housing Units: 7,102
Vacancy Rate: 11.38%
Owner-Occupancy Rate (of occupied units): 54.88%
% Households without a vehicle available: 18%
College Hill Residents by Age Under 20 years 25.85%
Between 20-39 years 22.24%
Between 40-64 years 35.55%
65 years and older 16.37% FIGURE 23: CITY OF CINCINNATI MAP HIGHLIGHTING COLLEGE HILL’S LOCATION WITH SELECTED DATA FROM 2010 US CENSUS (BASE MAP: WIKIPEDIA)
Built 2005 or later
0.45%
Built 2000 to 2004
4.14%
Built 1990 to 1999
2.80%
Built 1980 to 1989
3.46%
Built 1970 to 1979 7.71%
Built 1960 to 1969
19.74%
Built 1950 to 1959
20.41%
Built 1940 to 1949
11.00%
Built 1939 or earlier 30.28%
Age of Housing Stock in College Hill

24
89 80 92
68 67 48
71
0
20
40
60
80
100
2006 2007 2008 2009 2010 2011 2012
College Hill Completed Sheriff's Sales 2006-2012
College Hill has the largest population of
our target neighborhoods. It also has the
highest household median income, the
lowest vacancy rate, and the highest home
ownership rate. About 62 percent of
College Hill’s residents are African
American, and the largest portion of its
residents is between 40 and 65 years old
(Figure 23). Compared to other Cincinnati
neighborhoods, much of College Hill’s
housing stock is relatively new. Less than a
third of its housing was built prior to 1940.
However, College Hill is one of only four
Cincinnati neighborhoods that have lost
more than 500 properties at Sheriff’s Sale
between 2006 and 2012. Compared to other City of Cincinnati neighborhoods, it had the third highest
total in completed foreclosures in 2012. In fact, the 71 completed foreclosure sales that occurred in
College Hill last year is the largest seen there in the past four years (Figure 24).
The largest concentration of
foreclosure sales occurred in
the area east of Hamilton
and south of North Bend
Road between 2010 and
2012. There were six streets
in College Hill that were
particularly active: Cedar
Avenue (7 completed
Sheriff’s Sales); Saranac
Avenue (6); Ambrose Avenue
(5); Faircrest Drive (5);
Lantana Avenue (5); and
Savannah Avenue (5). The
map shown in Figure 25
shows the distribution of
completed Sheriff’s Sales in
College Hill between 2010
and 2012.
FIGURE 24: DATA SOURCES: CINCINNATI COURT INDEX; HAMILTON COUNTY AUDITOR
FIGURE 25: DISTRIBUTION OF COMPLETED FORECLOSURES IN COLLEGE HILL, 2010 – 2012
(DATA SOURCES: CINCINNATI COURT INDEX; HAMILTON COUNTY AUDITOR; BASE MAP: GOOGLE MAPS)

25
Of the 186 properties sold at Sheriff’s Sale in the previous three years, nearly 84 percent were single-
family homes. There were also several multi-family units sold. In fact, all of the completed foreclosures
in College Hill in the previous three years are residential use (Figure 26).
The median value of a property at foreclosure between 2010 and 2012 in College Hill was $69,000. The
median sale price at Sheriff’s Sale was $48,000 (Cincinnati Court Index). We followed up on the past
three years’ completed foreclosures in March of 2013 to learn about their ownership status once they
were lost at Sheriff’s Sale. Only about one in five was owner-occupied, while about 38 percent remained
bank-owned, and nearly 40 percent were owned by people or companies as rental or investment
property (Figure 27).
While we examined transfer data for College Hill’s completed foreclosure, we found that the borrowers
who lost their homes to foreclosure tended to be owner-occupants and more than a third paid more
than $100,000 when they purchased their homes. Two-thirds purchased these homes in 2000 or later, as
prices rose with the housing bubble. We also found two properties in College Hill in which ownership
was not transferred from the borrower to the bank after the foreclosure was completed, more than one
year after the sale took place.
FIGURE 26: DATA SOURCES, CINCINNATI COURT INDEX; HAMILTON
COUNTY AUDITOR FIGURE 27: DATA SOURCES, CINCINNATI COURT INDEX; HAMILTON
COUNTY AUDITOR
Apts - 20 to 39 rental
units 0.56%
Apts - 4 to 19 rental
units 6.15%
Condo Residential
Unit 1.68%
Residential vacant land
0.56%
Single family Dwlg
83.80%
Two family Dwlg 7.26%
College Hill: Land Use of Property Sold at Sheriff's Sale, 2010-2012
Investment/ Rental
Property 39.66%
Owner Occupied 22.35%
REO 37.99%
College Hill: Ownership Status of Property Sold at Sheriff's Sale, 2010-2012 (as of March 2013)

26
THE VILLAGE OF ELMWOOD PLACE
The predominantly working-class Village of Elmwood Place is a small community outside the City of
Cincinnati. With its population of 2,188 residents, it is smaller in size than many Cincinnati
neighborhoods. Close to 80 percent of residents are white, and it has the smallest proportion of senior
citizens of the three communities included in our case studies. Nearly 80 percent of its housing stock
was constructed before 1940 (Figure 28).
Between 2006 and 2012, there have been 124 completed foreclosures in Elmwood Place (Figure 29). The
highest rates of foreclosure occurred early on in this period, and rates have been falling fairly steadily
since 2006. However, the cumulative seven-year impact of Sheriff’s Sales in this community is equivalent
to 11.28 percent of its 1,099 housing units, making it the third most heavily impacted municipality in
Hamilton County (see Figure 10).
Elmwood Place at a Glance (2010 US Census)
Population: 2,188 % Minority Population: 20.93% Median Household Income: $24,922 Number of Housing Units: 1,099 Vacancy Rate: 20.66% Owner-Occupancy Rate (of occupied units): 40.25% % Households without a vehicle available: 25.07% Elmwood Place Residents by Age
Under 20 years 28.99% Between 20-39 years 27.71% Between 40-64 years 33.76% 65 years and older 9.54%
FIGURE 28: HAMILTON COUNTY MAP HIGHLIGHTING THE LOCATION OF ELMWOOD PLACE, WITH SELECTED DATA FROM 2010 US CENSUS (BASE MAP:
WIKIPEDIA)
Built 1990 to 1999 1.88%
Built 1970 to 1979 0.56%
Built 1960 to 1969 2.91%
Built 1950 to 1959 3.75%
Built 1940 to 1949
11.07%
Built 1939 or earlier 79.83%
Age of Housing Stock in Elmwood Place

27
Between 2010 and 2012, there were
37 completed foreclosures; these
have been most heavily
concentrated on Township Avenue
(6), Maple Street (6), and Linden
Street (5). A map showing the
distribution of completed
foreclosures in Elmwood Place over
the past three years is shown in
Figure 30.
Over 86 percent of the properties
sold at Sheriff’s Sale between 2010
and 2012 were single-family
residences. One commercial
property and a small number of
multi-family residential properties (2
and 3-family buildings) made up the
remainder (Figure 31). The median sale price at
foreclosure sale of these properties was $36,641.
We followed up on properties sold at Sheriff’s
Sale between 2010 and 2012 by examining the
County Auditor’s record of property transfers. As
of March 2013, only about 19 percent of these
foreclosed properties remain bank-owned (REO).
More than two-thirds were purchased after
Sheriff’s Sale as investment or rental properties.
Less than 14 percent appear to have been
purchased by owner-occupants (Figure 32).
FIGURE 29: COMPLETED FORECLOSURE SALES IN ELMWOOD PLACE BETWEEN 2006 AND 2012
(DATA SOURCES: CINCINNATI COURT INDEX; HAMILTON COUNTY AUDITOR)
FIGURE 30: DISTRIBUTION OF COMPLETED FORECLOSURES IN ELMWOOD PLACE, 2010 – 2012 (DATA SOURCES: CINCINNATI COURT INDEX; HAMILTON COUNTY AUDITOR; BASE MAP: GOOGLE MAPS)
27
21
19 20
17
11
9
0
5
10
15
20
25
30
2006 2007 2008 2009 2010 2011 2012
Elmwood Place: Completed Sheriff's Sales 2006-2012

28
CONCLUSIONS
The neighborhood case studies we completed for College Hill, Northside, and the Village of Elmwood
Place allow us to make some comparisons about how the ongoing foreclosure crisis affects different
neighborhoods in different ways. It also provides some insight into the challenges that each community
may face moving forward.
First, these communities widely vary in size in terms of population and number of housing units. While
all three have been substantially impacted by ongoing foreclosure over the past several years, the size of
the community matters when attempting to gauge how they have been affected. We estimated
foreclosure impacts by total number of completed Sheriff’s Sales over the total number of housing units;
results are compared in Figure 33.
7-year Foreclosure Impact
Community Completed Foreclosures
2006-2012 Total Housing Units (2010 US
Census) Estimated Foreclosure Impact
Northside 415 4,484 9.29% College Hill 515 7,102 7.26% Elmwood Place 124 1,099 11.28%
FIGURE 33: (DATA SOURCES: CINCINNATI COURT INDEX; HAMILTON COUNTY AUDITOR; 2010 US CENSUS)
In Elmwood Place, the equivalent of about one in nine units was impacted by completed Sheriff’s Sale
during that period. Northside and College Hill lost the equivalent of 1 in 11 and 1 in 14 properties at
Sheriff’s Sale, respectively.
Commercial 2.70%
Single family Dwlg
86.49%
Three family Dwlg 8.11%
Two family Dwlg 2.70%
Elmwood Place: Land Use of Property Sold at Sheriff's Sale, 2010-2012
Investment/ Rental
Property 67.57%
Owner Occupied 13.51%
REO 18.92%
Elmwood Place: Ownership Status of Property Sold at Sheriff's Sale,2010-2012 (as of March 2013)
FIGURE 31: DATA SOURCES, CINCINNATI COURT INDEX; HAMILTON COUNTY AUDITOR
FIGURE 32: DATA SOURCES, CINCINNATI COURT INDEX; HAMILTON COUNTY AUDITOR
29
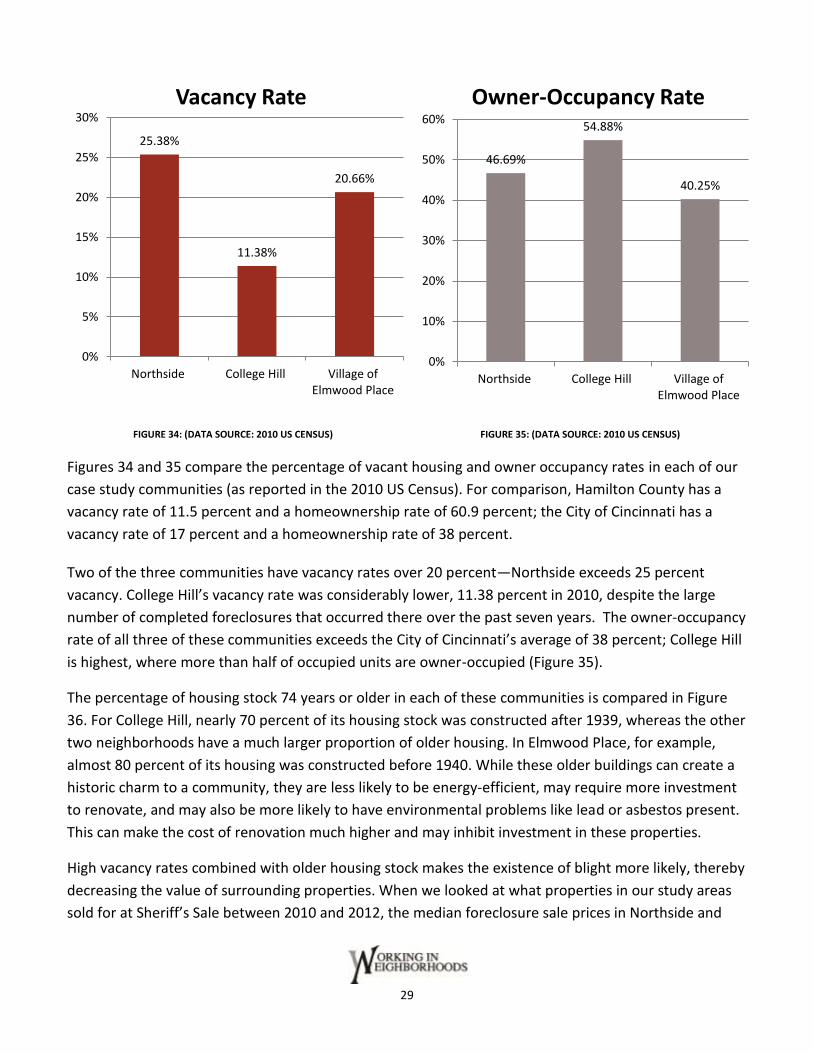
FIGURE 34: (DATA SOURCE: 2010 US CENSUS) FIGURE 35: (DATA SOURCE: 2010 US CENSUS)
Figures 34 and 35 compare the percentage of vacant housing and owner occupancy rates in each of our
case study communities (as reported in the 2010 US Census). For comparison, Hamilton County has a
vacancy rate of 11.5 percent and a homeownership rate of 60.9 percent; the City of Cincinnati has a
vacancy rate of 17 percent and a homeownership rate of 38 percent.
Two of the three communities have vacancy rates over 20 percent—Northside exceeds 25 percent
vacancy. College Hill’s vacancy rate was considerably lower, 11.38 percent in 2010, despite the large
number of completed foreclosures that occurred there over the past seven years. The owner-occupancy
rate of all three of these communities exceeds the City of Cincinnati’s average of 38 percent; College Hill
is highest, where more than half of occupied units are owner-occupied (Figure 35).
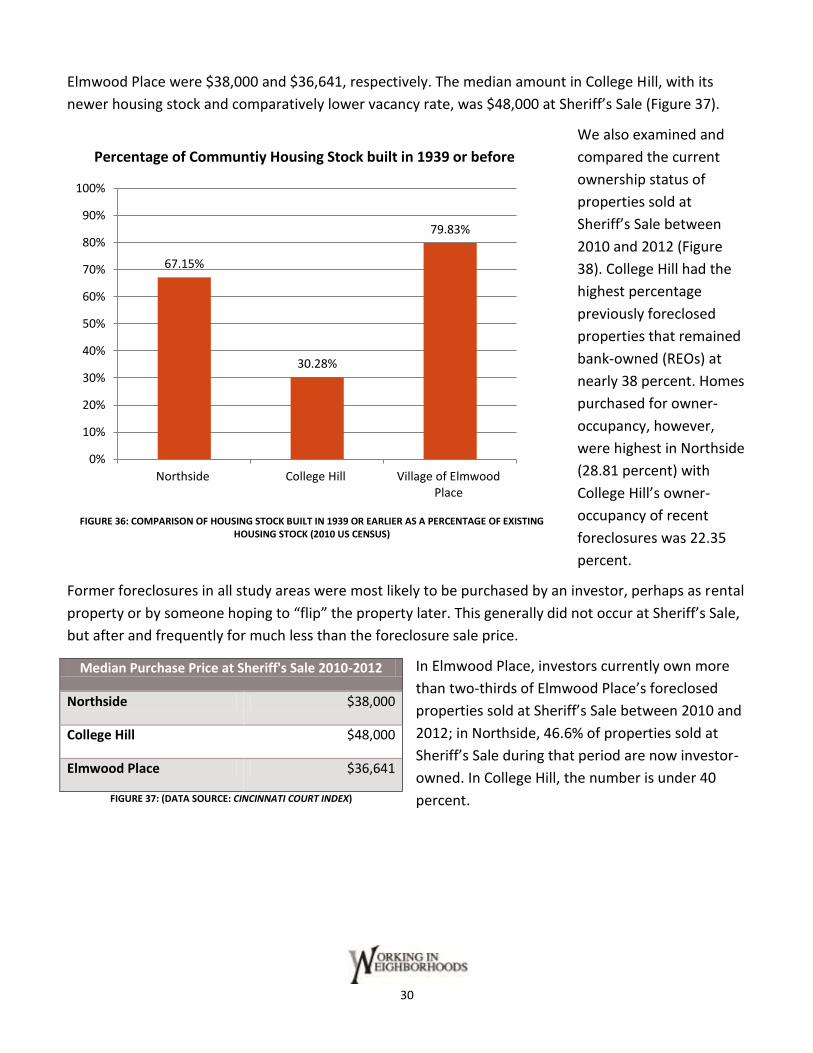
The percentage of housing stock 74 years or older in each of these communities is compared in Figure
36. For College Hill, nearly 70 percent of its housing stock was constructed after 1939, whereas the other
two neighborhoods have a much larger proportion of older housing. In Elmwood Place, for example,
almost 80 percent of its housing was constructed before 1940. While these older buildings can create a
historic charm to a community, they are less likely to be energy-efficient, may require more investment
to renovate, and may also be more likely to have environmental problems like lead or asbestos present.
This can make the cost of renovation much higher and may inhibit investment in these properties.
High vacancy rates combined with older housing stock makes the existence of blight more likely, thereby
decreasing the value of surrounding properties. When we looked at what properties in our study areas
sold for at Sheriff’s Sale between 2010 and 2012, the median foreclosure sale prices in Northside and
25.38%
11.38%
20.66%
0%
5%
10%
15%
20%
25%
30%
Northside College Hill Village of Elmwood Place
Vacancy Rate
46.69%
54.88%
40.25%
0%
10%
20%
30%
40%
50%
60%
Northside College Hill Village of Elmwood Place
Owner-Occupancy Rate
30
Elmwood Place were $38,000 and $36,641, respectively. The median amount in College Hill, with its
newer housing stock and comparatively lower vacancy rate, was $48,000 at Sheriff’s Sale (Figure 37).
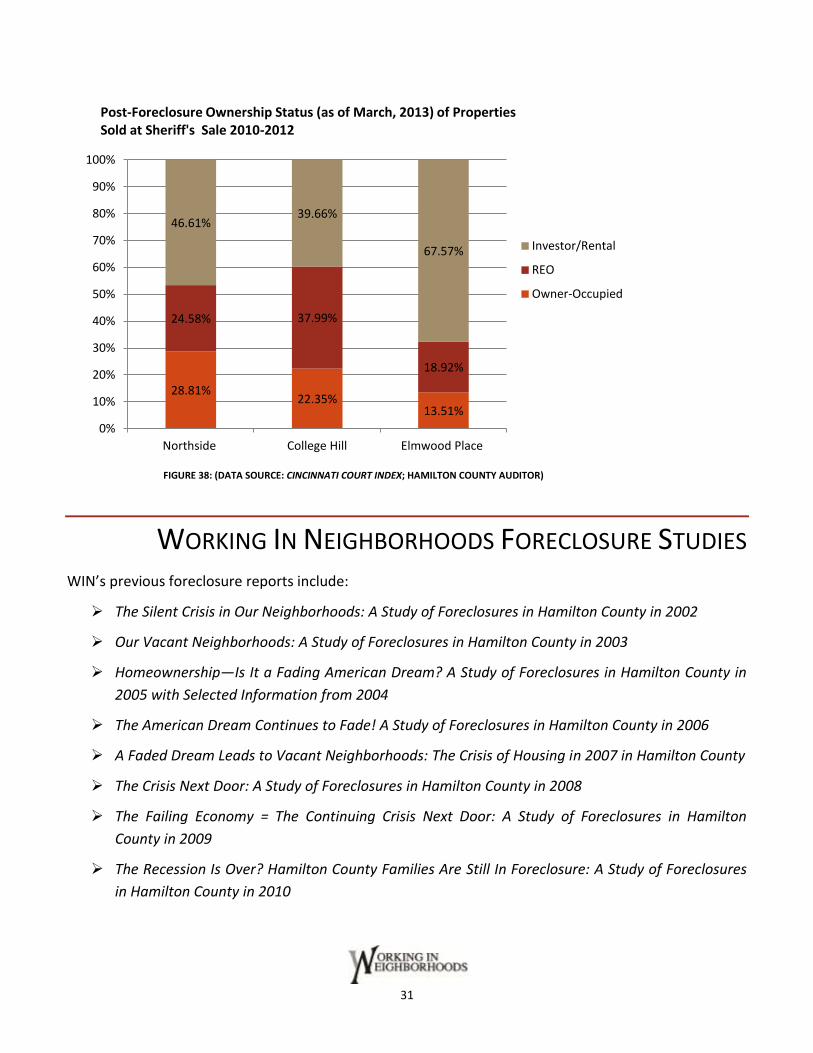
We also examined and
compared the current
ownership status of
properties sold at
Sheriff’s Sale between
2010 and 2012 (Figure
38). College Hill had the
highest percentage
previously foreclosed
properties that remained
bank-owned (REOs) at
nearly 38 percent. Homes
purchased for owner-
occupancy, however,
were highest in Northside
(28.81 percent) with
College Hill’s owner-
occupancy of recent
foreclosures was 22.35
percent.
Former foreclosures in all study areas were most likely to be purchased by an investor, perhaps as rental
property or by someone hoping to “flip” the property later. This generally did not occur at Sheriff’s Sale,
but after and frequently for much less than the foreclosure sale price.
In Elmwood Place, investors currently own more
than two-thirds of Elmwood Place’s foreclosed
properties sold at Sheriff’s Sale between 2010 and
2012; in Northside, 46.6% of properties sold at
Sheriff’s Sale during that period are now investor-
owned. In College Hill, the number is under 40
percent.
FIGURE 36: COMPARISON OF HOUSING STOCK BUILT IN 1939 OR EARLIER AS A PERCENTAGE OF EXISTING
HOUSING STOCK (2010 US CENSUS)
Median Purchase Price at Sheriff's Sale 2010-2012
Northside $38,000
College Hill $48,000
Elmwood Place $36,641
FIGURE 37: (DATA SOURCE: CINCINNATI COURT INDEX)
67.15%
30.28%
79.83%
0%
10%
20%
30%
40%
50%
60%
70%
80%
90%
100%
Northside College Hill Village of Elmwood Place
Percentage of Communtiy Housing Stock built in 1939 or before
31
FIGURE 38: (DATA SOURCE: CINCINNATI COURT INDEX; HAMILTON COUNTY AUDITOR)
WORKING IN NEIGHBORHOODS FORECLOSURE STUDIES WIN’s previous foreclosure reports include:
The Silent Crisis in Our Neighborhoods: A Study of Foreclosures in Hamilton County in 2002
Our Vacant Neighborhoods: A Study of Foreclosures in Hamilton County in 2003
Homeownership—Is It a Fading American Dream? A Study of Foreclosures in Hamilton County in
2005 with Selected Information from 2004
The American Dream Continues to Fade! A Study of Foreclosures in Hamilton County in 2006
A Faded Dream Leads to Vacant Neighborhoods: The Crisis of Housing in 2007 in Hamilton County
The Crisis Next Door: A Study of Foreclosures in Hamilton County in 2008
The Failing Economy = The Continuing Crisis Next Door: A Study of Foreclosures in Hamilton
County in 2009
The Recession Is Over? Hamilton County Families Are Still In Foreclosure: A Study of Foreclosures
in Hamilton County in 2010
28.81% 22.35%
13.51%
24.58% 37.99%
18.92%
46.61% 39.66%
67.57%
0%
10%
20%
30%
40%
50%
60%
70%
80%
90%
100%
Northside College Hill Elmwood Place
Investor/Rental
REO
Owner-Occupied
Post-Foreclosure Ownership Status (as of March, 2013) of Properties Sold at Sheriff's Sale 2010-2012
32
The Foreclosure Crisis in Hamilton County: Is the End in Sight?: A Study of Foreclosures in
Hamilton County, Ohio in 2011
For more information about Working In Neighborhoods home preservation and homeownership
programs or to access previous foreclosure studies, please visit our website: www.wincincy.org or
call 513-541-4109. Research, data analysis, writing and graphics for this report were performed by
Rigel Behrens, MCP. Permission to reproduce this report in whole or in part must be obtained from
Working In Neighborhoods; permission will be voided unless credits are displayed.
DATA SOURCES FORECLOSURE DATA
All Hamilton County foreclosure data are collected from the Cincinnati Court Index and recorded as
accurately as possible. Each Monday, the Cincinnati Court Index publishes listings of foreclosed
properties to be sold at Sheriff’s Sale approximately five weeks later; results of the previous week’s
completed Sheriff’s Sales are released every Wednesday. For each foreclosure listing, we record the
party named as “Plaintiff” as the lender responsible for filing the foreclosure, even though many
loans were originated or serviced by other lenders in the past. Hamilton County’s new foreclosure
filings were acquired from data provided by Realty Trac.
GEOGRAPHIC DATA
We relied on information provided by CAGIS, the Hamilton County Auditor’s website, Google maps,
the Cincinnati and Hamilton County Public Library, the Federal Financial Institutions Examination
Council’s online geocoding tool, and the US Census to identify the geographic location of foreclosed
properties, to determine municipal and neighborhood boundaries, and to verify census tract
boundaries used in our analysis.
PARENT COMPANIES OF LENDING INSTITUTIONS
Mortgage lenders are listed under their respective parent companies based on information provided
by the National Information Center of the Federal Reserve.
TIME PERIOD
This report includes properties listed for Sheriff’s Sale between January 1, 2011 and December 31,
2011. Actual Sheriff’s Sales occurred between January 27, 2011 and January 19, 2012.
ADDITIONAL PROPERTY AND REAL ESTATE TRANSFER INFORMATION
Data on post-Sheriff’s Sale ownership and property classifications in the “Neighborhood Case
Studies” section of this report were collected from the Hamilton County Auditor’s website in March,
2013. A property was considered owner-occupied if the current owner address matched the
property address. Transfers recorded by the County Auditor’s office after the data collection period
are not reflected in our findings.

33
REFERENCES CAGIS. Internet Map Server. From http://cagis.hamilton-co.org./map/cagis/htm. Accessed January 2012
Cincinnati Court Index. From http://www.courtindex.com. Accessed October 2011 to February 2012.
City of Cincinnati. 2011. Housing Market Study. Plan Cincinnati.
Conlin, Michelle. 2013. “The latest foreclosure horror: the zombie title.” Reuters (January 10).
Federal Financial Institutions Examinations Council. http://www.ffiec.gov/default.htm. Accessed January 2013-February 2013
Hamilton County Auditor. From http://www.hamiltoncountyauditor.org. Accessed October 2011 to February 2012.
RealtyTrac. Website. http://www.realtytrac.com/. Accessed January 2013.
United States Census American Fact Finder. Census 2010 GCT-PL2 “Population and Housing Occupancy Status: 2010-State—County Subdivision.” Accessed February , 2013.
United Sates Census American Fact Finder. Census 2010 Summary File 1 (SF1). Table DP02 “Profile of Selected Social Characteristics: 2010.”Accessed February 2013.
United Sates Census American Fact Finder. Census 2010 Summary File 1 (SF1). Table DP04 “Selected Housing Characteristics: 2010.”Accessed February 2013.
United States Federal reserve. National Information Center. http://www.ffiec.gov/nicpubweb/nicweb/nichome.aspx. Accessed February, 2013.
Zywiki, Todd J. 2012. The "Robo-Signing" Settlement: Seeds of Recovery, Or Chaos? Forbes. (February 20).
34
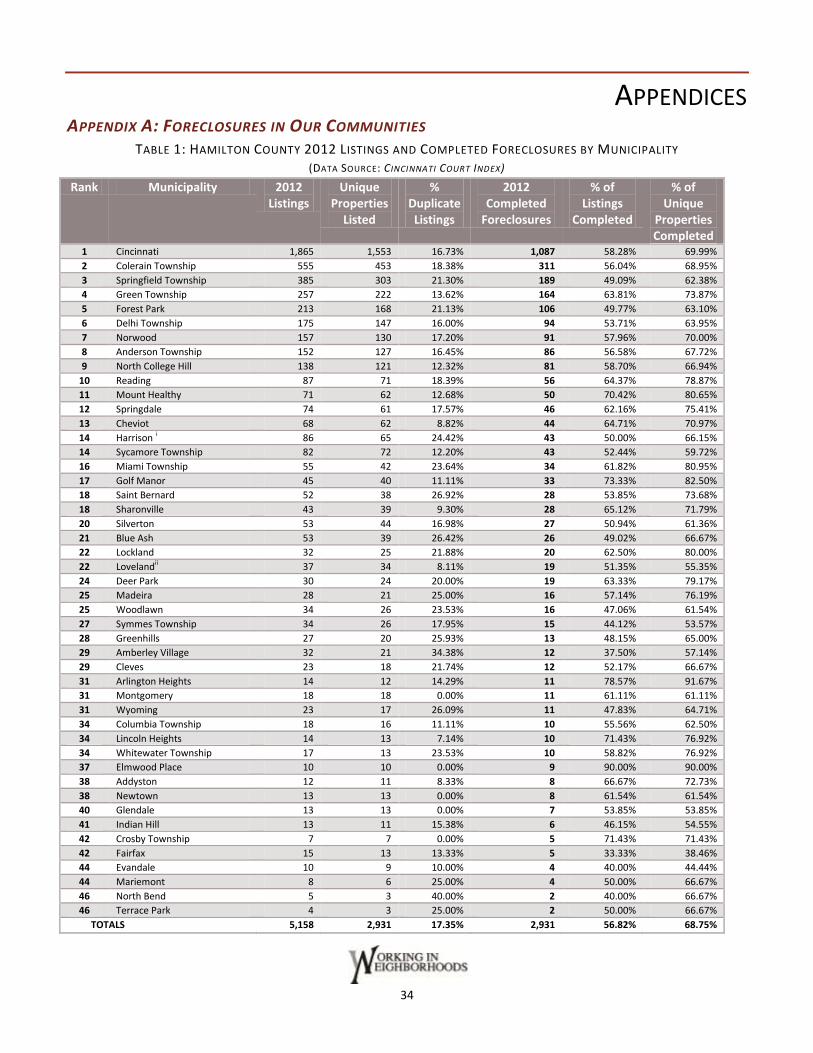
APPENDICES APPENDIX A: FORECLOSURES IN OUR COMMUNITIES
TABLE 1: HAMILTON COUNTY 2012 LISTINGS AND COMPLETED FORECLOSURES BY MUNICIPALITY (DATA SOURCE: CINCINNATI COURT INDEX)
Rank Municipality 2012 Listings
Unique Properties
Listed
% Duplicate Listings
2012 Completed
Foreclosures
% of Listings
Completed
% of Unique
Properties Completed
1 Cincinnati 1,865 1,553 16.73% 1,087 58.28% 69.99%
2 Colerain Township 555 453 18.38% 311 56.04% 68.95%
3 Springfield Township 385 303 21.30% 189 49.09% 62.38%
4 Green Township 257 222 13.62% 164 63.81% 73.87%
5 Forest Park 213 168 21.13% 106 49.77% 63.10%
6 Delhi Township 175 147 16.00% 94 53.71% 63.95%
7 Norwood 157 130 17.20% 91 57.96% 70.00%
8 Anderson Township 152 127 16.45% 86 56.58% 67.72%
9 North College Hill 138 121 12.32% 81 58.70% 66.94%
10 Reading 87 71 18.39% 56 64.37% 78.87%
11 Mount Healthy 71 62 12.68% 50 70.42% 80.65%
12 Springdale 74 61 17.57% 46 62.16% 75.41%
13 Cheviot 68 62 8.82% 44 64.71% 70.97%
14 Harrison i 86 65 24.42% 43 50.00% 66.15%
14 Sycamore Township 82 72 12.20% 43 52.44% 59.72%
16 Miami Township 55 42 23.64% 34 61.82% 80.95%
17 Golf Manor 45 40 11.11% 33 73.33% 82.50%
18 Saint Bernard 52 38 26.92% 28 53.85% 73.68%
18 Sharonville 43 39 9.30% 28 65.12% 71.79%
20 Silverton 53 44 16.98% 27 50.94% 61.36%
21 Blue Ash 53 39 26.42% 26 49.02% 66.67%
22 Lockland 32 25 21.88% 20 62.50% 80.00%
22 Lovelandii 37 34 8.11% 19 51.35% 55.35%
24 Deer Park 30 24 20.00% 19 63.33% 79.17%
25 Madeira 28 21 25.00% 16 57.14% 76.19%
25 Woodlawn 34 26 23.53% 16 47.06% 61.54%
27 Symmes Township 34 26 17.95% 15 44.12% 53.57%
28 Greenhills 27 20 25.93% 13 48.15% 65.00%
29 Amberley Village 32 21 34.38% 12 37.50% 57.14%
29 Cleves 23 18 21.74% 12 52.17% 66.67%
31 Arlington Heights 14 12 14.29% 11 78.57% 91.67%
31 Montgomery 18 18 0.00% 11 61.11% 61.11%
31 Wyoming 23 17 26.09% 11 47.83% 64.71%
34 Columbia Township 18 16 11.11% 10 55.56% 62.50%
34 Lincoln Heights 14 13 7.14% 10 71.43% 76.92%
34 Whitewater Township 17 13 23.53% 10 58.82% 76.92%
37 Elmwood Place 10 10 0.00% 9 90.00% 90.00%
38 Addyston 12 11 8.33% 8 66.67% 72.73%
38 Newtown 13 13 0.00% 8 61.54% 61.54%
40 Glendale 13 13 0.00% 7 53.85% 53.85%
41 Indian Hill 13 11 15.38% 6 46.15% 54.55%
42 Crosby Township 7 7 0.00% 5 71.43% 71.43%
42 Fairfax 15 13 13.33% 5 33.33% 38.46%
44 Evandale 10 9 10.00% 4 40.00% 44.44%
44 Mariemont 8 6 25.00% 4 50.00% 66.67%
46 North Bend 5 3 40.00% 2 40.00% 66.67%
46 Terrace Park 4 3 25.00% 2 50.00% 66.67%
TOTALS 5,158 2,931 17.35% 2,931 56.82% 68.75%
35
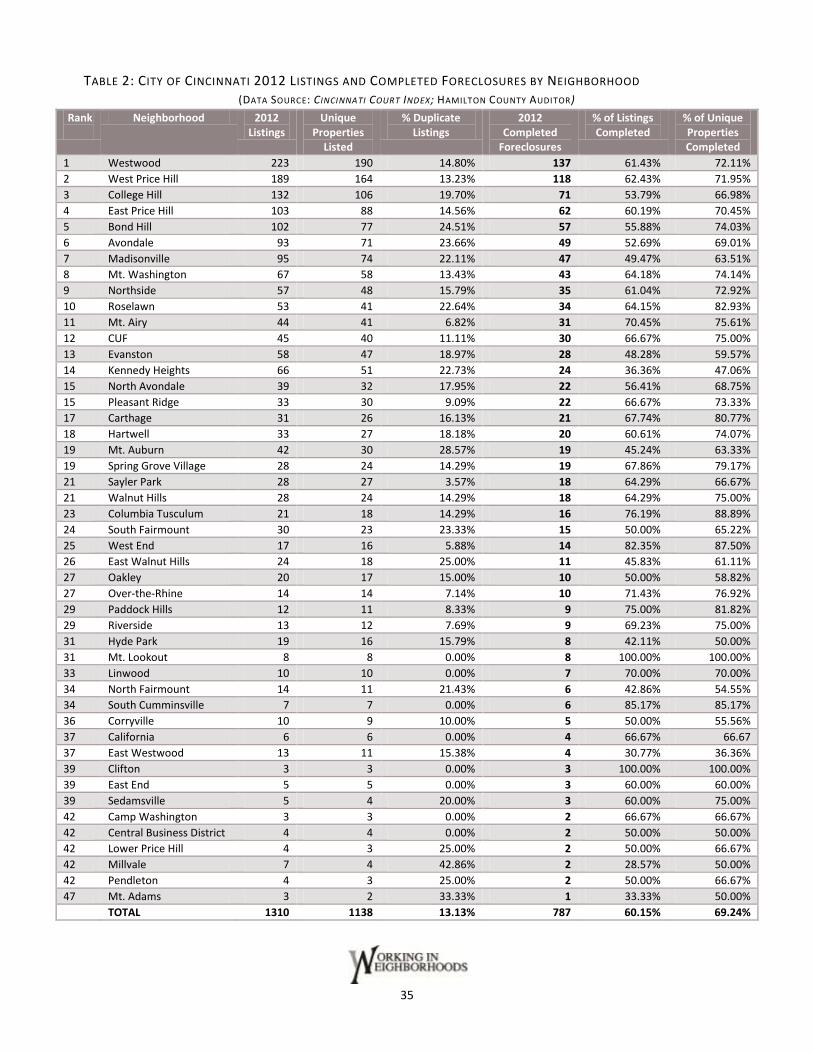
TABLE 2: CITY OF CINCINNATI 2012 LISTINGS AND COMPLETED FORECLOSURES BY NEIGHBORHOOD (DATA SOURCE: CINCINNATI COURT INDEX; HAMILTON COUNTY AUDITOR)
Rank
Neighborhood 2012 Listings
Unique Properties
Listed
% Duplicate Listings
2012 Completed
Foreclosures
% of Listings Completed
% of Unique Properties Completed
1 Westwood 223 190 14.80% 137 61.43% 72.11%
2 West Price Hill 189 164 13.23% 118 62.43% 71.95%
3 College Hill 132 106 19.70% 71 53.79% 66.98%
4 East Price Hill 103 88 14.56% 62 60.19% 70.45%
5 Bond Hill 102 77 24.51% 57 55.88% 74.03%
6 Avondale 93 71 23.66% 49 52.69% 69.01%
7 Madisonville 95 74 22.11% 47 49.47% 63.51%
8 Mt. Washington 67 58 13.43% 43 64.18% 74.14%
9 Northside 57 48 15.79% 35 61.04% 72.92%
10 Roselawn 53 41 22.64% 34 64.15% 82.93%
11 Mt. Airy 44 41 6.82% 31 70.45% 75.61%
12 CUF 45 40 11.11% 30 66.67% 75.00%
13 Evanston 58 47 18.97% 28 48.28% 59.57%
14 Kennedy Heights 66 51 22.73% 24 36.36% 47.06%
15 North Avondale 39 32 17.95% 22 56.41% 68.75%
15 Pleasant Ridge 33 30 9.09% 22 66.67% 73.33%
17 Carthage 31 26 16.13% 21 67.74% 80.77%
18 Hartwell 33 27 18.18% 20 60.61% 74.07%
19 Mt. Auburn 42 30 28.57% 19 45.24% 63.33%
19 Spring Grove Village 28 24 14.29% 19 67.86% 79.17%
21 Sayler Park 28 27 3.57% 18 64.29% 66.67%
21 Walnut Hills 28 24 14.29% 18 64.29% 75.00%
23 Columbia Tusculum 21 18 14.29% 16 76.19% 88.89%
24 South Fairmount 30 23 23.33% 15 50.00% 65.22%
25 West End 17 16 5.88% 14 82.35% 87.50%
26 East Walnut Hills 24 18 25.00% 11 45.83% 61.11%
27 Oakley 20 17 15.00% 10 50.00% 58.82%
27 Over-the-Rhine 14 14 7.14% 10 71.43% 76.92%
29 Paddock Hills 12 11 8.33% 9 75.00% 81.82%
29 Riverside 13 12 7.69% 9 69.23% 75.00%
31 Hyde Park 19 16 15.79% 8 42.11% 50.00%
31 Mt. Lookout 8 8 0.00% 8 100.00% 100.00%
33 Linwood 10 10 0.00% 7 70.00% 70.00%
34 North Fairmount 14 11 21.43% 6 42.86% 54.55%
34 South Cumminsville 7 7 0.00% 6 85.17% 85.17%
36 Corryville 10 9 10.00% 5 50.00% 55.56%
37 California 6 6 0.00% 4 66.67% 66.67
37 East Westwood 13 11 15.38% 4 30.77% 36.36%
39 Clifton 3 3 0.00% 3 100.00% 100.00%
39 East End 5 5 0.00% 3 60.00% 60.00%
39 Sedamsville 5 4 20.00% 3 60.00% 75.00%
42 Camp Washington 3 3 0.00% 2 66.67% 66.67%
42 Central Business District 4 4 0.00% 2 50.00% 50.00%
42 Lower Price Hill 4 3 25.00% 2 50.00% 66.67%
42 Millvale 7 4 42.86% 2 28.57% 50.00%
42 Pendleton 4 3 25.00% 2 50.00% 66.67%
47 Mt. Adams 3 2 33.33% 1 33.33% 50.00%
TOTAL 1310 1138 13.13% 787 60.15% 69.24%

36
TABLE3: HAMILTON COUNTY COMPLETED FORECLOSURES BY MUNICIPALITY, 2006 – 2012 (DATA SOURCE: CINCINNATI COURT INDEX)
City/Township 2012 Sales
2011 Sales
Percent Change 2011-2012
2010 Sales
2009 Sales
2008 Sales
2007 Sales
2006 Sales
Total Sales,
2006-2012
Cincinnati 1,087 787 +38.12% 1205 1151 1355 1514 1553 8,652
Colerain Township 311 168 +85.12% 295 229 315 267 233 1,818
Springfield Township 189 133 +42.11% 201 124 217 197 174 1,235
Green Township 164 101 +62.38% 145 121 147 114 85 877
Forest Park 106 75 +41.33% 125 79 137 143 133 798
Norwood 91 56 +62.50% 87 64 94 91 97 580
Delhi Township 94 76 +23.68% 81 58 81 72 74 536
North College Hill 81 57 +42.11% 68 89 67 78 75 515
Anderson Township 86 53 +62.26% 75 56 47 49 42 408
Cheviot 44 35 +25.71% 50 132 43 56 37 397
Sycamore Township 43 37 +16.22% 37 46 32 48 40 283
Harrison i
43 22 +95.45% 45 31 42 43 33 259
Mount Healthy 50 20 +150.00% 30 20 37 37 33 227
Reading 56 22 +154.55% 38 30 20 30 24 220
Golf Manor 33 29 +13.79% 28 23 36 42 28 219
Springdale 46 26 +76.92% 25 36 33 25 26 217
Saint Bernard 28 20 +40.00% 22 23 30 34 22 179
Loveland ii
19 22 -13.64% 31 21 29 28 21 171
Silverton 27 14 +92.86% 28 20 19 24 14 146
Sharonville 28 20 +40.00% 24 25 15 12 19 143
Miami Township 34 12 +183.33% 25 19 18 14 18 140
Lockland 20 17 +17.65% 19 13 27 22 21 139
Cleves 12 14 -14.29% 23 12 28 24 14 127
Elmwood Place 9 11 -18.18% 17 20 19 21 27 124
Deer Park 18 19 -5.26% 18 15 21 16 15 122
Blue Ash 26 17 +52.94% 15 19 15 17 10 119
Lincoln Heights 10 10 No change 14 8 17 24 32 115
Columbia Township 10 12 -16.67% 17 15 16 13 15 98
Symmes Township 15 10 +50.00% 12 17 16 16 8 94
Woodlawn 16 8 +100.00% 10 13 17 15 15 94
Madeira 16 20 -20.00% 15 11 5 12 13 92
Wyoming 11 19 -42.11% 10 9 16 16 8 89
Greenhills 13 16 -18.75% 16 10 7 11 13 86
Fairfax 5 1 +400.00% 17 8 10 8 7 56
Montgomery 11 10 +10.00% 15 7 3 2 8 56
Newtown 8 11 -27.27% 7 8 5 6 9 54
Addyston 8 2 +300.00% 7 5 4 10 13 49
Amberley Village 12 1 +1,100.00% 2 6 13 8 2 44
Whitewater Township 10 6 +66.67% 8 6 3 3 7 43
Glendale 7 6 +16.67% 5 5 5 3 11 42
Crosby Township 5 2 +150.00% 6 21 4 2 0 40
Arlington Heights 11 3 +266.67% 1 2 7 2 7 33
Indian Hill 6 5 +20.00% 7 4 3 3 2 30
Evandale 4 2 +100.00% 3 2 3 4 3 21
Mariemont 4 3 +33.33% 5 0 4 2 3 21
North Bend 2 0 n/a 4 3 0 3 3 15
Terrace Park 2 2 No change 1 4 4 0 0 13
TOTAL 2,931 2,018 +45.68% 2,940 2,640 3,086 3,076 3,030 19,837

37
TABLE 4: CITY OF CINCINNATI COMPLETED FORECLOSURE SALES BY NEIGHBORHOOD, 2006-2012 (DATA SOURCE: CINCINNATI COURT INDEX; HAMILTON COUNTY AUDITOR)
Neighborhood 2012 Sales
2011 Sales
Percent Change
2011-2012
2010 Sales
2009 Sales
2008 Sales
2007 Sales
2006 Sales
TOTAL Completed Foreclosure Sales
2006-2012 WESTWOOD 137 103 +33.01% 137 129 166 148 136 956
WEST PRICE HILL 118 80 +47.50% 118 108 137 169 141 871
EAST PRICE HILL 62 54 +14.81% 83 81 102 127 181 690
COLLEGE HILL 71 48 +47.92% 67 68 92 80 89 515
MADISONVILLE 47 35 +34.29% 78 48 79 90 80 457
NORTHSIDE 35 29 +20.69% 56 54 64 88 89 415
AVONDALE 49 31 +58.06% 37 52 63 85 94 411
BOND HILL 57 42 +35.71% 43 54 45 66 64 371
EVANSTON 28 30 -6.67% 40 43 75 64 91 371
ROSELAWN 34 20 +70.00% 42 28 55 44 31 254
MT AUBURN 19 24 -20.83% 30 29 44 41 46 233
SOUTH FAIRMOUNT 15 6 +150.00% 18 40 33 45 70 227
MT AIRY 31 21 +47.62% 46 36 33 32 21 220
KENNEDY HEIGHTS 24 21 +14.29% 34 21 21 36 45 202
MT WASHINGTON 43 21 +104.76% 31 19 21 22 18 175
NORTH AVONDALE 22 18 +22.22% 31 43 19 16 21 170
CUF 30 12 +150.00% 20 18 34 30 25 169
WALNUT HILLS 18 20 -10.00% 18 20 18 40 33 167
PLEASANT RIDGE 22 19 +15.79% 24 18 26 19 16 144
CARTHAGE 21 14 +50.00% 21 18 22 21 11 128
HARTWELL 20 9 +122.22% 27 7 16 14 22 115
SAYLER PARK 18 9 +100.00% 18 20 18 15 10 108
SPRING GROVE VILLAGE 19 13 +46.15% 3 8 13 22 15 93
EAST WALNUT HILLS 11 12 -8.33% 21 12 12 11 12 91
OAKLEY 10 12 -16.67% 16 18 8 11 12 87
WEST END 14 7 +100.00% 8 9 14 15 15 82
OVER THE RHINE 10 3 +233.33% 13 10 6 21 15 78
COLUMBIA TUSCULUM 16 8 +100.00% 11 13 13 8 8 77
NORTH FAIRMONT 6 4 +50.00% 8 8 13 15 21 75
HYDE PARK 8 8 No change 15 10 11 7 5 64
CLIFTON 3 2 +50.00% 7 6 14 22 7 61
EAST WESTWOOD 4 5 -20.00% 6 15 4 15 9 58
SOUTH CUMMINSVILLE 6 4 +50.00% 4 3 9 11 17 54
CORRYVILLE 5 2 +150.00% 9 9 6 5 11 47
MT LOOKOUT 8 4 +100.00% 10 10 3 4 2 41
PADDOCK HILLS 9 5 +80.00% 5 6 5 8 2 40
SEDAMSVILLE 3 6 -50.00% 1 3 5 10 12 40
RIVERSIDE 9 7 +28.57% 8 5 3 1 4 37
EAST END 3 1 +200.00% 6 2 5 8 11 36
LINWOOD 7 1 +600.00% 10 3 3 3 5 32
MILLVALE 2 0 n/a 1 5 7 6 9 30
CALIFORNIA 4 3 +33.33% 5 7 0 1 5 25
LOWER PRICE HILL 2 1 +100.00% 1 5 7 4 5 25
CAMP WASHINGTON 2 1 +100.00% 2 9 2 4 2 22
CENTRAL BUSINESS DISTRICT
2 3 -33.33% 8 4 4 1 0 22
MT ADAMS 1 1 No change 1 4 3 0 0 10
WINTON HILLS 0 3 -100.00% 4 2 1 0 0 10
PENDLETON 2 1 +100.00% 0 0 0 1 3 7
TOTAL 1,087 783 +38.83% 1,202 1,140 1,354 1,506 1541 8,613
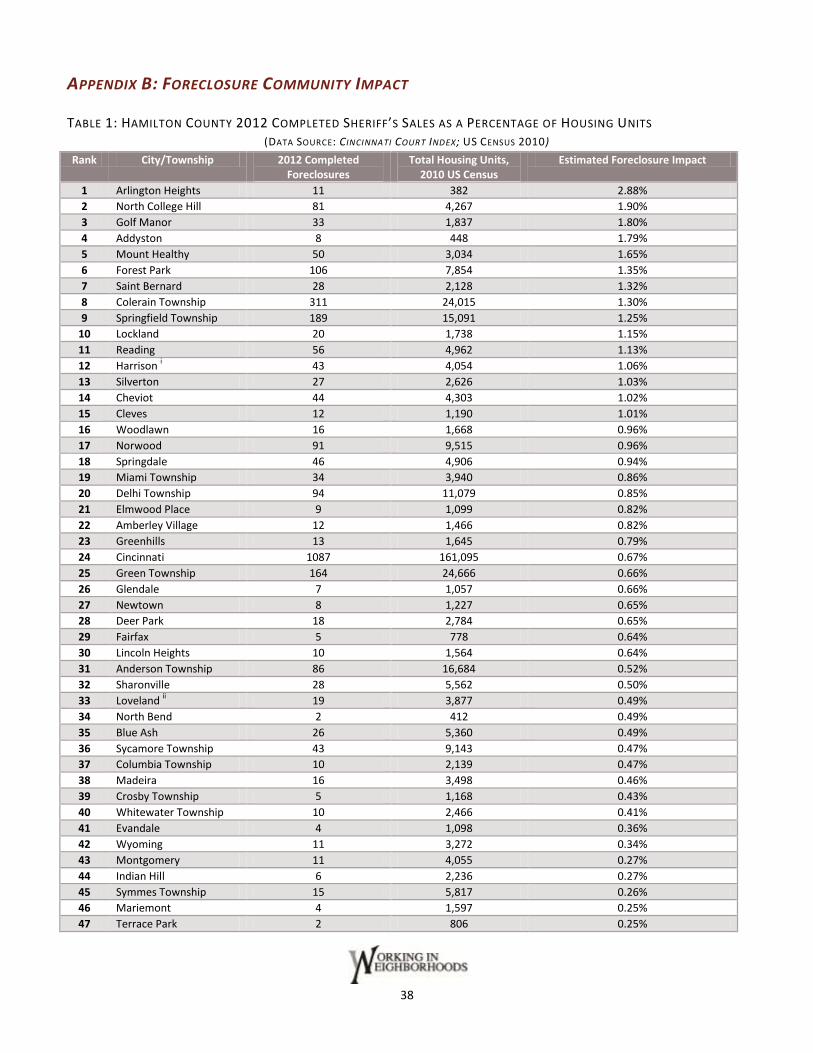
38
APPENDIX B: FORECLOSURE COMMUNITY IMPACT
TABLE 1: HAMILTON COUNTY 2012 COMPLETED SHERIFF’S SALES AS A PERCENTAGE OF HOUSING UNITS (DATA SOURCE: CINCINNATI COURT INDEX; US CENSUS 2010)
Rank City/Township 2012 Completed Foreclosures
Total Housing Units, 2010 US Census
Estimated Foreclosure Impact
1 Arlington Heights 11 382 2.88%
2 North College Hill 81 4,267 1.90%
3 Golf Manor 33 1,837 1.80%
4 Addyston 8 448 1.79%
5 Mount Healthy 50 3,034 1.65%
6 Forest Park 106 7,854 1.35%
7 Saint Bernard 28 2,128 1.32%
8 Colerain Township 311 24,015 1.30%
9 Springfield Township 189 15,091 1.25%
10 Lockland 20 1,738 1.15%
11 Reading 56 4,962 1.13%
12 Harrison i 43 4,054 1.06%
13 Silverton 27 2,626 1.03%
14 Cheviot 44 4,303 1.02%
15 Cleves 12 1,190 1.01%
16 Woodlawn 16 1,668 0.96%
17 Norwood 91 9,515 0.96%
18 Springdale 46 4,906 0.94%
19 Miami Township 34 3,940 0.86%
20 Delhi Township 94 11,079 0.85%
21 Elmwood Place 9 1,099 0.82%
22 Amberley Village 12 1,466 0.82%
23 Greenhills 13 1,645 0.79%
24 Cincinnati 1087 161,095 0.67%
25 Green Township 164 24,666 0.66%
26 Glendale 7 1,057 0.66%
27 Newtown 8 1,227 0.65%
28 Deer Park 18 2,784 0.65%
29 Fairfax 5 778 0.64%
30 Lincoln Heights 10 1,564 0.64%
31 Anderson Township 86 16,684 0.52%
32 Sharonville 28 5,562 0.50%
33 Loveland ii
19 3,877 0.49%
34 North Bend 2 412 0.49%
35 Blue Ash 26 5,360 0.49%
36 Sycamore Township 43 9,143 0.47%
37 Columbia Township 10 2,139 0.47%
38 Madeira 16 3,498 0.46%
39 Crosby Township 5 1,168 0.43%
40 Whitewater Township 10 2,466 0.41%
41 Evandale 4 1,098 0.36%
42 Wyoming 11 3,272 0.34%
43 Montgomery 11 4,055 0.27%
44 Indian Hill 6 2,236 0.27%
45 Symmes Township 15 5,817 0.26%
46 Mariemont 4 1,597 0.25%
47 Terrace Park 2 806 0.25%
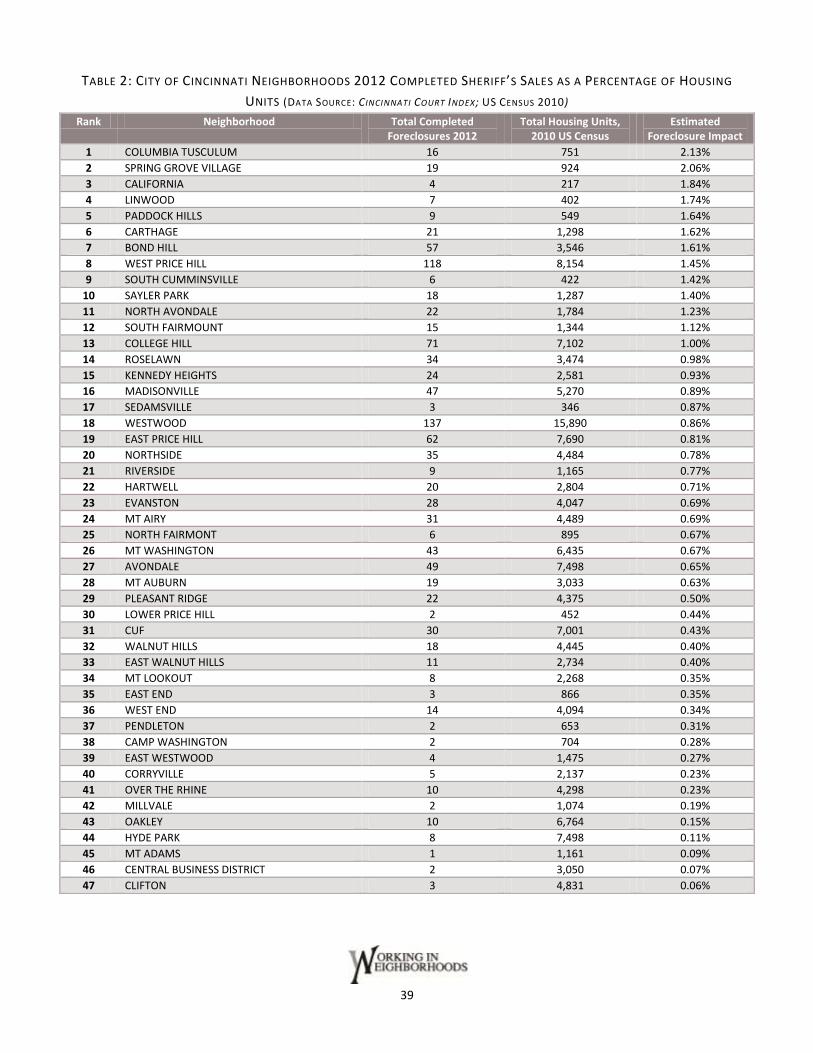
39
TABLE 2: CITY OF CINCINNATI NEIGHBORHOODS 2012 COMPLETED SHERIFF’S SALES AS A PERCENTAGE OF HOUSING
UNITS (DATA SOURCE: CINCINNATI COURT INDEX; US CENSUS 2010)
Rank Neighborhood Total Completed Foreclosures 2012
Total Housing Units, 2010 US Census
Estimated Foreclosure Impact
1 COLUMBIA TUSCULUM 16 751 2.13%
2 SPRING GROVE VILLAGE 19 924 2.06%
3 CALIFORNIA 4 217 1.84%
4 LINWOOD 7 402 1.74%
5 PADDOCK HILLS 9 549 1.64%
6 CARTHAGE 21 1,298 1.62%
7 BOND HILL 57 3,546 1.61%
8 WEST PRICE HILL 118 8,154 1.45%
9 SOUTH CUMMINSVILLE 6 422 1.42%
10 SAYLER PARK 18 1,287 1.40%
11 NORTH AVONDALE 22 1,784 1.23%
12 SOUTH FAIRMOUNT 15 1,344 1.12%
13 COLLEGE HILL 71 7,102 1.00%
14 ROSELAWN 34 3,474 0.98%
15 KENNEDY HEIGHTS 24 2,581 0.93%
16 MADISONVILLE 47 5,270 0.89%
17 SEDAMSVILLE 3 346 0.87%
18 WESTWOOD 137 15,890 0.86%
19 EAST PRICE HILL 62 7,690 0.81%
20 NORTHSIDE 35 4,484 0.78%
21 RIVERSIDE 9 1,165 0.77%
22 HARTWELL 20 2,804 0.71%
23 EVANSTON 28 4,047 0.69%
24 MT AIRY 31 4,489 0.69%
25 NORTH FAIRMONT 6 895 0.67%
26 MT WASHINGTON 43 6,435 0.67%
27 AVONDALE 49 7,498 0.65%
28 MT AUBURN 19 3,033 0.63%
29 PLEASANT RIDGE 22 4,375 0.50%
30 LOWER PRICE HILL 2 452 0.44%
31 CUF 30 7,001 0.43%
32 WALNUT HILLS 18 4,445 0.40%
33 EAST WALNUT HILLS 11 2,734 0.40%
34 MT LOOKOUT 8 2,268 0.35%
35 EAST END 3 866 0.35%
36 WEST END 14 4,094 0.34%
37 PENDLETON 2 653 0.31%
38 CAMP WASHINGTON 2 704 0.28%
39 EAST WESTWOOD 4 1,475 0.27%
40 CORRYVILLE 5 2,137 0.23%
41 OVER THE RHINE 10 4,298 0.23%
42 MILLVALE 2 1,074 0.19%
43 OAKLEY 10 6,764 0.15%
44 HYDE PARK 8 7,498 0.11%
45 MT ADAMS 1 1,161 0.09%
46 CENTRAL BUSINESS DISTRICT 2 3,050 0.07%
47 CLIFTON 3 4,831 0.06%
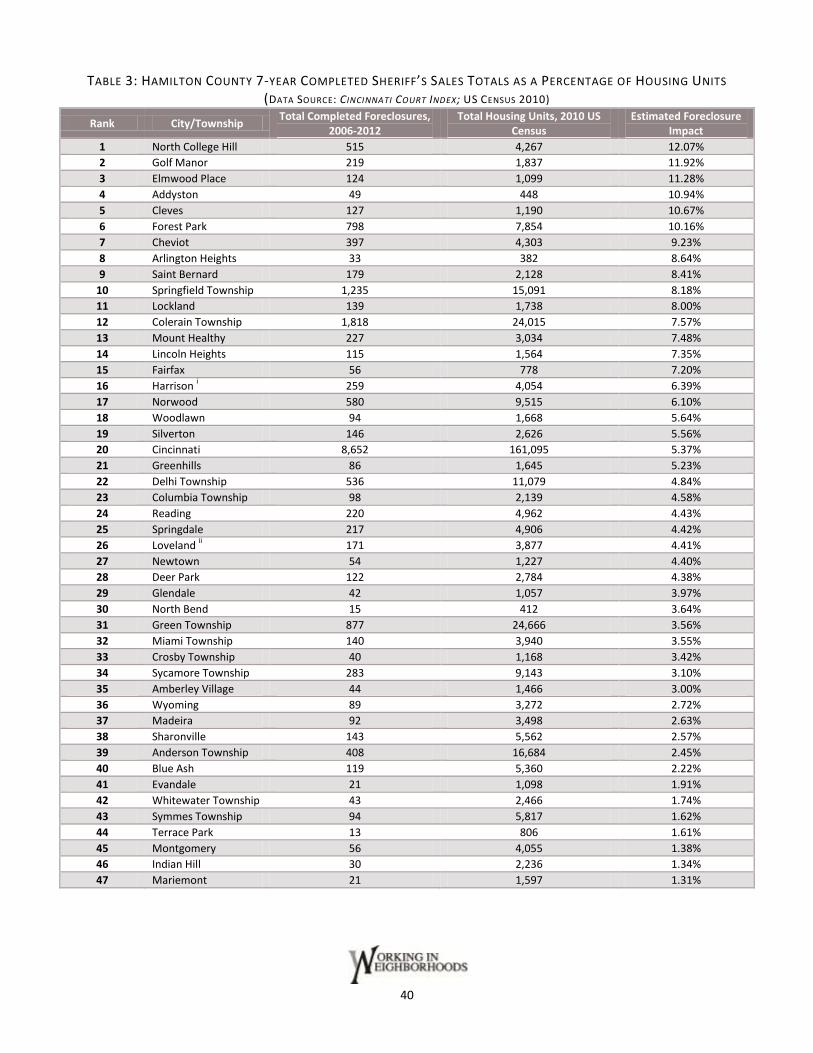
40
TABLE 3: HAMILTON COUNTY 7-YEAR COMPLETED SHERIFF’S SALES TOTALS AS A PERCENTAGE OF HOUSING UNITS (DATA SOURCE: CINCINNATI COURT INDEX; US CENSUS 2010)
Rank City/Township Total Completed Foreclosures,
2006-2012 Total Housing Units, 2010 US
Census Estimated Foreclosure
Impact
1 North College Hill 515 4,267 12.07%
2 Golf Manor 219 1,837 11.92%
3 Elmwood Place 124 1,099 11.28%
4 Addyston 49 448 10.94%
5 Cleves 127 1,190 10.67%
6 Forest Park 798 7,854 10.16%
7 Cheviot 397 4,303 9.23%
8 Arlington Heights 33 382 8.64%
9 Saint Bernard 179 2,128 8.41%
10 Springfield Township 1,235 15,091 8.18%
11 Lockland 139 1,738 8.00%
12 Colerain Township 1,818 24,015 7.57%
13 Mount Healthy 227 3,034 7.48%
14 Lincoln Heights 115 1,564 7.35%
15 Fairfax 56 778 7.20%
16 Harrison i
259 4,054 6.39%
17 Norwood 580 9,515 6.10%
18 Woodlawn 94 1,668 5.64%
19 Silverton 146 2,626 5.56%
20 Cincinnati 8,652 161,095 5.37%
21 Greenhills 86 1,645 5.23%
22 Delhi Township 536 11,079 4.84%
23 Columbia Township 98 2,139 4.58%
24 Reading 220 4,962 4.43%
25 Springdale 217 4,906 4.42%
26 Loveland ii
171 3,877 4.41%
27 Newtown 54 1,227 4.40%
28 Deer Park 122 2,784 4.38%
29 Glendale 42 1,057 3.97%
30 North Bend 15 412 3.64%
31 Green Township 877 24,666 3.56%
32 Miami Township 140 3,940 3.55%
33 Crosby Township 40 1,168 3.42%
34 Sycamore Township 283 9,143 3.10%
35 Amberley Village 44 1,466 3.00%
36 Wyoming 89 3,272 2.72%
37 Madeira 92 3,498 2.63%
38 Sharonville 143 5,562 2.57%
39 Anderson Township 408 16,684 2.45%
40 Blue Ash 119 5,360 2.22%
41 Evandale 21 1,098 1.91%
42 Whitewater Township 43 2,466 1.74%
43 Symmes Township 94 5,817 1.62%
44 Terrace Park 13 806 1.61%
45 Montgomery 56 4,055 1.38%
46 Indian Hill 30 2,236 1.34%
47 Mariemont 21 1,597 1.31%

41
TABLE 4: CITY OF CINCINNATI NEIGHBORHOODS 7-YEAR COMPLETED SHERIFF’S SALES TOTALS AS A PERCENTAGE OF
HOUSING UNITS (DATA SOURCE: CINCINNATI COURT INDEX; US CENSUS 2010)
Rank Neighborhood Total Completed
Foreclosures, 2006-2012 Total Housing Units, 2010 US
Census Estimated Foreclosure
Impact
1 SOUTH FAIRMOUNT 229 1,344 17.00%
2 SOUTH CUMMINSVILLE 55 422 12.91%
3 CALIFORNIA 25 217 11.67%
4 SEDAMSVILLE 40 346 11.42%
5 WEST PRICE HILL 871 8,154 10.69%
6 BOND HILL 371 3,546 10.47%
7 COLUMBIA TUSCULUM 78 751 10.39%
8 SPRING GROVE VILLAGE 93 924 10.11%
9 CARTHAGE 129 1,298 9.90%
10 NORTH AVONDALE 170 1,784 9.54%
11 LINWOOD 38 402 9.45%
12 NORTHSIDE 415 4,484 9.26%
13 EVANSTON 371 4,047 9.17%
14 EAST PRICE HILL 690 7,690 8.97%
15 MADISONVILLE 457 5,270 8.68%
16 SAYLER PARK 109 1,287 8.47%
17 NORTH FAIRMONT 76 895 8.44%
18 KENNEDY HEIGHTS 202 2,581 7.83%
19 MT AUBURN 233 3,033 7.68%
20 PADDOCK HILLS 41 549 7.43%
21 ROSELAWN 255 3,474 7.33%
22 COLLEGE HILL 515 7,102 7.26%
23 WESTWOOD 956 15,890 6.02%
24 LOWER PRICE HILL 26 452 5.75%
25 AVONDALE 412 7,498 5.49%
26 MT AIRY 220 4,489 4.91%
27 EAST END 38 866 4.39%
28 HARTWELL 116 2,804 4.14%
29 EAST WESTWOOD 58 1,475 3.92%
30 WALNUT HILLS 167 4,445 3.75%
31 EAST WALNUT HILLS 91 2,734 3.33%
32 PLEASANT RIDGE 144 4,375 3.30%
33 CAMP WASHINGTON 23 704 3.27%
34 RIVERSIDE 37 1,165 3.20%
35 MILLVALE 30 1,074 2.79%
36 MT WASHINGTON 176 6,435 2.74%
37 CUF 171 7,001 2.44%
38 CORRYVILLE 49 2,137 2.27%
39 WEST END 83 4,094 2.03%
40 OVER THE RHINE 80 4,298 1.87%
41 MT LOOKOUT 42 2,268 1.85%
42 OAKLEY 87 6,764 1.28%
43 CLIFTON 62 4,831 1.27%
44 PENDLETON 8 653 1.23%
45 MT ADAMS 10 1,161 0.86%
46 HYDE PARK 64 7,498 0.85%
47 CENTRAL BUSINESS DISTRICT 22 3,050 0.71%
48 WINTON HILLS 9 2,099 0.43%
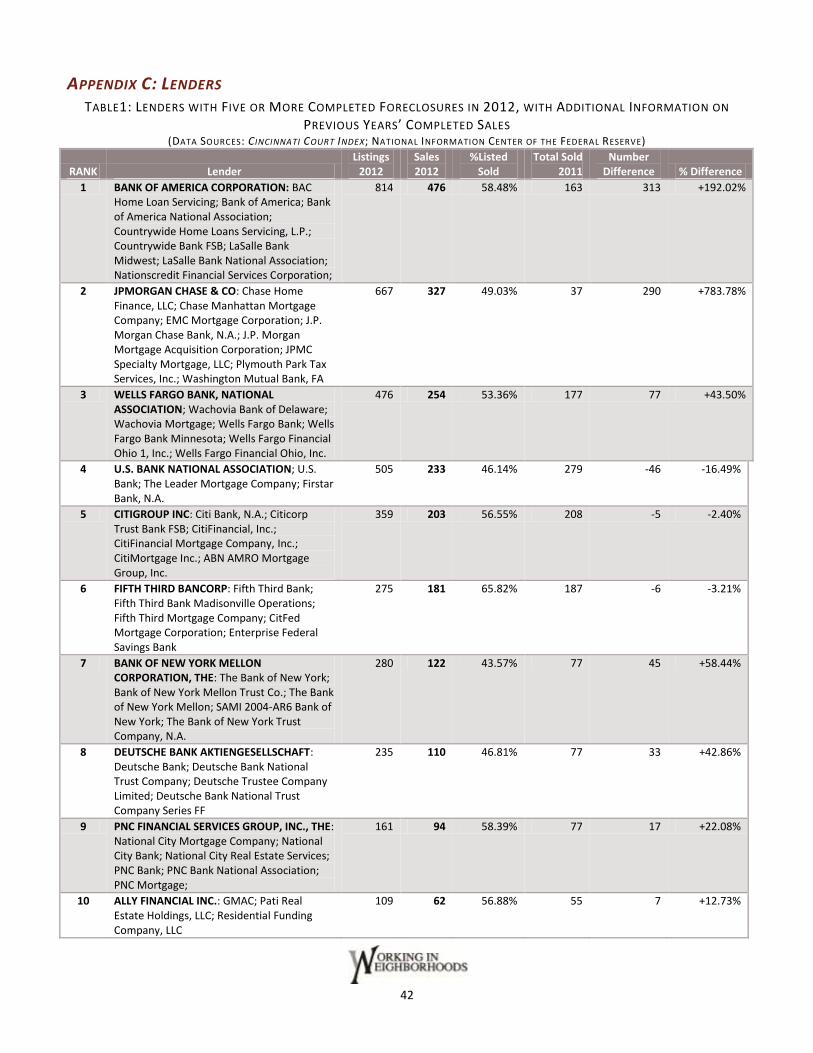
42
APPENDIX C: LENDERS TABLE1: LENDERS WITH FIVE OR MORE COMPLETED FORECLOSURES IN 2012, WITH ADDITIONAL INFORMATION ON
PREVIOUS YEARS’ COMPLETED SALES (DATA SOURCES: CINCINNATI COURT INDEX; NATIONAL INFORMATION CENTER OF THE FEDERAL RESERVE)
RANK Lender Listings
2012 Sales 2012
%Listed Sold
Total Sold 2011
Number Difference % Difference
1 BANK OF AMERICA CORPORATION: BAC Home Loan Servicing; Bank of America; Bank of America National Association; Countrywide Home Loans Servicing, L.P.; Countrywide Bank FSB; LaSalle Bank Midwest; LaSalle Bank National Association; Nationscredit Financial Services Corporation;
814 476 58.48% 163 313 +192.02%
2 JPMORGAN CHASE & CO: Chase Home Finance, LLC; Chase Manhattan Mortgage Company; EMC Mortgage Corporation; J.P. Morgan Chase Bank, N.A.; J.P. Morgan Mortgage Acquisition Corporation; JPMC Specialty Mortgage, LLC; Plymouth Park Tax Services, Inc.; Washington Mutual Bank, FA
667 327 49.03% 37 290 +783.78%
3 WELLS FARGO BANK, NATIONAL ASSOCIATION; Wachovia Bank of Delaware; Wachovia Mortgage; Wells Fargo Bank; Wells Fargo Bank Minnesota; Wells Fargo Financial Ohio 1, Inc.; Wells Fargo Financial Ohio, Inc.
476 254 53.36% 177 77 +43.50%
4 U.S. BANK NATIONAL ASSOCIATION; U.S. Bank; The Leader Mortgage Company; Firstar Bank, N.A.
505 233 46.14% 279 -46 -16.49%
5 CITIGROUP INC: Citi Bank, N.A.; Citicorp Trust Bank FSB; CitiFinancial, Inc.; CitiFinancial Mortgage Company, Inc.; CitiMortgage Inc.; ABN AMRO Mortgage Group, Inc.
359 203 56.55% 208 -5 -2.40%
6 FIFTH THIRD BANCORP: Fifth Third Bank; Fifth Third Bank Madisonville Operations; Fifth Third Mortgage Company; CitFed Mortgage Corporation; Enterprise Federal Savings Bank
275 181 65.82% 187 -6 -3.21%
7 BANK OF NEW YORK MELLON CORPORATION, THE: The Bank of New York; Bank of New York Mellon Trust Co.; The Bank of New York Mellon; SAMI 2004-AR6 Bank of New York; The Bank of New York Trust Company, N.A.
280 122 43.57% 77 45 +58.44%
8 DEUTSCHE BANK AKTIENGESELLSCHAFT: Deutsche Bank; Deutsche Bank National Trust Company; Deutsche Trustee Company Limited; Deutsche Bank National Trust Company Series FF
235 110 46.81% 77 33 +42.86%
9 PNC FINANCIAL SERVICES GROUP, INC., THE: National City Mortgage Company; National City Bank; National City Real Estate Services; PNC Bank; PNC Bank National Association; PNC Mortgage;
161 94 58.39% 77 17 +22.08%
10 ALLY FINANCIAL INC.: GMAC; Pati Real Estate Holdings, LLC; Residential Funding Company, LLC
109 62 56.88% 55 7 +12.73%

43
11 HAMILTON COUNTY, OH: Robert A. Goering, County Treasurer of Hamilton County, Ohio; Board of County Commissioners Hamilton County Ohio; Court of Common Pleas, Hamilton County, Ohio
69 55 100% 21 34 +161.90%
12 HSBC HOLDINGS PLC: HSBC Bank, U.S.A; HSBC Mortgage Corporation; HSBC Mortgage Services, Inc.; Beneficial Financial 1, Inc.; Household Realty Corporation;
78 51 65.38% 57 -6 -10.53%
13 NATIONSTAR MORTGAGE: Aurora Bank FSB; Aurora Loan Services, LLC; Lehman Brothers Holdings, Inc.; NationStar Mortgage, LLC
65 45 69.23% 39 6 +15.38%
14 THIRD FEDERAL SAVINGS AND LOAN ASSOCIATION MHC
49 37 75.51% 26 11 +42.31%
15 HUNTINGTON BANCSHARES INCORPORATED: The Huntington National Bank
55 36 65.45% 24 12 +50.00%
16 MIDFIRST BANK 54 33 61.11% 15 18 +120.00%
17 EVERBANK FINANCIAL CORP.: Everbank, Everhome Mortgage Company
46 26 56.52% 10 16 +160.00%
17 GUARDIAN BANCORP, INC : Guardian Savings Bank, FSB
45 26 57.78% 30 -4 -13.33%
19 FEDERAL NATIONAL MORTGAGE ASSOCIATION (Fannie Mae)
33 24 72.73% 20 4 +20.00%
20 M&T BANK CORPORATION: M & T Bank; Bayview Loan Servicing, LLC
36 23 63.89% 5 18 +360.00%
21 CHEVIOT FINANCIAL CORPORATION: Cheviot Savings Bank; Franklin Savings & Loan Company
31 21 67.74% 27 -6 -22.22%
21 IMB MANAGEMENT HOLDINGS GP LLC : Financial Freedom Acquisition, LLC; Onewest Bank FSB
27 21 77.78% 23 -2 -8.70%
21 LSB BANCSHARES, LLC: Union Savings Bank 26 21 80.77% 18 3 +16.67%
24 PHH MORTGAGE: PHH Mortgage Coporation; Coldwell Banker Mortgage; PHH Mortgage Services; Cendant Mortgage Corporation; Cendant Mortgage Corporation Mail Stop SV01
27 20 74.07% 28 -8 -28.57%
25 WALTER MORTGAGE COMPANY: Green Tree Servicing, LLC; Reverse Mortgage Solutions, Inc.; Conseco Finance Servicing Corp.
23 19 82.61% 7 12 +171.43%
26 CAMCO FINANCIAL CORPORATION/Advantage Bank
32 17 53.13% 19 -2 -10.53%
27 EAGLE SAVINGS BANK 17 16 94.12% Less than 5
28 FLAGSTAR BANCORP, INC.: Flagstar Bank FSB
20 15 75.00% 14 1 +7.14%
28 SUNTRUST BANKS, INC.: Suntrust Mortgage Company, Inc.; Suntrust Mortgage, Inc.
18 15 83.33% 5 10 +200.00%
30 RBS CITIZENS FINANCIAL GROUP, INC: RBS Citizen, N.A.; Charter One Bank; Citizens Bank, N.A. SBM; Dovenmuehle Mortgage
15 13 86.67% 8 5 +62.50%
31 CENLAR CAPITAL CORPORATION: Cenlar Federal Savings Bank
15 12 80.00% Less than 5
31 FEDERAL HOME LOAN MORTGAGE CORPORATION (Freddie Mac)
22 12 54.55% 6 6 +100.00%

44
33 HARRISON BUILDING AND LOAN ASSOCIATION, THE
11 11 100.00% 7 4 57.14%
34 COLUMBIA FINANCIAL, INC.: Columbia Savings Bank
10 10 100.00% Less than 5
34 LIBERTY SAVINGS BANK, F.S.B. 20 10 50.00% 14 -4 -28.57%
36 SV BANCORP, INC. : Spring Valley Bank 10 9 90.00% 5 4 80.00%
37 METLIFE, INC.: Metlife Home Loans; Metlife Bank, N.A.
10 8 80.00% Less than 5
37 MORGAN STANLEY: Saxon Mortgage Services, Inc.; FV-1, Inc.;
9 8 88.89% Less than 5
37 OCWEN LOAN SERVICING LLC 11 8 72.73% Less than 5
40 CINFED EMPLOYEES FEDERAL CREDIT UNION
7 7 100.00% 5 2 40.00%
40 FREEDOM MORTGAGE CORP. 10 7 70.00% Less than 5
40 GENERAL ELECTRIC CREDIT UNION 7 7 100.00% Less than 5
43 FOUNDATION BANCORP, INC.: Foundation Bank; Findlay Savings Bank
7 6 85.71% Less than 5
43 WESBANCO, INC. 11 6 54.55% 11 -5 -45.45%
45 KEYCORP: Keybank National Association 9 5 55.56% 6 -1 -16.67%
45 MT. WASHINGTON SAVINGS BANK: Mt. Washington Savings and Loan Company
9 5 55.56% Less than 5
45 TAYLOR BEAN AND WHITAKER MORTGAGE CORP.
10 5 50.00% Less than 5
i “Harrison” includes both the Village of Harrison and Harrison Township ii “Loveland” only includes the portion of the municipality within Hamilton County