2014 Annual Foreclosures in Minnesota - HOCMN€¦ · 2014 Annual Foreclosures in Minnesota: A...
17
2014 Annual Foreclosures in Minnesota: A Report Based on County Sheriff’s Sale Data March 9 th , 2015 Updated March 31, 2015 Published by:
Transcript of 2014 Annual Foreclosures in Minnesota - HOCMN€¦ · 2014 Annual Foreclosures in Minnesota: A...

2014 Annual Foreclosures in Minnesota: A Report Based on County Sheriff’s Sale Data
March 9th, 2015 Updated March 31, 2015
Published by:

2014 Annual Foreclosures in Minnesota: A Report Based on County Sheriff’s Sales Data (March 9, 2015) Minnesota Homeownership Center (651) 659-9336
Page 2
About the Minnesota Homeownership Center
Recognized nationally as a model of homeownership and foreclosure prevention programming, the Minnesota Homeownership Center convenes a network of 40 community‐based nonprofit, government and tribal organizations to deliver homeownership education and foreclosure prevention services to low‐ and moderate‐income households throughout Minnesota. Learn more at www.hocmn.org.
All rights reserved.
© Copyright 2015.

Table of Contents
Minnesota Foreclosure Figures .................................................................................................. 1
Figure 1: Ten‐year history of Minnesota Foreclosures ......................................................................... 1
Figure 2: Map of MN Foreclosures by County, 2014 ............................................................................ 2
Figure 3: Map of MN Foreclosure Rates by County, 2014 ................................................................... 3
Figure 4: MN County Foreclosure Counts, 2013 ‐2014 (sorted by county) .......................................... 4
Figure 5: MN County Foreclosure Counts, 2013 ‐2014 (sorted by 2014 total) .................................... 6
Figure 6: MN County Foreclosure Rates, 2013 ‐2014 (sorted by county) ............................................ 8
Figure 7: MN County Foreclosure Rates, 2013 ‐2014 (sorted by 2014 rate) ..................................... 10
Study Purpose and Objectives ................................................................................................. 12
Methodology ....................................................................................................................................... 13
Overview of the foreclosure process ................................................................................................. 13
Sheriff’s Sale Records ......................................................................................................................... 14
Data Collection ................................................................................................................................... 14
Foreclosure Rate Metric ..................................................................................................................... 14

2014 Annual Foreclosures in Minnesota: A Report Based on County Sheriff’s Sales Data (March 9, 2015) Page Minnesota Homeownership Center (651) 659-9336
1
Ten Year History of Minnesota Foreclosures
There were 8, 309 foreclosures in Minnesota in 2014. This number is 30 percent less than the same period of 2013, with a near equal decline seen in the Twin Cities metro area (down 31 percent) and in Greater MN (down 29 percent). The total number of foreclosures in 2014 is nearing the total number in 2005 (ten years ago), this year is generally regarded as the first year of the foreclosure crisis. Figure 1
The following pages include figures and appendices detailing Minnesota foreclosures. They include:
2014 Foreclosure Counts Map
A map of Minnesota representing total foreclosures by county in 2014.
p.2
2014 Foreclosure Rates Map A map of Minnesota representing foreclosure rate (in percent) by county in 2014.
p.3
2013 – 2014 Foreclosure Counts Data
Tables detailing foreclosure counts from Q1 2013 to Q2 2014, sorted by county and 2014 total.
p.4‐7
2013 – 2014 Foreclosure Rates Data
Tables detailing foreclosure rates from Q1 2013 to Q2 2014, sorted by county and 2014 rate.
p.8‐11
More Minnesota foreclosure information and historical data can be found online at www.hocmn.org.
‐
5,000
10,000
15,000
20,000
25,000
30,000
2005 2006 2007 2008 2009 2010 2011 2012 2013 2014
Minnesota
Twin Cities
Greater Minnesota

Lake ofthe Woods
4
Kittson0 Roseau
16
Koochiching20
Marshall5
Beltrami49
Lake17
Polk15
Pennington8
Clearwater8
Red Lake2
Itasca74
Norman6
Mahnomen4
Cass61
Hubbard34
Becker31
Clay43
Aitkin27
Wadena20 Crow
Wing134
Carlton73Otter
Tail69
Wilkin3
Pine78Morrison
50
MilleLacs78 Kanabec
46Grant
10 Douglas44Traverse
2 Benton53Stearns
168Pope
15Stevens
11 Isanti117 Chisago
143Big
Stone5
Sherburne211
Wright240
Anoka701Kandiyohi
50
Swift15
Meeker51 Washington
395Hennepin1751
Chippewa22 Ramsey
828McLeod75 Carver
110 Dakota680
YellowMedicine
6Renville
22 Scott224Sibley
22Goodhue
68Redwood
7Lyon20Lincoln
4Le
Sueur47
Rice118Brown
21Nicollet
24 Wabasha29
BlueEarth
72Waseca
27Pipestone
12 Dodge23
Murray5 Cottonwood
16Steele
54 Olmsted160
Winona39Watonwan
7
Faribault21
Rock6 Freeborn
60Nobles
5Jackson
6Martin
28Houston
10Mower74
Fillmore26
Cook7
St.Louis324
Todd41
Lacqui Parle
6
Data Source: County reported sheriff's sales
Actual number of foreclosures listed below each county name
0 40 8020Miles
/
2014 Foreclosures in Minnesota: A Report Based on County Sheriff's Sale Data
Map by the Center for Urban & Regional Affairs (CURA)Univeristy of Minnesota
Total Foreclosures (N)0 - 50 (57)51 - 150 (19)151 - 250 (5)251 - 500 (2)501 - 1,000 (3)1,001 - 2,500 (1)> 2,500 (0)
Minnesota Foreclosures in 2014by County

Lake ofthe Woods
4
Kittson0 Roseau
16
Koochiching20
Marshall5
Beltrami49
Lake17
Polk15
Pennington8
Clearwater8
Red Lake2
Itasca74
Norman6
Mahnomen4
Cass61
Hubbard34
Becker31
Clay43
Aitkin27
Wadena20 Crow
Wing134
Carlton73Otter
Tail69
Wilkin3
Pine78Morrison
50
MilleLacs78 Kanabec
46Grant
10 Douglas44Traverse
2 Benton53Stearns
168Pope
15Stevens
11 Isanti117 Chisago
143Big
Stone5
Sherburne211
Wright240
Anoka701Kandiyohi
50
Swift15
Meeker51 Washington
395Hennepin1751
Chippewa22 Ramsey
828McLeod75 Carver
110 Dakota680
YellowMedicine
6Renville
22 Scott224Sibley
22Goodhue
68Redwood
7Lyon20Lincoln
4Le
Sueur47
Rice118Brown
21Nicollet
24 Wabasha29
BlueEarth
72Waseca
27Pipestone
12 Dodge23
Murray5 Cottonwood
16Steele
54 Olmsted160
Winona39Watonwan
7
Faribault21
Rock6 Freeborn
60Nobles
5Jackson
6Martin
28Houston
10Mower74
Fillmore26
Cook7
St.Louis324
Todd41
Lacqui Parle
6
Minnesota Foreclosure Rates in 2014by County
Data Source: County reported sheriff's sales
Actual number of foreclosures listed below each county name
0 40 8020Miles
/
2014 Foreclosures in Minnesota: A Report Based on County Sheriff's Sale Data
Map by the Center for Urban & Regional Affairs (CURA)Univeristy of Minnesota
Foreclosure Rates (N)0% - 0.25% (27)0.26% - 0.5% (41)0.51% - 0.75% (15)0.76% - 1% (4)1.01% - 1.5% (0)1.51% - 2% (0)>2.00% (0)

2014 Annual Foreclosures in Minnesota: A Report Based on County Sheriff’s Sales Data (March 9, 2015) Minnesota Homeownership Center (651) 659-9336
Page 4
Figure 4: MN County Foreclosure Counts, 2013‐2014 (sorted by county)
Q1 2014
Q2 2014
Q3 2014
Q4 2014
2013 Total
2014 Total
2013 to 2014 % Change
Twin Cities Metro 1,303 1,157 1,128 1,101 6,754 4,689 ‐31%
Greater Minnesota* 992 923 806 893 5,080 3,624 ‐29%
Minnesota* 2,295 2,080 1,934 1,994 11,834 8,313 ‐30%
Aitkin 9 8 5 5 45 27 ‐40%
Anoka 196 177 173 155 964 701 ‐27%
Becker 7 11 8 5 40 31 ‐23%
Beltrami 10 20 11 8 48 49 +2%
Benton 13 11 10 19 70 53 ‐24%
Big Stone 0 2 0 3 3 5 +67%
Blue Earth 30 14 15 13 101 72 ‐29%
Brown 6 6 4 5 19 21 +11%
Carlton 25 10 18 20 76 73 ‐4%
Carver 35 23 22 30 172 110 ‐36%
Cass 18 10 19 14 100 61 ‐39%
Chippewa 5 3 7 7 29 22 ‐24%
Chisago 39 38 34 32 212 143 ‐33%
Clay 11 7 9 16 54 43 ‐20%
Clearwater 2 3 0 3 10 8 ‐20%
Cook 0 2 1 4 4 7 +75%
Cottonwood 4 3 7 2 17 16 ‐6%
Crow Wing 38 34 32 30 210 134 ‐36%
Dakota 179 179 161 161 925 680 ‐26%
Dodge 3 7 5 8 48 23 ‐52%
Douglas 7 10 17 10 64 44 ‐31%
Faribault 5 5 6 5 27 21 ‐22%
Fillmore 4 5 9 8 27 26 ‐4%
Freeborn 21 13 9 17 96 60 ‐38%
Goodhue 22 25 13 8 113 68 ‐40%
Grant 4 2 1 3 15 10 ‐33%
Hennepin 501 414 430 406 2,596 1751 ‐33%
Houston 2 4 3 1 15 10 ‐33%
Hubbard 10 9 8 7 41 34 ‐17%
Isanti 41 36 21 19 170 117 ‐31%
Itasca 20 17 14 23 106 74 ‐30%
Jackson 3 1 1 1 12 6 ‐50%
Kanabec 12 11 12 11 63 46 ‐27%
Kandiyohi 11 7 14 18 70 50 ‐29%
Kittson 0 0 0 0 1 0 ‐100%
Koochiching 7 2 3 8 26 20 ‐23%
Lac qui Parle 2 1 0 3 6 6 0%
Lake 8 4 2 3 24 17 ‐29%
Lake of the Woods 2 2 0 0 8 4 ‐50%
Le Sueur 18 8 10 11 70 47 33%
Lincoln 0 0 2 2 5 4 20%
Lyon 8 6 4 2 32 20 38%
Mahnomen 0 1 3 0 11 4 64%
Marshall 0 1 2 2 6 5 17%

2014 Annual Foreclosures in Minnesota: A Report Based on County Sheriff’s Sales Data (March 9, 2015) Page Minnesota Homeownership Center (651) 659-9336
5
Q1 2014
Q2 2014
Q3 2014
Q4 2014
2013 Total
2014 Total
2013 to 2014
% Change
Martin 2 6 4 16 25 28 +12%
McLeod 22 20 18 15 93 75 ‐19%
Meeker 10 13 16 12 63 51 ‐19%
Mille Lacs 14 23 21 20 112 78 ‐30%
Morrison 17 8 12 13 58 50 ‐14%
Mower 23 18 16 17 110 74 ‐33%
Murray 2 1 0 2 12 5 ‐58%
Nicollet 5 3 5 11 43 24 ‐44%
Nobles 0 1 1 3 19 5 ‐74%
Norman 2 1 0 3 9 6 ‐33%
Olmsted 43 39 39 39 212 160 ‐25%
Otter Tail 14 11 19 25 98 69 ‐30%
Pennington* 2 4 0 2 7 8 +14%
Pine 18 21 18 21 119 78 ‐34%
Pipestone 2 5 2 3 10 12 +20%
Polk 9 1 3 2 25 15 ‐40%
Pope 6 2 1 6 16 15 ‐6%
Ramsey 226 202 196 204 1,154 828 ‐28%
Red Lake 0 1 1 0 2 2 0%
Redwood 1 3 0 3 20 7 ‐65%
Renville 10 3 4 5 21 22 +5%
Rice 28 41 18 31 179 118 ‐34%
Rock 0 3 0 3 10 6 ‐40%
Roseau 4 3 5 4 20 16 ‐20%
Saint Louis 92 82 70 80 377 324 ‐14%
Scott 65 62 51 46 354 224 ‐37%
Sherburne 57 63 48 43 280 211 ‐25%
Sibley 6 4 7 5 39 22 ‐44%
Stearns 39 48 44 37 246 168 ‐32%
Steele 13 15 13 13 98 54 ‐45%
Stevens 1 3 1 6 11 11 0%
Swift 6 4 1 4 10 15 +50%
Todd 8 17 6 10 73 41 ‐44%
Traverse 1 0 1 0 6 2 ‐67%
Wabasha 4 15 6 4 32 29 ‐9%
Wadena 9 3 5 3 29 20 ‐31%
Waseca 7 5 8 7 36 27 ‐25%
Washington 101 100 95 99 589 395 ‐33%
Watonwan 0 3 3 1 24 7 ‐71%
Wilkin 1 1 0 1 8 3 ‐63%
Winona 10 13 6 10 51 39 ‐24%
Wright 78 58 46 58 372 240 ‐35%
Yellow Medicine 1 3 0 2 11 6 ‐45%
* Q1 & Q2 2014 data for Pennington County was updated for this annual report.

2014 Annual Foreclosures in Minnesota: A Report Based on County Sheriff’s Sales Data (March 9, 2015) Minnesota Homeownership Center (651) 659-9336
Page 6
Figure 5: MN County Foreclosure Counts, 2013‐2014 (sorted by 2014 total)
Q1 2014
Q2 2014
Q3 2014
Q4 2014
2013 Total
2014 Total
2013 to 2014
% Change
Twin Cities Metro 1,303 1,157 1,128 1,101 6,754 4,689 ‐31%
Greater Minnesota* 992 923 806 893 5,080 3,624 ‐29%
Minnesota* 2,295 2,080 1,934 1,994 11,834 8,313 ‐30%
Hennepin 501 414 430 406 2,596 1751 ‐33%
Ramsey 226 202 196 204 1,154 828 ‐28%
Anoka 196 177 173 155 964 701 ‐27%
Dakota 179 179 161 161 925 680 ‐26%
Washington 101 100 95 99 589 395 ‐33%
Saint Louis 92 82 70 80 377 324 ‐14%
Wright 78 58 46 58 372 240 ‐35%
Scott 65 62 51 46 354 224 ‐37%
Sherburne 57 63 48 43 280 211 ‐25%
Stearns 39 48 44 37 246 168 ‐32%
Olmsted 43 39 39 39 212 160 ‐25%
Chisago 39 38 34 32 212 143 ‐33%
Crow Wing 38 34 32 30 210 134 ‐36%
Rice 28 41 18 31 179 118 ‐34%
Isanti 41 36 21 19 170 117 ‐31%
Carver 35 23 22 30 172 110 ‐36%
Mille Lacs 14 23 21 20 112 78 ‐30%
Pine 18 21 18 21 119 78 ‐34%
McLeod 22 20 18 15 93 75 ‐19%
Itasca 20 17 14 23 106 74 ‐30%
Mower 23 18 16 17 110 74 ‐33%
Carlton 25 10 18 20 76 73 ‐4%
Blue Earth 30 14 15 13 101 72 ‐29%
Otter Tail 14 11 19 25 98 69 ‐30%
Goodhue 22 25 13 8 113 68 ‐40%
Cass 18 10 19 14 100 61 ‐39%
Freeborn 21 13 9 17 96 60 ‐38%
Steele 13 15 13 13 98 54 ‐45%
Benton 13 11 10 19 70 53 ‐24%
Meeker 10 13 16 12 63 51 ‐19%
Kandiyohi 11 7 14 18 70 50 ‐29%
Morrison 17 8 12 13 58 50 ‐14%
Beltrami 10 20 11 8 48 49 +2%
Le Sueur 18 8 10 11 70 47 ‐33%
Kanabec 12 11 12 11 63 46 ‐27%
Douglas 7 10 17 10 64 44 ‐31%
Clay 11 7 9 16 54 43 ‐20%
Todd 8 17 6 10 73 41 ‐44%
Winona 10 13 6 10 51 39 ‐24%
Hubbard 10 9 8 7 41 34 ‐17%
Becker 7 11 8 5 40 31 ‐23%
Wabasha 4 15 6 4 32 29 ‐9%
Martin 2 6 4 16 25 28 +12%
Waseca 9 8 5 5 45 27 ‐40%

2014 Annual Foreclosures in Minnesota: A Report Based on County Sheriff’s Sales Data (March 9, 2015) Page Minnesota Homeownership Center (651) 659-9336
7
Q1 2014
Q2 2014
Q3 2014
Q4 2014
2013 Total
2014 Total
2013 to 2014
% Change
Fillmore 4 5 9 8 27 26 ‐4%
Nicollet 5 3 5 11 43 24 ‐44%
Dodge 3 7 5 8 48 23 ‐52%
Chippewa 5 3 7 7 29 22 ‐24%
Renville 10 3 4 5 21 22 +5%
Sibley 6 4 7 5 39 22 ‐44%
Brown 6 6 4 5 19 21 +11%
Faribault 5 5 6 5 27 21 ‐22%
Koochiching 7 2 3 8 26 20 ‐23%
Lyon 8 6 4 2 32 20 ‐38%
Wadena 9 3 5 3 29 20 ‐31%
Lake 8 4 2 3 24 17 ‐29%
Cottonwood 4 3 7 2 17 16 ‐6%
Roseau 4 3 5 4 20 16 ‐20%
Polk 9 1 3 2 25 15 ‐40%
Pope 6 2 1 6 16 15 ‐6%
Swift 6 4 1 4 10 15 +50%
Pipestone 2 5 2 3 10 12 +20%
Stevens 1 3 1 6 11 11 0%
Grant 4 2 1 3 15 10 ‐33%
Houston 2 4 3 1 15 10 ‐33%
Clearwater 2 3 0 3 10 8 ‐20%
Pennington 2 4 0 2 7 8 +14%
Cook 0 2 1 4 4 7 +75%
Redwood 1 3 0 3 20 7 ‐65%
Watonwan 0 3 3 1 24 7 ‐71%
Jackson 3 1 1 1 12 6 ‐50%
Lac qui Parle 2 1 0 3 6 6 0%
Norman 2 1 0 3 9 6 ‐33%
Rock 0 3 0 3 10 6 ‐40%
Yellow Medicine 1 3 0 2 11 6 ‐45%
Big Stone 0 2 0 3 3 5 +67%
Marshall 0 1 2 2 6 5 ‐17%
Murray 2 1 0 2 12 5 ‐58%
Lake of the Woods 2 2 0 0 8 4 ‐50%
Nobles 0 1 1 3 19 5 ‐74%
Lincoln 0 0 2 2 5 4 ‐20%
Mahnomen 0 1 3 0 11 4 ‐64%
Wilkin 1 1 0 1 8 3 ‐63%
Red Lake 0 1 1 0 2 2 0%
Traverse 1 0 1 0 6 2 ‐67%
Kittson 0 0 0 0 1 0 ‐100%
*Q1 & Q2 2014 data for Pennington County was updated for this annual report.

2014 Annual Foreclosures in Minnesota: A Report Based on County Sheriff’s Sales Data (March 9, 2015) Minnesota Homeownership Center (651) 659-9336
Page 8
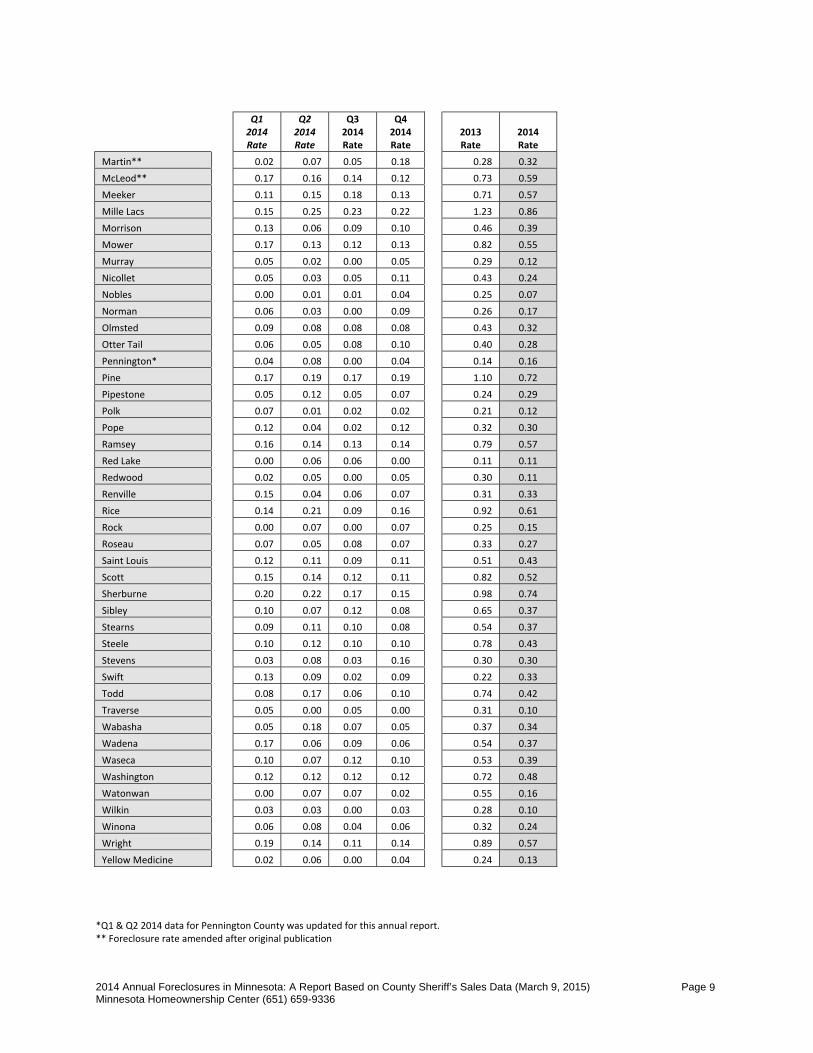
Figure 6: MN County Foreclosure Rates, 2013‐2014 (sorted by county)
Q1 2014 Rate
Q2 2014 Rate
Q3 2014 Rate
Q4 2014 Rate
2013 Rate
2014 Rate
Twin Cities Metro 0.14 0.13 0.12 0.12 0.73 0.51
Greater Minnesota 0.11 0.10 0.09 0.10 0.57 0.41
Minnesota 0.13 0.11 0.11 0.11 0.65 0.46
Aitkin 0.12 0.11 0.07 0.07 0.60 0.36
Anoka 0.18 0.16 0.16 0.14 0.88 0.64
Becker 0.06 0.09 0.06 0.04 0.32 0.25
Beltrami 0.08 0.16 0.09 0.06 0.38 0.38
Benton 0.11 0.10 0.09 0.17 0.61 0.46
Big Stone 0.00 0.07 0.00 0.11 0.11 0.19
Blue Earth 0.16 0.07 0.08 0.07 0.54 0.38
Brown 0.06 0.06 0.04 0.05 0.19 0.21
Carlton 0.20 0.08 0.15 0.16 0.61 0.59
Carver 0.12 0.08 0.07 0.10 0.57 0.36
Cass 0.16 0.09 0.17 0.12 0.87 0.53
Chippewa 0.10 0.06 0.14 0.14 0.56 0.42
Chisago 0.21 0.21 0.19 0.17 1.16 0.78
Clay 0.06 0.04 0.05 0.09 0.30 0.24
Clearwater 0.06 0.09 0.00 0.09 0.29 0.23
Cook 0.00 0.10 0.05 0.20 0.20 0.36
Cottonwood 0.08 0.06 0.13 0.04 0.32 0.30
Crow Wing 0.15 0.14 0.13 0.12 0.84 0.54
Dakota 0.14 0.14 0.12 0.12 0.71 0.52
Dodge 0.04 0.10 0.07 0.11 0.69 0.33
Douglas 0.05 0.07 0.12 0.07 0.45 0.31
Faribault 0.08 0.08 0.09 0.08 0.41 0.32
Fillmore 0.05 0.06 0.10 0.09 0.30 0.29
Freeborn 0.16 0.10 0.07 0.13 0.71 0.44
Goodhue 0.13 0.15 0.08 0.05 0.67 0.40
Grant 0.14 0.07 0.04 0.11 0.53 0.35
Hennepin 0.13 0.11 0.11 0.11 0.68 0.46
Houston 0.03 0.05 0.04 0.01 0.20 0.13
Hubbard 0.12 0.11 0.10 0.09 0.50 0.41
Isanti 0.31 0.27 0.16 0.14 1.26 0.87
Itasca 0.11 0.09 0.08 0.13 0.59 0.41
Jackson 0.06 0.02 0.02 0.02 0.25 0.13
Kanabec 0.19 0.18 0.19 0.18 1.01 0.74
Kandiyohi 0.07 0.05 0.09 0.12 0.45 0.32
Kittson 0.00 0.00 0.00 0.00 0.04 0.00
Koochiching 0.12 0.04 0.05 0.14 0.46 0.36
Lac qui Parle 0.06 0.03 0.00 0.09 0.17 0.17
Lake 0.16 0.08 0.04 0.06 0.48 0.34
Lake of the Woods 0.11 0.11 0.00 0.00 0.45 0.22
Le Sueur 0.17 0.08 0.09 0.10 0.66 0.44
Lincoln 0.00 0.00 0.07 0.07 0.17 0.13
Lyon 0.09 0.07 0.05 0.02 0.37 0.23
Mahnomen** 0.00 0.06 0.17 0.00 0.63 0.23
Marshall** 0.00 0.02 0.04 0.04 0.12 0.10
2014 Annual Foreclosures in Minnesota: A Report Based on County Sheriff’s Sales Data (March 9, 2015) Page Minnesota Homeownership Center (651) 659-9336
9
Q1 2014 Rate
Q2 2014 Rate
Q3 2014 Rate
Q4 2014 Rate
2013 Rate
2014 Rate
Martin** 0.02 0.07 0.05 0.18 0.28 0.32
McLeod** 0.17 0.16 0.14 0.12 0.73 0.59
Meeker 0.11 0.15 0.18 0.13 0.71 0.57
Mille Lacs 0.15 0.25 0.23 0.22 1.23 0.86
Morrison 0.13 0.06 0.09 0.10 0.46 0.39
Mower 0.17 0.13 0.12 0.13 0.82 0.55
Murray 0.05 0.02 0.00 0.05 0.29 0.12
Nicollet 0.05 0.03 0.05 0.11 0.43 0.24
Nobles 0.00 0.01 0.01 0.04 0.25 0.07
Norman 0.06 0.03 0.00 0.09 0.26 0.17
Olmsted 0.09 0.08 0.08 0.08 0.43 0.32
Otter Tail 0.06 0.05 0.08 0.10 0.40 0.28
Pennington* 0.04 0.08 0.00 0.04 0.14 0.16
Pine 0.17 0.19 0.17 0.19 1.10 0.72
Pipestone 0.05 0.12 0.05 0.07 0.24 0.29
Polk 0.07 0.01 0.02 0.02 0.21 0.12
Pope 0.12 0.04 0.02 0.12 0.32 0.30
Ramsey 0.16 0.14 0.13 0.14 0.79 0.57
Red Lake 0.00 0.06 0.06 0.00 0.11 0.11
Redwood 0.02 0.05 0.00 0.05 0.30 0.11
Renville 0.15 0.04 0.06 0.07 0.31 0.33
Rice 0.14 0.21 0.09 0.16 0.92 0.61
Rock 0.00 0.07 0.00 0.07 0.25 0.15
Roseau 0.07 0.05 0.08 0.07 0.33 0.27
Saint Louis 0.12 0.11 0.09 0.11 0.51 0.43
Scott 0.15 0.14 0.12 0.11 0.82 0.52
Sherburne 0.20 0.22 0.17 0.15 0.98 0.74
Sibley 0.10 0.07 0.12 0.08 0.65 0.37
Stearns 0.09 0.11 0.10 0.08 0.54 0.37
Steele 0.10 0.12 0.10 0.10 0.78 0.43
Stevens 0.03 0.08 0.03 0.16 0.30 0.30
Swift 0.13 0.09 0.02 0.09 0.22 0.33
Todd 0.08 0.17 0.06 0.10 0.74 0.42
Traverse 0.05 0.00 0.05 0.00 0.31 0.10
Wabasha 0.05 0.18 0.07 0.05 0.37 0.34
Wadena 0.17 0.06 0.09 0.06 0.54 0.37
Waseca 0.10 0.07 0.12 0.10 0.53 0.39
Washington 0.12 0.12 0.12 0.12 0.72 0.48
Watonwan 0.00 0.07 0.07 0.02 0.55 0.16
Wilkin 0.03 0.03 0.00 0.03 0.28 0.10
Winona 0.06 0.08 0.04 0.06 0.32 0.24
Wright 0.19 0.14 0.11 0.14 0.89 0.57
Yellow Medicine 0.02 0.06 0.00 0.04 0.24 0.13
*Q1 & Q2 2014 data for Pennington County was updated for this annual report. ** Foreclosure rate amended after original publication

2014 Annual Foreclosures in Minnesota: A Report Based on County Sheriff’s Sales Data (March 9, 2015) Minnesota Homeownership Center (651) 659-9336
Page 10
Figure 7: MN County Foreclosure Rates, 2012‐2013 (sorted by 2014 rate)
Q1 2014 Rate
Q2 2014 Rate
Q3 2014 Rate
Q4 2014 Rate
2013 Rate
2014 Rate
Twin Cities Metro 0.14 0.13 0.12 0.12 0.73 0.51
Greater Minnesota 0.11 0.10 0.09 0.10 0.57 0.41
Minnesota 0.13 0.11 0.11 0.11 0.65 0.46
Isanti 0.31 0.27 0.16 0.14 1.26 0.87
Mille Lacs 0.15 0.25 0.23 0.22 1.23 0.86
Chisago 0.21 0.21 0.19 0.17 1.16 0.78
Sherburne 0.20 0.22 0.17 0.15 0.98 0.74
Kanabec 0.19 0.18 0.19 0.18 1.01 0.74
Pine 0.17 0.19 0.17 0.19 1.10 0.72
Anoka 0.18 0.16 0.16 0.14 0.88 0.64
Rice 0.14 0.21 0.09 0.16 0.92 0.61
Carlton 0.20 0.08 0.15 0.16 0.61 0.59
McLeod** 0.17 0.16 0.14 0.12 0.73 0.59
Wright 0.19 0.14 0.11 0.14 0.89 0.57
Meeker 0.11 0.15 0.18 0.13 0.71 0.57
Ramsey 0.16 0.14 0.13 0.14 0.79 0.57
Mower 0.17 0.13 0.12 0.13 0.82 0.55
Crow Wing 0.15 0.14 0.13 0.12 0.84 0.54
Cass 0.16 0.09 0.17 0.12 0.87 0.53
Dakota 0.14 0.14 0.12 0.12 0.71 0.52
Scott 0.15 0.14 0.12 0.11 0.82 0.52
Washington 0.12 0.12 0.12 0.12 0.72 0.48
Benton 0.11 0.10 0.09 0.17 0.61 0.46
Hennepin 0.13 0.11 0.11 0.11 0.68 0.46
Freeborn 0.16 0.10 0.07 0.13 0.71 0.44
Le Sueur 0.17 0.08 0.09 0.10 0.66 0.44
Saint Louis 0.12 0.11 0.09 0.11 0.51 0.43
Steele 0.10 0.12 0.10 0.10 0.78 0.43
Chippewa 0.10 0.06 0.14 0.14 0.56 0.42
Todd 0.08 0.17 0.06 0.10 0.74 0.42
Hubbard 0.12 0.11 0.10 0.09 0.50 0.41
Itasca 0.11 0.09 0.08 0.13 0.59 0.41
Goodhue 0.13 0.15 0.08 0.05 0.67 0.40
Morrison 0.13 0.06 0.09 0.10 0.46 0.39
Waseca 0.10 0.07 0.12 0.10 0.53 0.39
Beltrami 0.08 0.16 0.09 0.06 0.38 0.38
Blue Earth 0.16 0.07 0.08 0.07 0.54 0.38
Wadena 0.17 0.06 0.09 0.06 0.54 0.37
Stearns 0.09 0.11 0.10 0.08 0.54 0.37
Sibley 0.10 0.07 0.12 0.08 0.65 0.37
Carver 0.12 0.08 0.07 0.10 0.57 0.36
Aitkin 0.12 0.11 0.07 0.07 0.60 0.36
Koochiching 0.12 0.04 0.05 0.14 0.46 0.36
Cook 0.00 0.10 0.05 0.20 0.20 0.36
Grant 0.14 0.07 0.04 0.11 0.53 0.35
Wabasha 0.05 0.18 0.07 0.05 0.37 0.34

2014 Annual Foreclosures in Minnesota: A Report Based on County Sheriff’s Sales Data (March 9, 2015) Page Minnesota Homeownership Center (651) 659-9336
11
Q1 2014 Rate
Q2 2014 Rate
Q3 2014 Rate
Q4 2014 Rate
2013 Rate
2014 Rate
Lake 0.16 0.08 0.04 0.06 0.48 0.34
Swift 0.13 0.09 0.02 0.09 0.22 0.33
Dodge 0.04 0.10 0.07 0.11 0.69 0.33
Renville 0.15 0.04 0.06 0.07 0.31 0.33
Olmsted 0.09 0.08 0.08 0.08 0.43 0.32
Kandiyohi 0.07 0.05 0.09 0.12 0.45 0.32
Faribault 0.08 0.08 0.09 0.08 0.41 0.32
Martin** 0.02 0.07 0.05 0.18 0.28 0.32
Douglas 0.05 0.07 0.12 0.07 0.45 0.31
Cottonwood 0.08 0.06 0.13 0.04 0.32 0.30
Pope 0.12 0.04 0.02 0.12 0.32 0.30
Stevens 0.03 0.08 0.03 0.16 0.30 0.30
Fillmore 0.05 0.06 0.10 0.09 0.30 0.29
Pipestone 0.05 0.12 0.05 0.07 0.24 0.29
Otter Tail 0.06 0.05 0.08 0.10 0.40 0.28
Roseau 0.07 0.05 0.08 0.07 0.33 0.27
Becker 0.06 0.09 0.06 0.04 0.32 0.25
Winona 0.06 0.08 0.04 0.06 0.32 0.24
Clay 0.06 0.04 0.05 0.09 0.30 0.24
Nicollet 0.05 0.03 0.05 0.11 0.43 0.24
Clearwater 0.06 0.09 0.00 0.09 0.29 0.23
Lyon 0.09 0.07 0.05 0.02 0.37 0.23
Mahnomen** 0.00 0.06 0.17 0.00 0.63 0.23
Lake of the Woods 0.11 0.11 0.00 0.00 0.45 0.22
Brown 0.06 0.06 0.04 0.05 0.19 0.21
Big Stone 0.00 0.07 0.00 0.11 0.11 0.19
Norman 0.06 0.03 0.00 0.09 0.26 0.17
Lac qui Parle 0.06 0.03 0.00 0.09 0.17 0.17
Pennington 0.04 0.08 0.00 0.04 0.14 0.16
Watonwan 0.00 0.07 0.07 0.02 0.55 0.16
Rock 0.00 0.07 0.00 0.07 0.25 0.15
Lincoln 0.00 0.00 0.07 0.07 0.17 0.13
Houston 0.03 0.05 0.04 0.01 0.20 0.13
Yellow Medicine 0.02 0.06 0.00 0.04 0.24 0.13
Jackson 0.06 0.02 0.02 0.02 0.25 0.13
Polk 0.07 0.01 0.02 0.02 0.21 0.12
Murray 0.05 0.02 0.00 0.05 0.29 0.12
Red Lake 0.00 0.06 0.06 0.00 0.11 0.11
Redwood 0.02 0.05 0.00 0.05 0.30 0.11
Marshall** 0.00 0.02 0.04 0.04 0.12 0.10
Wilkin 0.03 0.03 0.00 0.03 0.28 0.10
Traverse 0.05 0.00 0.05 0.00 0.31 0.10
Nobles 0.00 0.01 0.01 0.04 0.25 0.07
Kittson 0.00 0.00 0.00 0.00 0.04 0.00
*Q1 & Q2 2014 data not available for Pennington County. ** Foreclosure rate amended post publication

2014 Annual Foreclosures in Minnesota: A Report Based on County Sheriff’s Sales Data (March 9, 2015) Minnesota Homeownership Center (651) 659-9336
Page 12
Study Purpose and Objectives
This report provides policymakers and other community leaders with updated Minnesota foreclosure data as they design solutions to address foreclosures and their impact on Minnesota communities.
This report is part of the Foreclosures in Minnesota: A Report Based on County Sheriff’s Sale Data series, in which comparable reports have been released annually since 2007 and semi‐annually since 2009. HousingLink was contracted to conduct the research and prepare the analysis in all reports 2009 through 2013. Starting in 2014, the Center began conducting the research and preparing the analysis.
Key updated foreclosure data included in this report are as follows:
Updated foreclosure counts for all Minnesota counties including the Twin Cites seven‐county metro and Greater Minnesota to reflect actual foreclosures in 2014.
Updated foreclosure rates for all Minnesota counties in 2014.1 The calculation of foreclosure rates makes it possible to compare the relative impact of foreclosure on areas with different population sizes.
2012 Parcel Counts on which to base rate calculations. Residential parcel counts by county are provided by the Minnesota Department of Revenue2 .
This report does not include a foreclosure projection. Reports issued prior to 2009 included a foreclosure projection. These projections were based solely on recent foreclosure trends with the assumption that the same patterns would continue into the upcoming year. Due to continuing uncertainty about future economic conditions, this report does not include a projection.
Some factors that may contribute to foreclosures include but are not limited to: unstable economic conditions; increasing unemployment rates; falling housing prices; rising numbers of mortgage delinquencies; and resetting or recasting adjustable rate mortgages. Conversely, more active intervention and loss mitigation activities on the part of counselors and lenders help to reduce the number of foreclosures.
1 Releases of Foreclosures in Minnesota: A Report Based on County Sheriff’s Sale Data prior to August 2009 release used household estimates to calculate the foreclosure rate. As of the August 2009 report, residential parcels have been used to calculate foreclosure rate. See Foreclosure Rate Metric for more information. 2 For purposes of this report, residential parcel data includes property types “Residential,” “Apartment,” “Farm with Buildings, >35 Acres,” and “Farm with Buildings, <35 acres.”
2014 Annual Foreclosures in Minnesota: A Report Based on County Sheriff’s Sales Data (March 9, 2015) Page Minnesota Homeownership Center (651) 659-9336
13
Methodology
To help understand the methods used in this report, it is important to outline Minnesota’s foreclosure timeline. Data is collected throughout the process, much of which is useful for analyzing the characteristics of those mortgages and properties that have defaulted.
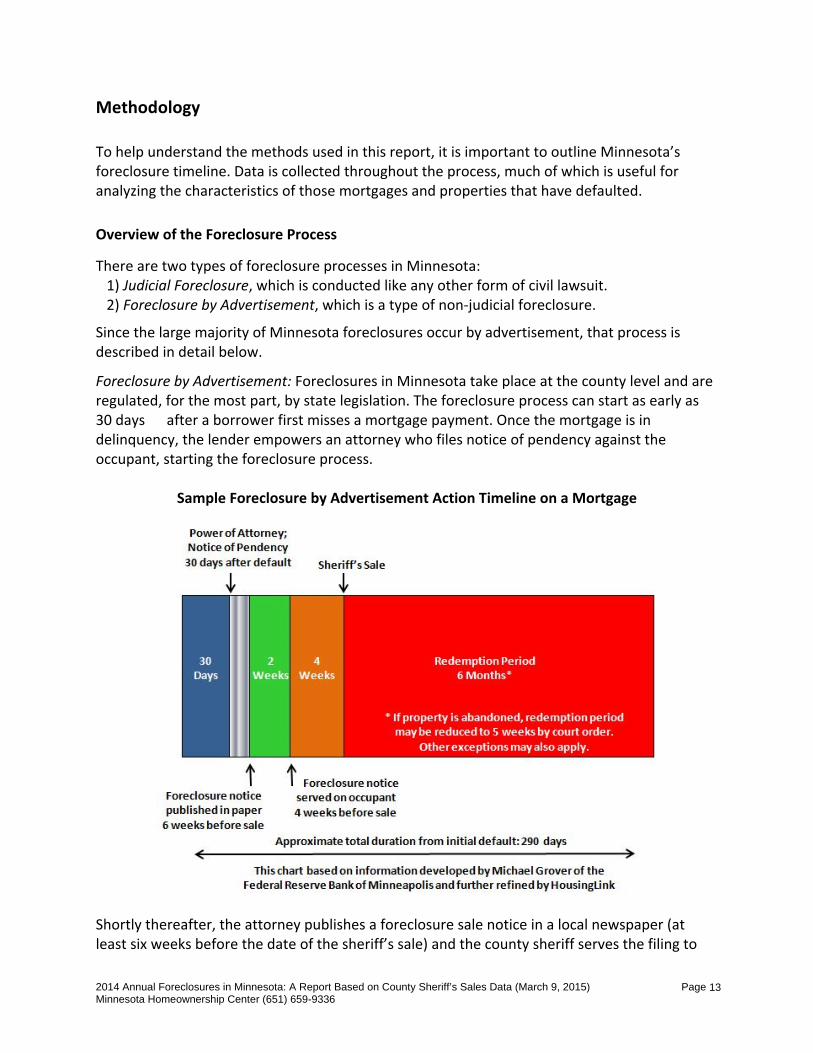
Overview of the Foreclosure Process
There are two types of foreclosure processes in Minnesota: 1) Judicial Foreclosure, which is conducted like any other form of civil lawsuit. 2) Foreclosure by Advertisement, which is a type of non‐judicial foreclosure.
Since the large majority of Minnesota foreclosures occur by advertisement, that process is described in detail below.
Foreclosure by Advertisement: Foreclosures in Minnesota take place at the county level and are regulated, for the most part, by state legislation. The foreclosure process can start as early as 30 days after a borrower first misses a mortgage payment. Once the mortgage is in delinquency, the lender empowers an attorney who files notice of pendency against the occupant, starting the foreclosure process.
Sample Foreclosure by Advertisement Action Timeline on a Mortgage
Shortly thereafter, the attorney publishes a foreclosure sale notice in a local newspaper (at least six weeks before the date of the sheriff’s sale) and the county sheriff serves the filing to
2014 Annual Foreclosures in Minnesota: A Report Based on County Sheriff’s Sales Data (March 9, 2015) Minnesota Homeownership Center (651) 659-9336
Page 14
the occupant. At any point before the sheriff’s sale, the property owner can reinstate the mortgage by paying all dues, fees and expenses.1
After the notice has been published and served, the sheriff’s sale occurs and the sheriff auctions the property off to the highest bidder, resulting in foreclosure of the mortgage. Following the sale is a redemption period of up to six months2, during which the borrower can redeem the property by paying the amount of sale plus interest, taxes, fees, or liens on the property. Borrowers who do not redeem the property by the expiration of the redemption period lose title and right of occupancy in the property.
Sheriff’s Sale Records
Sheriff’s sale records are the primary data that identify foreclosed properties and are identified as “foreclosures” within this report. However, it is helpful to understand the following: Sheriff’s sale records do not reflect the total number of properties that enter the
foreclosure process. Some portion of properties identified in sheriff’s sale records do not result in actual loss of
title and occupancy for borrowers because they are redeemed within the allowed timeframe.
A small percentage of sheriff’s sale records do not relate to residential mortgages.3 According to a previous study conducted by the Federal Reserve and Macalester College, less than 2 percent of Minneapolis‐St. Paul properties sold at sheriff’s sales are commercial. Also, HousingLink estimates approximately 2 percent of properties in its foreclosure database are the result of association liens. Taking into account these two figures, it is estimated that at least 95 percent of the foreclosures in this study represent residential properties.
Data Collection
To obtain the number of sheriff’s sales in each county, Minnesota Homeownership Center contacted all Minnesota counties. For the updates in this report, counties were asked to provide Minnesota Homeownership Center with the total number of sheriff’s sales that occurred in their jurisdiction through the end of the reporting period.
Foreclosure Rate Metric
The calculation of a foreclosure rate makes it possible to compare the relative impact of foreclosures on areas with different population sizes. The foreclosure rate used in this report identifies the number of sheriff’s sales as a percent of total residential parcels.
foreclosure rate (in percentage) = sheriff’s sales in county / residential parcels in county
1 As of June 15, 2009, MN State Law allows homeowners to delay their foreclosure sale. The homeowner must file for postponement between the first publication of the sheriff’s sale and 15 days prior to the sale. This reduces the redemption period. See www.hocmn.org for details. 2 Some exceptions apply. 3 Residential mortgages include single-family and multi-family homes.