A Comprehensive View to Surge Frequencies and Stall ...
20
380 International Journal of Fluid Machinery and Systems DOI: http://dx.doi.org/10.5293/IJFMS.2020.13.2.380 Vol. 13, No. 2, April-June 2020 ISSN (Online): 1882-9554 Original Paper A Comprehensive View to Surge Frequencies and Stall Stagnations in Axial Flow Compressor Systems Nobuyuki Yamaguchi 1 1 Department of Mechanical Engineering, Meisei University (retired) 2-1-25, Akanedai, Aoba-ku, Yokohama City, 227-0066, Japan, [email protected] Abstract Essential features of compressor surge phenomena are found to be described by the following two non-dimensional parameters; a resonance excitation frequency and a surge frequency parameter. The former is the number of times of excitations by the system resonance frequency given to the fluid particle in the time required for the particle to pass through the whole flowpath, or, in short, the resonance frequency multiplied by the passing time. The latter is the number of surge cycles repeated in the particle passing time. When multiplied by corresponding Mach number of the compressor tip speed, both parameters become nearly independent of the compressor speeds. Both parameters construct numerical-experimentally a whole picture of the surge behaviors on the basis of simulation results. It shows the behaviors of surge frequencies and the stall stagnation limits affected by the resonance excitation frequency under the influence of various factors, such as flowpath configurations, relative locations of the compressor in the flowpath, numbers of compressor stages, compressor speeds and operating conditions, pressure ratios, etc. The growth or decay of surge actions and the stagnation occurrences are found to be controlled essentially by the resonance excitation frequency. For less than some specified value of the resonance excitation frequency, stall stagnations will occur. On the other hand, sufficient magnitude of the parameter value will develop deep surges. It could be employed also as a relatively simple and reasonable criterion for the stall-stagnation boundary. Keywords: Compressor, Surge behavior, Surge frequency, Stall stagnation, Resonance frequency. 1. Introduction With respect to the compressor surge phenomena, Greitzer [1, 2] published his comprehensive results of investigations as early as 1976. Since then, a wide range of studies have been conducted world-widely from various aspects, and various details related to the phenomena appeared to have been examined. Some of them have been reviewed in Greitzer [3, 4]. However, several questions that are important to practical engineers appear to have been left unanswered. For example, the dominant frequencies are important in the science of vibrations and the mechanical engineering in general. However, with respect to surge frequencies, simple estimation methods and suitable explanations about the tendency have not been proposed until recently. Furthermore, compressor stall stagnation phenomena appear to have not been made sufficiently clear, and so, the countermeasures appear to have not been established yet. In the above situations, the author has been trying to make clearer the essential and comprehensive features of the phenomena on the basis of numerical-experimental data obtained for various conditions of compressors and flowpaths by use of a relatively simple surge simulation code (Yamaguchi [5]). From the results of the preceding studies, the present status of the relevant researches could be summarized as follows. Estimation of compressor surge frequencies Surge frequencies could be considered to be intimately related with the resonance frequencies in the flowpath system. However, the surge frequencies in usual high-pressure ratio compressors appear to be much lower than the corresponding resonance frequencies. The surge actions could be understood as emptying and filling actions of air in the delivery plenum chamber. From the aspect, a parameter of modified effective reduced surge frequency fRsmeff has been proposed as a rule of thumb for simple evaluations of deep surge frequencies (Yamaguchi[6, 7]), on a line of thinking on the similarity law in modelling of the flow phenomena and by modifications by data-fitting to the numerical- experimental results by surge simulations. The parameter fRsmeff shows nearly constant values for a wide range of conditions of Received May 14 2019; accepted for publication December 9 2019: Review conducted by Zhang Yang-jun. (Paper number O19028C) Corresponding author: Nobuyuki Yamaguchi, [email protected]
Transcript of A Comprehensive View to Surge Frequencies and Stall ...

380
International Journal of Fluid Machinery and Systems DOI: http://dx.doi.org/10.5293/IJFMS.2020.13.2.380
Vol. 13, No. 2, April-June 2020 ISSN (Online): 1882-9554
Original Paper
A Comprehensive View to Surge Frequencies and Stall Stagnations
in Axial Flow Compressor Systems
Nobuyuki Yamaguchi1
1Department of Mechanical Engineering, Meisei University (retired)
2-1-25, Akanedai, Aoba-ku, Yokohama City, 227-0066, Japan, [email protected]
Abstract
Essential features of compressor surge phenomena are found to be described by the following two non-dimensional
parameters; a resonance excitation frequency and a surge frequency parameter. The former is the number of times of
excitations by the system resonance frequency given to the fluid particle in the time required for the particle to pass
through the whole flowpath, or, in short, the resonance frequency multiplied by the passing time. The latter is the
number of surge cycles repeated in the particle passing time. When multiplied by corresponding Mach number of the
compressor tip speed, both parameters become nearly independent of the compressor speeds. Both parameters construct
numerical-experimentally a whole picture of the surge behaviors on the basis of simulation results. It shows the
behaviors of surge frequencies and the stall stagnation limits affected by the resonance excitation frequency under the
influence of various factors, such as flowpath configurations, relative locations of the compressor in the flowpath,
numbers of compressor stages, compressor speeds and operating conditions, pressure ratios, etc. The growth or decay of
surge actions and the stagnation occurrences are found to be controlled essentially by the resonance excitation frequency.
For less than some specified value of the resonance excitation frequency, stall stagnations will occur. On the other hand,
sufficient magnitude of the parameter value will develop deep surges. It could be employed also as a relatively simple
and reasonable criterion for the stall-stagnation boundary.
Keywords: Compressor, Surge behavior, Surge frequency, Stall stagnation, Resonance frequency.
1. Introduction
With respect to the compressor surge phenomena, Greitzer [1, 2] published his comprehensive results of investigations as early as
1976. Since then, a wide range of studies have been conducted world-widely from various aspects, and various details related to the
phenomena appeared to have been examined. Some of them have been reviewed in Greitzer [3, 4]. However, several questions that are
important to practical engineers appear to have been left unanswered. For example, the dominant frequencies are important in the
science of vibrations and the mechanical engineering in general. However, with respect to surge frequencies, simple estimation
methods and suitable explanations about the tendency have not been proposed until recently. Furthermore, compressor stall stagnation
phenomena appear to have not been made sufficiently clear, and so, the countermeasures appear to have not been established yet.
In the above situations, the author has been trying to make clearer the essential and comprehensive features of the phenomena on
the basis of numerical-experimental data obtained for various conditions of compressors and flowpaths by use of a relatively simple
surge simulation code (Yamaguchi [5]). From the results of the preceding studies, the present status of the relevant researches could be
summarized as follows.
Estimation of compressor surge frequencies Surge frequencies could be considered to be intimately related with the
resonance frequencies in the flowpath system. However, the surge frequencies in usual high-pressure ratio compressors appear to
be much lower than the corresponding resonance frequencies. The surge actions could be understood as emptying and filling
actions of air in the delivery plenum chamber. From the aspect, a parameter of modified effective reduced surge frequency fRsmeff
has been proposed as a rule of thumb for simple evaluations of deep surge frequencies (Yamaguchi[6, 7]), on a line of thinking on
the similarity law in modelling of the flow phenomena and by modifications by data-fitting to the numerical-
experimental results by surge simulations. The parameter fRsmeff shows nearly constant values for a wide range of conditions of
Received May 14 2019; accepted for publication December 9 2019: Review conducted by Zhang Yang-jun. (Paper number O19028C)
Corresponding author: Nobuyuki Yamaguchi, [email protected]

381
Pctot LLL += **
)1/(1** LRLL totC +=
compressor stages, tip speeds, and flowpath geometries. It could be conveniently used for the order-of-magnitude estimations of
deep surge frequencies in the conditions. Since it is a macroscopic and empirical rule, and the scatters of the fRsmeff values appear
rather wide, more fundamental and detailed study might be required for the improvement.
Clarification of stall stagnation phenomena Stall stagnation phenomena have been referred to in Greitzer [1, 2]. The
situations are often experienced in low-speed fans in laboratories. In some recent jet engines also, it is reported that engine
stoppages supposedly related with the stagnations have happened during a flight, which is a very imminent condition requiring
restarting the engine in the flight (Ishizawa [8]). Thus, more detailed investigations into stall stagnation phenomena have come to
be absolutely necessary. Greitzer [1, 2] has shown that B parameter, which is a kind of reduced resonance frequency of the system,
controls the behaviors of the surges and some value of B, for example 0.7 or 0.8, specifies the stall stagnation boundary. However,
some recent observations on a wide range of numerical-experimental data (Yamaguchi [9]) has shown that the stagnation
boundaries could appear in a somewhat different manner from the Greitzer’s rule.
In the above environments, the author has continued looking for the essential cause and the estimation method of the
stagnation boundary by various approaches. Analytical results on infinitesimal surge oscillations in a very simplified conditions
were compared with stall stagnation boundaries obtained numerical-experimentally for a single-stage compressor (Yamaguchi
[10]). In the studies, the stall stagnations appeared to be related with some situations of travelling wave conditions of the
oscillations (Yamaguchi [11]), for which a phase-propagation parameter was defined as the measure. The comparison of the
phase-propagation parameter with the stall stagnation conditions showed relatively good correlations (Yamaguchi [12]).
In the present study, the author would like to proceed further on the basis of the above status of investigations. As described above,
travelling wave conditions, and the related phase propagations are considered to have fundamental effects on the stall stagnation
phenomena. It might possibly be related also with the deep surge frequencies. From such points of view, surge simulations were
conducted again, and the numerical-experimental results were examined in a manner similar to the above studies.
2. Surge Simulations
The surge simulations were conducted by use of
SRGTRAN, a self-made code for the analyses and
simulations of surge transient phenomena in a
multi-stage axial-flow compressor and flowpaths
(Yamaguchi [5]). It treats one-dimensional flow in
x-direction, in consideration of only axial flow
components, neither swirling components nor
rotating stall phenomena. The basic information on
the flowpaths and the compressors are given below.
2.1 Flowpath
Figure 1 shows a schematic view of the
flowpath for the analysis. It is a system consisted of
a suction duct, an axial flow compressor, and a
delivery duct. In the present analyses, the inlet of
the flowpath is open to the atmosphere and the exit
is terminated by a valve for controlling the flow.
The flowpath is divided into fourteen CVs (control
volumes) for the suction part, and thirty-four CVs
for the delivery part. The compressor stages are assigned to respective CVs. The suction duct is identical throughout the analyses.
The variables are as follows: The suction duct length is Lc** from the inlet of the suction duct to the exit of the last stage of the
compressor, and the reference sectional area is Ac2, the exit area of the last stage. The delivery duct has the sectional area Ap and
the length Lp. The delivery plenum is connected downstream of the compressor exit section, and the distance between is set to be
small. The values of Ap and Lp for the delivery duct are changed widely in the simulations, with the suction duct geometry kept the
same. The whole length of the flowpath is given as follows;
(1)
The following non-dimensional parameters are defined for specification of the flowpath geometry.
Delivery sectional area ratio: AR=Ap/Ac2 (2)
Delivery length ratio: LR=Lp/Lc** (3)
The following quantity indicates the relative location of the compressor in the flowpath, and the relative length of the suction
ducts to the total length.
(4)
2.2 Compressor
The compressors for the analyses have a single stage, five stages, and nine stages, named Comp11, Comp15, and Comp19,
respectively. The main specifications and dimensions of the compressors and the flowpaths are given in Table 1. The compressors
are designed for 11300 rpm.
Each stage of the compressors is assumed to have an identical characteristics, normalized by the tip speed of the first stage.
Figure 2 shows the stage characteristics employed here, which covers a wide range of flow coefficient required for the surge
Fig. 1 Schematic model and main dimensions for the simplified
system of a compressor and flowpaths for study

382
7.03.0])([ − stgs
av
MM
a
Vphase=
aLa
VM avtot
avav /)/( ==
)/( avtotav LV =
analysis. The characteristics are determined on the basis
of experimental data and literature survey results.
Possible changes in the characteristics affected by the
effects of Mach numbers and Reynolds numbers, etc.
are neglected here as small.
The definitions are as follows;
Flow coefficient
tst
stt
uA
Q= (5)
Pressure coefficient
( ) 2
1
1
21
)1(
t
stTp
Ptu
Tc −=
−
(6)
Temperature coefficient
( ) 2
12
21
)(
t
TTp
Ttu
TTc −= (7)
Here, ut: reference tip speed (m/s), Ast: stage annulus area (m2), πst: stage total pressure ratio, Qst: stage
volume flow (m3/s), TT1 and TT2: inlet and exit total
temperatures of the stage, respectively (K), cp: specific
heat at constant temperature (J/kg/K), κ: ratio of
specific heats. The subscript st means the stage of
concern.
3. Considerations on the Parameters Related with Surge Phenomena
3.1 Parameters for Surge Oscillations as Travelling Waves
As very briefly described in the Introduction, surges could be a kind of travelling wave. Changes in the surge behaviors could
be understood as changes in the oscillation mode in x-direction, or variations from a travelling-wave condition to another
travelling-wave one. So, as measures of deviations of the concerned wave condition from the resonance one or standing-wave one,
attentions are paid to the phase difference Θ between at the inlet of the flowpath and at the exit, and the phase speed Vphase. In
infinitesimal surges superposed on a steady main flow in a simplified hypothetical system, these parameters for the behaviors were
compared by trial-and-error manner with stall stagnation boundaries in single-stage compressors (Yamaguchi [11]). Although the
comparison is of indirect nature, the following phase-propagation parameter appeared to be correlated fairly with the condition of
compressor stagnations.
(8)
Here
: phase speed normalized by the sound speed (9)
: average velocity in the whole flowpath (10)
: average Mach number over the whole flowpath
Ms : Mach number in the suction flowpath as a normalizing factor.
Compressor Name Comp19 Comp15 Comp11
Stages 9 5 1
Inlet annulus area of stage 1: Ac1 (m2) 0.10314 0.10314 0.10314
Exit annulus area of the last stage: Ac2 (m2) 0.04125 0.07688 0.0975
Reference radius: r t1 (m) 0.254 0.254 0.254
Design rpm (rpm) 11300 11300 11300
Design tip speed ut1 (m/s) 300.6 300.6 300.6
Suction temperature (K) 288.2 288.2 288.2
Suction pressure (Pa) 101300 101300 101300
Suction duct length: Lc** (m) 4.631 4.329 4.093
Fig. 2 Wide-range stage characteristics of the axial flow
compressors employed for the analyses
Table 1 Main data on the compressors for the analyses
(11)

383
constL
xt
tot
=− 2
21 =f
av
totavR
V
Lff 1
1 =
==
avav
phase
avRMV
Vf
1
tavtavRavMtR MfMff 111 ==
av
totav
V
L=
avavR ff 11 =
The right-hand side value of eq. (8) is roughly estimated in comparison with the values for the stall stagnation boundaries for
the single-stage compressor.
However, as it is, it would remain only as a qualitative formulation concerning the situation of infinitesimal disturbances in a
very simplified system. It could be fruitful to extend the result applicable more easily to the real turbomachine world.
Propagation of the phases in the flowpath could be expressed very approximately with respect to the argument of the
oscillation as follows;
(12)
Here, x: coordinate in the flowpath direction, t: time, ω: circular frequency of the concerned oscillation.
When the acoustic motion of resonance frequency f1 is
considered, then
(13)
By taking a time derivative of eq. (12), the following relation
results;
Next, the following reduced frequency fR1av is considered;
(15)
fR1av is a kind of reduced frequency, a non-dimensional number
using the resonance frequency f1, the total flowpath length Ltot,
and the average fluid velocity Vav over the whole flowpath, as
typical quantities.
On the other hand, the time τav for fluid particles to pass
through the whole flowpath is expressed as follows (cf. eq.
(10));
(16)
Thus, the following relation is obtained from eqs. (15) and (16);
(17)
At the same time, by applying the relation, eq. (14), eq. (15) become as follows;
(18)
The parameter fR1av results finally in the number of times excited by the resonance frequency during the time for a fluid particle to
pass through the whole flowpath. It could be named “resonance excitation frequency”. The phase propagation parameter in eq. (8)
thus becomes equivalent to the resonance excitation frequency in the real world, eq. (17).
Compressor tip Mach number Mt is applied to the above relation instead of the suction flowpath Mach number Ms in eq. (8).
Then the following parameter results, which is approximately independent of the tip Mach numbers and is of more universal
nature;
(19)
It is named Mt-normalized resonance excitation frequency.
Figure 3 cites the preceding results concerning the parameter fR1avMt(stg) for the stall-stagnation boundaries obtained
numerical-experimentally for compressors Comp11, Comp15, and Comp19 (Yamaguchi [12]). The results have been obtained by
changing AR values at several specified LR values until occurrence of stagnations. Deep surges and stall stagnations occur above
and below the data curves, respectively. For the single-stage compressor, Comp11, the stagnation boundaries are located at nearly
constant values 1.7-1.5 of fR1avMt(stg) for a wide range of LR values and compressor rpms. For compressors having increased
numbers of stages, the values of fR1avMt(stg) are nearly the same in small LR range as those for Comp11, but tend to lower toward
larger LR values, reaching as low as roughly 0.3 for Comp19. It means that stall stagnations occur for the values of fR1avMt less
than (1.7-0.3)/Mt, depending on the compressor conditions. The stagnations could be attributed to insufficient excitations on the
fluid particles by the resonance frequency during the fluid passing time, leading to the decay of oscillation amplitudes.
The above results show clearly that the fluid passing time τav is deeply related with surge phenomena. The lowering of the
values of fR1avMt(stg) for multi-stage compressors in flowpaths having longer delivery lengths is not explained at present.
Fig. 3 Stall stagnation boundaries given by values of
fR1avMt, the resonance excitation frequency, normalized
by the compressor tip Mach number Mt, cited from the
preceding study (Yamaguchi [12])
== tot
phase
Lf
dt
dxV 1 (14)

384
avsavRs ff 00 =
tavsavMtRs Mff 00 =
5.1)(1 stgf avMtR
tstgav Mf /5.1)( 1
85.0~1)/( 10 stgs ff
=
=itot
i ia
iav
V
L
1
In the above process of data analysis, required parameters are calculated as follows. The fluid passing time τav is evaluated as a
summation of the times of fluid passing through each control volume over the flowpath at the initial stalling instant of a critical
stage in the evaluations of the steady performances.
(20)
Here, Li and Vai are the length and the axial velocity for the i-th CV, and itot is the total number of the CVs in the
fowpath.
With respect to the resonance frequency, a still air column is assumed in the flowpath, its pressure is constant throughout, and
the temperatures are equal to the suction one in the suction flowpath and to the delivery temperature in the delivery flowpath,
respectively. The open-end condition and the closed-end one are assumed at the inlet and the exit, respectively.
The resonance excitation frequency parameter fR1avMt explains straightfoward the cause of the stall stagnations, and it could be
employed conveniently as a simple criterion for the stall stagnation boundaries.
3.2 Surge Frequency Parameters
As described above, surge behaviors could be considered in relation with travelling wave conditions. In a similar line of
thinking about the resonance frequency, the surge frequency fs0 might be normalized also. A surge frequency parameter is defined
by replacing the resonance frequency f1 to the surge frequency fs0 in eq. (17);
(21)
(22)
Equation (21) expresses the times of surge oscillations repeated in the period for a fluid particle to pass through the whole
flowpath. Equation (22) is normalized by the compressor tip Mach number Mt.
The surge frequency relative to the resonance frequency is defined as follows
It is also an important parameter in considering the relative position of the surge frequency.
4. Details in the Surge Behaviors for the Single-Stage Compressor, Comp11
Details in the surge behaviors of respective compressors are going to be examined. In the present section, Comp11, the single-
stage compressor, is paid attention to. The situations concerning Comp11 stand for the relatively simple surge conditions in the
environment of a single stage operations of the compressor and rather low pressure ratios (PR). For the compressor speeds,
6000rpm, 10000rpm, and 12000rpm, the tip Mach numbers Mt are 0.4694, 0.7823, and 0.9388, respectively, and the pressure
ratios at steady-state stalling, PR, are 1.065, 1.187, and 1.276. For reference, axial Mach numbers Ms at the compressor stalling is
estimated approximately by multiplication of 0.3 to Mt (cf. Fig. 2). Changes in the stage characteristics for the changes in the
Mach numbers are not taken into considerations in the present simulations.
4.1 Surge Frequencies for Comp11, 10000 rpm (near-design speed)
The behaviors of surge frequencies fs0 for Comp11, 10000rpm are shown in Fig. 4(a) and (b) in terms of the surge frequency
parameter fRs0avMt and the relative surge frequency fs0/f1, both against the resonance excitation frequency fR1avMt. The data sets are
corresponding to the relative locations of the compressor, indicated by Lc**/Ltot in the explanatory note in the figure.
In Fig. 4(a) and (b), abrupt changes in the behaviors are seen to occur at around the following value of fR1avMt, nearly
independent of the values of Lc**/Ltot;
(24)
It shows that the deep surge frequency drops abruptly, which means an occurrence of a subharmonic surge, leading to an
occurrence of stall stagnation. It means that the required times of the excitations for the oscillations to grow into deep surge
conditions are given as follows:
(25)
Below the value, the oscillations tend to decay and stagnate.
Near the stagnation point, the relative surge frequency is given approximately as follows, as shown in Fig. 4 (b);
(26)
In this particular case shown in Fig. 4(a), the surge frequency parameter fRs0avMt is increasing toward larger values of fR1avMt.
However, the relative surge frequency fs0/f1 is seen to decrease as shown in Fig. 4(b). The behaviors are seen to gather together for
sufficiently large values of fR1avMt for a wide range of relative locations of the compressor given by the parameter Lc**/Ltot.
avMtR
avMtRss
ff
ff
1
0
1
0 = (23)

385
6.1~5.1)(1 stgf avMtR
4.1~5.1)(0 stgf avMtRs
The overall situation given by Fig. 4(a) is shown in
Fig. 5 as contour lines of the fRs0avMt values. The vertical
axis and the horizontal axis are the resonance excitation
frequency, fR1avMt, and the relative compressor location,
Lc**/Ltot, respectively. In Fig. 5, stall stagnation boundary
is located at about 1.5 of the fR1avMt value, below which
stagnation prevails. Above the stagnation boundary,
deep surges prevail. The contour lines appear nearly
horizontal, and the surge frequency parameters tend to
increase gradually. The relative locations of the
compressor appear to have relatively insignificant
effects on the surge frequency characteristics. The blank
area in the upper part shows absence of data due to
failures of the surge simulations.
The stall stagnation boundary in Fig. 5 is
corresponding to that shown in Fig. 3 for Comp11, with
the abscissa of LR converted to the parameter Lc**/Ltot.
The narrow dark zone immediately above the stagnation
boundary in Fig. 5 shows the occurrence of subharmonic
surges.
4.2 Surge Frequencies for Comp11, 12000rpm and
6000rpm
Effects of tip speeds on the surge behaviors of Comp11 are surveyed, where various parameters, such as tip Mach numbers,
flowpath Mach numbers, and pressure ratios, etc. are influenced and could possibly affect the surge behaviors in a combined
manner.
Figure 6(a) and (b) show the behaviors of the surge frequency parameter fRs0avMt against the resonance excitation frequency
fR1avMt at (a) 6000 rpm and (b) 12000 rpm. A comparison of Figs. 6 and 4 suggests that, as far as Comp11 is concerned, for a wide
range of compressor rpms, the stall stagnation boundaries are located at
(27)
And the surge frequency parameter fRs0avMt at the point is roughly as follows;
(28)
The observation shows that the parameters normalized by Mt, i.e. fR1avMt(stg) and fRs0avMt(stg), have reasonable universality with
respect to the stall stagnation conditions for a wide range of compressor speeds.
However, the general behaviors other than the stagnation conditions are different for different speeds. As seen in Fig. 6(a), at
the lower speed, 6000 rpm, the curves of the parameter, fRs0avMt, are seen to run near the dotted line, fs0 = f1, showing the surge
frequencies fs0 in a close relation to the resonance frequencies, f1. It suggests that the surge behavior of Comp11 at 6000 rpm could
be in a near-resonant surge. On the other hand, the behaviors of the parameter, fRs0avMt, are seen to tend to bend down for 10000
rpm (Fig. 4(a)) and to become nearly horizontal for 12000 rpm (Fig. 6(b)). Possibly, affected by the increase in the levels of
pressure ratios, the acoustic oscillations could have metamorphosed to convective oscillations.
In relation with Fig. 6, Fig. 7(a) and (b) show differences in the behaviors of complementary parameters for 6000 rpm and
Fig. 5 Distribution of the values of the surge frequency
parameter fRs0avMt in the domain of fR1avMt vs. Lc**/Ltot, the
relative compressor locations in the flowpath for Comp11,
10000 rpm
(a) fRs0avMt vs. fR1avMt (b) fs0/f1 vs. fR1avMt
Fig. 4 Behaviors of surge frequencies in terms of (a) fRs0avMt vs. fR1avMt, and (b) fs0/f1 vs. fR1avMt for Comp11, 10000rpm.
Left-most points in the respective data curves are imminent to the respective stall stagnations.

386
(a) 6000rpm (b) 12000rpm
Fig. 6 Behaviors of the surge frequency parameter fRs0avMt against the resonance excitation frequency fR1avMt for Comp11, (a)
6000rpm and (b) 12000rpm. Left-most points in the respective data curves are imminent to the respective stall stagnations.
(a) 6000 rpm (b) 12000 rpm
Fig. 7 Variations in surge-related variables for changes in the delivery area ratios for Comp11, LR of 2.885, Lc**/Ltot of 0.2574,
(a) 6000 rpm, and (b) 12000 rpm. “tauav” means τav.
(a) Comp11, 6000 rpm (b) Comp11, 12000 rpm
Fig. 8 Superposed surge loops for changing values of AR and fR1avMt from sufficiently settled deep surges to near-stagnation
conditions, for Comp11, LR of 2.88, and Lc**/Ltot of 0.257. (a) 6000 rpm and (b) 12000 rpm.
12000 rpm, respectively, where the area ratio AR is varied from a sufficiently large value to a near–stagnation condition, for a
specified relative compressor location, Lc**/Ltot of 0.257. Together with the reduction in the AR values, the resonance frequency f1
increases, and the fluid passing time τav reduces. As the result, the value of fR1avMt reduces, reaching finally at stall stagnations,
where both values of fR1avMt(stg) are nearly the same, around 1.5. In the circumstances, the surge frequency fs0 for 6000 rpm
behaves nearly close to the line of resonance frequency f1. On the other hand, fs0 for 12000rpm runs lower than f1, and the
separation between both tends to widen for larger AR values. As a result, the fRs0avMt parameter for 12000rpm approaches a nearly
settled value. It results in the different behaviors of the values fRs0avMt vs. fR1avMt between 6000 rpm and 12000 rpm in Fig. 6(a) and
(b).
4.3 Changes in the Surge Loops in Approaching Stall Stagnations
Surge loops for Comp11, LR of 2.885 and Lc**/Ltot of 0.2574 for variable AR values, at (a) 6000 rpm and (b)12000 rpm, are
387
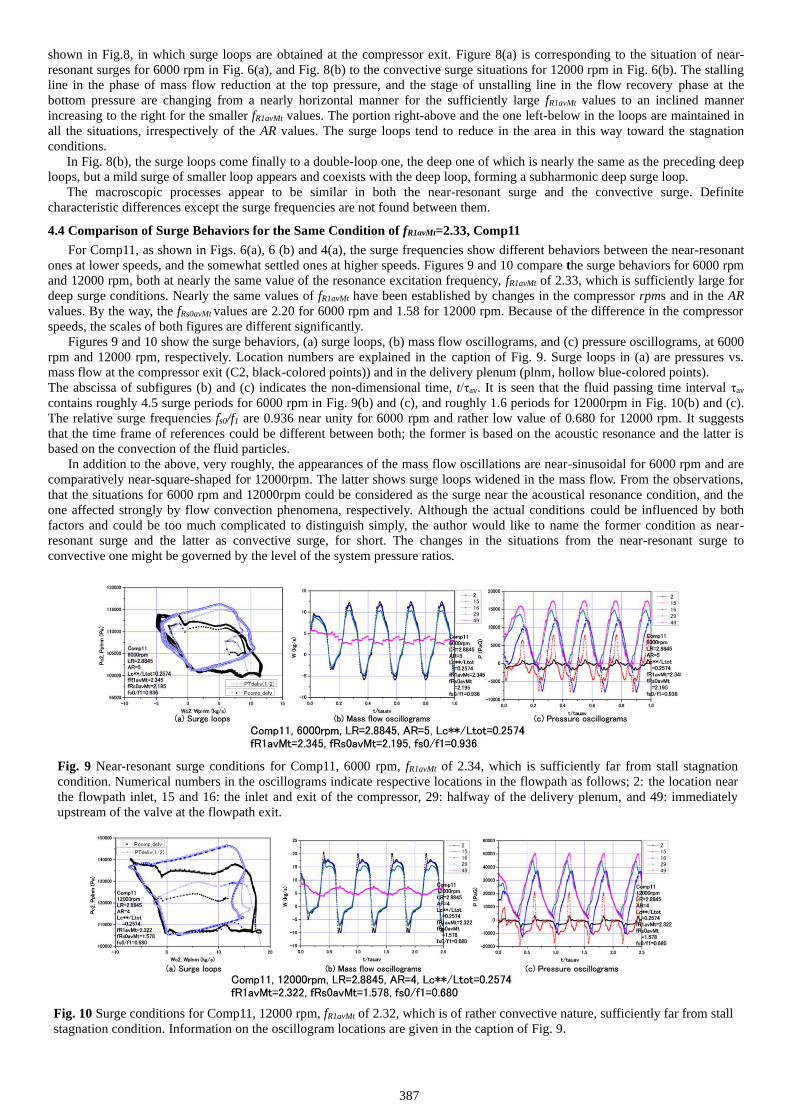
shown in Fig.8, in which surge loops are obtained at the compressor exit. Figure 8(a) is corresponding to the situation of near-
resonant surges for 6000 rpm in Fig. 6(a), and Fig. 8(b) to the convective surge situations for 12000 rpm in Fig. 6(b). The stalling
line in the phase of mass flow reduction at the top pressure, and the stage of unstalling line in the flow recovery phase at the
bottom pressure are changing from a nearly horizontal manner for the sufficiently large fR1avMt values to an inclined manner
increasing to the right for the smaller fR1avMt values. The portion right-above and the one left-below in the loops are maintained in
all the situations, irrespectively of the AR values. The surge loops tend to reduce in the area in this way toward the stagnation
conditions.
In Fig. 8(b), the surge loops come finally to a double-loop one, the deep one of which is nearly the same as the preceding deep
loops, but a mild surge of smaller loop appears and coexists with the deep loop, forming a subharmonic deep surge loop.
The macroscopic processes appear to be similar in both the near-resonant surge and the convective surge. Definite
characteristic differences except the surge frequencies are not found between them.
4.4 Comparison of Surge Behaviors for the Same Condition of fR1avMt=2.33, Comp11
For Comp11, as shown in Figs. 6(a), 6 (b) and 4(a), the surge frequencies show different behaviors between the near-resonant
ones at lower speeds, and the somewhat settled ones at higher speeds. Figures 9 and 10 compare the surge behaviors for 6000 rpm
and 12000 rpm, both at nearly the same value of the resonance excitation frequency, fR1avMt of 2.33, which is sufficiently large for
deep surge conditions. Nearly the same values of fR1avMt have been established by changes in the compressor rpms and in the AR
values. By the way, the fRs0avMt values are 2.20 for 6000 rpm and 1.58 for 12000 rpm. Because of the difference in the compressor
speeds, the scales of both figures are different significantly.
Figures 9 and 10 show the surge behaviors, (a) surge loops, (b) mass flow oscillograms, and (c) pressure oscillograms, at 6000
rpm and 12000 rpm, respectively. Location numbers are explained in the caption of Fig. 9. Surge loops in (a) are pressures vs.
mass flow at the compressor exit (C2, black-colored points)) and in the delivery plenum (plnm, hollow blue-colored points).
The abscissa of subfigures (b) and (c) indicates the non-dimensional time, t/τav. It is seen that the fluid passing time interval τav
contains roughly 4.5 surge periods for 6000 rpm in Fig. 9(b) and (c), and roughly 1.6 periods for 12000rpm in Fig. 10(b) and (c).
The relative surge frequencies fs0/f1 are 0.936 near unity for 6000 rpm and rather low value of 0.680 for 12000 rpm. It suggests
that the time frame of references could be different between both; the former is based on the acoustic resonance and the latter is
based on the convection of the fluid particles.
In addition to the above, very roughly, the appearances of the mass flow oscillations are near-sinusoidal for 6000 rpm and are
comparatively near-square-shaped for 12000rpm. The latter shows surge loops widened in the mass flow. From the observations,
that the situations for 6000 rpm and 12000rpm could be considered as the surge near the acoustical resonance condition, and the
one affected strongly by flow convection phenomena, respectively. Although the actual conditions could be influenced by both
factors and could be too much complicated to distinguish simply, the author would like to name the former condition as near-
resonant surge and the latter as convective surge, for short. The changes in the situations from the near-resonant surge to
convective one might be governed by the level of the system pressure ratios.
Fig. 9 Near-resonant surge conditions for Comp11, 6000 rpm, fR1avMt of 2.34, which is sufficiently far from stall stagnation
condition. Numerical numbers in the oscillograms indicate respective locations in the flowpath as follows; 2: the location near
the flowpath inlet, 15 and 16: the inlet and exit of the compressor, 29: halfway of the delivery plenum, and 49: immediately
upstream of the valve at the flowpath exit.
Fig. 10 Surge conditions for Comp11, 12000 rpm, fR1avMt of 2.32, which is of rather convective nature, sufficiently far from stall
stagnation condition. Information on the oscillogram locations are given in the caption of Fig. 9.

388
In the case of convective surges for sufficiently large values of fR1avMt, such as seen in Fig. 10, the surge frequency parameter
fRs0avMt appears to approach some settled value uninfluenced by the excitation frequency as seen in Figs. 6(b) and 7(b).
5. Surge Behaviors of Comp15, the Five-Stage Compressor
Differences in the surge behaviors between the multi-stage conditions and the single-stage ones are deeply interested in.
In the following sections, surge behaviors in the compressors having five stages and nine stages, Comp15 and Comp19, are
studied with particular attentions to the effects of the pressure ratios and the effects of numbers of stages.
5.1 Surge Behaviors of Comp15, 10000 rpm
Figure 11 shows data on the surge frequencies for Comp15, 10000 rpm, relatively near the design rpm. Figure 11(a) shows
the behaviors of the surge frequency parameter fRs0avMt against the resonance excitation frequency fR1avMt, with the relative
compressor location Lc**/Ltot as parameters. The leftmost points are imminent to respective stall stagnations. It is to be noted that
stall stagnation points are seen to be scattered for changes in the relative compressor locations, Lc**/Ltot, which situation is quite
different from that of Comp11 in Fig. 4. The values of fR1avMt for the stagnation range from1.7 to 0.7, and the behavior tendencies
approaching stagnations appear to divide into two groups at Lc**/Ltot of around 0.5. For the compressor located in the upstream
side in the flowpath, i.e., Lc**/Ltot less than around 0.5, the fRs0avMt values change relatively gradually and the stagnation occurs at
the relatively low values of fR1avMt ranging from 1.6 to 0.6. Near the stagnations, the relative surge frequencies, fs0/f1 are seen to
have nearly constant values of around 0.6 as shown in Fig. 11(b). Particularly, for the values of Lc**/Ltot less than around 0.25, i.e.,
for the compressor located upstream of (1/4) of the flowpath length, the respective behaviors of fRs0avMt and fs0/f1 are seen to
gather together.
On the other hand, for the values of Lc**/Ltot larger than around 0.5, i.e., for the compressor located downstream of a half of the
flowpath length, the parameter fRs0avMt behaves upward and approaches the line of fs0 = f1, and stagnations occur for the value of
fR1avMt of around 1.6.
In this way, the behaviors of Comp15 toward the stagnations are significantly different from those of Comp11, which is seen
to occur relatively simply around the near constant values of fR1avMt and fRs0avMt both very roughly 1.5 irrespectively of the
compressor relative locations (Figs. 4 and 6).
For sufficiently large values of the parameter fR1avMt, the value of (fRs0avMt)∞ tend to be settled around 0.65 independently of the
compressor relative locations.
The behaviors of the relative surge frequency fs0/f1 are seen in Fig. 11(b). For the compressor located near the flowpath inlet,
the relative frequencies approach around 0.6 in coming near the stagnations by reducing the fR1avMt values. For the compressor
located near the flowpath exit, the relative surge frequencies fs0/f1 increase, aiming at unity at the fR1avMt value of around 1.6. In the
zone of sufficiently large values of fR1avMt, all data falls in a hyperbolic manner, which corresponds to the nearly constant value of
fRs0avMt seen in Fig. 11(a).
The behavior of the values of the surge frequency parameter, fRs0avMt, is shown in Fig. 12 as a contour map in the domain of the
resonance excitation frequency fR1avMt vs. the relative compressor location Lc**/Ltot. The bottom line of the colored zone is the
stagnation boundary, toward which the variations are concentrated, particularly in the zone of downstream location of the
compressor. The blank zone below is the stall-stagnated one. Upward of the colored zone, as a whole, the fRs0avMt values are seen
to become constant. The upper blank zone indicate no data owing to failures of the simulations.
In the particular situations for the compressor located near the exit of the flowpath and for smaller values of the resonance
excitation frequencies fR1avMt, the surge behaviors appear to approach near-resonance conditions. The differences in the effects of
the compressor relative locations between Comp15 and Comp11 are to be paid attentions to.
5.2 Changes in the Surge Loops in the AR Changes to the Stagnation Conditions, Comp15, 10000 rpm Figure 13 shows superposed surge loops for changes in the AR values from sufficiently large one to the near-stagnation one for
Comp15, 10000 rpm, for Lc**/Ltot of (a) 0.0546 and (b) 0.645. Basically, the results are similar to those observed for Comp11
(a) fRs0avMt vs. fR1avMt (b) fs0/f1 vs. fR1avMt
Fig. 11 Behaviors of surge frequencies in terms of (a) fRs0avMt vs. fR1avMt, and (b) fs0/f1 vs. fR1avMt for Comp15, 10000 rpm. Left-most
points in the respective data curves are imminent to respective stall stagnations. Data curves are corresponding to the relative
locations Lc**/Ltot, indicated by the respective marks.

389
in Fig. 5. For the compressor located near the flowpath inlet (Fig. 13(a)), the bottom pressure level in the recovery phase is nearly
constant in the situation of sufficiently large AR value, but as the AR values reduce, the pressures in the recovery phase tends to
increase to the right, and finally the loop collapses, resulting in stall stagnation. It could be affected by the reduction in the average
flow amplitudes. For the compressor located in the downstream side of the flowpath (Fig. 13(b)), the behaviors are similar
macroscopically to those seen in Fig. 13(a), except some more complications accompanied.
Figure 14 shows some typical behaviors of deep surges for Comp15, 10000 rpm, Lc**/Ltot of 0.366, which is halfway
between those shown in Figs. 13(a) and (b). The condition in Fig. 14 (i) is for fR1avMt of 3.19 and AR of 8, which is a typical deep
surge condition sufficiently far from stall stagnation conditions, showing square-shaped mass flow variations and near-triangular
pressure variations. The condition in Fig. 14 (ii) is for fR1avMt of 1.262 and AR of 0.838, which is rather near to stagnation, showing
somewhat spoiled wave shapes from those in Fig. 14 (i). The transient behaviors are regulated by the fluid convection time τav.
5.3 Variations in the Surge Behaviors for Changes in the Compressor Speeds, Comp15, 7000 rpm and 12000 rpm
Figure 15 shows behaviors of fRs01vMt values against fR1avMt values for Comp15, (a) 7000 rpm and (b) 12000 rpm. Together with
the one at 10000 rpm in Fig. 11(a), the rpm effects could be studied. They all show similar tendencies, in which the surge
frequency parameter fRs0avMt shows significant changes below 2 of the fR1avMt value, approaching the line of fs0 = f1, and finally to
stall-stagnation. The abrupt changes seen in the behaviors are due to local changes in the frequencies and occurrences of
subharmonic surges.
For sufficiently large values of fR1avMt, the fRs0avMt values appear to tend to some respectively settled values, (fRs0avMt)∞, whose
values are approximately as follows;
(fRs0avMt)∞= 0.7, 0.65, and 0.65 for 7000, 10000, and 12000 rpm, respectively. (29)
Compared with the great changes in the compressor speeds, the differences among the (fRs0avMt)∞ values appear relatively little. It
suggests the validity of the normalization by Mt.
(a) Lc**/Ltot of 0.0546 (b) Lc
**/Ltot of 0.645
Fig. 13 Comparison of surge loops for Comp15, 10000rpm between changes in the locations of the compressor,
(a) Lc**/Ltot of 0.0546 (near the flowpath inlet), and (b) Lc
**/Ltot of 0.645 (roughly 2/3 from the inlet). In (a) and (b), the
innermost loops for AR of 0.796 and fR1avMt of 0.765, and for AR of 0.675 and fR1avMt of 1.598 are respectively imminent to
stall stagnations. Larger AR values are far from stagnations.
Fig. 12 Distribution of the values of surge
frequency parameter fRs0avMt in the domain of
resonance excitation number fR1avMt against
relative compressor locations in the flowpath
Lc**/Ltot for Comp15, 10000 rpm

390
5.4 Summary with Respect to the Differences between Comp15 and Comp11
In the situations of Comp15, the five-stage compressor, surge behaviors are seen to occur in much more complicated manners
than those for Comp11. The following differences are noted;
(a) The surge behaviors for Comp15 have metamorphosed to typical convective type, different from the Comp11
situations of near-resonant ones. The transient behaviors are regulated by the fluid convection time τav, which is different from
the acoustic resonance time for Comp11.
(b) For Comp15 situation, the surge frequency behaviors, fRs0avMt vs. fR1avMt tend to vary, depending on the relative compressor
locations in the flowpath, in contrast to the Comp11 situations of nearly the same behaviors for all the compressor locations.
(c) The fR1avMt(stg) values at the stall stagnation boundaries for Comp15 situations range from 1.7 down to 0.7, affected by the
relative compressor locations, or the Lc**/Ltot values. In the Comp11 situations, however, stall stagnations occur at fR1avMt of
around 1.5 for all the compressor locations.
(a) 7000 rpm (b) 12000 rpm.
Fig. 15 Behaviors of the surge frequency parameter fRs0avMt against the resonance excitation number fR1avMt, for Comp15,
(a) 7000 rpm and (b) 12000 rpm. Data curves are corresponding to the relative locations Lc**/Ltot, indicated by the respective
marks. Left-most points in the respective data curves are imminent to respective stall stagnations.
(i) Comp15, 10000 rpm, Lc***/Ltot of 0.366, fR1avMt of 3.19 and AR of 8, deep surge condition
(ii) Comp15, 10000 rpm, Lc**/Ltot of 0.366, fR1avMt of 3.19 and AR of 0.838, deep surge condition near stagnation
Fig. 14 Surge conditions for Comp15, 10000rpm, Lc**/Ltot of 0.366, (i) fR1avMt of 3.19 and AR of 8, sufficiently far from stall
stagnation condition, and (ii) fR1avMt of 1.262 and AR of 0.838, which is rather near to stagnation. Information on the
oscillogram locations are given in the caption of Fig. 9.

391
(d) For Comp15 situation, the (fRs0avMt)∞ values for sufficiently large fR1avMt values show a nearly constant value independent of
the compressor speeds, which is not the case for the Comp11 situations.
6.Surge Behaviors of Comp19, the Nine-stage Compressor Some information on the surge behaviors in the multi-stage environment have been obtained above with respect to Comp15,
the five stage compressor. Some more additional information on more stages could be obtained with attention to Com19, the nine-
stage compressor.
6.1 Surge Behaviors in Comp19, 11000 rpm (97 % Design Speed)
The surge behaviors of Comp19 at nearly the design speed are studied below. The pressure ratio PR at stall is 4.35.
Figure 16(a) shows behaviors of surge frequencies, fRs0avMt vs. fR1avMt, for Comp19, 11000 rpm (97% design speed). Although
the behaviors appear fundamentally similar to those of Comp15, some violent changes are seen to occur locally in some
conditions, mainly for the relative compressor location Lc**/Ltot larger than around 0.5. Particularly, for the compressor locations
Lc**/Ltot of 0.645 and 0.769, about two-thirds of the flowpath, the values of the surge frequency parameter fRs0avMt are seen to
change abruptly up and down for slight changes in the fR1avMt values. The situations are reflected in those of the relative surge
frequency, fs0/f1, in Fig. 16(b).
The author has been thinking that subharmonic deep surges tend to occur immediately before stall stagnation boundaries, but
the above results suggest other possible situations of sensitive changes in the surge frequencies. It is supposed that, within the
relatively short delivery plenum near the flowpath exit, highly oscillative conditions including high-frequency components tend to
occur, which tend to stretch upstream and interfere easily with the multi-stage operations of the compressor located immediately
upstream. It could be the situation for the easily changeable surge frequencies of multi-stage compressors.
For sufficiently large values of fR1avMt, the fRs0avMt value approaches (fRs0avMt)∞ of about 0.46 in this situation.
(a) fRs0avMt vs. fR1avMt (b) fs0/f1 vs. fR1avMt Fig. 16 Behaviors of surge frequencies in terms of (a) fRs0avMt vs. fR1avMt, and (b) fs0/f1 vs. fR1avMt for Comp19, 11000 rpm. Left-most
points in the respective curves are imminent to respective stall stagnations. Data curves are corresponding to the relative
compressor locations Lc**/Ltot, indicated by the respective marks.
Fig. 17 Distribution of the values of surge
frequency parameter fRs0avMt in the domain of
resonance excitation number fR1avMt against
relative compressor locations in the flowpath
Lc**/Ltot for Comp19, 11000 rpm

392
The distribution of the fRs0avMt values are shown roughly as a contour map in Fig. 17. The distribution behavior is similar to
that for Comp15 in Fig. 12, but more complicated as a whole. The zone of the sensitive variations of surge frequencies is
concentrated around the fR1avMt value range of 2.2-1.7 for the compressor located in the downstream half of the flowpath.
6.2 Behaviors of Surge Loops for Comp19, 11000 rpm.
For Comp19, the surge frequency behaviors change much, affected by changes in the compressor locations, as seen above.
Figure 18 compares the changes in the surge loops corresponding to changes in the fR1avMt values in a superposed manner, for
Lc**/Ltot values of (a) 0.0546, and (b) 0.645. It shows the variations in the surge loops along the vertical lines passing through the
corresponding two abscissa in Fig. 17.
Figure 18(a) shows the situations for the compressor located near the flowpath inlet, Lc**/Ltot values of 0.0546. The behaviors
of the surge loops are simple, where the unstalling flow is larger for large values of AR, but the loops become settled for smaller
values of AR and higher unstalling pressure, which results finally in the stagnation. Figure 18(b) shows the situations for the
compressor located around (2/3) of the flowpath, Lc**/Ltot values of 0.645. The tendency of the behaviors is similar to those in Fig.
18(a), but much more complicated. It is considered that, the compressor located in the downstream side in the flowpath is
susceptible to the effects of the flow oscillations in the downstream plenum, which situations could tend to appear in the rather
complicated configurations of the loops. Subharmonic deep surges consisted of multiple loops could also occur.
In the above situations, the reduction in the area ratios AR increases the flow velocity in the delivery flowpath, which reduces
the flow passing time τav and the fR1av value also. At the same time, the increased pressures in the delivery path tend to reduce the
average amplitudes of flow coefficients of the compressor.
6.3 Surge Behaviors Susceptible to Variable Conditions, Comp19, 11000 rpm, Lc**/Ltot of 0.645
Abrupt and seemingly violent changes in the fRs0avMt values are observed for slight changes in the fR1avMt values in Fig. 16.
Figure 19 compares some examples of such situations for the three conditions of the AR values of (i) 2.1, (ii) 2.0, and (iii) 1.9 for
the Lc**/Ltot value of 0.645. For neighboring fR1avMt values: (i) 2.057, (ii) 2.039, and (iii) 2.019, the resulting surge frequency
parameter values of fRs0avMt change as follows: (i) 0.571, (ii) 0.350, and (iii) 0.804. They form only a narrow zone of the situations
occurring, for example, in Fig. 19(a). The oscillograms of the mass flows and the pressures show drastic changes in the
frequencies among the three conditions, which affect the configurations of the surge loops. Particularly, in the condition of AR
value of 2.0 in (b), a subharmonic surge condition having double loops has happened with the surge frequency reduced by half.
Such sensitive situations tend to occur frequently and locally over some range of the flowpath conditions for Comp19, which is
quite a different situation compared with those of Comp15 and Comp11.
6.4 Effects of Compressor Speeds, Comp19, 10000rpm (88.5 %design) and 12000rpm (106%desgin)
In high-pressure-ratio multi-stage compressors, the overall performances and the stage working conditions are affected
significantly by changes in the compressor speeds through changes in the inter-stage matching conditions. Therefore, reliable
evaluations of steady-state performances over a wide range of speeds are not easy by the simple procedure. So, the surge
behaviors are studied here for a narrow range of rpms, slightly above and below the design speed.
Figure 20 shows the behaviors of the fRs0avMt values against the fR1avMt parameters for Comp19, (a) 10000 rpm and (b) 12000
rpm. In both figures are seen various manners of deviations of the behaviors from the low pressure-ratio ones, such as for Comp11
and Comp15. It would be difficult to obtain some clear conclusions about the details of behaviors.
It is observed, not shown here because of space limitations of the paper, that surge loops not encircling the steady-state
stall point and having lower top pressures tend to occur frequently for Comp19, 10000rpm, which is a part-speed condition.
The surges could be treated as a quasi-normal deep surge condition, since the flow variations cover sufficiently wide ranges
observed usually in the normal deep surge conditions.
(a) Lc**/Ltot of 0.0546 (b) Lc
**/Ltot of 0.645
Fig. 18 Effects of the relative compressor locations on the surge loop configurations for Comp19, 11000rpm.
(a) Near the flowpath inlet, Lc**/Ltot of 0.0546,and (b) approximately (2/3) of the flowpath length from the inlet,
Lc**/Ltot of 0.645. The surge loops from sufficiently settled conditions to near-stagnation ones are superposed.

393
For sufficiently large values of fR1avMt, the fRs0avMt values are settled to the following values, including the 11000 rpm data.
(fRs0avMt)∞: 0.45 (10000 rpm), 0.466 (11000 rpm), and 0.47 (12000 rpm)
It is increasing very slightly for increases in the compressor speeds.
6.5 Differences of Surge Behaviors between Comp19 and Com15.
Comp19 shows surge behaviors basically similar to those of Comp15, but the following differences are noted.
(i) Values of (fRs0avMt)∞ for sufficiently large values of fR1avMt tend to lower further in comparison with those for
Comp15. It could be attributed to the effects of the levels of the system pressure ratios.
(ii) The degree of variations in the behaviors of the distribution of the fRs0avMt parameter increased in comparison with
those of Comp15.
(iii) Abrupt and violent variations in the fRs0avMt values for a slight change in the fR1avMt values tend to appear,
particularly for the compressor locations in the downstream side in the flowpath. Changes in the configurations of
surge loops and occurrences of subharmonic surges could contribute the phenomena.
(iv) Surge loops not encircling the steady-state stall point and having lower top pressures tend to occur frequently for
Comp19, 10000rpm, which is a part-speed condition. The surges could be treated as a quasi-normal deep surge
condition
(i) AR = 2.1, fR1avMt=2.057, fRs0avMt =0.571, and fs0/f1 =0.277
(ii) AR = 2.0, fR1avMt=2.039, fRs0avMt =0.350, and fs0/f1 =0.172 (subharmonic)
(iii) AR = 1.9, fR1avMt=2.019, fRs0avMt = 0.804, and fs0/f1 =0.398
Fig. 19 Examples of surge conditions for Comp19, 11000 rpm, demonstrating drastic changes in the values of surge frequency
parameter fRs0avMt for small changes in the values of resonance excitation number fR1avMt. The relative compressor location is
Lc**/Ltot of 0.645. For the area ratio AR of (i) 2.1, (ii) 2.0, and (iii) 1.9, the resulting situations become as follows; (i) fR1avMt of
2.057 and fRs0avMt of 0.571, (ii) 2.039 and 0.350, and (iii) 2.019 and 0.804, respectively. Condition (ii) shows coexistence of a
deep loop and a mild one, indicating a (1/2) subharmonic condition. Information on the oscillogram locations are given in the
caption of Fig. 9.

394
avMtRavMtRs ff 10 =
10 ff s =
7. General Considerations
7. 1 Global Representation of Surge Frequencies Affected by Resonance Frequencies and Other Parameters
Figure 21 shows all the data points in terms of the normalized surge frequency parameter fRs0avMt vs. the normalized resonance
excitation frequency fR1avMt. It contains the data for three compressors of Comp11, Comp15, and Comp19, having a single-stage,
five stages and nine stages, respectively, being operated at three levels of rpms, housed in flowpaths of various geometry with
changing values of LR and AR. Behaviors and tendencies of the data points plotted in Fig. 21 appear puzzling at first sight.
However, they could explain much of the essences of the surge phenomena, some of which have been described above.
In Fig. 21, each set of data-points connected by a line refers to a condition of a compressor running at an rpm, housed in
flowpaths having a specified LR value but variable AR values. To be noticed that the left-most point in each data set is very close
to the stall stagnation boundary. To the left-hand side of the point, stagnations prevail.
In Fig. 21, the basic tendency of the respective data groups appears to extend horizontally. The data points for surge
frequency parameter fRs0avMt appear to spread in the range from 0.1 to 3 of the ordinate. The magnitude levels are seen to change as
a whole depending on the numbers of the compressor stages. Although normalization of the parameters by Mt has succeeded to
some extent to arrange the magnitude levels in order for the respective compressors, complicated behaviors of the data remain as
yet, and hard to explain simply.
Let us review some details of the contents of Fig. 21, some of which have been examined above in the individual cases.
The green-colored dotted line indicates the following condition for reference;
(30)
It is the condition that the surge frequency is equal to the resonance frequency.
(31)
Comp11, single-stage compressor (blue-colored data points): The main data are shown covered by the sky-blue-colored
shaded zone. Values of fRs0avMt are in the range of 1.5 – 3. The data curves run near the green dotted line for fs0=f1. The lower the
compressor speeds, the closer the behaviors move toward the green line. It means that the deep surge frequencies are near the
resonance frequencies, which tendency is clearer for lower speeds or lower pressure ratios. It is particularly interesting that, as can
be seen by the red-colored shaded zone, the data points drop abruptly at the value of fR1avMt of around 1.5 and to stall-stagnate,
accompanied by subharmonic surges. The stall stagnation boundaries of Comp11 are concentrated at fR1avMt of around 1.5,
irrespectively of the conditions of the compressor and the flowpaths.
Comp15, five-stage compressor (red-colored data points): The data points are shown covered by the zones shaded by green-
color, red-color and yellow-color. The main data points are in the green-colored shaded zone and the values of fRs0avMt range from
0.6 to 0.8, settling down to some common values (fRs0avMt)∞ of around 0.65 for sufficiently large values of fR1avMt. On the other hand,
some of the values of fRs0avMt tend to increase from around 2 to 1.5 of the fR1avMt parameter as shown in the red-colored shaded zone,
approaching toward the green dotted line for fs0=f1. After that, the values fRs0avMt drops abruptly toward smaller values of fR1avMt,
which is the situation for the compressor located in the downstream side in the flowpath. For the compressor located in the
relatively upstream side in the flowpath, the fRs0avMt behaviors extend until below unity of the fR1avMt value in gradually bending
down fashion, as seen in the yellow-colored shaded zone. Spike-like drops show local occurrences of subharmonic surge
frequencies.
Comp19, nine-stage compressor (black-colored data points): The main data points are included in the zones shaded by blue-
color, red-color and yellow-color. For sufficiently large values of fR1avMt, the fRs0avMt values tend to settle down to some common
value, (fRs0avMt)∞. Deep surges are seen to exist over a wide range of fR1avMt values as low as below unity for the compressors
located in the relatively upstream side in the flowpath. Particularly, in the case of 11000rpm near the design rpm, the fR1avMt values
near the leftmost points are seen to lower down to around 0.4 - 0.8, as seen in the yellow-colored shaded zone. The
(a) Comp19, 10000 rpm (b) Comp19, 12000 rpm Fig. 20 Behaviors of the surge frequency parameter fRs0avMt against the resonance excitation number fR1avMt, for Comp19,
(a) 10000 rpm and (b) 12000 rpm. Data curves are corresponding to the relative locations Lc**/Ltot, indicated by the respective
marks. Left-most points in the respective data curves are imminent to respective stall stagnations.

395
increases seen in the red-colored shaded zone for the fR1avMt range of values from around 2 to 1.5 show the surge frequencies
approaching toward near-resonance frequencies, which is the situation for the compressor located in the relatively downstream
side in the flowpath. For the fR1avMt values from around 3 to 1.5, spike-like up-and-downs in the fRs0avMt behaviors occur, as seen in
the violet-colored shaded zone, indicating occurrences of subharmonic or irregular surges in the very narrow range of the fR1avMt
values. The spikes are rarely seen in the situations of Comp15 and Comp11
In summary as a whole, several features of interest are observed. Apparent behaviors fRs0avMt vs. fR1avMt are qualitatively
different between for the single-stage compressor and for the multi-stage compressors. The single-stage compressor has a
tendency of behavior of the fRs0avMt values increasing toward larger fR1avMt values, particularly for lower speeds, and approaches the
stall stagnations at the fR1avMt value of around 1.5. The multi-stage compressors show mainly rather flat behaviors of fRs0avMt vs.
fR1avMt, but includes complicated behaviors in the zone below 3 of fR1avMt, in some situations, and the stall stagnation boundaries
lowered further below unity of fR1avMt. Reductions in the levels of fRs0avMt are seen for increases in the pressure ratios. In the
situations for the multi-stage compressors, the complicated behaviors might be affected possibly by the pressure ratios,
interactions between the compressor and the oscillation mode, off-design working conditions of stages, etc.
Figure 21, represented in this manner, could contribute much to a whole image of the surge phenomena, together with the
details shown in the preceding sections. They could complement the understandings having been obtained piecewise in the past.
7.2 Summary on the Stall Stagnation Conditions
Stall stagnation conditions in terms of the resonance excitation frequencies fR1avMt(stg), which are collected from the above
data, are summarized against the relative compressor locations in Fig. 22(a). They are stall stagnation boundaries, some of which
are shown in Figs. 5, 12, 17 as the bottom boundaries of the contour-mapped zones. As a whole, the data curves show somewhat
unified tendencies in relation with the compressor conditions, such as the locations, number of stages and speeds. For Comp11,
the single-stage compressor, the resonance excitation frequency fR1avMt(stg) has a nearly constant value of 1.5 irrespectively of the
compressor locations, as shown in the red-colored shaded zone. For multi-stage compressors, for the compressor located in the
Fig.21 Global map of behaviors of surge frequencies and stall-stagnation boundaries in terms of the
surge parameters, fR1avMt and fRs0avMt on the basis of simulated results for a wide-range of conditions
of compressors and rpms, and flowpath geometries

396
upstream side in the flowpath, i.e., for small values of Lc**/Ltot, the fR1avMt(stg) values, tend to lower, as shown in the blue-colored
shaded zone, compared with those for the single stage condition. In the situation, stall stagnations tend to occur first at the lowered
value of the parameter. When the location of the multi-stage compressors is shifted to downstream side, stall stagnation tends to
occur at the parameter values of fR1avMt(stg) having roughly the same level as the single-stage ones, as shown in the green-colored
shaded zone. Fig. 22(a) is the most important result with respect to the occurrence of stall stagnations.
The values of the surge frequency parameters fRs0avMt(stg) near the stagnation conditions are summarized against the fR1avMt
(stg) values in Fig. 22(b). As a rough tendency, following two groups of different tendencies are seen;
(1) In the relatively narrow range of the parameter fR1avMt (stg) around 1.5, the fRs0avMt(stg) values distribute vertically
as high as around 1.6 from the bottom value of around 0.5, as shown in the red-colored shaded zone and
the green-colored one.
(2) In the range of fRs0avMt(stg) values of 0.3 – 0.8 over a wide range of fR1avMt (stg) values from 1.8 to 0.4, as shown
in the blue-colored shaded zone. Single-stage cases are concentrated to situation (1). Multi-stage cases are existing in both situations (1) and (2). Both situations
are limited by the boundaries indicated in Fig. 22(b) by a red-colored dotted straight line, given by eqs. (30) and (31).
Figure 22(c) shows the behaviors of the fRsoavMt(stg) values against the compressor relative locations Lc**/Ltot. The behaviors
appear individually different except the nearly constant value for the single-stage compressor, and a general explanation is
difficult. Large values of fRs0avMt(stg) appear to occur for locations of the multi-stage compressors in the near-inlet zone and in the
rear-half zone of the flowpath.
Zones shaded by the same color in Fig. 22 belong roughly to the same situations, as indicated above and in the comments of
the figure.
The correspondence between the present results and the preceding formulation is considered as follows. The
following relation holds approximately between the tip Mach number and the suction Mach number;
Here, φst is the flow coefficient at stall, and has the following value in the present single-stage situation (cf. Fig. 2).
Then,
Fig. 22 Behaviors of near-stagnation surge parameters
over the wide range of conditions of compressors and
flowpaths. (a) fR1avMt(stg) vs. Lc**/Ltot, (b) fRs0avMt(stg) vs.
fR1avMt(stg), and (c) fRs0avMt(stg) vs. Lc**/Ltot.
(a) fR1avMt(stg) vs. Lc**/Ltot (b) fRs0avMt(stg) vs. fR1avMt(stg)
(c) fRs0avMt(stg) vs. Lc**/Ltot.
Red-colored zone: Near-resonant surge condition
Green-colored zone: Basically convective-type surge
condition
Blue-colored zone: Condition of extended stall
stagnations in multi-stage
compressors
(32) sttS MM =
(34) stavMtRsttavSav fMfMf 111 ==
(33) 3.0st

397
tavMtRsavsavRs Mfff /000 ==
7.0
0
7.0
00 PRfPRff avsavRsavPRRs ==
Finally, the following approximate relation is obtained.
This result is consistent with the preceding one given by eq. (8) for the hypothetical infinitesimal surges. .
7.3 Surge Frequency Parameter Values (fRs0avMt)∞ in Relation with Pressure Ratios
For sufficiently large values of the resonance excitation frequency, fR1avMt, the values of the surge frequency parameter
(fRs0avMt)∞ tend to be some constants independent of the speeds of compressors within the present data. The behavior of the
(fRs0avMt)∞ values are shown in Fig. 23(a) against the corresponding PR values. The single stage compressor employs the value for
12000 rpm, which is considered to perform a near-convective surge. The values are nearly the same for respective compressors,
but vary among different compressors. It suggests that, for every particular compressor of performing convective surges, the
values of (fRs0avMt)∞ tend to be a constant for the changes in the compressor tip Mach numbers.
Then, the parameter prior to the normalization by Mt, i.e. eq. (21), is paid attention to;
(36)
The values of the (fRs0av)∞ parameter for sufficiently large values of fR1avMt are plotted against PR values in Fig. 23(b). The
behavior appears to be uniquely determined by the PR values, independently of the numbers of stages and the tip speeds of the
concerned compressors. The behavior is approximated by the dotted line as follows;
(37)
From Fig. 23(b), the tendency could be approximately formulated as follows;
Here, the following parameter could reasonably be defined as a PR-normalized surge frequency parameter;
(39)
Information using the parameter fRs0avPR, could be useful, but is omitted here because of space limitation of the paper.
8.Summary The preceding study (Yamaguchi [12]) has pointed out that the resonance excitation frequency fR1avMt could be an essential
factor related closely with the stall stagnation boundary. The present study has surveyed further about the possibility of extended
use of the parameter for the surge frequency evaluations. For the purpose, a surge frequency parameter fRs0avMt is additionally
defined. Surge behaviors were surveyed on the basis of the results obtained by numerical simulations on three axial flow
compressors; the compressors have different numbers of stages and are operated at various speeds, in flowpath conditions
differing widely in the delivery length ratios LR and the delivery area ratios AR. The obtained surge behaviors have been reduced
to the non-dimensional parameters, fR1avMt and fRs0avMt. The behaviors and relations of the parameters have provided much
information on the nature of the compressor surges. The results are summarized as follows;
(1) A global representation of the surge frequency parameter fRs0avMt vs. the resonance excitation frequencies fR1vMt gives a general
and comprehensive information on the nature of frequencies in surge. The resonance excitation frequency is a product of the
system resonance frequency f1 and the fluid particle passing time τav through the whole flowpath, and multiplied by Mt, the
compressor tip Mach number as a normalizing factor. It means the number of times of excitations by the resonance frequency
on the fluid particle during the particle passing time. The surge frequency parameter fRs0avMt employs the surge frequency fs0 in
place of the resonance frequency f1 in the resonance excitation frequency fR1avMt. It means the number of times of the repeated
surge cycles in the fluid passing time. Examinations on both parameters have made clear the nature of the surge behaviors.
(2) The present results could describe the general behaviors of surge frequencies over a wide range from the settled deep surges
for sufficiently large values of the resonance excitation frequency fR1avMt to the stall stagnation boundaries in a unified manner
7.0
0 )( −
PRf avRs 5.1~PRfor
5.1)( 7.0
0 PRf avRs 5.1~PRfor (38)
(a) Mt-normalized surge frequency parameters (fRs0avMt)∞ (b) Raw surge frequency parameters (fRs0av)∞
Fig. 23 Behaviors of the surge frequency parameters for sufficiently large fR1avMt values; (a) Normalized surge frequency
parameters (fRs0avMt)∞, and (b) raw surge frequency parameters (fRs0av)∞
45.05.13.0)(1 =stgMf Sav(35)

398
in terms of the parameters of fR1avMt and fRs0avMt, affected also by the compressor relative locations Lc**/Ltot and the pressure
ratios PR. Stall stagnations take place for the conditions of insufficient magnitude of the fR1avMt value below fR1avMt(stg), which
is the stall stagnation boundary. Deep surges develop for the conditions of the fR1avMt values above fR1avMt(stg).
(3) For the single-stage compressor, Comp11, the fR1avMt(stg) values at the stall stagnation boundaries are around 1.5. At the same
time, the fRs0avMt(stg) values immediately before the stagnations are around 1.5. The threshold number of excitations is given
by around 1.5/Mt for situations of low pressure ratios. For larger values of the fR1avMt parameter, the fRs0avMt values tend to
either increase monotonically or approach a settled value. In the former situations having an increasing tendency, the
behaviors of the surge frequencies are approximately similar to that of the resonance frequency, and it is thought as near-
resonant surges. In the latter situations for increased levels of pressure ratios, the fRs0avMt values tend to approach some settled
value particular to the conditions for changes in the fR1avMt values.
(4) For the multi-stage compressors, Comp15 and Comp19, stall stagnation boundaries tend to occur for a range of the fR1avMt
values roughly from 1.7 to 0.7 (Comp15) or from 1.8 to 0.4 (Comp19) in dependence of the relative compressor locations.
For smaller values of Lc**/Ltot, i.e., the compressor locations in the upstream side in the flowpath, or long delivery lengths,
the fRs0avMt values tend to behave in a smooth manner and tend to lower as low as 0.7(Comp15) or 0.4 (Comp19) at the
stagnation. It suggests that the stagnations are suppressed.
For larger values of Lc**/Ltot, i.e., i.e., the compressor locations in the downstream side in the flowpath, or short delivery
lengths, the fRs0avMt values for Comp15 tend to increase for the value of fR1avMt from around 2 toward around 1.5, and then to
reduce abruptly and stagnate below around 1.7. For Comp19, stall stagnation boundaries tend to occur at around 1.5 of the
fR1avMt(stg) value.
(5) From the above observations, it is considered that stall stagnations occur at the fR1avMt value of around 1.5, in principle.
However, in the particular situations of multi-stage compressors located in the upstream side in the flowpath, namely for
smaller values of the Lc**/Ltot parameter, the stagnation occurrence could be suppressed to as low as roughly 0.5 of the fR1avMt
(stg) value; thus, the deep surge conditions could be maintained down to the lowered values of fR1avMt.
(6) The surge frequencies thus tend to show scattered values affected by the compressor relative locations, flowpath geometries,
and by relative positions from the stagnation condition. The scatters of the surge frequencies observed hitherto (for example,
Yamaguchi [7]) could have been be explained by the present study.
(7) For sufficiently large values of the pressure ratios, for example above 2, the values of (fRs0avMt)∞ settled for sufficiently large
values of the fR1avMt parameter appear to be determined irrespectively of the compressor locations and the compressor speeds
or the value of Mt. The (fRs0avMt)∞ values tend to decrease monotonously for increasing PR values, in a manner proportional to
PR - 0.7, approximately. Thus, typical values of surge frequency for multi-stage compressors could be evaluated by eq. (34).
However, the situations could happen to change much from the typical ones, affected sensitively by various factors involved,
some of which have been described above.
(8) The resonance excitation frequency fR1avMt is more essential and comprehensive, compared with several parameters proposed
earlier by the author. It is easy to understand the mechanism of the growth and decay of the surge oscillations, and easy to use
in practical environments. For example, as a countermeasure to a stall stagnation situation, it could be effective to increase the
fR1avMt value by changing values of LR and/or AR.
(9) Effects of the system pressure ratios PR could be included as a tendency by the PR-normalized surge frequency parameter
fRs0avPR. It could give further information, but is not included in the present paper.
(10) The result obtained above could be a rough guidance in the real fields of compressor surges. Since they are dependent on the
accuracy of the employed particular method of simulation, and on the models of the compressors and the flowpaths, further
experimental data are required for confirmation of the conclusions. At the same time, more advanced numerical simulation
methods and more detailed characteristics data of flow components, such as compressor stages, are wanted for further
progress.
9. Conclusion
Essential features of compressor surge phenomena are found to be described by the following two non-dimensional
parameters; a resonance excitation frequency and a surge frequency parameter. The former is the number of times of excitations
by the system resonance frequency given to the fluid particle in the time required for the particle to pass through the whole
flowpath, or, in short, the resonance frequency multiplied by the passing time. The latter is the number of surge oscillations
repeated in the particle passing time. When multiplied by corresponding Mach number of the compressor tip speed, both
parameters become nearly independent of the compressor speeds. In terms of both parameters, a whole picture of the surge
behaviors could be constructed numerical-experimentally on the basis of simulation results. The picture shows the behaviors of
surge frequencies and the stall stagnation limits affected by the resonance excitation frequency under the influence of various
factors, such as flowpath configurations, relative locations of the compressor in the flowpath, numbers of compressor stages,
compressor speeds and operating conditions, pressure ratios, etc. The growth or decay of surge actions and the stagnation
occurrences are found to be controlled essentially by the resonance excitation frequency. For less than some specified value of the
resonance excitation frequency, stall stagnations will occur. On the other hand, sufficient magnitude of the parameter value will
develop deep surges. It could be employed as a relatively simple and reasonable criterion for the stall-stagnation boundary.

399
Nomenclature
References
[1] Greitzer, E.M., 1976, “Surge and Rotating Stall in Axial Flow Compressors, Part I: Theoretical Compression System Model ,”
ASME, Journal of Engineering for Power, Vol. 98, pp.190-198
[2] Greitzer, E.M., 1976, “Surge and Rotating Stall in Axial Flow Compressors, Part II: Experimental Results and Compariso n
with Theory,” ASME, Journal of Engineering for Power, Vol. 98, pp.199-217
[3] Greitzer, E.M., 1980, “REVIEW-Axial Compressor Stall Phenomena,” ASME, Journal of Fluids Engineering, Transaction of
the ASME, Vol. 102, pp. 134-151
[4] Greitzer, E.M., 1981, “The Stability of Pumping Systems-The 1980 Freeman Scholar Lecture,” ASME, Journal of Fluids
Engineering, Vol. 103, pp. 193-242
[5] Yamaguchi, N., 2013, “Development of a Simulation Method of Surge Transient Flow Phenomena in a Multistage Axial Flow
Compressor and Duct System,” International Journal of Fluid Machinery and Systems, Vol. 6, No.4, pp. 189-199
[6] Yamaguchi, N., 2017, “A Study on the Deep-Surge Frequencies in Various Conditions of Axial Flow Compressors and Flow-
paths,” International Journal of Fluid Machinery and Systems, Vol. 10, No.4, pp.363-377
[7] Yamaguchi, N., 2018, “Effects of Pressure Ratios of Axial Flow Compressors on the Deep Surge Frequencies, Part I: Effective
Reduced Surge Frequency and Its Behaviors,” International Journal of Fluid Machinery and Systems, Vol. 11, No.4, pp.357-373
[8] Ishizawa, K., 2006, “Present State and Future of Turbofan Engines foe Combat Aircrafts, Lecture for Engineers: Basic
Structures, Developments and Advances Technologies (in Japanese),” in “Leading Edges of New Weapons, Series 2”,Separate
Volume, 2006.10, Japan Military Review, pp.56-70
[9] Yamaguchi, N., 2016, “A Comparison of Surge Behaviors in Multi-Stage and Single-Stage Axial Flow Compressors,”
International Journal of Fluid Machinery and Systems, Vol. 9, No.4, pp.338-353
[10] Yamaguchi, N., 2017, “A Study on the Fundamental Cause of Stall Stagnation Phenomena in Surges in Compressor
Systems,” International Journal of Turbomachinery and Systems, Vol. 10, No. 2, (2017, April-June), pp. 119-137
[11] Yamaguchi, N., 2019, “Stall Stagnations Correlated with Traveling Wave Phenomena in Compressor Systems,” International
Journal of Fluid Machinery and Systems, Vol. 12, No. 4, pp. 302-321
[12] Yamaguchi, N., 2020, “An Essential Cause of Stall Stagnations in Compressor Surges,” International Journal of Fluid
Machinery and Systems, Vol. 13, No. 1, pp. 266-280
Ac2 Sectional area of the compressor exit [m2] TS Flow temperature in the suction flowpath [K]
AP Sectional area of the delivery plenum [m2] TD Flow temperature in the delivery flowpath [K]
AR Ratio of sectional areas of the flowpaths TT1 Stage total temperature at the inlet [K]
AS Sectional area of the suction flowpath [m2] TT2 Stage total temperature at the exit [K]
B Greitzer’s B parameter ut Compressor tip speed [m/s]
c Speed of sound [m/s] Vav Flowpath-average fluid particle velocity [m/s]
cp Specific heat at constant pressure [J/kg/K] Vphase Phase velocity [m/s]
f1 Resonance frequency [Hz] W Mass flow [kg/s]
fR1av Resonance excitation frequency x Coordinate in the flow direction [m]
fR1avMt Mt-normalized resonance excitation Θ Phase difference between the inlet and the exit
frequency of the whole flowpath
fR1avMs Ms-normalized resonance excitation κ Ratio of specific heats
frequency μ Ratio of phase velocity to sonic speed
fRs0av Surge frequency parameter ρ Fluid density [kg/m3]
fRs0avMt Mt-normalized surge-frequency parameter τav Particle time in passing through the whole
fRs0avPR PR-normalized surge-frequency parameter path [s]
fR1mstg Modified reduced resonance frequency at ω System resonance circular frequency [rad/s]
stall stagnation boundary φt Stage flow coefficient
fs0 Surge frequency [Hz] ψPt Stage pressure coefficient
Lc** Length of the suction flowpath [m] ψTt Stage temperature coefficient
LP Length of the delivery plenum [m] Subscript
LR Ratio of lengths of the flowpaths 1 Resonance frequency of the first mode
LS Length of the suction flowpath [m] av Averaged value over the whole flowpath
Ltot Length of the whole flowpath (= Lc**+LP)[m] c2 Compressor exit
M Mach number of the main flow D Delivery flowpath
Mav Average Mach number over the whole path P Delivery flowpath
MS Mach number in the suction flowpath plnm Plenum chamber condition
Mt Mach number of the first-rotor tip speed R Reduced frequency
p Pressure [Pa] S Suction flow-path
PR Compressor pressure ratio at stalling stg Stagnation boundary condition
t Time [s)] t Compressor tip condition for normalization
tauav τav , particle time in passing through the whole tot Total flowpath
path [s], ∞ Value for sufficiently large values of fR1avMt


![14 Stall Parallel Operation [Kompatibilitätsmodus] · PDF filePiston Effect Axial Fans (none stall-free) Stall operation likely for none stall-free fans due to piston ... Stall &](https://static.fdocuments.in/doc/165x107/5a9dccd97f8b9abd0a8d46cf/14-stall-parallel-operation-kompatibilittsmodus-effect-axial-fans-none-stall-free.jpg)