A Compendium of U.S. Wastewater Surveillance to Support ...
132
A Compendium of U.S. Wastewater Surveillance to Support COVID-19 Public Health Response EPA-830-R-21-004 September 2021
Transcript of A Compendium of U.S. Wastewater Surveillance to Support ...

A Compendium of U.S. Wastewater Surveillance to Support COVID-19
Public Health Response
EPA-830-R-21-004September 2021

A Compendium of U.S. Wastewater Surveillance for COVID-19 Public Health Efforts
i
This document was prepared by the United States Environmental Protection Agency (EPA). Neither the United States government nor any of its employees, contractors, subcontractors, or their employees make any warrant, expressed or implied, or assume any legal liability or responsibility for any third party’s use of or the results of such use of any information, apparatus, product, or process discussed in this report, or represent that its use by such party would not infringe on privately owned rights. This report does not establish guidance or opinions on the best way to establish wastewater surveillance programs; rather, it catalogues practices by a broad array of organizations and individuals. The objective is to summarize the information available on conducting these wastewater monitoring programs in the United States. EPA may update this document in the future.
Questions about this document should be directed to:
U.S. EPA Office of Wastewater Management 1200 Pennsylvania Avenue NW (4201M) Washington, D.C. 20460 (202) 564-0748 [email protected] U.S. EPA Office of Research and Development Center for Environmental Solutions and Emergency Response 26 West Martin Luther King Dr. Mail Code 236 Cincinnati, OH 45268 (513) 569-7900 [email protected]
Prepared by:
Sally Gutierrez, EPA Office of Research and Development Kathryn Kazior, EPA Office of Wastewater Management Smiti Nepal, EPA Office of Wastewater Management
Cover Photos:
Top Left: Katie Watkins, Houston Public Media. The Houston Health Department collects a wastewater sample as part of the city’s wastewater surveillance program supporting COVID-19 public health efforts (Watkins, 2021).
Middle Left: Stock photo. Wastewater treatment plant aeration basin. Bottom Left: Ben Siegel, Ohio University. Engineering students prepare to collect a wastewater
sample for SARS-CoV-2 monitoring to support Ohio University’s COVID-19 public health efforts (OHIO News, 2021).
Top Right: Stock photo. SARS-CoV-2 analyses of wastewater samples in a laboratory. Bottom Right: Stock photo. Aerial wastewater treatment plant photo.

A Compendium of U.S. Wastewater Surveillance for COVID-19 Public Health Efforts
ii
Acknowledgements EPA Office of Wastewater Management and Office of Research and Development would like to acknowledge the efforts of the following people in reviewing and providing feedback:
Leonardo Angelone, National Institutes of Health Tracy Bone, EPA Office of Science and Technology Nicole Brinkman, EPA Office of Research and Development Jay Garland, EPA Office of Research and Development Amy Kirby, Centers for Disease Control and Prevention Lisa McFadden, Water Environment Federation Jeffrey Mercante, Centers for Disease Control and Prevention Kevin Oshima, EPA Office of Research and Development Jorge SantoDomingo, EPA Office of Research and Development
EPA would also like to acknowledge the participation of practitioners from the case study wastewater surveillance programs included in this report who provided information, participated in discussions, and reviewed their case study write-ups. Contributions of the practitioners are recognized below:
Wastewater Surveillance Program Representative
Indiana Jim McGoff, Indiana Finance Authority Erica Walker, 120Water Kyle Bibby and Alex Perkins, University of Notre Dame
Michigan
Rhiannon Bednar, Robert Orellana, Susan Peters, and Mary Grace Stobierski, Michigan Department of Health and Human Services
Shannon Briggs, Michigan Department of Environment, Great Lakes, and Energy
Kevin Bakker and Chuanwu Xi, University of Michigan Erin Dreelin and Joan Rose, Michigan State University
New Mexico Justin Garoutte, John Rhoderick, and Rebecca Roose, New Mexico Environment Department
Ohio Zuzana Bohrerova, Ohio Water Resources Center
Wyoming
Ali Harrist, Franz Fuchs, Stefan Johansson, and Stephanie Pyle, Wyoming Department of Health
Wanda Manley and Cari Sloma, Wyoming Public Health Laboratory Bledar Bisha and Sarah Collins, University of Wyoming
Hampton Roads Sanitation District, Virginia Raul Gonzalez and Jim Pletl, Hampton Roads Sanitation District
Houston, Texas Loren Hopkins, Houston Health Department Lauren Stadler, Rice University
Tempe, Arizona Wydale Holmes and Rosa Inchuasta, City of Tempe
Clemson University, Clemson, South Carolina David Freedman, Clemson University

A Compendium of U.S. Wastewater Surveillance for COVID-19 Public Health Efforts
iii
Wastewater Surveillance Program Representative
University of Arizona, Tucson, Arizona Ian Pepper, University of Arizona
In addition, a formal technical review of the draft document was conducted by professionals with experience in wastewater surveillance in accordance with EPA Peer Review Guidelines. While every effort was made to accommodate all the Peer Review comments, the results and conclusions do not indicate consensus and may not represent the views of all the reviewers. The technical reviewers of this document included the following:
Jerome Oliver, EPA Office of Wastewater Management Jason Turgeon, EPA Region 1 Christobel Ferguson, Water Research Foundation Jonathan Yoder, Centers for Disease Control and Prevention
A Compendium of U.S. Wastewater Surveillance for COVID-19 Public Health Efforts
iv
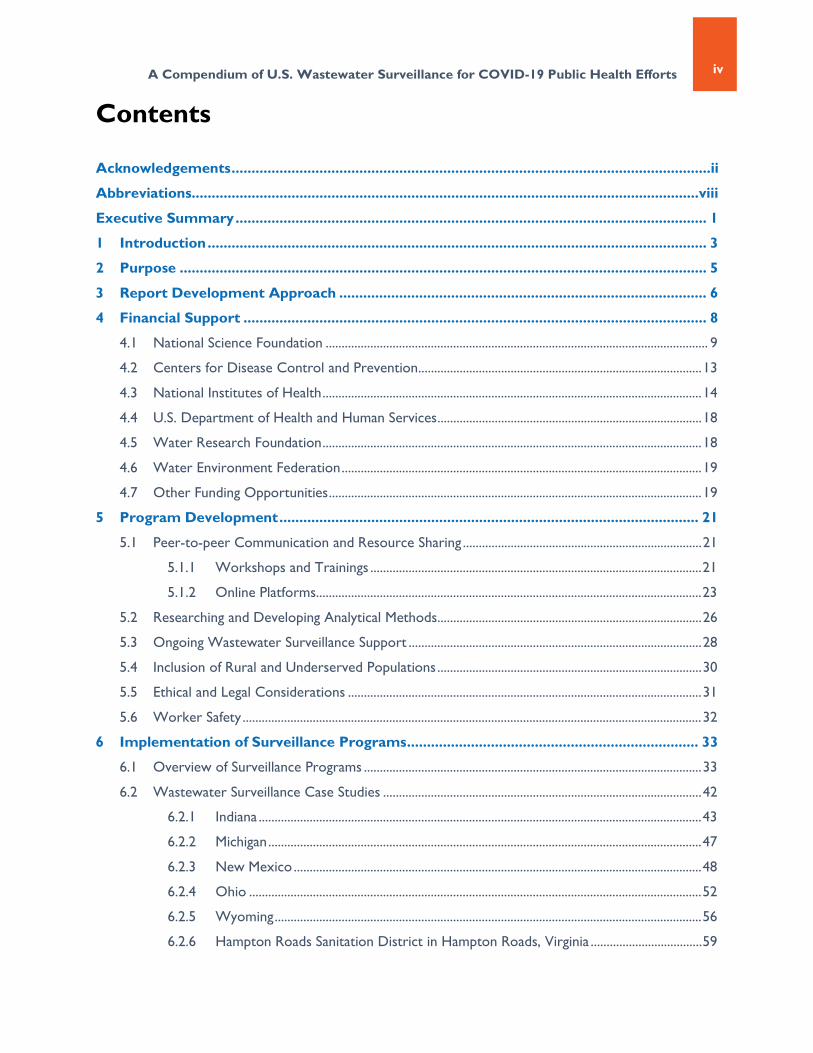
Contents Acknowledgements ........................................................................................................................ii
Abbreviations ............................................................................................................................... viii
Executive Summary ...................................................................................................................... 1
1 Introduction ............................................................................................................................. 3
2 Purpose .................................................................................................................................... 5
3 Report Development Approach ............................................................................................ 6
4 Financial Support .................................................................................................................... 8
4.1 National Science Foundation ........................................................................................................................ 9
4.2 Centers for Disease Control and Prevention ......................................................................................... 13
4.3 National Institutes of Health ....................................................................................................................... 14
4.4 U.S. Department of Health and Human Services ................................................................................... 18
4.5 Water Research Foundation ....................................................................................................................... 18
4.6 Water Environment Federation ................................................................................................................. 19
4.7 Other Funding Opportunities ..................................................................................................................... 19
5 Program Development ......................................................................................................... 21
5.1 Peer-to-peer Communication and Resource Sharing ........................................................................... 21
5.1.1 Workshops and Trainings ........................................................................................................ 21
5.1.2 Online Platforms ......................................................................................................................... 23
5.2 Researching and Developing Analytical Methods ................................................................................... 26
5.3 Ongoing Wastewater Surveillance Support ............................................................................................ 28
5.4 Inclusion of Rural and Underserved Populations ................................................................................... 30
5.5 Ethical and Legal Considerations ............................................................................................................... 31
5.6 Worker Safety ................................................................................................................................................ 32
6 Implementation of Surveillance Programs ......................................................................... 33
6.1 Overview of Surveillance Programs .......................................................................................................... 33
6.2 Wastewater Surveillance Case Studies .................................................................................................... 42
6.2.1 Indiana ........................................................................................................................................... 43
6.2.2 Michigan ........................................................................................................................................ 47
6.2.3 New Mexico ................................................................................................................................ 48
6.2.4 Ohio .............................................................................................................................................. 52
6.2.5 Wyoming ...................................................................................................................................... 56
6.2.6 Hampton Roads Sanitation District in Hampton Roads, Virginia ................................... 59
A Compendium of U.S. Wastewater Surveillance for COVID-19 Public Health Efforts
v
6.2.7 Houston, Texas .......................................................................................................................... 62
6.2.8 Tempe, Arizona .......................................................................................................................... 65
6.2.9 Clemson University in Clemson, South Carolina ............................................................... 68
6.2.10 University of Arizona in Tucson, Arizona ............................................................................ 71
7 Wastewater Surveillance Lessons Learned ........................................................................ 73
8 References .............................................................................................................................. 75
Appendix A. Summary of Wastewater Surveillance Programs
A Compendium of U.S. Wastewater Surveillance for COVID-19 Public Health Efforts
vi
List of Tables
Table 1. List of search terms used to identify wastewater surveillance programs. ........................................... 6
Table 2. NSF-funded research for wastewater surveillance. ................................................................................. 10
Table 3. NIH wastewater surveillance projects funded under RADx-rad. ........................................................ 16
Table 4. Research opportunities identified by WRF to support wastewater surveillance of SARS-CoV-2 (WRF, 2020j). .............................................................................................................................. 22
Table 5. Summary of case study wastewater surveillance programs. ................................................................. 42
Table 6. University of Arizona’s levels of concern and associated actions for ranges of SARS-CoV-2 wastewater concentrations. .................................................................................................... 72
List of Figures Figure 1. Jurisdictions using CDC funds to support wastewater surveillance for SARS-CoV-2 as
of August 2021 (CDC, 2021g). ............................................................................................................. 14
Figure 2. COVIDPoops19 dashboard (UC Merced, 2021). ................................................................................... 24
Figure 3. Utilities performing wastewater surveillance in the United States (WEF, 2021b). ........................ 25
Figure 4. CDC’s NWSS DCIPHER analytics dashboard for SARS-CoV-2 wastewater results (CDC, 2021g). .......................................................................................................................................... 29
Figure 5. Cumulative samples in the NWSS DCIPHER system (CDC, 2021g). ............................................... 29
Figure 6. Boise Wastewater Surveillance Dashboard with wastewater SARS-CoV-2 virus copies per liter on the top graph and confirmed and probable COVID-19 cases on the bottom graph (Boise, 2021). ................................................................................................................. 36
Figure 7. Utah SARS-CoV-Wastewater Surveillance Dashboard with the service are and recent wastewater trend on the left, SARS-CoV-2 million gene copies per person, per day on the top right graph, and daily new cases per 100,000 residents on the bottom right graph (Utah DEQ, 2021). ............................................................................................................. 37
Figure 8. Missouri Department of Health and Human Services Wastewater Surveillance Dashboard with color coded symbols to indicate recent SARS-CoV-2 wastewater trends (Missouri DHSS, 2021). ............................................................................................................. 38
Figure 9. Yale University Wastewater Surveillance Dashboard – Hartford South Meadows WWTP serving Hartford, West Hartford, Newington, Bloomfield, and Wethersfield with SARS-CoV-2 wastewater results in copies per milliliter on the top graph and daily COVID-19 cases per 100,000 residents on the bottom graph (Yale University, 2021a). ........................................................................................................................ 40
Figure 10. Athens-Clark County Wastewater Surveillance Dashboard for one of the WWTPs (Lott et al., 2020). .................................................................................................................................... 41

A Compendium of U.S. Wastewater Surveillance for COVID-19 Public Health Efforts
vii
Figure 11. Example plots provided to the utilities including viral gene copies per 100 milliters (mL) for recent samples, concentrations over time as compared to the other utilities, weekly COVID-19 cases, and mobility metrics from Google and Apple (IFA, 2020) ................................................................................................................................................. 45
Figure 12. Plots of viral gene copies (GC) per mL in Indiana communities (Indiana, 2020). ......................... 46
Figure 13. Michigan Wastewater Surveillance Program projects (green diamonds) and sampling locations (blue circles) (Michigan EGLE, 2021)................................................................................. 47
Figure 14. Wastewater surveillance data for the J. Paul Taylor Center (NMED, 2021a). ............................. 50
Figure 15. Wastewater surveillance data for Luna County Detention Center (east side) (NMED, 2021a). ........................................................................................................................................................ 51
Figure 16. Ohio Coronavirus Wastewater Monitoring Network Dashboard showing all the participating utilities on the map and a list of utilities in order of the trend based on the most recent results (as of April 19, 2021) (Ohio DOH, 2020). ........................................... 54
Figure 17. Ohio Coronavirus Wastewater Monitoring Network Dashboard showing city-specific results normalized by WWTP influent flow rate (top graph) and compared to the number of COVID-19 cases from individual testing (bottom graph) (Ohio DOH, 2020). .......................................................................................................................................................... 55
Figure 18. Wyoming State SARS-CoV-2 Wastewater Surveillance Dashboard prevalence ranges (Wyoming PHL, 2021). ........................................................................................................................... 57
Figure 19. Wyoming State SARS-CoV-2 Wastewater Surveillance Dashboard (Wyoming PHL, 2021). .......................................................................................................................................................... 58
Figure 20. HRSD’s dashboard presents the SARS-CoV-2 wastewater concentration and the new individual COVID-19 cases over time (HRSD, 2021a). .................................................................. 60
Figure 21. HRSD’s dashboard presents the SARS-CoV-2 wastewater concentration spatially throughout the collection system over time (HRSD, 2021a) ....................................................... 61
Figure 22. Areas of Houston covered by the wastewater surveillance program (Houston, 2021). ............ 63
Figure 23. Percent change in wastewater results from July 6, 2020 (Peak) for areas of Houston covered by the wastewater surveillance program (Houston, 2021). .......................................... 64
Figure 24. The City of Tempe’s wastewater dashboard for SARS-CoV-2 with a map of the areas sampled (Tempe, 2021a). ....................................................................................................................... 67
Figure 25. The Clemson University COVID-19 Wastewater Dashboard color codes the impact level on a map of each WWTP’s collection system area (Clemson, 2021a)............................. 69
Figure 26. The Clemson University COVID-19 Wastewater Dashboard demonstrates the impact level and virus copies/L in each WWTP influent sampling point over time. The dashboard also includes variant tracking results (Clemson, 2021a). ........................................... 70
A Compendium of U.S. Wastewater Surveillance for COVID-19 Public Health Efforts
viii
Abbreviations APHL Association of Public Health Laboratories
ASTHO Association of State and Territorial Health Officials
ASU Arizona State University
CARES Act 2020 Coronavirus Aid, Relief, and Economic Security Act
CDC Centers for Disease Control and Prevention
cDNA complementary deoxyribonucleic acid
COVID-19 coronavirus disease 2019
CT cycle threshold
DCIPHER Data Collation and Integration for Public Health Event Response
DHS United States Department of Homeland Security
EGLE Michigan Department of Environment, Great Lakes, and Energy
ELC Epidemiology and Laboratory Capacity for Prevention and Control of Emerging Infectious Disease (CDC funding)
EPA United States Environmental Protection Agency
HHD Houston Health Department
HHS United States Department of Health and Human Services
HRSD Hampton Roads Sanitation District
IFA Indiana Finance Authority
L liter
MDHHS Michigan Department of Health and Human Services
mL milliliter
N nucleocapsid gene
NACCHO National Association of County and City Health Officials
NACWA National Association of Clean Water Agencies
NEHA National Environmental Health Association
NIH United States National Institutes of Health
NIST United States National Institute of Standards and Technology
NSF United States National Science Foundation
NSSIL National Sewage Surveillance Interagency Leadership
NWSS National Wastewater Surveillance System
ODH Ohio Department of Health
Ohio EPA Ohio Environmental Protection Agency
Ohio WRC Ohio Water Resources Center
ORD Office of Research and Development (within EPA)
PCR polymerase chain reaction
RADxSM Rapid Acceleration of Diagnostics (NIH initiative)
A Compendium of U.S. Wastewater Surveillance for COVID-19 Public Health Efforts
ix
RADx-rad RADxSM Radical (NIH initiative)
RAPID Rapid Response Research (NSF funding mechanism)
RNA ribonucleic acid
RT-ddPCR reverse transcription digital droplet PCR
RT-PCR reverse transcription PCR
RT-qPCR reverse transcription-quantitative PCR
SARS-CoV-2 severe acute respiratory syndrome coronavirus 2
WBE wastewater-based epidemiology
WDOH Wyoming Department of Health
WEF Water Environment Federation
WEST Water and Energy Sustainable Technology (at the University of Arizona)
WHO World Health Organization
WPHL Wyoming Public Health Laboratory
WRF Water Research Foundation
WWTP wastewater treatment plant

A Compendium of U.S. Wastewater Surveillance for COVID-19 Public Health Efforts
1
Executive Summary Wastewater surveillance is a community-level approach for monitoring disease or chemical biomarkers that are excreted in human urine and feces and collected in sewers. Since early 2020, with the start of the coronavirus disease 2019 (COVID-19) pandemic, scientists and public health practitioners across the globe have been developing methods and implementing programs to track severe acute respiratory syndrome coronavirus 2 (SARS-CoV-2), the virus that causes COVID-19, in wastewater. Even though SARS-CoV-2 is a respiratory virus, wastewater surveillance can be used to track its spread since it can be shed in the feces of individuals who are symptomatic and asymptomatic (including pre-symptomatic). Monitoring SARS-CoV-2 levels in untreated wastewater relies on approaches and technologies that have been and continue to be rapidly deployed and evaluated by federal agencies, non-governmental organizations, states, wastewater utilities, universities, and industry. Despite the rapidly evolving science in this field, these entities were able to establish wastewater surveillance programs while developing sampling and analytical methods. The results of these programs provide useful information to assist communities in their public health response to the COVID-19 pandemic—highlighting the potential for wastewater monitoring to serve as a complementary approach to current and future infectious disease surveillance systems.
The United States Environmental Protection Agency (EPA) created this document to provide information to those who are interested in implementing wastewater surveillance programs to monitor SARS-CoV-2 or other pathogenic disease agents and chemical exposures in the future. To support that goal, this compendium documents the efforts of federal, state, local, and tribal agencies—as well as associations, universities, and the private sector—throughout 2020 and into early 2021 to explore federal and other funding sources, develop and implement wastewater surveillance for SARS-CoV-2, and provide information on how programs were implemented through case studies.
The report describes funding mechanisms from federal agencies, non-governmental organizations, private foundations, or funding by other means, such as reprogramming of existing funding, that were used to establish wastewater surveillance programs. The report also discusses how stakeholder collaboration through workshops, trainings, and other mechanisms allowed the research community to build upon established protocols for waterborne enteric viruses to advance wastewater surveillance for SARS-CoV-2. This collaboration was also critical for developing analytical methods for SARS-CoV-2 in wastewater, refining sampling collection procedures, and interpreting the wastewater testing results. Tied to the last point, this report documents how some programs communicated the results through online dashboards and then translated those results into public health responses.
Through its research conducted in early 2021, EPA identified 14 states with large-scale SARS-CoV-2 wastewater surveillance programs, along with 160 local communities or academic institutions conducting wastewater surveillance. While these groups developed and relied on different methods, their efforts were ultimately successful in detecting SARS-CoV-2 and initiating action to prevent the continued spread of COVID-19. From these programs, EPA selected 10 case studies that highlight different approaches for implementing programs and analyzing wastewater data to track the presence of SARS-CoV-2. These examples can inform how to establish and implement wastewater surveillance throughout the COVID-19 pandemic or for future pandemics and public health crises. For example, the case study programs highlighted that much of their success was dependent on effective collaboration with multiple partners, flexibility to adapt their programs as the science evolved, support from within their organization, transparent communication with stakeholders on how wastewater testing results could be used to help their communities respond to the pandemic, and adequate funding. These programs highlighted how wastewater surveillance can be an important and effective tool for early detection of

A Compendium of U.S. Wastewater Surveillance for COVID-19 Public Health Efforts
2
SARS-CoV-2, especially among disadvantaged or vulnerable populations where clinical testing may not be widely available.
A Compendium of U.S. Wastewater Surveillance for COVID-19 Public Health Efforts
3
1 Introduction Wastewater surveillance is a community-level approach for monitoring chemical metabolites, bacteria, and viral pathogens that are excreted in human urine and feces and collected in sewers. It has been successfully used to detect various agents of diseases (e.g., poliovirus, hepatitis B, norovirus) in populations for decades and more recently to understand community-level drug use (e.g., opioids). A major advantage of wastewater-based methods is that they are not subject to the same reporting and recall biases that can occur when epidemiologic data are collected from individual community members or health care providers. For example, wastewater samples can be used to identify the true spectrum of drugs being consumed by a population rather than relying on individual self-reported information. In addition, wastewater-based methods can produce near real-time data that represent an entire community or smaller subsets of a community (e.g., at the sub-county level, at the individual facility or building level).
Beginning in early 2020, wastewater surveillance received renewed attention in light of the COVID-19 pandemic. Because individuals with symptomatic or asymptomatic infection can shed the SARS-CoV-2 virus in their feces, quantitative measures of SARS-CoV-2 in wastewater can provide useful information on changes in total COVID-19 infection in the community contributing to the wastewater (CDC, 2021a). Scientists and public health practitioners across the globe therefore quickly mobilized to develop methods and programs to track SARS-CoV-2 in wastewater. For example, researchers in the Netherlands began testing sewage for SARS-CoV-2 from six cities and the Schiphol airport in February 2020, before the Netherlands reported their first COVID-19 case. A month after the wastewater program began, the Netherlands detected low levels of the virus in sewage from several sites. Subsequent increases in sewage viral concentrations correlated with increases in reported COVID-19 prevalence in the community (Medema et al., 2020). Italian researchers also began testing for SARS-CoV-2 in wastewater in areas of high (e.g., Milan) and low (e.g., Rome) COVID-19 prevalence in February 2020, with first detections of SARS-CoV-2 in wastewater observed in late February (La Rosa et al., 2020). Studies conducted in the United States in March and April 2020 had similar success detecting the presence of SARS-CoV-2 in wastewater (e.g., Massachusetts) (Wu et al., 2020). Early efforts such as these highlighted the potential for sewage surveillance to serve as a complementary measure for monitoring COVID-19 spread in a community.
Federal, state, public health, and environment departments throughout the United States, as well as academic institutions, tribes, utilities, and others have developed wastewater monitoring programs for SARS-CoV-2 to monitor trends within a sewershed or at a targeted site (e.g., a facility or building). According to the Centers for Disease Control and Prevention (CDC), the virus has in some cases been detected in wastewater prior to reported cases in the community and trends in virus concentrations in wastewater have preceded trends in newly reported cases by multiple days (CDC, 2021a). These findings suggest that wastewater surveillance can serve as an early warning system of increased COVID-19 spread. These programs can also provide data at the smaller sewershed or facility level and in communities where timely COVID-19 individual testing is underutilized or unavailable. There are numerous documented instances where SARS-CoV-2 wastewater surveillance data have been
Wastewater Analysis for SARS-CoV-2 Multiple testing methods are used to quantify SARS-CoV-2 in wastewater. These laboratory tests typically quantify ribonucleic acid (RNA) —or the genetic signature of SARS-CoV-2 in wastewater. This means that wastewater surveillance programs for SARS-CoV-2 are not measuring the infectious virus directly, but instead are measuring viral RNA as an indicator of virus concentrations. Note that where this report refers to measurements of the virus in wastewater, the SARS-CoV-2 genetic material is what is being measured.

A Compendium of U.S. Wastewater Surveillance for COVID-19 Public Health Efforts
4
used to prioritize individual testing resources, inform other community mitigation strategies, and monitor effectiveness of interventions over the past year. For example, a state or local public health department may increase individual testing or ramp up public health messaging and outreach following a rise in SARS-CoV-2 measurements in wastewater.
For most community-level wastewater surveillance programs, samples are typically collected at the influent of a wastewater treatment plant (WWTP). Other smaller scale programs sample at locations throughout the collection system, including at lift stations or from manholes that carry sewage from individual buildings. Wastewater samples are then analyzed for the presence of SARS-CoV-2 using a nucleic acid–based reverse transcription polymerase chain reaction (RT-PCR) assay for gene markers that are unique to the virus. Results provide insight on COVID-19 among the population served by the utility’s collection system and/or subsections within a community.
It is important to note that wastewater surveillance for SARS-CoV-2 is a developing field and researchers are still learning about the dynamics of viral shedding in feces and viral persistence in wastewater. More data on the prevalence and concentrations of SARS-CoV-2 shed in the feces of infected individuals are needed to better understand the relationship between SARS-CoV-2 concentrations in wastewater and the number of individuals infected with COVID-19. Furthermore, low levels of infection in a community may not be captured by sewage surveillance (CDC, 2021a). Other complexities that arise when interpreting wastewater data include the mobility of the population contributing to the wastewater, industrial wastewater contribution, stormwater, other factors (e.g., cleaning, dilution), and variability in wastewater flow and fecal load. It is also important to note that community-level monitoring at a WWTP does not capture residences and businesses on a septic-based system or facilities that have their own system (e.g., correctional facilities); however, some separate wastewater surveillance efforts are also monitoring community septic tanks.
Because of these limitations, SARS-CoV-2 wastewater data are often considered in tandem with other COVID-19-related data to inform public health. Data from wastewater surveillance programs are not meant to replace other COVID-19 surveillance systems, but rather to offer complementary data.

A Compendium of U.S. Wastewater Surveillance for COVID-19 Public Health Efforts
5
2 Purpose EPA compiled this report to capture some of the notable and unique efforts to develop and use wastewater surveillance to detect and monitor the SARS-CoV-2 virus genetic material in untreated wastewater throughout 2020 and into early 2021. As a result, this report does not include advancements in wastewater surveillance that may have occurred after February 2021. The report includes details on developing and establishing wastewater monitoring programs throughout the United States and summarizes details such as funding mechanisms, sampling approaches used, sample analysis methods development, data interpretation, and public health responses. The report also describes the robust collaboration between organizations to share knowledge and optimize the wastewater surveillance process that occurred during this period.
Through discussions with some key programs, EPA compiled lessons learned for the development and implementation of wastewater surveillance programs, in the face of rapidly evolving science and a global pandemic. These examples and the many success stories can inform wastewater surveillance efforts for future pandemics and public health crises.
This report documents SARS-CoV-2 wastewater surveillance efforts throughout the country by federal agencies, non-governmental stakeholders, state agencies, tribal agencies, local agencies, utilities, academic institutions, and private entities. The report begins by describing how EPA gathered information (Section 3) and then summarizes funding mechanisms that have provided financial support to researchers and other groups implementing wastewater surveillance (Section 4). Next, the document provides examples for how entities worked collaboratively to advance wastewater surveillance practices (Section 5.1), develop and research analytical methods (Section 5.2), provide ongoing support for wastewater surveillance strategies (Section 5.3), serve rural and underserved populations (Section 5.4), consider ethical and legal concerns (Section 5.5), and develop resources to protect wastewater utility workers (Section 5.6). The report also provides an overview of some of the SARS-CoV-2 wastewater surveillance programs that were established by various entities (Section 6.1) and presents 10 case studies, which offer unique examples of program leadership, collaboration, funding, sampling design, data presentation, and data interpretation (Section 6.2), with a summary of lessons learned from wastewater surveillance programs (Section 7). Appendix A includes two tables summarizing SARS-CoV-2 wastewater surveillance programs for states (Table A-1) and municipalities and universities (Table A-2), based on a review of publicly available information in January 2021.
This report is not intended to serve as a comprehensive summary of all wastewater surveillance efforts for SARS-CoV-2 in the U.S. or as a guidance/framework document. Rather, it documents and provides examples and perspective on the wide variety of activities conducted by diverse entities to develop and implement ways to use wastewater surveillance to complement existing public health measures for the COVID-19 pandemic.
It is important to note that this report and EPA do not endorse or make any judgement or provide guidance on a specific model for wastewater surveillance programs. This report is intended to provide information, lessons learned, and examples to assist communities in designing, developing, and implementing these programs as needed.

A Compendium of U.S. Wastewater Surveillance for COVID-19 Public Health Efforts
6
3 Report Development Approach To summarize programs providing financial support and methods development research/guidance for wastewater surveillance of SARs-CoV-2 over the past year (see Sections 4 and 5), EPA searched for and reviewed federal agency, non-governmental organization, and other stakeholder (e.g., professional associations) websites with a focus on wastewater and public health. EPA also relied on information from press releases, publicly available grant/contracting documents, webinars/virtual conference presentations, research project updates from funding agencies, and news articles. Except for the 10 case studies presented in Section 6.2, EPA did not meet with the federal agencies, non-governmental organizations, or other stakeholders described throughout this report to collect additional information on their wastewater surveillance programs. Additionally, EPA did not conduct a comprehensive literature review in support of this report.
As part of this report, EPA also compiled details on existing wastewater surveillance programs in the United States using publicly available information (see Section 6 and Appendix A). EPA’s goal in this effort was to identify and understand the breadth of state, local (e.g., city, county), tribal, and university wastewater surveillance programs. To gather this information, EPA conducted keyword searches in January 2021 using various combinations of wastewater, COVID-19, and program-specific search terms presented in Table 1 and an internet search engine. For example, a combination of “wastewater,” “monitoring,” “COVID-19,” and “university” keywords used to identify surveillance efforts on college/university campuses.
Table 1. List of search terms used to identify wastewater surveillance programs.
Wastewater Search Terms COVID-19 Search Terms Program-Specific Terms
Wastewater COVID-19 University
Sewage COVID College
Manhole SARS-CoV-2 School
WWTP Outbreak City
Surveillance County
Monitoring Local
Dashboard State
Wastewater Testing State-wide
Tribe
Territories
EPA also reviewed websites of known collaborative initiatives (e.g., the COVID-19 Wastewater Based Epidemiology [WBE] Collaborative [COVID-19 WBE Collaborative, 2021]) to identify additional surveillance programs. EPA also reviewed the COVIDPoops19 website (UC Merced, 2021), which compiles wastewater surveillance programs for SARS-CoV-2 across the globe, and a Slack workspace website for informal communication regarding SARS-CoV-2 wastewater surveillance (see additional discussion in Section 5.1).
A Compendium of U.S. Wastewater Surveillance for COVID-19 Public Health Efforts
7
Once the wastewater surveillance programs were identified, EPA compiled information on the programs from program websites and dashboards, news articles and press releases, program summaries and reports, and more. EPA searched for and reviewed information across all state wastewater surveillance programs. However, EPA’s ability to summarize information about all the local, tribal, and university programs identified was limited given the number of such programs identified (more than 150). For all of the state programs and a subset of the local and university programs, EPA recorded publicly available details, including:
Program location (e.g., city, state). Organization leading the program. Partners or collaborating organizations. Wastewater surveillance program website link. Sampling start date and end date, if applicable. Summary of sampling locations (e.g., WWTP influent, manholes at correctional facilities or
dormitories). Number of sampling locations. Analytical methods (e.g., reverse transcription-quantitative PCR [RT-qPCR]). Wastewater testing results presentation (e.g., tables, graphs, normalization, units). Public health actions/outcomes as available.
EPA then reviewed the identified state, local, and university-led programs to select a diverse subset with unique aspects to highlight as case studies. EPA selected programs that demonstrate the wide variety of ways that programs were financed (e.g., self-funded versus using Coronavirus Aid, Relief, and Economic Security [CARES] Act funding) and implemented (e.g., sampling locations, analytical methods), as well as how the programs interpreted the wastewater results (e.g., compared to individual cases, normalized by wastewater flow rate or population size) and the public health measures the programs took based on the wastewater results (e.g., individual testing, public education and outreach). Once EPA identified the programs for case studies, EPA met with the practitioners and researchers leading each program in order to gather additional information beyond what was found in the search of publicly available sources listed above. EPA used this information to develop the case study summaries presented in Section 6.2.

A Compendium of U.S. Wastewater Surveillance for COVID-19 Public Health Efforts
8
4 Financial Support As more information became available on the ability to detect SARS-CoV-2 in untreated wastewater, federal agencies, non-governmental organizations, and various stakeholders quickly recognized the need to develop and support wastewater surveillance programs.
On March 27, 2020, the federal government enacted the CARES Act to address the health, economic, and societal impacts of the COVID-19 pandemic. Federal agencies distributed CARES Act funds through grants, contracts, and other mechanisms to interested researchers and other groups. The CARES Act funded many different types of programs (e.g., individual testing, unemployment relief), including funds to support wastewater surveillance programs. Some federal agencies, non-governmental organizations, and other stakeholders also provided financial support from their non-CARES Act annual funding to support wastewater surveillance programs.
Early in the COVID-19 response, numerous federal agencies and non-governmental stakeholders initiated independent programs tied to wastewater surveillance, including providing funding to support the COVID-19 response. To coordinate multiple initiatiatives across interested groups, the U.S. Department of Health and Human Services (HHS) and CDC created the National Sewage Surveillance Interagency Leadership (NSSIL) Committee in June 2020. Since late July of 2020, the NSSIL Committee has held monthly meetings “to exchange information and discuss federal agency-specific missions, roles, activities, and stakeholder engagement related to wastewater surveillance of SARS-CoV-2” (CDC, 2020a). The NSSIL Committee includes involvement from the following federal agencies:
HHS CDC EPA Department of Homeland Security (DHS) Department of Defense United States Geological Survey National Institutes of Health (NIH) National Science Foundation (NSF) Department of Veterans Affairs
The NSSIL Committee also includes the following non-governmental stakeholders:
Association of Public Health Laboratories (APHL) Association of State and Territorial Health Officials (ASTHO) Council of State and Territorial Epidemiologists National Association of County and City Health Officials (NACCHO) National Environmental Health Association (NEHA) Water Environment Federation (WEF) WRF
The NSSIL Committee originally included three federal interagency workgroups: Implementation and Planning Workgroup, Science and Technology Evaluation for Practice Research, and Wastewater Testing Surge Capacity (CDC, 2020a). The Implementation and Planning Workgroup develops and implements the National Wastewater Surveillance System (NWSS), sewage sampling and testing capacity, and

A Compendium of U.S. Wastewater Surveillance for COVID-19 Public Health Efforts
9
guidance documents for sewage sampling, testing, and data interpretation for public health action. The NWSS links to a real-time, public health data platform known as DCIPHER (Data Collation and Integration for Public Health Event Response) developed by CDC and designed to store, analyze, and display public health data, including SARS-CoV-2 wastewater data collected throughout the country (CDC, 2021a). See Section 5.3 for more information on CDC’s NWSS. The Science and Technology Evaluation for Practice Workgroup coordinates the exchange of information on wastewater sampling, testing, and data interpretation throughout federal agencies. This workgroup also coordinates forums to connect and inform the public and partner organizations (CDC, 2020a). The Wastewater Testing Surge Capacity workgroup was originally designed to utilize federal laboratories to provide timely as-needed wastewater analyses (CDC, 2020a). However, NSSIL decided this workgroup was no longer necessary because of the rapid increase in wastewater analytical support from commercial and state laboratories (CDC, 2021b).
Federal agencies and non-governmental stakeholders of the NSSIL prioritized making resources available for SARS-CoV-2 wastewater surveillance programs that would support public health efforts to decrease the spread of the virus. One identified resource was financial support for COVID-19-related wastewater surveillance research, development, and implementation.
This section summarizes some of the funding mechanisms provided by federal agencies, non-governmental organizations, and other stakeholders; it is not an exhaustive list of all funding provided to wastewater surveillance programs. There are many wastewater surveillance programs that used or are using funding from other sources (e.g., private foundations, reallocations of existing funding). See the case studies in Section 6.2 for several detailed examples of how specific entities funded their wastewater surveillance programs.
4.1 National Science Foundation On April 3, 2020, NSF announced a request for proposals with a focus on “non-medical, non-clinical-care research” to better understand the spread of COVID-19, educate on the science of virus transmission and prevention, and develop processes to address the pandemic. NSF used their Rapid Response Research (RAPID) funding mechanism, which allows the agency to quickly review proposals and award grants for projects that have a critical urgency with regard to identified circumstances (NSF, 2020a). Traditional grant programs often take months between an agency’s releases of a request for proposal and project funding, which can be ineffective during emergencies such as the COVID-19 pandemic (NSF, 2020b). NSF’s RAPID grant proposal requirements are also more streamlined than traditional grant programs, requiring no more than five pages explaining why the proposed research is urgent and why RAPID is the most appropriate grant program (NSF, 2020c). NSF’s announcement indicated up to $200,000 in funding for projects conducted over a period of up to one year. However, NSF noted that they would consider projects of a longer duration with sufficient justification (NSF, 2020a).
NSF received $76 million from the CARES Act, with $75 million allocated for grants and $1 million for the administration of those grants (NSF, 2020d). As of January 2021, NSF granted a total of 1,229 awards for COVID-19 projects using the CARES Act funding and $208 million from their fiscal year 2020 budget (NSF, 2020e). As of April 2021, 16 of these grants supported research on SARS-CoV-2 in wastewater, as shown in Table 2 (NSF, 2020f).
A Compendium of U.S. Wastewater Surveillance for COVID-19 Public Health Efforts
10
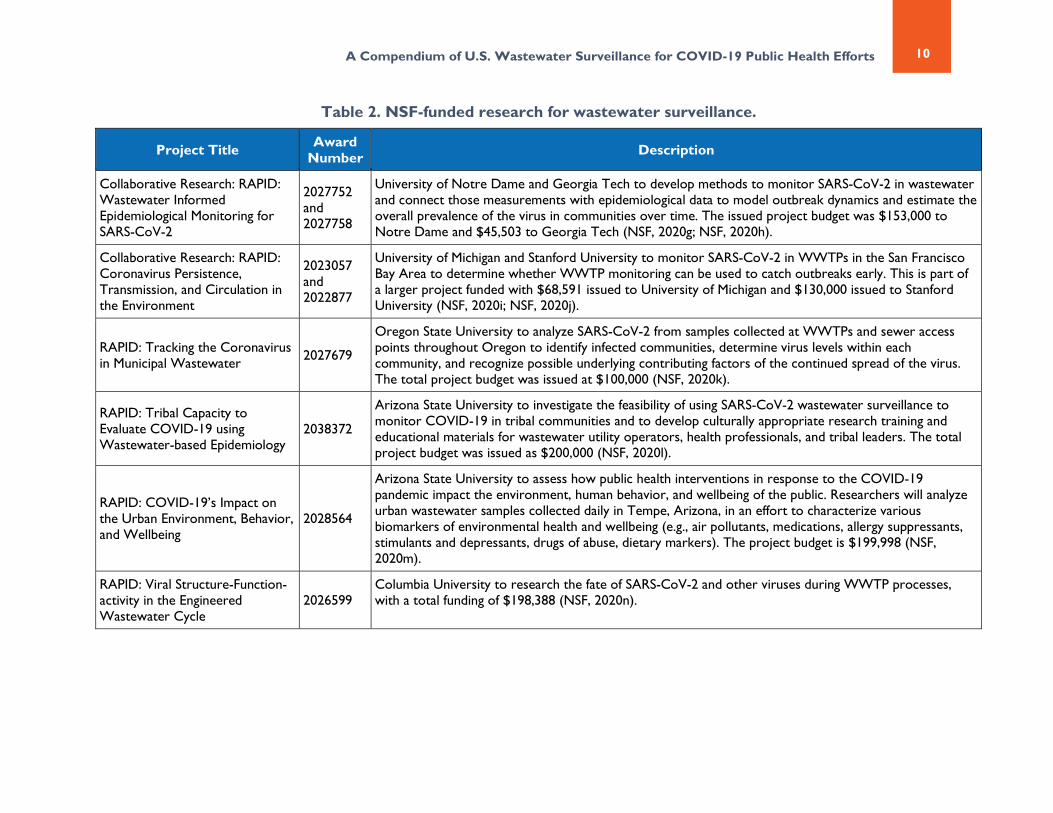
Table 2. NSF-funded research for wastewater surveillance.
Project Title Award Number Description
Collaborative Research: RAPID: Wastewater Informed Epidemiological Monitoring for SARS-CoV-2
2027752 and 2027758
University of Notre Dame and Georgia Tech to develop methods to monitor SARS-CoV-2 in wastewater and connect those measurements with epidemiological data to model outbreak dynamics and estimate the overall prevalence of the virus in communities over time. The issued project budget was $153,000 to Notre Dame and $45,503 to Georgia Tech (NSF, 2020g; NSF, 2020h).
Collaborative Research: RAPID: Coronavirus Persistence, Transmission, and Circulation in the Environment
2023057 and 2022877
University of Michigan and Stanford University to monitor SARS-CoV-2 in WWTPs in the San Francisco Bay Area to determine whether WWTP monitoring can be used to catch outbreaks early. This is part of a larger project funded with $68,591 issued to University of Michigan and $130,000 issued to Stanford University (NSF, 2020i; NSF, 2020j).
RAPID: Tracking the Coronavirus in Municipal Wastewater 2027679
Oregon State University to analyze SARS-CoV-2 from samples collected at WWTPs and sewer access points throughout Oregon to identify infected communities, determine virus levels within each community, and recognize possible underlying contributing factors of the continued spread of the virus. The total project budget was issued at $100,000 (NSF, 2020k).
RAPID: Tribal Capacity to Evaluate COVID-19 using Wastewater-based Epidemiology
2038372
Arizona State University to investigate the feasibility of using SARS-CoV-2 wastewater surveillance to monitor COVID-19 in tribal communities and to develop culturally appropriate research training and educational materials for wastewater utility operators, health professionals, and tribal leaders. The total project budget was issued as $200,000 (NSF, 2020l).
RAPID: COVID-19’s Impact on the Urban Environment, Behavior, and Wellbeing
2028564
Arizona State University to assess how public health interventions in response to the COVID-19 pandemic impact the environment, human behavior, and wellbeing of the public. Researchers will analyze urban wastewater samples collected daily in Tempe, Arizona, in an effort to characterize various biomarkers of environmental health and wellbeing (e.g., air pollutants, medications, allergy suppressants, stimulants and depressants, drugs of abuse, dietary markers). The project budget is $199,998 (NSF, 2020m).
RAPID: Viral Structure-Function-activity in the Engineered Wastewater Cycle
2026599 Columbia University to research the fate of SARS-CoV-2 and other viruses during WWTP processes, with a total funding of $198,388 (NSF, 2020n).

A Compendium of U.S. Wastewater Surveillance for COVID-19 Public Health Efforts
11
Table 2. NSF-funded research for wastewater surveillance.
Project Title Award Number Description
RAPID: Monitoring for SARS-CoV-2 to Elucidate Infection Dynamics Across Major Metropolitan Areas of the U.S.
2029025
North Carolina State University, the University of Southern California, Rice University, and Howard University to monitor SARS-CoV-2 in wastewater in four cities, one each in California, North Carolina, Texas, and Washington, D.C. to address knowledge gaps in the use of wastewater surveillance as a public health monitoring tool for a variety of communities. The project budget was issued as $200,000 (NSF, 2020o). See additional details in the “Monitoring SARS-CoV-2 in Major Metropolitan Areas of the U.S.” call-out box below.
RAPID: Determine Community Disease Burden of COVID-19 by Probing Wastewater Microbiome
2027059
University of Hawaii to develop a highly efficient concentration and detection method for enveloped viruses (like SARS-CoV-2) in wastewater and to collect time-sensitive wastewater samples from communities impacted by the disease to determine the abundance, diversity, and temporal dynamics of SARS-CoV-2 and other enveloped viruses. The total project budget was $151,956 (NSF, 2020p).
RAPID: Determination of Health Risks and Status from SARS-CoV-2 Presence in Urban Water Cycle
2029515 University of Utah to develop efficient techniques to extract and monitor SARS-CoV-2 in wastewater and to understand human health risks associated with the presence of SARS-CoV-2 in influent and treated effluent at WWTPs. Total funding issued for this project was $123,706 (NSF, 2020q).
Research Coordination Network for Wastewater Surveillance of SARS-CoV-2
2038087
University of Notre Dame, Howard University, Stanford University, and Arizona State University to create a Research Coordination Network to connect researchers from across the country for quick and efficient knowledge transfer on SARS-CoV-2 wastewater surveillance with a project budget of $299,995 (NSF, 2020r). See additional details in the “Creating the Research Coordination Network for SARS-CoV-2” call-out box below.
RAPID: Identifying Geographic and Demographic Drivers of Rural Disease Transmission for Improved Modeling and Decision Making
2029866
University of North Carolina to examine drivers of disease transmission in rural areas and explore differences with urban areas, with the ultimate goal of improving pandemic management in rural areas. Researchers will use data (e.g., health surveillance data, cellphone-based mobility data, land use features, commuting patterns) from three rural and three urban counties in North Carolina to develop a susceptible-exposed-infected-recovered model. They will also collect wastewater samples to quantify the prevalence of SARS-CoV-2 and to provide a complementary non-clinical metric to validate their model. Total funding issued for this project was $135,593 (NSF, 2020s).
SBIR Phase I: Automated In-Situ High-Resolution COVID-19 Wastewater-Based Epidemiology
2041400
FLUIDION US, Inc. to develop an optimized RT-qPCR approach for in-situ sampling and analysis of different viruses (including SARS-CoV-2, its variants, and other emerging viruses) and an instrumentation platform that is applicable to the early detection of viruses. As part of this work, researchers will explore the latest advances in molecular biology protocols, such as an extraction-free single step RT-qPCR. Total funding issued for this project was $256,000 (NSF, 2020t).

A Compendium of U.S. Wastewater Surveillance for COVID-19 Public Health Efforts
12
Table 2. NSF-funded research for wastewater surveillance.
Project Title Award Number Description
RAPID COVID-19 DCL response: Wastewater Pathogen Tracking Dashboard
2033137
Battelle Memorial Institute to evaluate wastewater data from four locations to determine the prevalence of SARS-CoV-2 and other viral pathogens, as well as to detect and quantify viral mutations through the use of gene sequencing. Additionally, researchers will develop a predictive risk model to identify neighborhoods to initiate contact tracing due to high SARS-CoV-2 in the wastewater relative to the number of confirmed COVID-19 cases. Total funding issued for this project was $197,375 (NSF, 2020u).
RAPID-REU Site: Mitigating the Impact of COVID-19 Pandemic on Undergraduate Research Training in the Biosciences
2034045
Montana State University to quantify SARS-CoV-2 in wastewater from a Montana WWTP using a CDC test kit protocol as an indicator of community spread of the virus for use by public health officials. This is just one of several projects covered by the $75,042 project budget, all of which will engage underrepresented minority students in research through projects that can be conducted remotely (NSF, 2020v).

A Compendium of U.S. Wastewater Surveillance for COVID-19 Public Health Efforts
13
4.2 Centers for Disease Control and Prevention In place since 1995, CDC’s Epidemiology and Laboratory Capacity for Prevention and Control of Emerging Infectious Diseases (ELC) Cooperative Agreement has provided funding to “all 50 states, several large health departments, and U.S. territories, and affiliates to detect, respond to, control, and prevent infectious diseases” (CDC, 2021b). On April 23, 2020, HHS announced that CDC1 received $631 million in CARES Act funding to support state and local COVID-19 response efforts for the 64 health department recipients (i.e., 50 states, six large cities, and eight territories2) already supported in the current five-year funding period (CDC, 2020c). This funding was intended to support “key activities related to COVID-19 in the areas of epidemiology, laboratory, and informatics” (CDC, 2020c). None of this initial CARES Act funding was used to support wastewater surveillance programs (CDC, 2021c). On May 18, 2020, CDC announced that it would distribute an additional $10.25 billion in CARES Act
1 While CDC is an agency within HHS, CDC distributed the CARES Act funding independently through existing CDC financial mechanisms. 2 The six large cities are: Chicago, IL; Houston, TX; Los Angeles County, CA; New York City, NY; Philadelphia, PA; and Washington, D.C. The eight territories are: American Samoa, Federated States of Micronesia, Guam, Mariana Islands, Marshall Islands, Palau, Puerto Rico, and U.S. Virgin Islands (CDC, 2021c).
Monitoring SARS-CoV-2 in Major Metropolitan Areas of the U.S. In May 2020, NSF awarded a $200,000 RAPID grant (award number 2029025) to a collaboration between North Carolina State University, the University of Southern California, Rice University, and Howard University to create SARS-CoV-2 wastewater surveillance programs in four major metropolitan areas with varying sewershed sizes/populations, infection rates, and required COVID-19 prevention strategies (e.g., mask mandates). Each university received 25 percent of the NSF grant to purchase analytical equipment and materials and to collectively develop an analytical method for SARS-CoV-2 in wastewater. Each university was responsible for optimizing a portion of the analytical method (e.g., RNA extraction, sample storage, virus concentration) using samples taken from their respective cities (USC, 2021). The program collected samples from WWTPs in Los Angeles, California; the District of Columbia; Raleigh, North Carolina; and Houston, Texas, to address knowledge gaps in the use of wastewater surveillance as a public health monitoring tool. Researchers acknowledged that the largest hurdles with the project were deciding between analytical approaches, considering how much virus each method recovers, the associated expenses for the supplies, and the required duration of the methods. Additionally, the project team initially had to overcome supply and equipment shortages due to the pandemic, limiting their ability explore certain analytical methods (NSF, 2020o; Shah, 2020; USC, 2021).
Creating the Research Coordination Network for SARS-CoV-2 In July 2020, NSF provided nearly $300,000 to researchers collaborating from the University of Notre Dame, Howard University, Stanford University, and Arizona State University to create a Research Coordination Network to connect interested research groups studying SARS-CoV-2 in wastewater across the United States (award number 2038087). The Research Coordination Network addresses knowledge gaps in the development of wastewater analysis methods by initiating virtual activities such as conferences, workshops, training videos, and seminars. Additionally, the researchers support sharing knowledge globally by connecting with international wastewater surveillance networks and efforts. The goal of the Research Coordination Network is to exchange of knowledge in an effort to accelerate program optimization and facilitate the ongoing development of wastewater surveillance (NSF, 2020r).

A Compendium of U.S. Wastewater Surveillance for COVID-19 Public Health Efforts
14
funding to states, territories, and local jurisdictions through the ELC cooperative agreements (CDC, 2020d). Six states and two local jurisdictions allocated some of this funding to support wastewater surveillance efforts (CDC, 2021c). In September 2020, CDC distributed a supplemental ELC award totaling $2.5 million to eight states3 to establish the early implementer network for NWSS. This initial funding was used to support public health department capacity to coordinate sample collection and testing, along with data submission to NWSS (CDC, 2021c).
In January 2021, ELC awarded an additional $19 billion in 2021 Coronavirus Response and Relief Supplemental Appropriations Act funding to support an expanded COVID-19 response, which could include further development, implementation, and expansion of wastewater surveillance programs (CDC, 2021d). Thirty states, one city, and two territories opted to allocate a total of $203 million to wastewater surveillance efforts (CDC, 2021c). This included support to Ohio and Houston, Texas (see case studies for Ohio in Section 6.2.4 and Houston, Texas, in Section 6.2.7). As of August 2021, 43 jurisdictions are using CDC-distributed funds to support wastewater surveillance, including 37 state health departments, four local health departments (Chicago, IL; Houston, TX; Philadelphia, PA; and Washington, D.C.), and health departments from two U.S. territories (see Figure 1) (CDC, 2021g).
Figure 1. Jurisdictions using CDC funds to support wastewater surveillance for SARS-CoV-2 as of August 2021 (CDC, 2021g).
4.3 National Institutes of Health NIH4 launched the Rapid Acceleration of Diagnostics (RADxSM) initiative on April 29, 2020, to “speed innovation in the development, commercialization, and implementation of technologies for COVID-19
3 The eight states are: California, North Carolina, Ohio, South Carolina, Utah, Virginia, Washington, and Wisconsin (CDC, 2021c). 4 While NIH is an agency within HHS, NIH established the RADxSM initiative independently from HHS.
A Compendium of U.S. Wastewater Surveillance for COVID-19 Public Health Efforts
15
testing” (NIH, 2021a). The initiative has four programs, each with a unique focus area and budget to fund projects (NIH, 2020a):
1. RADxSM Tech 2. RADxSM Advanced Technology Platforms 3. RADxSM Underserved Populations 4. RADxSM Radical
The RADxSM Radical (RADx-rad) supports new nontraditional approaches to address gaps in COVID-19 testing, including wastewater analysis to identify the virus and measure the spread of infection, particularly among high-risk populations (NIH, 2020a). RADx-rad has a total budget of $200 million, with grants and supplements supported by 11 NIH institutes and centers (NIH, 2020b; NIH, 2020c).
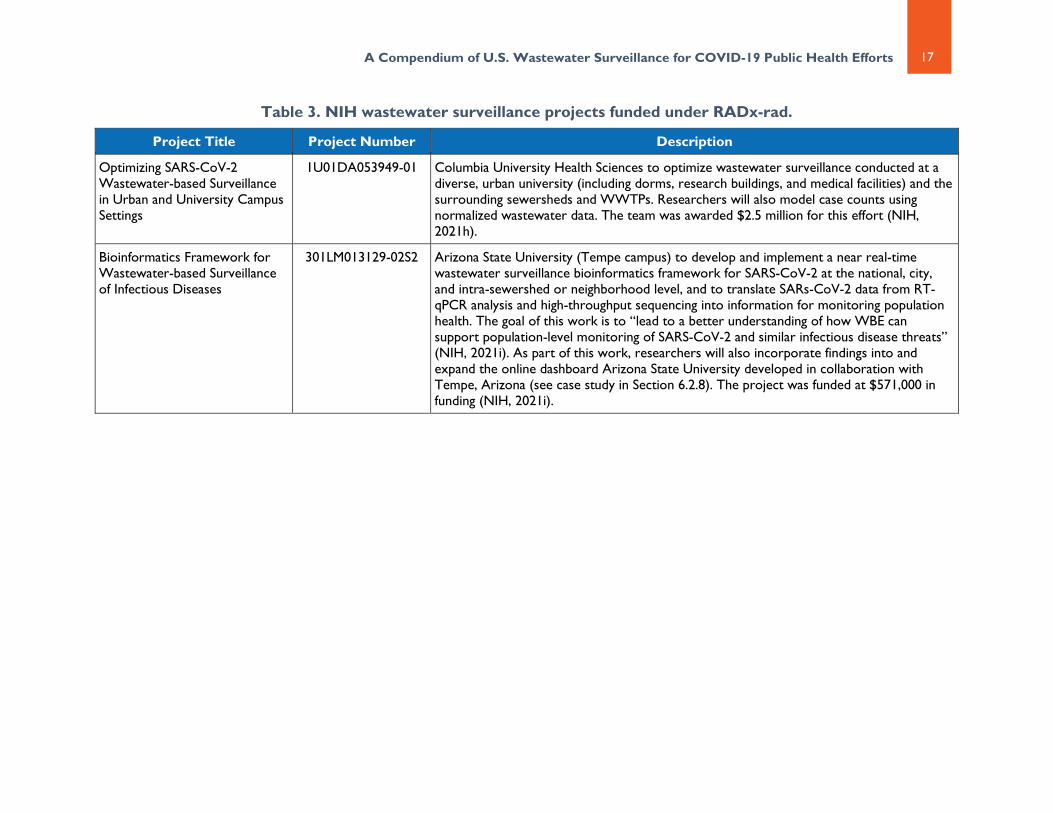
In August 2020, as part of the RADx-rad program, NIH issued a series of funding opportunities for wastewater surveillance through notices of special interest and emergency awards for researchers to apply for project funding. NIH issues notices of special interest to support high-priority and high-opportunity areas of science. NIH uses emergency awards to provide expedited funding in response to public health emergencies such as the one declared for COVID-19. NIH announced emergency awards to support wastewater detection of SARS-CoV-2, with $19 million available to fund five to ten wastewater surveillance initiatives (NIH, 2020d). In December 2020, NIH issued seven awards to support wastewater surveillance and one award to support data coordination across grantees (NIH, 2021b). All listed wastewater surveillance projects have a start date of January 2021 and are projected to end in December 2022; the data coordination effort is expected to continue through November 2024. A brief summary of the awards related to wastewater surveillance is provided in Table 3 and a summary of the data coordination center is presented in the following call-out box.

A Compendium of U.S. Wastewater Surveillance for COVID-19 Public Health Efforts
16
Table 3. NIH wastewater surveillance projects funded under RADx-rad.
Project Title Project Number Description
Development and Proof-of-Concept Implementation of the South Florida Miami RADx-rad SARS-CoV-2 Wastewater-Based Surveillance Infrastructure
1U01DA053941-01 The University of Miami (partnering with Weill Cornell Graduate School of Medical Sciences) to develop data standards and infrastructure for wastewater surveillance program data, optimize wastewater surveillance sampling and analytical methods, and integrate the results with public health data to develop predictive models for community spread utilizing total project funding of $2.7 million (NIH, 2021c).
Wastewater Analysis of SARS-CoV-2 in Tribal Communities
1U01DA053976-01 Arizona State University to develop a WBE Tribal Coordination Center and measure SARS-CoV-2 in wastewater across U.S. reservations, with a project budget of $1.5 million. Another goal of this project is to “show that WBE is a non-invasive, culturally appropriate biomonitoring strategy that can be adopted and implemented by tribal communities” (NIH, 2021d).
Improved Scalability, Sensitivity, and Interpretability of Pathogen Detection, Including SARS-CoV-2, in Wastewater Using High-throughput, Highly Multiplexed Digital Array PCR Technology
1U01DA053899-01 University of North Carolina Chapel Hill to explore limitations of molecular technologies like RT-qPCR to quantify SARS-CoV-2 (e.g., lack of streamlined pre-analytical processing steps) and to demonstrate other comprehensive and low-cost approaches that could be used to rapidly address novel pathogen threats in the future, with a project budget of $1 million (NIH, 2021e).
Wastewater Assessment for Coronavirus in Kentucky: Implementing Enhanced Surveillance Technology
1U01DA053903-01 University of Kentucky to develop analytical methods for rapid quantification in the field (i.e., “create a sensitive, robust, and field-friendly platform for testing wastewater for SARS-CoV-2 RNA” rather than a laboratory setting), to validate the approach with side-by-side comparisons to conventional wastewater surveillance, and then establish wastewater surveillance programs by training WWTP operators to use these methods in remote areas of Appalachian Kentucky. The issued project budget was $1.8 million (NIH, 2021f).
Wastewater Detection of COVID-19
1U01DA053893-01 Missouri State Department of Health and Senior Services to support wastewater surveillance at congregate facilities and to use these data to help estimate the per patient contribution and longevity of SARS-CoV-2 RNA in wastewater. This will be done by increasing the number of facilities sampled, adjusting the sampling frequency, and comparing the wastewater results to individual testing. Missouri is also using these funds to evaluate and define factors that contribute to SARS-CoV-2 signal suppression in wastewater, with a total funding of $2 million (NIH, 2021g).
A Compendium of U.S. Wastewater Surveillance for COVID-19 Public Health Efforts
17
Table 3. NIH wastewater surveillance projects funded under RADx-rad.
Project Title Project Number Description
Optimizing SARS-CoV-2 Wastewater-based Surveillance in Urban and University Campus Settings
1U01DA053949-01 Columbia University Health Sciences to optimize wastewater surveillance conducted at a diverse, urban university (including dorms, research buildings, and medical facilities) and the surrounding sewersheds and WWTPs. Researchers will also model case counts using normalized wastewater data. The team was awarded $2.5 million for this effort (NIH, 2021h).
Bioinformatics Framework for Wastewater-based Surveillance of Infectious Diseases
301LM013129-02S2 Arizona State University (Tempe campus) to develop and implement a near real-time wastewater surveillance bioinformatics framework for SARS-CoV-2 at the national, city, and intra-sewershed or neighborhood level, and to translate SARs-CoV-2 data from RT-qPCR analysis and high-throughput sequencing into information for monitoring population health. The goal of this work is to “lead to a better understanding of how WBE can support population-level monitoring of SARS-CoV-2 and similar infectious disease threats” (NIH, 2021i). As part of this work, researchers will also incorporate findings into and expand the online dashboard Arizona State University developed in collaboration with Tempe, Arizona (see case study in Section 6.2.8). The project was funded at $571,000 in funding (NIH, 2021i).

A Compendium of U.S. Wastewater Surveillance for COVID-19 Public Health Efforts
18
4.4 U.S. Department of Health and Human Services In November 2020, HHS (with support from CDC) awarded a competitive contract of $1.55 million in CARES Act funding to AquaVitas, a commercial wastewater testing and analytics company, to complete a six-week wastewater testing pilot study of WWTPs serving about 10 percent of the U.S. population for a period of six weeks (CDC, 2020b; FPDS, 2021). The results from this pilot test were provided to state and local public health agencies and incorporated into CDC’s NWSS (CDC, 2020b).
In February 2021, HHS issued a follow-on request for proposals to collect wastewater samples, analyze samples, and transfer results from at least 320 WWTP throughout the United States, including tribes and territories (the total representing approximately 30 percent of the U.S. population), into CDC’s NWSS (CDC, 2020b; HHS, 2021). Biobot Analytics, a private company based out of Boston, Massachusetts, was awarded the contract on May 24, 2021, with sample collection scheduled anticipated to begin on June 14, 2021, and anticipated run for a period of nine weeks (Biobot, 2021a; Biobot, 2021b). Under this contract, Biobot Analytics will expand on the previous HHS-led wastewater epidemiology program, while incorporating genomic sequencing in an effort to track COVID-19 variants (Biobot, 2021a).
4.5 Water Research Foundation WRF initiated and funded multiple research projects to advance wastewater surveillance for SARs-CoV-2 based on the research needs identified at their first International Water Research Summit in April 2020 (WRF, 2020a) (see additional details in Section 5.1). Three research areas were identified for additional funding and research: (1) interlaboratory and methods assessment, (2) stability of SARS-CoV-
Establishing a RADx-rad Data Coordination Center On August 6, 2020, NIH released an emergency award under RADx-rad to fund the development of a RADx-rad Data Coordination Center to provide support to RADx-rad awardees with administration operations and logistics; data collection, integration, and sharing; and data management and use. Beyond connecting RADx-rad programs, the Data Coordination Center also provides data to the NIH-based data center that supports other NIH initiatives (NIH, 2020e). On December 21, 2020, NIH awarded the University of California San Diego and the University of Texas Health Science Center at Houston $5,954,423 in funding from the Paycheck Protection Program and Health Care Enhancement Act of 2020 for initial development of the Data Coordination Center in 2021 (project number 1U24LM013755-01) (NIH, 2020e; NIH 2021j). The project team designed the RADx-rad Discoveries and Data Coordination Center to include three main functions (NIH, 2021k):
1. Administration Core: To focus on logistics and communications for the Data Coordination Center and facilitate data sharing and data use agreements to collect and distribute data generated by the RADx-rad awardees.
2. Data Core: To develop tools and approaches to assist the RADx-rad awardees with data collection, harmonization, and sharing (e.g., common metadata requirements, mapping standards, data hosting).
3. Discovery and Diagnostic Core: To support RADx-rad awardees in ensuring the data they collect is usable for the Data Coordination Center by providing expert consultation, developing best practices, and more.
The Data Coordination Center includes information on all NIH RADx-rad awardees, a list of resources for the awardees that includes topics such as data flow and guidance for common data elements, and training and networking events for researchers (NIH, 2021k).

A Compendium of U.S. Wastewater Surveillance for COVID-19 Public Health Efforts
19
2 genetic signal in wastewater, and (3) impact of storage and pre-treatment methods on signal strength (WRF, 2020b). Funds were awarded to address the first two topic areas to research teams following a competitive contract process.
In June 2020, WRF published a request for qualifications to identify a research team to evaluate existing laboratory methods for sensitivity and precision to detect the SARS-CoV-2 in untreated wastewater (WRF, 2020c). In July 2020, WRF named Trussell Technologies as the recipient of $200,000 to lead the “Interlaboratory and Methods Assessment of the SARS-CoV-2 Genetic Signal in Wastewater” study (WRF, 2020d). The work started in early Fall 2020 and involved collecting composite wastewater samples tested by the research team’s laboratory and submitted to other participating laboratories for analysis using their own methods. WRF funded the project using internal funds as well as supplemental funding from the Bill and Melinda Gates Foundation (WRF, 2020e).
In August 2020, WRF announced another request for qualifications to find a research team that could identify ways to optimize SARS-CoV-2 sewage sampling designs in order to quickly detect COVID-19 spread through communities contributing to sewersheds of various sizes (WRF, 2020f). In October 2020, WRF named the University of California at Irvine as the recipient of $300,000 for a study titled “Understanding the Factors that Affect the Detection and Variability of SARS-CoV-2 in Wastewater” (WRF, 2020g). Using wastewater samples (sewage and septage) collected in Los Angeles County and analyzed for SARS-CoV-2, the research team is developing recommendations for optimal sample design at three different scales: large urban sewersheds, medium-sized regional sewersheds, and small regional systems (WRF, 2020h). Funding for this project was provided by WRF as well as the Bill and Melinda Gates Foundation, and work is anticipated to be completed in 2021 (WRF, 2020h).
WRF has also funded at least one other study related to wastewater monitoring for SARS-CoV-2. In September of 2019, WRF awarded $295,000 to the University of Notre Dame to evaluate the persistence and disinfection of Lassa virus in WWTPs (WRF, 2020i). The scope was later expanded to include SARS-CoV-2. The goal of this study is to develop a user-friendly model capable of estimating environmental releases and worker exposures to these two viruses to help prepare the wastewater industry for the next epidemic or pandemic. Work is anticipated to be completed in 2022 (WRF, 2020i).
4.6 Water Environment Federation WEF has entered into a cooperative agreement with CDC to support CDC in providing information on SARS-CoV-2 guidance to the water and wastewater utility sector, which comprises the majority of WEF’s membership. WEF is developing a network for information sharing within the sector. The Network for Wastewater-based Epidemiology will host the utility community of practice for wastewater surveillance (WEF, 2021b). In addition, WEF will provide training on wastewater surveillance to utilities and public health personnel (WEF, 2021a). WEF is also working with CDC to evaluate use of wastewater surveillance in correctional facilities as a supplement to case surveillance data and as a possible early warning for COVID-19 in these facilities. For this effort, WEF will be working with multiple states, the first of which is Oklahoma (WEF, 2021c).
4.7 Other Funding Opportunities Beyond funding opportunities through federal agencies and non-governmental organizations, wastewater surveillance programs are utilizing funds from private foundations, existing program funding, and pro-bono resources. Two examples of private foundations funding wastewater surveillance programs or research on SARS-CoV-2 analytical methods include:

A Compendium of U.S. Wastewater Surveillance for COVID-19 Public Health Efforts
20
The Bill and Melinda Gates Foundation, which provided almost $390,000 to the California Institute of Technology to develop a rapid quantification method for detecting SARS-CoV-2 in wastewater (BMGF, 2021).
The Foundation for a Healthy Kentucky, which provided funding to pay for the equipment needed to analyze wastewater samples collected from the Mayfield WWTP for SARS-CoV-2, as part of a larger $60,000 project. The project team includes Graves County Health Department, Mayfield Electric and Water Systems, Murray State University, and the University of Louisville (Healthy KY, 2020).
Some wastewater surveillance programs were supported by funds from other existing programs. For example, Hampton Roads Sanitation District (HRSD) used available funds from ratepayers to conduct SARS-CoV-2 wastewater sampling and analysis (see case study in Section 6.2.6 for additional details) (HRSD, 2021b). Wyoming also reprogrammed existing funding they received from CDC’s ELC to support their wastewater surveillance program (see case study in Section 6.2.5) (Wyoming, 2021).
An example of pro-bono wastewater surveillance support comes from BioBot Analytics. BioBot initiated a nationwide pro-bono wastewater sampling and analysis program in April 2020 to help establish their SARS-CoV-2 testing protocols and expand wastewater surveillance efforts. From March 25 through May 31, 2020, BioBot Analytics received over 1,800 wastewater samples from 360 WWTPs across 43 U.S. states and Canadian providences (Biobot, 2020). Results highlighted the utility of wastewater surveillance as an early warning of a potential COVID-19 outbreak. For example, wastewater data from New Castle County, Delaware, spiked between three and seven days before a spike in COVID-19 cases was identified through individual testing (BioBot, 2020). Biobot was able to quickly develop this program by leveraging some of their previous work monitoring wastewater for opioids.

A Compendium of U.S. Wastewater Surveillance for COVID-19 Public Health Efforts
21
5 Program Development Numerous international efforts have demonstrated that wastewater surveillance can be used to detect outbreaks of other viruses (e.g., poliovirus, norovirus) earlier than through clinical surveys (Brouwer et al., 2018; Deshpande et al., 2003; Ivanova et al., 2019; Kazama et al., 2017; Lago et al., 2003). At the start of the COVID-19 pandemic, researchers and practitioners needed to quickly develop and/or adapt analytical methods, sample collection procedures, and data interpretation approaches specific to SARS-CoV-2. Much of this work began in early 2020 with collaborative efforts among international experts from utilities; universities; and local, state, and federal governments. Many of these efforts were held virtually and recorded for future reference. As the science rapidly evolved, teams leading surveillance programs throughout the United States and in other countries continually learned from one another via frequently revised online forums that documented research findings, lessons learned, best practices, guidelines, and recommendations.
As the field continued to evolve over the past year, new technologies emerged that improved the speed and accessibility of wastewater testing and analysis for implementation at various scales. Over time, multiple analytical methods and program frameworks were proven successful and were shared widely across the wastewater surveillance community. The field has matured by having reliable methods, programs, safety measures, and ethical considerations, many of which are being constantly refined and updated with the latest research and information. This section discusses some of the key areas of program development.
5.1 Peer-to-peer Communication and Resource Sharing Early in the COVID-19 pandemic, there were few guidelines and recommendations available on sampling and analysis methods for SARS-CoV-2 in wastewater. The global research community worked in partnership to build upon established protocols for waterborne enteric viruses and further progress the field of wastewater surveillance. This international collaboration among experts was a crucial step in the success of wastewater surveillance programs for SARS-CoV-2 during the pandemic. Federal, state, tribal, and local agencies; utilities; universities; and other groups have all participated in and benefited from the continued collaborative spirit and partnership across the field. Some of these efforts are discussed below.
5.1.1 Workshops and Trainings WRF released a 42-question survey via emails campaigns, LinkedIn, Instagram, Twitter, and Facebook from April 16–24, 2020, to gather information on sampling design (e.g., locations, frequency, composite vs. grab, shipping, storage), sample processing (e.g., preliminary treatment, concentration, purification), extraction, detection, sample volume requirements, and analytical methods validation and controls (Zhou et al., 2020). WRF used the results from the survey to inform the content for their virtual multi-day International Water Research Summit on COVID-19 held in late April 2020. WRF convened over 50 international experts from utilities, academia, consulting, and government to advance the work researchers were performing throughout the world (WRF, 2020a). The International Water Research Summit included discussions on the following topics in an effort to identify best practices and recommended approaches:
Sample collection and preservation Analytical methods for identifying SARS-CoV-2 in wastewater SARS-CoV-2 concentrations in wastewater in comparison to community COVID-19 cases

A Compendium of U.S. Wastewater Surveillance for COVID-19 Public Health Efforts
22
Communication of results
During the International Water Research Summit, participants also developed a “near-term research roadmap” that identified critical knowledge gaps requiring immediate research (WRF, 2020a). Participants categorized the necessary research into four themes: (1) analytical methods variability, reproducibility, and reliability; (2) viral shedding rate of SARS-CoV-2 in feces and the associated genetic signal; (3) interpretation of results to support public health efforts; and (4) risk assessment of potential exposure pathways for wastewater workers (WRF, 2020j). Participants also identified 12 research opportunities to advance wastewater surveillance for SARS-CoV-2 across these themes, as shown in Table 4 (WRF, 2020j). Based on these findings, WRF sought funding partners and began soliciting applications for qualified organizations to conduct research on these topics. See Section 4.5 for details on some of the projects WRF funded.
Table 4. Research opportunities identified by WRF to support wastewater surveillance of SARS-CoV-2 (WRF, 2020j).
Priority Theme Research Opportunity
High Methods Intra- and interlaboratory assessments on sampling regimes and molecular methods.
High Shedding rate and genetic signal Effect of wastewater pre-treatment on genetic signal.
High Shedding rate and genetic signal
Dilution and persistence of the genetic signal in the sewer collection system. Targeted integrated study (in well-characterized systems that have good hydraulic models).
High Risk Evaluation of potential for infectious virus in wastewater and generation of aerosols.
High Interpretation of results
Correlations to clinical data for the assessment of community prevalence. How to leverage wastewater surveillance to provide useful data to public health stakeholders.
High Interpretation of results Define partnership opportunities.
High Shedding rate and genetic signal
Viral shedding rate, duration, and demographics in symptomatic and asymptomatic infections (RNA copies per gram of feces).
Medium Methods Impacts of sample collection method (composite vs. grab, duration of composite, time of day).
Medium Methods Distribution of virus (or RNA copies) in liquid and solid phase.
Medium Interpretation of results
How to effectively translate COVID-19 research into pandemic preparedness and wastewater surveillance for future needs.
Low Methods Which spike organism to use for quality assurance/quality control purposes.
Low Methods Comparative methods review for enveloped viruses, focusing on the concentration from wastewater matrix.

A Compendium of U.S. Wastewater Surveillance for COVID-19 Public Health Efforts
23
WRF continues work on wastewater surveillance and most recently in April 2021 held a second International Symposium on COVID-19 Wastewater Surveillance (WRF, 2021a).
As another example, the National Institute of Standards and Technology (NIST) held a virtual workshop in June 2020 to discuss challenges with measuring and detecting SARS-CoV-2 in wastewater with five expert presenters.5 The main goals for the workshop included discussing the merits of applying NIST’s expertise in producing standards and reference materials to the most pressing monitoring issues (NIST, 2020).
Tailored to applying surveillance on a more local level, NACCHO and CDC hosted a webinar in June 2020 titled “Water, Sanitation, and Hygiene During the COVID-19 Pandemic” (NACCHO, 2020a; NACCHO, 2020b). The webinar featured three speakers, two from CDC and one from a local health department.6 The topics included general information on proper cleaning and disinfection, minimizing risk of Legionella in drinking water before reopening unoccupied buildings, options for disaster shelters, along with wastewater surveillance for SARS-CoV-2. Panelists reviewed sampling and analysis techniques for wastewater testing of SARS-CoV-2, discussed the benefits of early detection of SARS-CoV-2, and raised concerns regarding common misconceptions about the field (e.g., the virus is always infectious in sewage) (NACCHO, 2020a; NACCHO, 2020b). NACCHO included wastewater surveillance for SARS-CoV-2 as one of the sessions in their Preparedness Summit annual conference in April 2021 (NACCHO, 2021).
5.1.2 Online Platforms In addition to collaboration through workshops and webinars, the wastewater surveillance community has developed numerous interactive online resources. One example is the COVIDPoops19 dashboard, created and managed by the University of California at Merced. This dashboard provides a global map of reported SARS-CoV-2 wastewater surveillance efforts, including the number of public dashboards, universities, countries, and surveillance programs (referred to as testing sites), all of which is updated daily. For each identified program, the dashboard provides a link to the program website, relevant news articles, and/or associated publications for the surveillance program (UC Merced, 2021). The University of California at Merced published the methods for developing the COVIDPoops19 dashboard (Naughton et al., 2021).
As of early May 2021, the COVIDPoops19 dashboard includes 80 dashboards, 256 universities, 54 countries, and 2,216 surveillance programs, as shown in Figure 2 (UC Merced, 2021). This dashboard is part of the larger COVID-19 WBE Collaborative that encourages partnership and discussions among those in the wastewater surveillance field (COVID-19 WBE Collaborative, 2021). The COVID-19 WBE Collaborative website provides a list of resources, including a COVID-19 WBE Slack workspace that is an organized web-based channel for groups to collaborate and talk about their programs; a Protocols.io group that houses information on sample collection techniques, analytical methods, quality control, and results interpretation; and a link to the website for Research Coordination Network on wastewater surveillance. The Research Coordination Network website, funded by NSF and designed by researchers from the University of Notre Dame, Howard University, Stanford University, and Arizona State University, offers networking opportunities to increase collaboration among wastewater surveillance programs (University of Notre Dame, 2021). Information is provided through webinars, workshops,
5 Bharat Ramakrishan, OpenBiome; Manoj Dadlani, CosmosID; Katerina Papp, Southern Nevada Water Authority; Dr. Kyle Bibby, University of Notre Dame; and Aparna Keshaviah, Mathematica. 6 Amy E. Kirby, PhD, MPH, CDC; Jasen Kunz, MPH, CDC; Rob Blake, MPH, Transylvania County Department of Public Health.

A Compendium of U.S. Wastewater Surveillance for COVID-19 Public Health Efforts 24
training videos, and links to other resources (e.g., open data repositories) (see additional details on this NSF project in Section 4.1).
Figure 2. COVIDPoops19 dashboard (UC Merced, 2021).
Another example of an interactive online resource is the international Water Action Platform, created and managed by Isle Utilities and supported by various sponsors. While the platform was initiated in March of 2020 in response to the COVID-19 pandemic, it has since expanded to cover a wide range of wastewater-related topics (e.g., asset management, communications, sustainability). The Water Action Platform encourages peer-to-peer collaboration by hosting regular webinars to share lessons learned and best practices from utilities around the world, summarizing news updates and press releases, and supporting a series of “knowledge hubs” via WhatsApp. As of September 2020, more than 1,300 people from 758 organizations across 92 countries are participating in the Water Action Platform (Water Action Platform, 2021).
WEF is also compiling articles, research, news updates, and links to other sites for up-to-date information on best practices for wastewater surveillance on a weekly basis. WEF’s coronavirus website breaks out resources into sections by topics such as vaccine resources, water sector–specific information, training and education resources, and water sector coronavirus assistance. The water sector–specific information includes recent articles, podcasts, webcasts, and fact sheets that were published by WEF or other sources (WEF, 2021d). WEF has also developed a Network of Wastewater-Based Epidemiology website focusing on U.S. utilities performing wastewater surveillance. As of May 13, 2021, WEF’s dashboard included 517 utilities, 159 academic institutions, eight laboratories, and one other program performing or supporting wastewater surveillance programs, as shown in Figure 3 (WEF, 2021b).

A Compendium of U.S. Wastewater Surveillance for COVID-19 Public Health Efforts
25
Figure 3. Utilities performing wastewater surveillance in the United States (WEF, 2021b).

A Compendium of U.S. Wastewater Surveillance for COVID-19 Public Health Efforts
26
5.2 Researching and Developing Analytical Methods Beginning early in the COVID-19 pandemic, many federal agencies, state agencies, non-governmental stakeholders, and the academic research community worked both independently and together to quickly develop and refine methods to support wastewater surveillance for SARS-CoV-2. This section presents several examples of such efforts.
Laboratory analytical methods for the detection of SARS-CoV-2 RNA in wastewater have continually evolved based on new science and resources. The NWSS website (CDC, 2021a) outlines commonly used wastewater surveillance methods for:
Sample preparation (e.g., storage, homogenization, sample clarification).
Sample concentration (e.g., ultrafiltration, polyethylene glycol precipitation, ultracentrifugation).
RNA extraction. SARS-CoV-2 RNA detection and
quantification (e.g., RT-qPCR and reverse transcription digital droplet PCR [RT-ddPCR]).
CDC has also developed an online resource that lists reverse transcription PCR (RT-PCR) primers and probes for two N gene assays of SARS-CoV-2, last updated in June 2020 (CDC, 2020e). The APHL has compiled a list of selected COVID-19 molecular testing resources for individual testing and their key characteristics (e.g., test name, manufacturer, complexity, testing throughput capacity) (APHL, 2020). APHL also provides a downloadable Excel file summarizing a longer list of test methods for individual testing, with additional details on performance and limits of detection (APHL, 2021a), and a dashboard summarizing laboratory testing capacity and capabilities based on results of a weekly survey of 99 state, local, and territorial health laboratories, focusing on individual testing (APHL, 2021b). While the APHL resources are focused on individual testing, some of the information may be useful to consider for wastewater samples (e.g., buffer supply limitations). One example of a common laboratory analytical method is that developed by IDEXX Reference Laboratories. IDEXX developed a novel, highly sensitive RT-qPCR test to detect N1 and N2 gene targets of SARS-CoV-2 (IDEXX, 2021).
In the summer of 2020, NIST developed reference materials consisting of synthetic fragments of the SARS-CoV-2 virus RNA to aid in the analysis and development of RT-qPCR assays for SARS-CoV-2 (360dx, 2020; NIST, 2020). Researchers and laboratories can use the reference materials to assess detection limits for SARS-CoV-2 assays or calibrate other in-house or commercial SARS-CoV-2 controls. This allowed researchers and laboratories to further refine their analytical methods for SARS-CoV-2. NIST provided the reference material free of charge through funding from the CARES Act in exchange for user feedback to further improve and develop the materials (360dx, 2020; NIST, 2020). NIST is continuing to work with the DHS Science and Technology Directorate and the University of Louisville School of Medicine to further develop and refine reference materials and standards for quantifying SARS-CoV-2 with RT-qPCR assays, which will allow for additional development in the
SARS-CoV-2 RNA Measurement Methods Once the SARS-CoV-2 RNA is extracted from the wastewater sample, laboratories quantify the amount of RNA using RT-qPCR, RT-ddPCR, or other less common forms of RT-PCR. The viral RNA is enzymatically transcribed to complementary deoxyribonucleic acid (cDNA) in a process called reverse transcription (RT). The cDNA is then used in a second enzymatic reaction (PCR) to make many copies of a small fragment of the transcribed viral RNA. RT-PCR (qPCR or ddPCR) can occur in two steps, where these enzymatic reactions take place sequentially in separate tubes, or as a one-step reaction where the two enzymatic processes occur in sequence in the same tube (CDC, 2021f).
SARS-CoV-2 N Gene Targets There are two distinct assays targeting the SARS-CoV-2 nucleocapsid gene, N1 and N2, that can be measured using RT-qPCR or RT-ddPCR (CDC, 2021f).

A Compendium of U.S. Wastewater Surveillance for COVID-19 Public Health Efforts
27
analytical methods (DHS, 2021). The new standards will allow SARS-CoV-2 wastewater surveillance results to be more readily shared and compared across surveillance programs, which will in turn inform more useful healthcare decisions (DHS, 2021).
As mentioned in Section 4.5, WRF funded several studies to further advance the wastewater surveillance field based on research needs identified at their International Water Research Summit (WRF, 2020h; WRF, 2020e). One such study was a methods assessment and interlaboratory comparison of wastewater results for SARS-CoV-2, in which WRF assessed the reliability of various SARS-CoV-2 testing methods to produce accurate and repeatable results (WRF, 2020c). For this, WRF invited laboratories to participate and analyze the same composite samples using their own analytical methods. The study ultimately compared distinct RNA extraction and quantification methods used at 32 U.S.-based laboratories, which included a combination of commercial; city, state, and federal government; academic research; and wastewater utility laboratories, as well as some commercial manufacturers. Study results provided critical information on the performance of various methods and their use when conducting laboratory analyses for wastewater surveillance studies and programs. The results are summarized in an executive summary available on WRF’s website and a journal article (WRF, 2020k; Pecson et al., 2021).
In addition to WRF’s interlaboratory comparison, in June 2020, EPA’s Office of Research and Development (ORD) began researching and developing a method for concentrating and then quantifying the amount of SARS-CoV-2 virus in wastewater using samples from WWTPs in Ohio (see Section 6.2.4 for details on Ohio’s wastewater surveillance program). Some of ORD’s research also evaluated the ability to concentrate and detect a surrogate coronavirus called OC43 from larger sample volumes of wastewater (McMinn et al., 2021). EPA is continuing research on applying this approach to detect SARS-CoV-2 and developing culture-based methods to detect SARS-CoV-2 in wastewater, similar to the culture-based methods for detecting coliforms where bacteria grow on media. EPA has also collaborated with Australia’s Commonwealth Scientific and Industrial Research Organization on several review and research activities on SARS-CoV-2 wastewater surveillance ranging from sampling design (Ahmed et al., 2021), stability of molecular targets (Ahmed et al., 2020a), and recoveries using surrogate coronavirus (Ahmed et al., 2020b). All these research activities further support the refinement of SARS-CoV-2 wastewater methods, with a long-term goal of developing “sensitive, standardized methods to detect and quantify SARS-CoV-2 in raw sewage, including infectious virus” (EPA, 2021).
Other laboratory quantification methods have since evolved to allow experts and nonexperts alike to quickly extract viral RNA from wastewater and quantify viral RNA in the field rather than in a laboratory setting, potentially offering same-day SARS-CoV-2 wastewater results. For example, LuminUltra—in collaboration with Halifax Water and Dalhousie University Halifax, Nova Scotia—created a portable and rapid SARS-CoV-2 wastewater testing solution. This new technology is described by the company as being able to run multiple samples within 90 minutes, without the need for extensive laboratory expertise (LuminUltra, 2020; LuminUltra, 2021). LuminUltra’s quantification kit and others, such as those developed by BioRad, QIAGEN, and Zymo, have been developed to support cost-effective and rapid expansion of wastewater testing methods for SARS-CoV-2 (Bio-Rad, 2021; Qiagen, 2021; Zymo, 2021).
In early 2021, the research community also began exploring methods for detecting and quantifying SARS-CoV-2 variants (e.g., the United Kingdom variant, B.1.1.7 [Alpha]; the South African variant, B.1.351 [Beta]). This work is being done through genomic sequencing of wastewater samples and the development of primers and probes capable of detecting individual mutations that characterize specific variants via RT-qPCR. Some examples are Rice University sequencing the whole SARS-CoV-2 genome (see Houston Case Study in Section 6.2.7) and Clemson University quantifying the B.1.1.7 in the wastewater (see Clemson University Case Study in Section 6.2.9) (Houston, 2021; Clemson, 2021b).

A Compendium of U.S. Wastewater Surveillance for COVID-19 Public Health Efforts
28
5.3 Ongoing Wastewater Surveillance Support As the field of SARS-CoV-2 wastewater surveillance continues to grow, organizations have developed and shared best practices and guidance with their stakeholders. The organizations include large international groups, such as the World Health Organization (WHO) that published recommendations on the ethics of wastewater surveillance, to smaller nonprofits such as WEF that published safety information for WWTP workers. This section describes the work of organizations like these that have or are providing ongoing support for wastewater surveillance.
Various federal agencies have contributed to the field of SARS-CoV-2 wastewater surveillance on a national level. For example, and as described in Section 4, CDC and HHS, in collaboration with other federal agencies, established the NWSS in September 2020 to, in part, provide support and coordination for wastewater surveillance of SARS-CoV-2. The NWSS website offers technical support for sampling methods (e.g., location and frequency), laboratory methods, and public health interpretation of wastewater testing data (CDC, 2021a). The NWSS DCIPHER platform is a national database of wastewater testing results for SARS-CoV-2 collected by state, tribal, local, and territorial health departments in coordination with wastewater utilities. Data are submitted to NWSS through the DCIPHER platform by state, tribal, local, and territorial health departments using a standard collection instrument that defines the minimum set of reporting guidelines (CDC, 2021a). CDC analyzes the data submitted to the system in real time and reports results to health departments via the DCIPHER data reporting analytics dashboard (CDC, 2021a).
The NWSS DCIPHER analytics system corrects wastewater testing results for laboratory method performance, as well as the composition of wastewater and the number of people living in the community under surveillance—ensuring comparability across labs, across communities, and through time (WRF, 2021a). The data reporting dashboard presents maps of WWTPs sewersheds under surveillance, time series plots of wastewater results, and information on SARS-CoV-2 trend status (e.g., sustained increase, increasing, plateaued, decreasing, sustained decrease) at each sampling location for use by public health departments (WRF, 2021a). A screen shot of part of the data reporting dashboard is shown in Figure 4 (CDC, 2021g). As of the end of August 2021, SARS-CoV-2 wastewater results for almost 20,000 samples have been submitted to NWSS (see Figure 5) (CDC, 2021g).
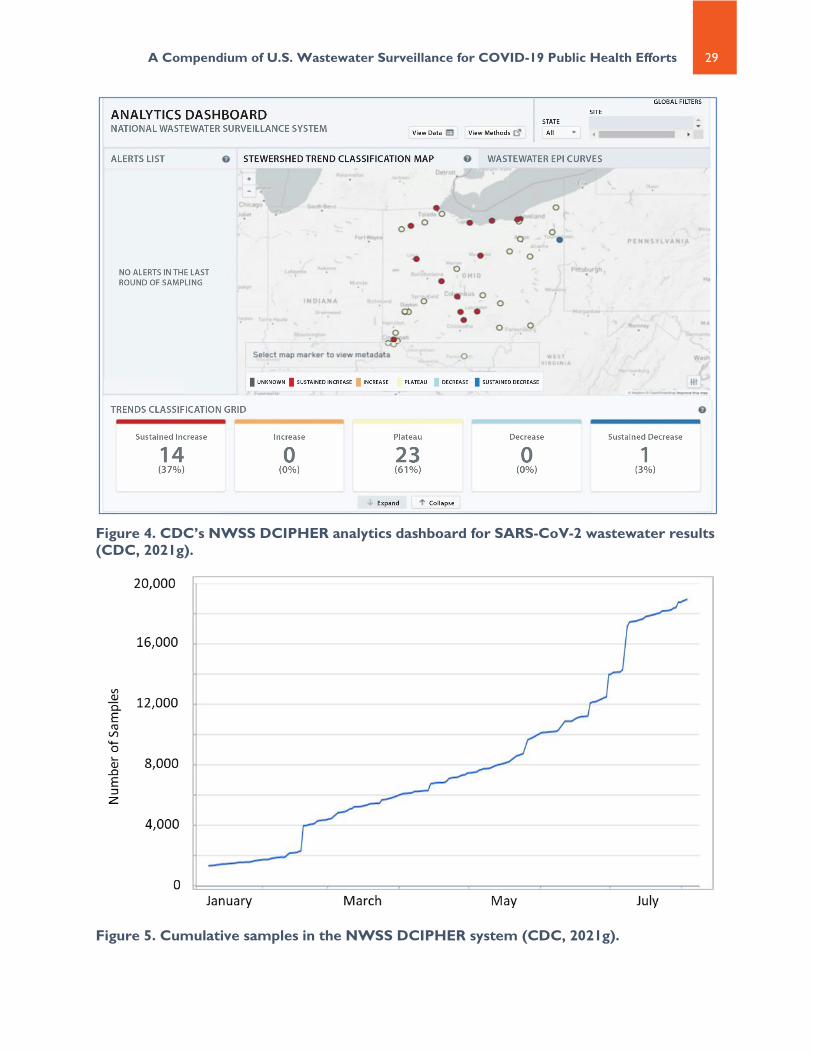
A Compendium of U.S. Wastewater Surveillance for COVID-19 Public Health Efforts
29
Figure 4. CDC’s NWSS DCIPHER analytics dashboard for SARS-CoV-2 wastewater results (CDC, 2021g).
Figure 5. Cumulative samples in the NWSS DCIPHER system (CDC, 2021g).

A Compendium of U.S. Wastewater Surveillance for COVID-19 Public Health Efforts
30
As mentioned in Section 4.4, HHS (with support from CDC) funded wastewater testing from WWTPs serving 10 percent of the U.S. population (estimated at 100 WWTPs) in late 2020 for a period of six weeks. HHS is continuing to support this nationwide pilot study to test the scalability of an early warning system and public health response framework through a second phase that is anticipated to cover 30 percent of the U.S. population. The results of this work are especially relevant in smaller communities with the potential for underfunded individual testing programs that may be underreporting cases of COVID-19 (CNBC, 2020).
As mentioned in Section 4.5, WRF funded a research project to develop specific implementation and sample design recommendations at different types of sewersheds: large urban sewersheds, medium-sized regional sewersheds, and small regional systems (WRF, 2020h).
On a more local level, multiple organizations have and continue to provide general guidance about sampling and analysis methods to support programs. For example, in June of 2020, the National Association of Clean Water Agencies (NACWA) released a guidance document for utilities to aid in the development of wastewater surveillance programs for SARS-CoV-2. The document is based on lessons learned from NACWA member utilities who were already sampling for SARS-CoV-2 in wastewater. NACWA’s document includes a recommendation for utilities to engage and work with their local and/or state health departments for the wastewater surveillance program. NACWA prepared this document in response to concerns that SARS-CoV-2 wastewater surveillance and communication of results are outside the purview of a wastewater utility; however, utilities are receiving requests to conduct surveillance from community members, private companies, and other organizations. Utilities were also concerned about assessing costs and data validation since there is no consistent analytical method. NACWA indicated that the resource is a “living document” and will be updated as guidance and information evolves (NACWA, 2020).
As another example, the Environmental Research Institute of the States and ASTHO, under a Memorandum of Agreement with EPA ORD, published an issue brief on the detection of SARS-CoV-2 in wastewater in November 2020. This brief summarizes early studies conducted by states, identifies research gaps, outlines common practices for collecting wastewater samples (e.g., sample location, type, and frequency; documentation; analytical methods; reporting), and provides recommendations to scientists and public health and environmental officials moving forward (ERIS and ASTHO, 2020).
Based on lessons learned at their April 2020 International Water Research Summit, WRF has shared multiple resources for surveillance programs. One such document is a detailed summary of recommendations from global experts that participated in the International Water Research Summit, covering “potential uses of wastewater surveillance for tracking COVID-19, sampling design, analytical tools, and communication of results to public health decision-makers, the public, and other key stakeholders” (WRF, 2020j). WRF also published an appendix on best practices for sample collection and storage and developed a field sample collection form that outlines the information that should be recorded during sample collection (e.g., wastewater flow rate, type of sewer system, air temperature, sample water characteristics such as temperature, total suspended solids, chlorine residual, pH) (WRF, 2020l). The field collection form also provides space to record information about sample storage and processing at the laboratory (e.g., temperature of sample upon receipt at the laboratory). WRF’s website includes links to their press releases on current projects and funding opportunities (WRF, 2021b).
5.4 Inclusion of Rural and Underserved Populations As wastewater surveillance efforts expanded across the country, federal, state, tribal, and local agencies and other non-governmental stakeholders have recognized the importance of selecting sites with
A Compendium of U.S. Wastewater Surveillance for COVID-19 Public Health Efforts
31
consideration for potential vulnerabilities of the community (e.g., at-risk populations, rural areas, communities underserved by health care systems). Ohio’s COVID-19 Populations Needs Assessment acknowledged that COVID-19 would likely disproportionally impact people of color, rural populations, and individuals with disabilities since these groups already deal with less access to healthcare and more negative social determinants of health than others (Nemeth et al., 2020). Wastewater surveillance can provide insight into COVID-19 spread without biases that may be associated with individual testing, such as race, economic status, age, testing site hours and locations, and many other factors.
For example, NEHA published an article outlining the benefits and best practices of wastewater surveillance in rural areas. The article, "Sewage Monitoring in Rural Communities: A Powerful Strategy for COVID-19 Surveillance," explains how wastewater surveillance is a strong supplement to individual testing programs in these areas because rural and underserved areas face challenges for detection and management of the outbreak. As an example, individual testing may not be feasible or cost-effective in these areas, and wastewater surveillance can provide greater coverage and broader detection in smaller towns. However, the article notes that wastewater surveillance in rural communities may be challenging due to the number of people (estimated at 20 percent) that live in areas without WWTPs and instead use septic systems. Additionally, rural areas may not have trained individuals to conduct the sampling and perform the laboratory analyses, so the article suggests rural wastewater surveillance will require coordination between WWTPs, laboratories (commercial and academic), and public health departments (NEHA, 2020).
One thing to consider when establishing wastewater surveillance programs is the number of people contributing to the wastewater. If the population is too small, robust individual testing and contact tracing programs may be more effective at evaluating the spread of COVID-19 than wastewater surveillance. However, if individual testing and contract tracing are not available, then wastewater surveillance may be useful for public health officials.
Multiple case study programs considered vulnerable and underserved communities when creating or executing the sampling program. The Ohio wastewater surveillance program prioritized sampling at WWTPs that service large and/or vulnerable populations. The previously mentioned vulnerability report that ODH and Ohio State University developed strongly guided Ohio’s sampling site selection (Ohio, 2021; Nemeth et al., 2020). Other programs used community relations to institute public health measures more effectively within vulnerable populations. Tempe, Arizona partnered with Guadalupe, Arizona, to monitor the Guadalupe’s wastewater, primarily comprised of low-income and minority families. The Mayor and City Council of Guadalupe used the wastewater results to enforce COVID-19 public health messaging and guide future decision-making. Tempe also created a multi-lingual door-to-door education campaign about COVID-19 and how to protect oneself while distributing masks and care packages for use for vulnerable populations within Tempe (Tempe, 2021d). The Houston Health Department (HHD) used the wastewater results to identify zip codes most in need of public health interventions and used leaders within the local communities to connect with residents. HHD’S community partnership was to conduct COVID-19 prevention outreach, such as scheduling appointments and organizing secure transportation to testing and vaccination sites more effectively to vulnerable and difficult to reach areas (Houston, 2021).
5.5 Ethical and Legal Considerations Beyond guidance for sampling and methods, the wastewater surveillance community has considered and developed guidance on related ethical concerns. The Canadian Water Network (CWN) convened experts in a Public Health Advisory Group to discuss public health application and communication and the ethical issues posed by wastewater monitoring (CWN, 2020a). The Canadian Water Network also

A Compendium of U.S. Wastewater Surveillance for COVID-19 Public Health Efforts
32
released ethics and communication guidance in September 2020, applying WHO’s guidelines on ethical issues in public health surveillance (WHO, 2017) to wastewater-based SARS-CoV-2 data (CWN, 2020b). WHO released a document in August 2020 outlining the uses of wastewater surveillance programs and considerations when creating a program, including ethical and legal considerations. WHO specifically addressed concerns about potential stigmatization of the community but also noted that wastewater surveillance would be less likely than individual testing to be stigmatizing due to the wastewater characteristic as a pooled sample. WHO also acknowledged that these concerns may be heightened because wastewater surveillance is often done without community consent. WHO cautioned programs to avoid disproportionately targeting already-stigmatized communities with public health and social measures (WHO, 2020). Researchers from multiple universities also published an academic paper on the legal and ethical considerations with wastewater surveillance (Gable et al., 2020).
5.6 Worker Safety Guidance has also been developed regarding utility worker safety when supporting wastewater surveillance efforts for SARS-CoV-2. For example, WEF compiled information about the viability of SARS-CoV-2 in wastewater and the related safety concerns for workers at the WWTP and throughout the collection system into a web-based “Water Professional’s Guide to COVID-19” (WEF, 2020a). This provides resources for safety based on the hierarchy of controls, the most effective control solutions for the most employees, and guidance from the Occupational Safety and Health Administration (WEF, 2020a). WEF also published a document titled “Protecting Wastewater Professionals from COVID-19 and Other Biological Hazards” based on the findings of an expert panel of academics and practitioners (WEF, 2020b). The document summarizes the most current, evidence-based information on protecting worker health and safety with respect to exposure to biological hazards associated with wastewater from agencies and authorities external to WEF, as well as the peer-reviewed literature. Occupational Safety and Health Administration also has recommended guidance for solid waste and wastewater management workers and employers during the COVID-19 pandemic (OSHA, 2020).

A Compendium of U.S. Wastewater Surveillance for COVID-19 Public Health Efforts
33
6 Implementation of Surveillance Programs
As wastewater surveillance for SARS-CoV-2 gained traction in the United States, many state and local agencies, utilities, and universities, along with a few tribal agencies, developed and implemented monitoring programs. Section 6.1 briefly summarizes publicly available information on programs initiated by 14 states and 161 tribes, municipalities, and universities. Details are provided for each program in Appendix A, with Table A-1 summarizing state programs and Table A-2 summarizing municipality and university programs. Section 6.2 provides additional information for a subset of ten diverse programs, gathered through open-ended interviews with program leads.
This discussion is not meant to serve as a comprehensive summary of all wastewater surveillance efforts across the country. EPA identified the programs in this document in January and February of 2021 through publicly available resources, such as the COVIDPoops19 dashboard (see Section 5.1), and by searching the internet for program websites, data dashboards, research papers, reports, news articles, and press releases that provided general information on SARS-CoV-2 monitoring programs (UC Merced, 2021). EPA included programs based on the amount of publicly available information found at the time. EPA recognizes that there are many other ongoing wastewater surveillance programs for SARS-CoV-2 at both the state and local level, including tribes. Refer to Section 3 for additional information on data collection methods.
6.1 Overview of Surveillance Programs Most early monitoring efforts for SARS-CoV-2 in wastewater focused on wastewater influent (i.e., untreated sewage that enters a WWTP). As wastewater monitoring gained traction throughout the pandemic, however, programs expanded to collect wastewater from sewer manholes, sewer lines, lift stations, and sewer cleanouts to target smaller isolated communities or specific facility populations (e.g., correctional facilities, long-term care facilities, K-12 schools). Universities also developed programs to monitor SARS-CoV-2 in sewage from student housing on campus, and in some cases, within the surrounding community. Universities were either able to quickly initiate programs by leveraging longstanding research programs that were already in place involving pathogens in wastewater (e.g., Michigan State University) or by pivoting from previous research and adapting their expertise to wastewater monitoring (e.g., Clemson University) (Michigan, 2021a; Clemson, 2021b). The Berkeley Water Center at the University of California Berkeley summarized the experience of 25 college and university wastewater surveillance programs in the United States from the Fall 2020 semester (Harris-Lovett et al., 2021). Many universities also provided laboratory support and technical expertise to local and state agencies (e.g., Rice University), as well as individual utilities (e.g., University of Arizona) (Houston, 2021; University of Arizona, 2021).
Wastewater surveillance programs have been implemented at the national, state, tribal, and local level using both commercial and academic research laboratories. At the national level, for example, Biobot Analytics initiated a nationwide pro bono sampling and analysis program in April 2020, and HHS started wastewater testing at 100 WWTPs across the country for a period of six weeks beginning in November 2020 (see Section 4) (BioBot, 2020; FPDS, 2021). HHS, with support from CDC, has also established a nationwide wastewater surveillance program evaluating SARS-CoV-2 in WWTP influent (see Section 4.4 for details). At the state level, many state health and environment departments have developed statewide surveillance programs (e.g., Ohio) or funded them on a more local level (e.g., Michigan) (Ohio DOH, 2020; Michigan, 2021b). Local agencies and individual utilities have initiated monitoring programs
A Compendium of U.S. Wastewater Surveillance for COVID-19 Public Health Efforts
34
as well, typically with funds from local government or ratepayers. In some cases, states and local government have worked together to execute programs (e.g., Vermont) (Burlington, 2021). In other cases, states worked directly with utilities (e.g., Indiana) (Indiana, 2020). Some wastewater surveillance programs receive support from consulting firms. For example, the wastewater surveillance program in Bergen County, New Jersey, is supported by AECOM and Columbia University (AECOM, 2020), while CDM Smith is supporting the U.S. Department of Veterans Affairs with their wastewater surveillance pilot project (CDM Smith, 2020).
Methods employed in early programs vary greatly with respect to sample location, sample type, frequency and time of collection, laboratory processing and analysis, and data interpretation. Regarding sample collection, the number of sampling locations varies from small, localized programs with less than ten unique sampling locations (e.g., Boise, Idaho; Burlington, Vermont) to larger statewide programs with upwards of 300 locations (e.g., Michigan) (Boise, 2021; Burlington, 2021; Michigan, 2021a). Sampling frequency similarly varies across programs, with most programs collecting samples once or twice weekly and a few collecting samples daily.
Wastewater samples are collected as either composite samples or one-time grab samples. While composite samples are often considered more representative of community fecal contributions, grab samples are sometimes advantageous since they can be collected quickly and at a much lower cost (CDC, 2021e). Composite samples are most frequently collected at the influent of WWTPs, while grab samples are collected when access is limited (e.g., no electric hookup) or there are security concerns at a given sampling location. In general, grab samples are collected in the morning hours when a greater percentage of the population is assumed to use the restroom, as indicated by the daily peak in wastewater flow. During the early months of the pandemic, automatic composite samplers were in limited supply and many programs had no choice but to collect grab samples. Depending on the program, samples are collected by utility staff, private contractors, or students.
State and local programs typically send wastewater samples to commercial or university laboratories for analysis, while most universities analyze their program samples in on-campus laboratories. In some cases, programs send samples to multiple laboratories as part of an interlaboratory comparison to validate and improve analytical methods. Several programs started by using a commercial laboratory and then later switched to a local university or state laboratory to decrease costs and reduce turnaround time between sample collection and receiving the results (e.g., Boise, Idaho; Houston, Texas) (Boise, 2021; Houston, 2021). Most programs analyze their wastewater samples with RT-qPCR, while a smaller percentage rely on the RT-ddPCR method. A handful of programs use both technologies. Programs typically analyze samples for both the N1 and N2 gene targets of SARS-CoV-2, while several also analyze fecal indicator organisms such as the pepper mild mottle virus.
Many state, local, and university wastewater surveillance programs communicate their results to the public in real time through the use of online data dashboards. Several have also produced more detailed summary reports (e.g., Indiana) (IFA, 2020) or published their methods and preliminary results in peer-reviewed journals (e.g., HRSD in Virginia) (Indiana, 2020; Gonzalez et al., 2020).7 Within these
7 As of February 2021, many articles on this topic are only available in preprint version and have therefore not yet been certified by a formal peer review process.
Sample Collection Types Grab samples consist of a single discrete sample that is representative of the wastewater at the time of collection.
Composite samples are collected over time to represent the average wastewater over that time. A common composite sampling approach is to collect a set volume every 15 minutes for 24-hours using a programmed automatic composite sampler (EPA, 2013).

A Compendium of U.S. Wastewater Surveillance for COVID-19 Public Health Efforts
35
resources, programs present the concentration of the virus measured in wastewater (e.g., “genome copies/liter [L]”), normalized virus concentrations (e.g., normalized by population size, wastewater flow), or both concentrations. Normalized concentrations are used to account for changes in wastewater dilution (e.g., due to water other than wastewater entering the sewer system) and differences in relative human waste input over time (CDC, 2021e).
One common design for public dashboards used by multiple jurisdictions is to have a map showing the location of the WWTPs that are sampled along with geographic boundaries of the collection system served by each WWTP. Users can then click a specific sampling location to view a line graph of virus concentrations measured in wastewater through time. Some dashboards also present individual COVID-19 testing results, either as a separate graph (e.g., Utah, Wisconsin, Colorado) or overlaid with the wastewater data (e.g., Ohio) (Utah DEQ, 2021; Wisconsin DOHS, 2020; Colorado DPH, 2021; Ohio DOH, 2020). This allows users to compare trends between SARS-CoV-2 wastewater results and COVID-19 case counts based on individual testing.
Boise, Idaho, is one example of a city with a public dashboard that displays wastewater testing results along with individual COVID-19 testing results. Boise has been sampling and testing influent to its two WWTPs since May 2020. Boise presents the average of the daily SARS-CoV-2 wastewater results from the two WWTPs (weighted based on the WWTP’s flow) on their data dashboard, as presented in Figure 6. The top graph shows the wastewater results in virus copies/L and the bottom graph shows new cases of COVID-19 over the same timeframe for the entire county (Boise, 2021).
In some cases, dashboards indicate recent trends in wastewater results either with descriptive text or with a specific symbol or color on their sampling location maps. One example is the Utah SARS-CoV-2 Sewage Monitoring Program, which collects samples weekly at 42 WWTPs representing approximately 80 percent of the state’s population. Utah’s dashboard includes a map depicting each WWTP’s service area with color-coded symbols to indicate the recent sewage trend based on the virus concentrations from the four most recent samples (see Figure 7). Utah combines wastewater flow and service area population data to estimate viral concentrations in units of SARS-CoV-2 gene copies per person, per day, for each WWTP, shown in the top graph. Utah’s dashboard also shows the daily new cases per 100,000 residents for each WWTP sewershed, shown in the bottom graph (Utah DEQ, 2021).
Various other state, local, and university programs have started to define trends in wastewater data, albeit using different methods. The Wisconsin COVID-19 Wastewater Surveillance dashboard shows a map of the WWTP service areas along with wastewater SARS-CoV-2 results presented in gene copies per person, per day, along with the seven-day average COVID-19 case rate for the sewershed for each of the 65 participating WWTPs (as of April 2021). Wisconsin defines trends in SARS-CoV-2 concentrations and individual COVID-19 testing results using a linear regression model and the most recent two weeks of data. Increasing trends are when the change from the prior seven-day period to the most recent seven-day period is greater than or equal to 10 percent and statistically significant (Wisconsin DOHS, 2021). The Ohio Coronavirus Wastewater Monitoring Network dashboard compares the average of the most recent two samples with the average of the prior third and fourth sample to determine the percent change between those averages; less than 50 percent change is defined as stable, 50 to 100 percent change is defined as increasing or decreasing, and more than 100 percent change is defined as substantially increasing or decreasing (Ohio DOH, 2021). The Missouri Sewershed Surveillance Project’s COVID-19 Tracking Tool uses a story map to summarize wastewater data from more than 50 participating WWTPs. Missouri presents trends in the SARS-CoV-2 wastewater results over the past two weeks using map symbology (see Figure 8) (Missouri DHSS, 2021).
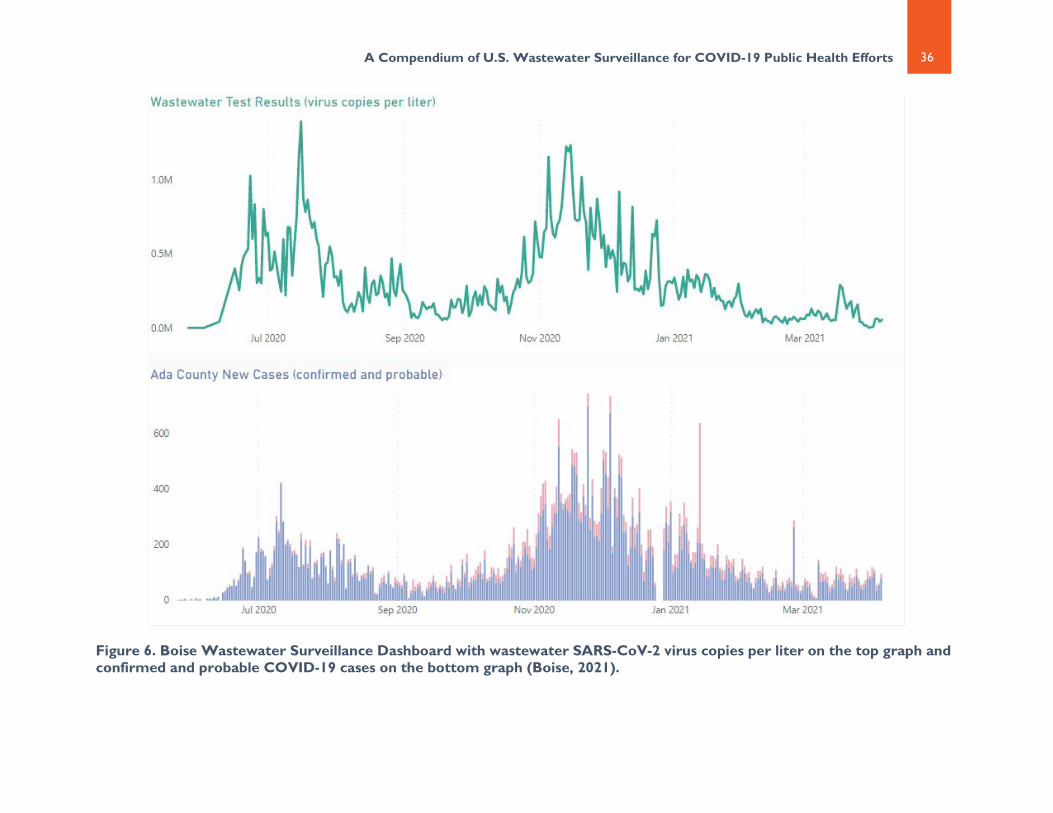
A Compendium of U.S. Wastewater Surveillance for COVID-19 Public Health Efforts
36
Figure 6. Boise Wastewater Surveillance Dashboard with wastewater SARS-CoV-2 virus copies per liter on the top graph and confirmed and probable COVID-19 cases on the bottom graph (Boise, 2021).

A Compendium of U.S. Wastewater Surveillance for COVID-19 Public Health Efforts
37
Figure 7. Utah SARS-CoV-Wastewater Surveillance Dashboard with the service are and recent wastewater trend on the left, SARS-CoV-2 million gene copies per person, per day on the top right graph, and daily new cases per 100,000 residents on the bottom right graph (Utah DEQ, 2021).

A Compendium of U.S. Wastewater Surveillance for COVID-19 Public Health Efforts
38
Figure 8. Missouri Department of Health and Human Services Wastewater Surveillance Dashboard with color coded symbols to indicate recent SARS-CoV-2 wastewater trends (Missouri DHSS, 2021).
A Compendium of U.S. Wastewater Surveillance for COVID-19 Public Health Efforts
39
Due to the recent emergence of SARS-CoV-2, there is no standardized way to predict the number of infected individuals reliably and accurately from wastewater sample results. However, some programs have used wastewater data to make predictions about the number of people with COVID-19 based on the SARS-CoV-2 wastewater results. For example, Yale University collects and analyzes daily wastewater samples for SARS-CoV-2 from seven WWTPs across Connecticut, covering nearly one million residents (Yale University, 2021b). For each participating WWTP, Yale graphs the wastewater SARS-CoV-2 results over time along with a seven-day moving average. Yale also graphs the available daily COVID-19 cases. For the most recent approximately two weeks Yale predicts the daily COVID-19 cases using the wastewater results. Yale replaces the predicted data with individual COVID-19 testing results as that information becomes available. Figure 9 presents an example of the graphs Yale generates for the Hartford South Meadows WWTP (Yale University, 2021a). Another example is summarized in the Wyoming case study in Section 6.2.5.
In some cases, wastewater surveillance programs have tied trends in wastewater data to events that occurred in the local communities where the wastewater samples are collected. For example, the University of Arizona consistently observed spikes in SARS-CoV-2 wastewater results collected from the WWTP a week after major events and holidays; when this occurred, they often saw similar spikes in individual COVID-19 cases the following week. The University of Arizona was also able to track the effectiveness of public health interventions through the wastewater sampling. For example, one week after Arizona issued the stay-at-home policy, the SARS-CoV-2 wastewater results decreased, with the individual COVID-19 cases decreasing the subsequent week (University of Arizona, 2021).
Some public-facing dashboards indicate events, like these, in an effort to help explain trends observed in SARS-CoV-2 measurements from wastewater. For example, the dashboard for Athens-Clarke County, Georgia, indicates significant events on the timeseries plot with vertical dashed lines. These dashed lines refer to events such as the day that Athens-Clarke County’s mask mandate was put into place, the first day of the fall semester at the University of Georgia, and the day of Georgia’s broad reopening (see Figure 10) (Lott et al., 2020).
In general, wastewater surveillance programs have been initiated to complement individual testing or to support more comprehensive surveillance for COVID-19 in areas with limited resources. Documented public health decisions triggered by or directly linked to wastewater monitoring results range from mask mandates to canvassing neighborhoods with educational materials. In some cases, wastewater data have served as an early warning of a potential COVID-19 outbreak, providing information ahead of individual testing data and allowing leadership to quickly intervene (e.g., increase individual testing to quarantine infected individuals, initiate targeted educational outreach efforts). This is most often seen at the local- or facility-level, where wastewater data represent smaller segments of the population (e.g., sub-sewershed monitoring) or a specific facility (e.g., correctional facility, university dorm). For example, in September 2020, the University of San Diego detected SARS-CoV-2 in wastewater from the Revelle College area. Within 14 hours of these results and out of an abundance of caution, the university sent targeted messages to members of the campus community to notify them of the results and to encourage them to get tested as soon as possible and monitor themselves for symptoms (UC San Diego, 2020). The university immediately expanded individual testing to enable campus employees and students to get tested over the following two days. The university tested more than 650 individuals and ultimately identified two positive cases. These individuals immediately self-isolated, potentially preventing a larger outbreak (Clark, 2020). Additional examples are provided in the case studies included in Section 6.2.

A Compendium of U.S. Wastewater Surveillance for COVID-19 Public Health Efforts
40
Figure 9. Yale University Wastewater Surveillance Dashboard – Hartford South Meadows WWTP serving Hartford, West Hartford, Newington, Bloomfield, and Wethersfield with SARS-CoV-2 wastewater results in copies per milliliter on the top graph and daily COVID-19 cases per 100,000 residents on the bottom graph (Yale University, 2021a).

A Compendium of U.S. Wastewater Surveillance for COVID-19 Public Health Efforts
41
.
Figure 10. Athens-Clark County Wastewater Surveillance Dashboard for one of the WWTPs (Lott et al., 2020).
Mask Mandate

A Compendium of U.S. Wastewater Surveillance for COVID-19 Public Health Efforts
42
6.2 Wastewater Surveillance Case Studies EPA conducted a series of interviews with a subset of practitioners and researchers leading wastewater monitoring efforts at the state and local level, as well as on university campuses. For this, and as described in Section 3, EPA focused on ten programs that demonstrate the wide variety of ways that programs were financed and implemented. The goal of this effort was to learn more about the diverse history and use of wastewater surveillance for SARS-CoV-2 among participants, including what prompted each initiative, initial and ongoing funding mechanisms, collaboration and organization with other entities, and sample collection and laboratory analytical methods. EPA also gathered insight on how wastewater data have been used to support decision-making and critical lessons learned along the way. EPA interviewed technical leads for the following wastewater surveillance programs listed in Table 5. These programs are also included in Appendix A summarizing the collaborations, sampling details, methods, and dashboards.
Table 5. Summary of case study wastewater surveillance programs.
Wastewater Surveillance Program Unique Aspects of the Program Highlighted in the Case Study
Stat
e P
rogr
ams
Indiana
The program was led by the Indiana Finance Authority (IFA). Participating utilities conducted sample collection at individual facilities and WWTPs. The program focused on communities with universities/colleges due to the transient nature of student populations and published a report documenting their decision-making process. See details in Section 6.2.1.
Michigan
The statewide program included 20 different projects led by various universities and utilities. It was built off the existing state laboratory network and workflow used to support the beach water monitoring program. See details in Section 6.2.2.
New Mexico
The program focuses sampling efforts entirely at individual facilities (e.g., correctional facilities, youth shelters). At some facilities, samples are collected at multiple locations that divide the facility into smaller resident populations. The state developed a public-facing dashboard summarizing results and published a press release highlighting a success story at a facility. See details in Section 6.2.3.
Ohio
The program involves large-scale collaboration between multiple state agencies, U.S. EPA ORD, and numerous universities. WWTPs are sampled throughout the state. The program involves an analytical methods group—which includes eight laboratories—to foster SARS-CoV-2 methods development. The state developed a public-facing dashboard that depicts trends in wastewater results. See details in Section 6.2.4.
Wyoming
The state provided financial incentives to participating utilities. A public-facing dashboard shows wastewater results as well as modeled predictions for the percent of the population infected with COVID-19, based on wastewater data. See details in Section 6.2.5.

A Compendium of U.S. Wastewater Surveillance for COVID-19 Public Health Efforts
43
Table 5. Summary of case study wastewater surveillance programs.
Wastewater Surveillance Program Unique Aspects of the Program Highlighted in the Case Study
Loca
l Pro
gram
s
Hampton Roads Sanitation District in Hampton Roads, Virginia
The utility collects samples in the local community and analyzes them for SARS-CoV-2 at their own laboratory. The utility also analyzes wastewater samples from other utilities and organizations throughout the state and has documented their approach in a peer-reviewed journal article. See details in Section 6.2.6.
Houston, Texas
The city collects wastewater samples from all WWTPs within the city, as well as at individual facilities and other locations within the sewershed. The city uses the wastewater data, along with other data sources such as COVID-19 individual testing results and vaccination rates, to identify “hot spots” for targeted public health intervention. Members of the local community support outreach efforts. See details in Section 6.2.7.
Tempe, Arizona
The city quickly developed and implemented a wastewater surveillance program for SARS-CoV-2 by building off its existing opioid wastewater monitoring program. The city compares local events to the wastewater results. See details in Section 6.2.8.
Uni
vers
ity
Pro
gram
s Clemson University in Clemson, South Carolina
The university categorizes wastewater results by “impact level” on a public-facing dashboard. This dashboard also includes results for variants. The university uses the wastewater data to support its COVID-19 response and the city of Clemson used the wastewater results to support its mask mandate. See details in Section 6.2.9.
University of Arizona in Tucson, Arizona
The university first analyzed samples for SARS-CoV-2 from utilities across the country and then began analyzing samples collected on campus. The university has developed action levels for their campus wastewater surveillance program and used the wastewater data to prevent an outbreak in a dorm—a story that garnered national attention. See details in Section 6.2.10.
6.2.1 Indiana The IFA recognized the possibility of accessing CARES Act funding to develop a wastewater surveillance program for SARS-CoV-2. IFA made a request to the state and was subsequently provided the CARES funding. IFA is a state agency that oversees Indiana’s debt issuance and provides efficient and effective financing solutions for state, local, and business interests (IFA, 2021). In addition, the IFA manages the state’s federally funded State Revolving Fund Loan Programs. As a result, IFA already had mechanisms in place to distribute the CARES Act funding in support of the wastewater surveillance program, as opposed to the Indiana State Department of Health or the Indiana Department of Environmental Management. Indiana established a wastewater surveillance program for SARS-CoV-2 from August to December of 2020 in 14 communities across the state. IFA chose to focus exclusively on communities with college and university campuses due to the transient nature of student populations and the potential increased spread of infectious diseases (Indiana, 2021).
IFA selected 120Water to manage the initiative and work directly with participating utilities (i.e., eligible utilities included those that served public or private universities with at least 1,000 enrolled students and student housing; all eligible utilities were invited to participate). 120Water hosted virtual training

A Compendium of U.S. Wastewater Surveillance for COVID-19 Public Health Efforts
44
sessions on sample collection procedures, sent weekly sampling kits, coordinated between participating labs, leveraged technology for data collection and results management and collaboratively developed a final report. Utility partners collected their own samples and saw themselves as “stewards of the data,” which many shared with public health decision-makers. Utilities identified sampling locations within the university collection systems (e.g., influent to WWTPs on-campus, manholes or lift stations that represent specific dormitory populations, Greek housing) and then collected the samples. Some utilities also chose to collect samples at other locations in the community (e.g., off-campus housing apartment complexes, correctional facilities, long-term care facilities). IFA and 120Water encouraged utilities to collect wastewater samples at additional locations that would provide useful information to their communities. In return for their participation, utilities received sample test kits, site selection guidance, and expert review and interpretation of the analytical results (Indiana, 2021).
For this program, utilities sent the wastewater samples to either Microbac Laboratories or the University of Notre Dame for SARS-CoV-2 analysis. Indiana included two laboratories to explore and better understand the precision of the novel analytical methods being used (Indiana, 2021). Utilities sent portions of the same wastewater sample to both laboratories in support of an interlaboratory comparison study. Microbac Laboratories analyzed samples via RT-PCR while the University of Notre Dame used RT-ddPCR. Staff from the two laboratories met weekly to discuss the results and identify ways to further refine and improve their methods, fostering a strong partnership. In general, wastewater results were comparable across laboratories (Indiana, 2020).
After sending samples to the laboratories, utilities received a weekly summary report that included graphs of wastewater results through time along with other relevant information (see Figure 11). In some cases, utilities communicated these results to and worked directly with local health departments (Indiana, 2021).
IFA released a public report on the program in late 2020 that summarized the purpose of the wastewater surveillance, the interlaboratory study, and trends in wastewater results (IFA, 2020). The report also included a detailed analysis of temporal trends in SARS-CoV-2 in wastewater compared to temporal trends in COVID-19 cases at both the community and campus level (see Figure 12). The report notes that temporal trends in wastewater mirrored trends in individual COVID-19 testing results for most communities, but that the trends appeared to occur at the same time (Indiana, 2020). In general, the wastewater data were not found to serve as a leading indicator of new cases for the Indiana program due to extended sample turnaround time and difficult-to-interpret fluctuations in the results. However, the wastewater results offered useful complementary information to other health data on COVID-19 (e.g., individual testing results) (Indiana, 2021).
The project’s overall goal was to provide university communities with a tool for and knowledge about identifying COVID-19 outbreak risks, and to evaluate ways that communities could utilize wastewater surveillance in the future. Utilities were eager to contribute to this area of research, though they were unsure how to interpret results accurately (Indiana, 2021).
Although Indiana has used all the CARES Act funding allocated to this program, IFA sees wastewater surveillance as a valuable tool for the future. IFA is exploring other funding mechanisms for new surveillance opportunities (Indiana, 2021).

A Compendium of U.S. Wastewater Surveillance for COVID-19 Public Health Efforts
45
Figure 11. Example plots provided to the utilities including viral gene copies per 100 milliters (mL) for recent samples, concentrations over time as compared to the other utilities, weekly COVID-19 cases, and mobility metrics from Google and Apple (IFA, 2020)

A Compendium of U.S. Wastewater Surveillance for COVID-19 Public Health Efforts
46
Figure 12. Plots of viral gene copies (GC) per mL in Indiana communities (Indiana, 2020).

A Compendium of U.S. Wastewater Surveillance for COVID-19 Public Health Efforts
47
6.2.2 Michigan The Michigan wastewater surveillance program, which is led by the Michigan Department of Health and Human Services (MDHHS) and the Michigan Department of Environment, Great Lakes, and Energy (EGLE), began in September 2020 and ended February 2021. To quickly stand up a wastewater testing pilot project, EGLE relied on their established sampling program and laboratory network used to support the beach water monitoring program. As part of the beach program, EGLE had previously provided $500,000 to the laboratory network, led by Michigan State University, to procure RT-qPCR machines that the laboratories used to establish RT-qPCR analytical methods for E. coli. As a result, these laboratories were able to easily transition to measuring SARS-CoV-2 in wastewater (Michigan, 2021a).
Michigan funded the SARS-CoV-2 wastewater surveillance pilot project using CARES Act funding. MDHHS received CARES Act funding and provided these funds to EGLE for the statewide wastewater surveillance pilot project. EGLE used their existing grant process to distribute funding for local wastewater surveillance programs throughout the state. The grant application required a partnership with a wastewater utility and local health department, and ideally a laboratory to analyze the wastewater samples (Michigan, 2021b). EGLE distributed $10 million in grants to 20 projects that included over 270 sampling locations and community-scale samples from WWTPs and building samples from colleges and universities, assisted living and long-term care facilities, and K-12 schools with in-person learning (shown in Figure 13) (Michigan, 2021a).
Figure 13. Michigan Wastewater Surveillance Program projects (green diamonds) and sampling locations (blue circles) (Michigan EGLE, 2021).
The 19 public, private, and academic laboratories participating in Michigan’s program worked collectively to quickly develop a SARS-CoV-2 analytical method (Michigan, 2021a; Michigan, 2021b). All laboratories
A Compendium of U.S. Wastewater Surveillance for COVID-19 Public Health Efforts
48
purchased the PCR primers and probes identified by CDC. Due to potential supply issues with RT-qPCR machines and supplies, most of the laboratories shifted to using RT-ddPCR. Michigan State University lead the RT-ddPCR analytical methods development. To ensure the SARS-CoV-2 wastewater results were consistent between laboratories, EGLE developed a Quality Assurance Project Plan that identified the control requirements and calculation methods, such as converting the cycle threshold (CT) score into virus copies/L (Michigan, 2021a). Michigan State University and Saginaw Valley State University participated in the WRF’s interlaboratory methods evaluation study (WRF, 2020e).
Collaboration was a strength of Michigan’s wastewater surveillance program. Michigan State University led weekly calls with the whole project team and hosted a Microsoft Teams page that included details on methods and quality assurance procedures. Michigan State University also hosted virtual office hours for all participants to answer questions and troubleshoot efforts (Michigan, 2021a).
Local projects provided the results to their local communities in real time to support public health actions. For example, the University of Michigan shared the SARS-CoV-2 wastewater results with the local health department and the campus COVID-19 response team. The campus COVID-19 response team conducted individual testing on students living in dormitories that had high levels of the virus in wastewater. In addition, the campus closed public locations, such as gyms, if high levels were detected from those buildings (Michigan, 2021a). As another example, one of the Michigan project teams was sampling wastewater from a Native American-owned casino, and the community decided to close the casino based on a combination of the wastewater surveillance data and community testing.
The Michigan wastewater surveillance pilot project ended in February 2021 after spending all the allocated CARES Act funding. Some of the participating sites continued wastewater surveillance using other funding sources. As of April 2021, MDHHS is reestablishing the statewide SARS-CoV-2 wastewater surveillance program using allocated funding from CDC’s ELC Emerging Detection Enhancement award, with tentative plans to start in June 2021 (Peters, 2021).
6.2.3 New Mexico The New Mexico wastewater surveillance program, led by the state’s Environment Department, began in late 2020. Funded in part by the CARES Act, the program tracks the SARS-CoV-2 virus in wastewater from congregate facilities (e.g., youth shelters, detention centers). New Mexico chose to focus on these facilities to support direct public health action and because residents of congregate facilities are at higher risk of exposure to and illness from COVID-19. The wastewater results serve as an early indicator that—along with personal nasal or saliva testing and other public health interventions—is used to prevent or minimize a potential COVID-19 outbreak (NMED, 2021b).
As of early April 2021, New Mexico sampled 17 facilities in various regions of the state once or twice a week. Some facilities have multiple sampling points that divide the facility into smaller resident populations and/or designate separate COVID-19 quarantine areas (NMED, 2021a). This generates wastewater results that are more actionable for the facilities and public health professionals (NMED, 2021b).
New Mexico publishes the wastewater sampling results on a dashboard, categorizing the results by current level of concern and current trend, similar to other program dashboards (e.g., Clemson University) (NMED, 2021a). The current level of concern is defined as:
• less than 5,000 virus copies/L = no/minimal impact • 5,000 to 10,000 virus copies/L = low • 10,000 to 100,000 virus copes/L = moderate
A Compendium of U.S. Wastewater Surveillance for COVID-19 Public Health Efforts
49
• 100,000 to 1,000,000 virus copies/L = high • greater than 1,000,000 virus copies/L = very high
The current trend is described as no trend, increasing, or decreasing based on the three most recent samples (NMED, 2021d).
New Mexico’s wastewater surveillance program has helped multiple facilities successfully identify COVID-19 positive residents or staff through follow-up testing. One example is at J. Paul Taylor Center, a juvenile detention facility, where SARS-CoV-2 levels in the wastewater were consistently non-detectable. Then, on December 23, 2020, the surveillance program detected increased SARS-CoV-2 levels in the wastewater sample and notified the facility (see Figure 14) (NMED, 2021a). In response, the J. Paul Taylor Center conducted individual testing of all its residents and staff and found three positive staff members, one of whom was at the facility on the day that the sample was collected. The positive staff members quarantined off site, and the subsequent wastewater results returned to non-detectable levels (NMED, 2021c).
Another example is from Luna County Detention Center, which has two sampling points: one on the west side of the facility, which includes a COVID-19 quarantine area, and one on the east side of the facility, which should not have any residents with COVID-19. The wastewater sample from the east side was in the no/low impact level of concern until January 5, 2021, when the sample showed SARS-CoV-2 levels of over 1,000,000 virus copies/L (see Figure 15) (NMED, 2021a). Once again, the program notified the facility, which conducted 100 percent individual testing and identified 27 residents and 10 staff members with COVID-19. The inmates were transferred to the quarantine area on the west side of the facility and the staff quarantined off site, resulting in decreased SARS-CoV-2 levels in the wastewater (NMED, 2021b).

A Compendium of U.S. Wastewater Surveillance for COVID-19 Public Health Efforts
50
Figure 14. Wastewater surveillance data for the J. Paul Taylor Center (NMED, 2021a).
SARS-CoV-2 levels increase
12/23/20

A Compendium of U.S. Wastewater Surveillance for COVID-19 Public Health Efforts
51
Figure 15. Wastewater surveillance data for Luna County Detention Center (east side) (NMED, 2021a).
SARS-CoV-2 levels increase
1/5/21

A Compendium of U.S. Wastewater Surveillance for COVID-19 Public Health Efforts
52
6.2.4 Ohio The Ohio wastewater surveillance program, led by the Ohio Department of Health (ODH) and Ohio Environmental Protection Agency (Ohio EPA), began in July 2020 after Ohio Governor DeWine became aware of the utility of wastewater surveillance and wanted to develop a program. ODH and Ohio EPA coordinated with the Ohio Water Resources Center (Ohio WRC) to implement the surveillance program using CARES Act funding. Ohio WRC had existing relationships with universities in Ohio, along with mechanisms to distribute funding to project teams. The U.S. EPA ORD in Cincinnati, Ohio also supported the program using internal funding (Ohio, 2021; Ohio DOH, 2020).
To begin the program, Ohio WRC invited researchers from about 10 universities and U.S. EPA to participate in a statewide monitoring program kickoff. The team established four subgroups to quickly develop every aspect of the program: a leadership group, site selection group, analytical methods group, and statistical modeling group. The site selection group had a goal to sample influent to WWTPs in as many counties to include as many people as possible throughout Ohio. The site selection group solicited partnerships with utilities directly and through state organizations, prioritizing WWTPs that served large or vulnerable populations and were willing to participate (Ohio, 2021). The site selection group used the vulnerability report that ODH and Ohio State University developed to support Ohio’s COVID-19 efforts. The vulnerability report identified populations that are at risk for disproportionate burdens of illness and death from SARS-CoV-2 overlaid with social factors (e.g., median household income, occupation, education level) and healthcare resources (e.g., hospitals) (Nemeth et al., 2020). As of March 2021, Ohio’s program included 65 WWTPs throughout the state, as presented in Figure 16 (Ohio DOH, 2020).
The analytical methods group included a network of university laboratories, ORD’s laboratory, and out-of-state commercial laboratories. Each of the eight participating laboratories developed their own analytical method to foster SARS-CoV-2 methods development. Due to the pandemic creating supply chain issues for components of the analytical methods (e.g., buffers), some of the labs also had to adjust their method based on availability. Once a month, the program performs an interlaboratory validation whereby each lab receives a sample from the same WWTP for analysis. Once results are available, the participating laboratories meet to discuss the results and troubleshoot any items. For example, none of the laboratories pasteurize the samples due to lessons learned that pasteurization reduced the RNA PCR signal. Ohio WRC and U.S. EPA ORD also developed quality assurance and quality control requirements using positive spikes and human marker comparisons (Ohio, 2021). Additionally, U.S. EPA ORD and Ohio State University participated in the WRF’s interlaboratory methods evaluation study (WRF, 2020e).
The statistical modeling group’s focus was to evaluate whether the SARS-CoV-2 wastewater results could serve as an early warning system for potential COVID-19 outbreaks. The number of samples per week and analytical turnaround time were critical to the program’s success. The program originally began with weekly sampling, but shifted to sampling twice per week to get more frequent results for the local health departments and enable more reliable trend analysis. The labs provide the results to the programs within three days of sample collection (Ohio, 2021). The statistical modeling group evaluated different trend analysis methods and modeling approaches to estimate the number of people shedding SARS-CoV-2 in sampled areas. The statistical modeling group decided to perform linear regression of the last ten wastewater results (normalized by flow). Ohio WRC said these linear regressions are not yet on the dashboard as of April 2021 (Bohrerova, 2021).
Ohio WRC compiles the results from all the labs, normalizes the results by WWTP influent flow rate to account for variations in flow rate due to rainfall, and uploads daily the results to ODH to be published on the program’s dashboard (shown in Figure 17). ODH together with Ohio WRC and other

A Compendium of U.S. Wastewater Surveillance for COVID-19 Public Health Efforts
53
stakeholders determined thresholds based on the results for the dashboard by comparing the average of the last two samples with the average of the prior third and fourth samples (Ohio, 2021; Ohio DOH, 2020). The thresholds are:
Substantial increase in SARS-CoV-2 levels (purple) (greater than 100% increase) Increase in SARS-CoV-2 levels (red) (50% to 100% increase) Steady SARS-CoV-2 levels (gray) (49% decrease to 49% increase) Decrease in SARS-CoV-2 levels (blue) (greater than 50% decrease)
For utilities with significant increases in SARS-CoV-2 in the wastewater, ODH contacts the local health district and provides toolkits to assist with messaging about public health measures. ODH also coordinates with the local health districts to provide additional testing and contact tracing capabilities if necessary (Ohio, 2021).

A Compendium of U.S. Wastewater Surveillance for COVID-19 Public Health Efforts
54
Figure 16. Ohio Coronavirus Wastewater Monitoring Network Dashboard showing all the participating utilities on the map and a list of utilities in order of the trend based on the most recent results (as of April 19, 2021) (Ohio DOH, 2020).

A Compendium of U.S. Wastewater Surveillance for COVID-19 Public Health Efforts
55
Figure 17. Ohio Coronavirus Wastewater Monitoring Network Dashboard showing city-specific results normalized by WWTP influent flow rate (top graph) and compared to the number of COVID-19 cases from individual testing (bottom graph) (Ohio DOH, 2020).

A Compendium of U.S. Wastewater Surveillance for COVID-19 Public Health Efforts
56
6.2.5 Wyoming The Wyoming wastewater surveillance program, led by the Wyoming Public Health Laboratory (WPHL), Wyoming Department of Health (WDOH), and University of Wyoming, began in May 2020 using CARES Act funding and CDC’s ELC funding. The program sampled both individual facility wastewater and community wastewater, including WWTP influent and lift stations within the communities’ wastewater collection systems (Wyoming, 2021).
Wyoming incentivized community participation in the sampling efforts. First, Wyoming provided the wastewater sampling kits and coordinated sample shipping for each of the participating communities. In addition, Wyoming paid each community $300 per sample for their time and efforts and provided bonuses to communities that were consistently sampling. Most communities sample the WWTP influent twice a week. Next, since Wyoming required composite samples for participation in the program, Wyoming purchased composite samplers for the communities and reimbursed up to $4,000 for each composite sampler that communities purchased on their own. Wyoming also provided technical assistance to communities through the Wyoming Association of Rural Water Systems. Wyoming paid the Wyoming Association of Rural Water Systems for each community that participated in the program to further incentivize community participation (Wyoming, 2021). As a result, the Wyoming program currently includes 31 communities (Wyoming PHL, 2021). However, barriers to participation included concern from some communities that the detection of SARS-CoV-2 in the wastewater could lead to more restrictive public health measures, such as business shutdowns or gathering restrictions. Other communities were concerned a detection of SARS-CoV-2 in the wastewater would further stigmatize the community (Wyoming, 2021).
In addition to the WWTP influent or collection system sampling conducted by communities, the Wyoming program currently samples from 15 community living facilities with high-risk populations. These include Wyoming Department of Corrections facilities, Wyoming Department of Family Services housing, and dorms at the University of Wyoming and Laramie County Community College. Wyoming hired a contractor to collect composite samples from each facility to minimize the burden on the facilities (Wyoming, 2021).
Initially, WPHL analyzed all the wastewater samples, but as the program grew, WDOH began coordinating with the University of Wyoming to analyze some of the samples. The cooperation was enhanced because WPHL had previously established relationships with University of Wyoming faculty and had plans for other collaborative activities. WPHL and the University of Wyoming shared the same testing methods to ensure consistency through the testing process. Additionally, certain laboratory staff had been trained and worked at WPHL and then transferred to work at the university. WDOH then combines the data from both laboratories into one file for further statistical analysis (Wyoming, 2021). WDOH also models the estimated prevalence rates and uncertainty using the wastewater result as a proxy estimate for the percent of people infected with COVID-19 in each community (i.e., not for individual facilities) (Wyoming PHL, 2021). WDOH felt the prevalence rate was important to communicate the results to the participating communities and the general public, since CT and copies/mL are harder to understand (Wyoming, 2021). WDOH relied on information from a German study on fecal shedding rates for nine individuals and then ran data simulations to develop the estimation model (Wyoming PHL, 2021; Wölfel et al., 2020).

A Compendium of U.S. Wastewater Surveillance for COVID-19 Public Health Efforts
57
Wyoming’s online wastewater surveillance dashboard includes a map of each community participating in the program. The color of the icon corresponds to the prevalence level of the virus (see Figure 18) with gray dots indicating communities without samples in the last 14 days. In addition, icons on the map outlined in red indicate an increasing prevalence level in the community. Once a user selects a community, Wyoming’s dashboard adds three additional graphs of estimated prevalence rate, CT count (i.e., raw data from qPCR), and virus gene copies/mL all over time (see Figure 19). Wyoming’s dashboard also includes graphs of virus gene copies/mL for each of the facility monitoring locations.
Wyoming is comparing the community-level wastewater results to the state individual testing results to identify potential gaps in individual testing. As vaccines are available, Wyoming plans on using the SARS-CoV-2 wastewater program to monitor the spread of COVID-19 in communities with more limited access to vaccines. The facilities are also using the wastewater results to make public health decisions. For example, Honor Farm, a Wyoming Department of Corrections facility, conducted individual testing of all inmates and staff due to an increase in SARS-CoV-2 in the wastewater (Wyoming, 2021).
Beyond COVID-19, Wyoming is evaluating options for future wastewater surveillance use, such as in detection of other emerging diseases or antibiotic resistance (Wyoming, 2021).
Figure 18. Wyoming State SARS-CoV-2 Wastewater Surveillance Dashboard prevalence ranges (Wyoming PHL, 2021).

A Compendium of U.S. Wastewater Surveillance for COVID-19 Public Health Efforts
58
Figure 19. Wyoming State SARS-CoV-2 Wastewater Surveillance Dashboard (Wyoming PHL, 2021).
A Compendium of U.S. Wastewater Surveillance for COVID-19 Public Health Efforts
59
6.2.6 Hampton Roads Sanitation District in Hampton Roads, Virginia
The HRSD is a wastewater utility serving 20 cities and counties in southeastern Virginia. HRSD treats wastewater for more than 1.7 million people over a service area of nearly 5,000 square miles by operating 17 WWTPs of varying sizes. HRSD began a pilot microbial source tracking program to detect surface waters microbes in 2014. This provided HRSD with molecular experience, as well as the sampling and analytical equipment necessary when the COVID-19 pandemic started. As soon as CDC developed the clinical SARS-CoV-2 RT-qPCR diagnostic panel, HRSD shifted their focus to quantifying SARS-CoV-2 RNA in local raw influent wastewater. In early March 2020, HRSD began a SARS-CoV-2 wastewater surveillance pilot study using existing utility funding (HRSD, 2021b). In collaboration with experts from the University of Notre Dame and Ohio State University, HRSD then published a research paper on the results of their 21-week pilot program that analyzed WWTP influent from the nine large WWTPs in the region. The manuscript includes details on the program’s analytical methods and data analyses (Gonzalez et al., 2020).
HRSD has continued weekly sampling of WWTP influent for SARS-CoV-2 beyond the pilot program for the large WWTPs in the region. In addition, HRSD participated in the WRF’s interlaboratory methods evaluation (Pecson et al., 2021) and continues to refine their analytical methods over time as more information on SARS-CoV-2 becomes available (HRSD, 2021b).
HRSD displays up-to-date surveillance results on their HRSD COVID-19 Surveillance Dashboard as a graph of the total Hampton Roads viral SARS-CoV-2 load in local wastewater over time compared to clinical cases (see Figure 20). The figure includes the timing of state and local restrictions. HRSD’s dashboard also presents the SARS-CoV-2 concentration spatially over time in a dynamic image. Figure 21 shows a snapshot in time of the spatial variation in normalized SARS-CoV-2 loading across the region. HRSD also provides wastewater results to the Virginia Department of Health and uploads the results to CDC’s NWSS (HRSD, 2021b).
HRSD also analyzes wastewater samples for other Virginia government surveillance programs at-cost. As of April 2021, HRSD was analyzing wastewater samples from all 40 Virginia Department of Corrections facilities, as well as wastewater samples from some military barracks located in Virginia. In addition, HRSD has analyzed samples from the Western Virginia Water Authority in Roanoke, Virginia, since May 2020 (HRSD, 2021b).

A Compendium of U.S. Wastewater Surveillance for COVID-19 Public Health Efforts
60
Figure 20. HRSD’s dashboard presents the SARS-CoV-2 wastewater concentration and the new individual COVID-19 cases over time (HRSD, 2021a).

A Compendium of U.S. Wastewater Surveillance for COVID-19 Public Health Efforts
61
Figure 21. HRSD’s dashboard presents the SARS-CoV-2 wastewater concentration spatially throughout the collection system over time (HRSD, 2021a)

A Compendium of U.S. Wastewater Surveillance for COVID-19 Public Health Efforts
62
6.2.7 Houston, Texas The Houston wastewater surveillance program began in March 2020, led by HHD and in collaboration with Rice University for technical expertise and laboratory analyses. Baylor College of Medicine also provides laboratory support (HHD, 2020; Rice, 2020). The program was initially funded by Rice University an $200,000 ($35,000 subaward to Rice) NSF RAPID grant (Award #2029025), funding from CDC Foundation of $65,000, and received additional funding to expand through the CARES Act (Houston, 2021; NSF, 2020o). Houston also reprogrammed some of their funding received from CDC’s ELC cooperative agreement to support the wastewater surveillance program (Houston, 2021).
Houston Water collects weekly wastewater samples at the influent of all 39 WWTPs in Houston, while HHD collects samples at other manhole and lift station locations throughout the city. Figure 22 presents a map of the areas the Houston surveillance program covers. As of March 2021, the program includes monitoring at 25 nursing homes, 51 K-12 schools, a correctional facility, and two homeless shelters, as well as at 30 lift stations to capture smaller segments of the community. Houston collects 24-hour composite samples at all locations, with the exception of schools, where the city collects six- to eight-hour composite samples to represent typical school hours (Houston, 2021).
HHD initially sent samples to a commercial laboratory but subsequently switched to local universities, Rice and Baylor, to reduce costs and minimize sampling result turnaround time. HHD worked closely with researchers at Rice University, who have provided technical expertise and laboratory analysis throughout the duration of the program, but also sent samples to Baylor for validation and standardization of the analytical methods (Houston, 2021). Although the universities used different methods (i.e., Rice used RT-ddPCR and Baylor used RT-qPCR), the universities worked together to optimize their approaches and analyzed their samples in triplicate to further verify results (Houston, 2021). For example, in order to choose the best method for standardization, the researchers compared five different RNA concentration and extraction methods. As the program grew, Rice also supported the transition of some of the wastewater sample analyses over to HHD’s laboratory. HHD identified the flexible and adaptive nature of these academic partners as a key contributor to the success of their program, noting the rapid evolution in how data had to be analyzed, interpreted, and communicated to the public as more information became available (Houston, 2021).
HHD uses the wastewater data, along with other public health information, to identify “hot spot zones” for targeted public health interventions. HHD develops weekly reports that summarize available data for each of the 105 zip codes in Houston. HHD then identifies “hot spot zones” based on a detailed review of individual COVID-19 testing results, comparisons of wastewater results to the prior week and to peak levels observed in the summer of 2020 (see Figure 24), vaccination rates, and known presence of COVID-19 variants. HHD meets every other week to discuss the zip code summary reports, and in general, considers the wastewater data to be the most important metric (Houston, 2021).

A Compendium of U.S. Wastewater Surveillance for COVID-19 Public Health Efforts
63
Figure 22. Areas of Houston covered by the wastewater surveillance program (Houston, 2021).

A Compendium of U.S. Wastewater Surveillance for COVID-19 Public Health Efforts
64
Figure 23. Percent change in wastewater results from July 6, 2020 (Peak) for areas of Houston covered by the wastewater surveillance program (Houston, 2021).
A Compendium of U.S. Wastewater Surveillance for COVID-19 Public Health Efforts
65
When HHD identifies new zip codes for public health intervention, they set up additional temporary vaccination and individual testing sites. HHD also identifies support in the local community (e.g., local churches or faith groups) to help connect with residents and determine barriers to testing and vaccination, as well as to schedule appointments and secure transportation to testing and vaccination sites. HHD provides funds to the local community groups for their involvement. Where wastewater samples are collected at individual facilities, HHD provides those facilities with the wastewater results weekly (Houston, 2021).
HHD attributes much of the success of their program to collaborations with researchers at Rice and Baylor, who supported the laboratory methods research while understanding the critical need for wastewater data to be actionable and to Rice for statistical interpretation and forecasting (Houston, 2021). Rice has recently begun quantifying two specific mutations in wastewater samples that are characteristic of the United Kingdom variant (B.1.1.7). Based on initial data, Rice is now working with HHD on sequencing the whole SARS-CoV-2 genome. While this approach does not definitively determine whether the variant is present, it provides information on the likelihood of variants being present among the population contributing to local wastewater. HHD uses the wastewater mutation sample data as a screening mechanism to identify communities where the mutations might be present and to help HHD determine where to allocate resources for genome sequencing of positive personal tests (Houston, 2021).
Beyond COVID-19, HHD and Rice are exploring future uses of wastewater surveillance (e.g., influenza and other viral pathogens) with hopes of developing a long-term robust monitoring program for the city (Houston, 2021).
6.2.8 Tempe, Arizona In 2018, Tempe and Arizona State University’s (ASU’s) Biodesign Institute initiated a program to study opioids in wastewater with funding from the city council’s Innovation Fund (Tempe, 2021d). For this effort, the city analyzed samples from five WWTPs for various parent drug compounds (e.g., fentanyl) and their metabolites (e.g., norfentanyl) (Tempe, 2021c). Tempe used the results to provide insight on illicit drug use in the city and to support public health decisions such as where to allocate resources and strategies for reducing opioid use. To foster community buy-in for this project, Tempe held a town hall meeting where a diverse panel of experts, including public health officials and the fire chief, described the project and then presented the data in the form of an online data dashboard. Tempe credits this meeting and the development of a publicly available dashboard as establishing the necessary foundation of transparency and trust with community members for the opioid wastewater surveillance program (Tempe, 2021d).
When the idea of testing wastewater for SARS-CoV-2 came about in February 2020, the city was able to quickly establish a program by leveraging community support and lessons learned from the city’s existing opioids program, as well as systems like the partnership with ASU for laboratory analyses and the online data dashboard for disseminating results. Tempe began wastewater surveillance for SARS-CoV-2 in late March 2020 from one sewershed and expanded throughout the city shortly after (Tempe, 2021d). As of February 2021, Tempe collects 24-hour composite samples two to seven times per week in seven sewersheds (Tempe, 2021b). ASU then performs the laboratory analysis of SARS-CoV-2 via RT-qPCR on the wastewater samples using funding from NIH and NSF grants. Tempe presents the results in real time on an online data dashboard for use, along with other public health data, to drive decisions (e.g., when to close or reopen certain establishments) (Tempe, 2021d).
Tempe’s success piqued the interest of, and partnership offer from the neighboring town of Guadalupe, which has a large population of essential workers and low-income and minority families. Guadalupe has
A Compendium of U.S. Wastewater Surveillance for COVID-19 Public Health Efforts
66
since partnered with Tempe and ASU to monitor wastewater for SARS-CoV-2. Tempe posts the Guadalupe results on Tempe’s online dashboard. Guadalupe’s Mayor and Council use the results to support its public health messaging (e.g., the importance of social distancing) and decision-making (Tempe, 2021d).
Tempe’s online data dashboard presents an interactive bar chart with average weekly SARS-CoV-2 wastewater results for each geographic collection area (see Figure 24) (Tempe, 2021a). The dashboard also includes an “event timeline” that indicates when the city implemented certain public health measures that may be tied to trends observed in the wastewater data (e.g., when dine-in restaurants were closed, when schools were closed, when the stay-at-home order was lifted) (Tempe, 2021a). Tempe also developed a timeline with user-friendly background information on local and state events related to COVID-19 that include events like (Tempe, 2021a):
3/14/2020 – Arizona closed schools statewide 3/29/2020 – Arizona issued a stay-at-home order 5/14/2020 – Arizona’s stay at home order ended 6/10/2020 – COVID-19 testing became available in the Town of Guadalupe 6/19/2020 – Maricopa County required masks in public spaces 12/15/2020 – Tempe began phase 1A of the vaccine roll out 1/28/2021 – Arizona detected the first case of the U.K. COVID-19 variant 3/14/2021 – Tempe Elementary School District and Tempe Union High School District resumed
in-person learning
Tempe’s wastewater program for SARS-CoV-2 has offered an affordable way for the city to track COVID-19 in the community and has, in some cases, served as an early warning of increased COVID-19 spread (Tempe, 2021d). Tempe has also used the data to understand the distribution of COVID-19 cases throughout the city and to determine where to deploy additional services to educate the public and increase awareness on implemented public health measures. A key driver of this effort was to address equity issues within the community and determine if there were disproportionate concentrations of cases in certain locations. As an example, early in the program, Tempe observed elevated concentrations of SARS-CoV-2 in one area. Based on the wastewater data and the community demographics, Tempe recognized the need to provide additional resources and launched an educational campaign for the residents focused on reducing COVID-19 risk. City workers campaigned door to door throughout the community and distributed educational materials in Spanish and English, face masks, stickers, and care packages. After the campaign, the city observed slight decreases in SARS-CoV-2 wastewater measurements (Tempe, 2021d).
Beyond COVID-19, the city is evaluating options for future wastewater surveillance for other biomarkers that can indicate the presence of other viruses, drugs and alcohol, and other health concerns (e.g., asthma medicine) to aid in city planning (e.g., public education and outreach, allergy-friendly tree canopy selection) (Tempe, 2021d).
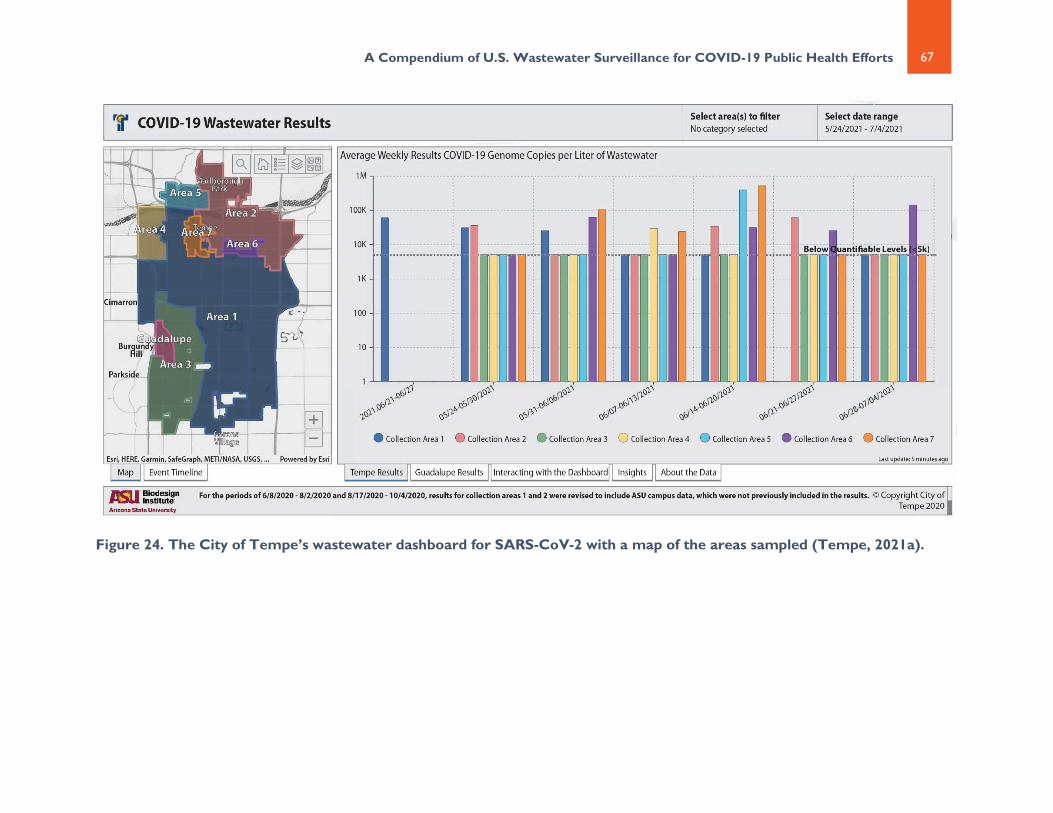
A Compendium of U.S. Wastewater Surveillance for COVID-19 Public Health Efforts
67
Figure 24. The City of Tempe’s wastewater dashboard for SARS-CoV-2 with a map of the areas sampled (Tempe, 2021a).

A Compendium of U.S. Wastewater Surveillance for COVID-19 Public Health Efforts
68
6.2.9 Clemson University in Clemson, South Carolina The Clemson University wastewater surveillance program, led by Dr. David Freedman, a professor in the Department of Environmental Engineering and Earth Sciences, began in late May 2020. Backed by university funding as part of Clemson’s initiative to return students to campus amidst the COVID-19 pandemic (Clemson, 2021b), the program tracks both student transmission of the SARS-CoV-2 virus on campus, as well as student and public transmission of the virus in the city of Clemson and town of Pendleton, South Carolina (Clemson, 2021a).
Once or twice a week, 24-hour composite samples of influent wastewater are collected from an on-campus WWTP and two off-campus WWTPs (Clemson, 2021a; Clemson, 2021b). The samples are then sent to SiREM, a commercial lab in Knoxville, Tennessee, which analyzes for the virus using RT-qPCR for the N1 and N2 genes of SARS-CoV-2 (Clemson, 2021b; Clemson, 2020). Beginning in early March of 2021, Clemson expanded their analysis of the SARS-CoV-2 virus in wastewater to include the B.1.1.7 variant (i.e., the United Kingdom [U.K.] variant) and the B1.351 variant (i.e., the South African [S.A] variant). The laboratory uses the same molecular test used to quantify virus, except that the test is highly specific for the RNA that is uniquely associated with the variants.8 Wastewater results for each variant are reported as percentages, where the variant RNA copies/L are divided by the total RNA virus copies/L (Clemson, 2021b). When none of the variant RNA is detected, the percentage is zero. When all of the total RNA virus detected consists of a variant, the percentage is 100.
Clemson’s surveillance program reports each sampling location’s SARS-CoV-2 results in copies/L on its online COVID-19 Wastewater Dashboard (see Figure 25) (Clemson, 2021a). The dashboard ranks the severity of the SARS-CoV-2 copies/L in wastewater by impact level. The impact levels allow the public to interpret the potential risk of COVID-19 from the wastewater more clearly. Dr. Freedman created the ranking system by comparing cases and surveillance results from European cities (e.g., Paris, Barcelona) to Clemson’s results. The impact levels are as follows (Clemson, 2021b; Clemson, 2020):
less than 4,000 virus copies/L = no impact 4,000 to 9,999 virus copies/L = minimal impact 10,000 to 99,999 virus copies/L = potential increasing impact 100,000 to 999,999 virus copies/L = potential moderate impact greater than 1,000,000 virus copies/L = potential significant impact
As of April 2021, the dashboard also includes results for the B.1.1.7 variant (see Figure 28) (Clemson, 2021a).
8 SiREM quantifies variants in wastewater samples for Clemson University using the same RNA extracted to quantify the total SARS-CoV-2 virus. SiREM first uses the TaqPath COVD-19 PCR assay kit to quantify the total virus. This kit detects the S gene, N gene, and ORF1ab gene sequence. SiREM then uses a second PCR kit (GSD NovaType SARS-CoV-2 ID PCR) to detect the U.K. variant and the S.A. variant. Based on differences in Ct levels during the PCR reaction for RNA that is subjected to both kits, SiREM delineates what percentage of the total virus counts are attributable to the U.K. and S.A. variants. Differences in Ct levels are a result of mutations to the S gene that are present in the variants (Clemson, 2021b).

A Compendium of U.S. Wastewater Surveillance for COVID-19 Public Health Efforts
69
Figure 25. The Clemson University COVID-19 Wastewater Dashboard color codes the impact level on a map of each WWTP’s collection system area (Clemson, 2021a).

A Compendium of U.S. Wastewater Surveillance for COVID-19 Public Health Efforts
70
Figure 26. The Clemson University COVID-19 Wastewater Dashboard demonstrates the impact level and virus copies/L in each WWTP influent sampling point over time. The dashboard also includes variant tracking results (Clemson, 2021a).

A Compendium of U.S. Wastewater Surveillance for COVID-19 Public Health Efforts
71
Both the city of Clemson and Clemson University are using the wastewater surveillance program for their COVID-19 response (Clemson, 2021a; City of Clemson, 2021). In June 2020, when the city council began considering a mask ordinance, the city manager invited Dr. Freedman to present the elevated SARS-CoV-2 wastewater results from the city’s Cochran Road WWTP (City of Clemson, 2020a). Shortly after hearing about the health concerns surrounding COVID-19 levels in the community, the city instituted a face mask ordinance citing the wastewater surveillance data and continues to do so with each subsequent extension of the ordinance. In October 2020, the city council extended the face mask ordinance until Christmas based on new elevated levels of SARS-CoV-2 in wastewater (City of Clemson, 2020b; Clemson, 2021b).
Clemson University increased the frequency of testing for SARS-CoV-2 in the wastewater after students returned to on-campus dormitories in Fall 2020. The wastewater results had detectable SARS-CoV-2, which did not align with the university’s expectation that COVID-19 would be minimal on campus since students were required to have a negative COVID-19 test before and after arriving. Soon thereafter, Clemson University ramped up their individual testing plan for the fall semester to incorporate weekly testing for all students who live on campus. This was extended in the Spring 2021 semester to include weekly testing of any person who accessed a university building (Clemson, 2021b).
Clemson plans to continue monitoring the wastewater into the Summer of 2021, with declining concentrations anticipated in response to increasing levels of vaccination (Clemson, 2021b).
6.2.10 University of Arizona in Tucson, Arizona The University of Arizona is leading and participating in multiple wastewater surveillance programs for SARS-CoV-2, much of which is spearheaded by Dr. Ian Pepper, Dr. Charles Gerba, and their team at the Water and Energy Sustainable Technology (WEST) Center (University of Arizona, 2021; University of Arizona, 2020b). The university’s work in this field began in March 2020 when Dr. Pepper posted an advertisement on the WEST Center’s website for SARS-CoV-2 analyses of the N1 and N2 gene variant in wastewater that utilities could receive for a fee. The WEST Center was able to quickly set up a laboratory for this work given their prior experience testing wastewater for other viruses, which also meant they already had the necessary equipment. Between March and the end of 2020, they analyzed approximately 350 samples from utilities throughout the U.S. and in Canada. In addition to providing SARS-CoV-2 wastewater results, Dr. Pepper and his team prepared summary reports with each data package that included a brief interpretation of the results and comparisons to the number of clinical cases in the local area at the time (University of Arizona, 2021; University of Arizona, 2020b).
In June 2020, the university created a task force to develop a plan and coordinate logistics for monitoring COVID-19 on campus with both personal testing and wastewater surveillance. The University President was supportive of the wastewater surveillance program and provided funding from the university (University of Arizona, 2021). Shortly after the wastewater program began and students returned to campus in late August, the university detected SARS-CoV-2 in the wastewater from one of the dormitories. Based on the wastewater results, the university tested all students in the dormitory, ultimately identifying two asymptomatic students who tested positive for COVID-19. The students were immediately isolated and SARS-CoV-2 was not detected in wastewater collected the next day—a success story that has garnered national attention (University of Arizona, 2021; University of Arizona, 2020a). The university has repeated this success and potentially prevented outbreaks nearly one hundred other times, where SARS-CoV-2 detected in wastewater triggered personal testing that identified students with COVID-19 for isolation. In general, wastewater testing was found to be a good predictor of COVID-19 cases. When SARS-CoV-2 was detected in wastewater, the university often found students who tested positive for COVID-19 in the same dormitory. Conversely, when SARS-
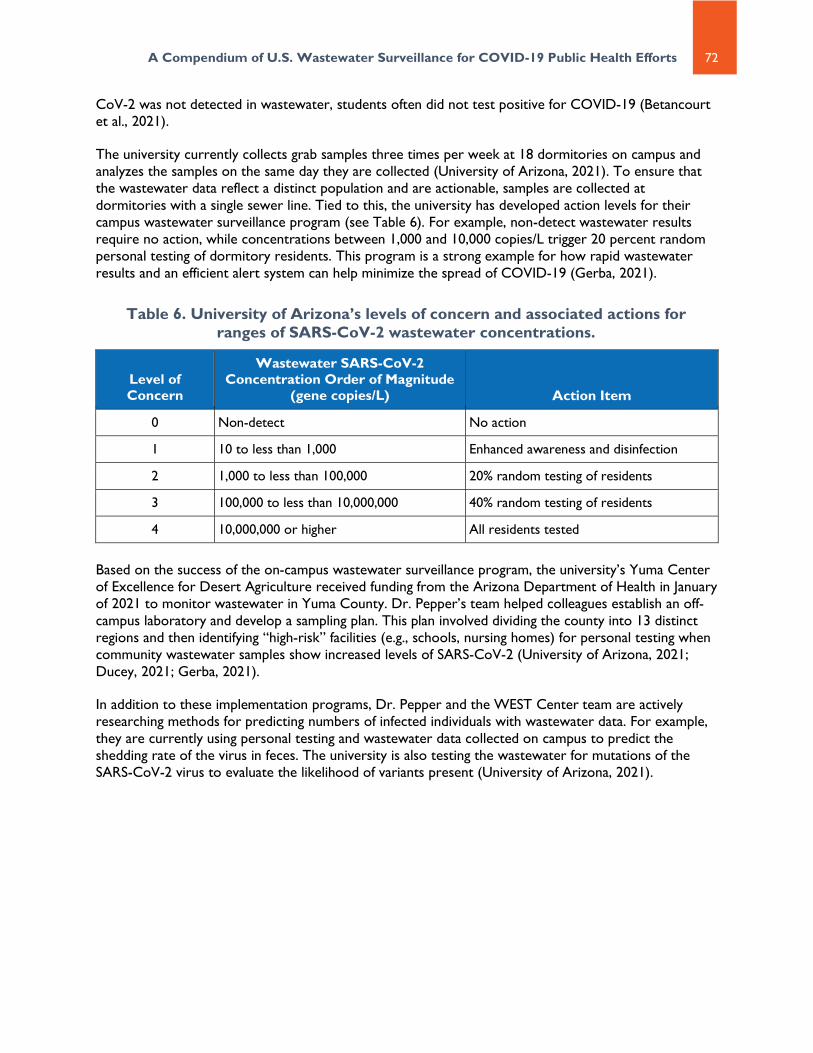
A Compendium of U.S. Wastewater Surveillance for COVID-19 Public Health Efforts
72
CoV-2 was not detected in wastewater, students often did not test positive for COVID-19 (Betancourt et al., 2021).
The university currently collects grab samples three times per week at 18 dormitories on campus and analyzes the samples on the same day they are collected (University of Arizona, 2021). To ensure that the wastewater data reflect a distinct population and are actionable, samples are collected at dormitories with a single sewer line. Tied to this, the university has developed action levels for their campus wastewater surveillance program (see Table 6). For example, non-detect wastewater results require no action, while concentrations between 1,000 and 10,000 copies/L trigger 20 percent random personal testing of dormitory residents. This program is a strong example for how rapid wastewater results and an efficient alert system can help minimize the spread of COVID-19 (Gerba, 2021).
Table 6. University of Arizona’s levels of concern and associated actions for ranges of SARS-CoV-2 wastewater concentrations.
Level of Concern
Wastewater SARS-CoV-2 Concentration Order of Magnitude
(gene copies/L) Action Item
0 Non-detect No action
1 10 to less than 1,000 Enhanced awareness and disinfection
2 1,000 to less than 100,000 20% random testing of residents
3 100,000 to less than 10,000,000 40% random testing of residents
4 10,000,000 or higher All residents tested
Based on the success of the on-campus wastewater surveillance program, the university’s Yuma Center of Excellence for Desert Agriculture received funding from the Arizona Department of Health in January of 2021 to monitor wastewater in Yuma County. Dr. Pepper’s team helped colleagues establish an off-campus laboratory and develop a sampling plan. This plan involved dividing the county into 13 distinct regions and then identifying “high-risk” facilities (e.g., schools, nursing homes) for personal testing when community wastewater samples show increased levels of SARS-CoV-2 (University of Arizona, 2021; Ducey, 2021; Gerba, 2021).
In addition to these implementation programs, Dr. Pepper and the WEST Center team are actively researching methods for predicting numbers of infected individuals with wastewater data. For example, they are currently using personal testing and wastewater data collected on campus to predict the shedding rate of the virus in feces. The university is also testing the wastewater for mutations of the SARS-CoV-2 virus to evaluate the likelihood of variants present (University of Arizona, 2021).

A Compendium of U.S. Wastewater Surveillance for COVID-19 Public Health Efforts
73
7 Wastewater Surveillance Lessons Learned
EPA identified 14 states with large-scale SARS-CoV-2 wastewater surveillance programs, along with 160 local communities or academic institutions conducting wastewater surveillance. Each of these groups relied on different approaches for their program, from analytical methods to funding mechanisms to communication of the results. All the programs showed that wastewater surveillance can be an important and effective tool for early detection of SARS-CoV-2, giving the programs the ability to take action to prevent the continued spread of COVID-19. The programs also noted that adequate and sustained funding was critical to their success and that without it, a surveillance program would be hard to maintain.
EPA selected ten of these programs to highlight in the case studies presented in Section 6.2. These case studies present the different approaches for implementing programs and analyzing wastewater data to track the presence of SARS-CoV-2. The technical leads for the case study programs noted that much of their success was dependent on four key aspects of their wastewater surveillance programs: collaboration, flexibility, transparent communication, and adequate funding. In terms of collaboration, the wastewater surveillance programs leveraged resources through establishing partnerships and relationships with entities within their programs, as well as with external groups. For example, the Wyoming wastewater surveillance program initiated its own outreach efforts, but also relied on outreach support from the Wyoming Association of Rural Water Systems. These collaborative efforts helped educate utilities on the benefits of wastewater surveillance, ultimately leading to their voluntary participation in the state’s program (Wyoming, 2021).
The success of these programs was also tied to their ability to be flexible and open to the rapidly developing science around wastewater surveillance for SARS-CoV-2. This flexibility included adapting to ongoing developments in analytical methods and data use by public health officials, as well as availability of necessary materials for sample collection and data analysis. For example, the Michigan wastewater surveillance program originally used RT-qPCR for laboratory analysis, but later shifted to RT-ddPCR due to supply chain issues with some of the materials needed for RT-qPCR methods (Michigan, 2021a). As another example, the Ohio wastewater surveillance program initially launched their program with weekly wastewater sampling, but then changed to twice per week as it provided more meaningful and actionable data for the local health departments (Ohio, 2021).
Program leads also highlighted the necessity of transparent communication within their organizations and with stakeholders in order to gain community support. For example, the Ohio wastewater surveillance program began after Ohio Governor DeWine became aware of wastewater surveillance. This led to a successful program because of the support from the highest levels within the state, including leadership at the ODH and Ohio EPA (Ohio, 2021). As another example, the opioid wastewater surveillance program in Tempe, Arizona, established strong community buy-in by having public health officials and the local fire chief share information during town hall meetings. Tempe was able to build on these relationships and the confidence established within the local community to quickly implement a wastewater surveillance program for SARS-CoV-2 (Tempe, 2021d).
The programs also identified that adequate and sustained funding was critical to their success in providing consistent support for public health. For example, Michigan’s wastewater surveillance pilot project ended in February 2021 after spending all their CARES Act funding. Some of the participating sites continued wastewater surveillance using other funding sources, but some sites had to stop

A Compendium of U.S. Wastewater Surveillance for COVID-19 Public Health Efforts
74
sampling. MDHHS was able to reestablish the wastewater surveillance program using funding from CDC’s ELC Emerging Detection Enhancement award with tentative plans to start in June 2021 (Peters, 2021). On the other hand, Wyoming had sufficient funding to incentivize community participation by paying the communities $300 per sample, providing bonuses to communities that consistently sampled, and paying technical assistance providers for onboarding communities into the program. Wyoming used CARES Act and CDC ELC funding, originally budgeting for 50 to 100 communities participating. With the 30 communities that Wyoming included in early 2021, they estimated there were about 30 months of funding remaining (Wyoming, 2021).
Wastewater-based surveillance is a new and changing field. This report highlights the unique aspects of some of the wastewater surveillance implementation work and lessons learned. This rapidly evolving field can be an effective tool for early detection of SARS-CoV-2 and other pathogens in the future, especially among disadvantaged or vulnerable populations where clinical testing may not be widely available.
A Compendium of U.S. Wastewater Surveillance for COVID-19 Public Health Efforts
75
8 References 360dx. 2020. NIST SARS-CoV-2 research-grade test material. (June 8, 2020). Available online at:
https://www.360dx.com/resources/new-product/nist-sars-cov-2-research-grade-test-material. Accessed: April 15, 2021.
Adams, Mason. 2020. Virginia Tech researchers begin testing campus wastewater for COVID-19. Virginia Tech Daily. (September 3, 2020). Available online at: https://vtnews.vt.edu/articles/2020/09/researchers-expand-wastewater-testing.html. Accessed: May 18, 2021.
AECOM. 2020. AECOM partners with Bergen County Utilities Authority and Columbia University on COVID-19 wastewater testing. (December 11, 2020). Available online at: https://aecom.com/press-releases/aecom-partners-with-bergen-county-utilities-authority-and-columbia-university-on-covid-19-wastewater-testing/. Accessed: May 3, 2021.
Ahmed, W., Bivins, A., Bertsch, P.M., Bibby, K., Gyawali, P., Sherchan, S.P., Simpson, S.L., Thomas, K.V., Verhagen, R., Kitajima, M., Mueller, J.F., and Korajkic, A. 2021. Intraday variability of indicator and pathogenic viruses in 1-h and 24-h composite wastewater samples: Implications for wastewater-based epidemiology. Environmental Research, 193:110531. (February 2021). Available online at: https://www.sciencedirect.com/science/article/abs/pii/S0013935120314286?via%3Dihub. Accessed: June 14, 2021.
Ahmed, W., Bertsch, P., Bibby, K., Haramoto, E., Hewitt, J., Huygens, F., Gyawali, P., Korajkic, A., Riddell, S., Sherchan, S., Simpson, S., Sirikanchana, K., Symonds, E., Verhagen, R., Vasan, S., Kitajima, M., and Bivins, A. 2020a. Decay of SARS-CoV-2 and surrogate murine hepatitis virus RNA in untreated wastewater to inform application in wastewater-based epidemiology. Environmental Research, 191:110092. (December 2020). Available online at: https://www.sciencedirect.com/science/article/pii/S0013935120309890. Accessed: June 14, 2021.
Ahmed, W., Bertsch, P., Bivins, A., Bibby, B., Farkas, K., Gathercole, A., Haramoto, E., Gyawali, P., Korajkic, A., McMinn, B.R., Mueller, J., Simpson, S., Smith, W.J.M., Symonds, E.M., Thomas, K.V., Verhagen, R., and Kitajima, M. 2020b. Comparison of virus concentration methods for the RT-qPCR-based recovery of murine hepatitis virus, a surrogate for SARS-CoV-2 from untreated wastewater. Science of the Total Environment, 739 (139960). (October 15, 2020). Available online at: https://www.sciencedirect.com/science/article/pii/S004896972033480X. Accessed: June 14, 2021.
APHL. 2021a. COVID test summaries. Association of Public Health Laboratories. (April 5, 2021). Available online at: https://www.aphl.org/programs/preparedness/Crisis-Management/_layouts/15/WopiFrame.aspx?sourcedoc=/programs/preparedness/Crisis-Management/Documents/COVID-test-summaries.xlsx&action=default. Accessed: April 15, 2021.
APHL. 2021b. Lab testing capacity and capability data dashboard. Association of Public Health Laboratories. (n.d.). Available online at: https://www.aphl.org/programs/preparedness/Crisis-Management/COVID-19-Response/Pages/COVID-19-Dashboard.aspx. Accessed: April 15, 2021.
APHL. 2020. Laboratory and testing resources: COVID-19 test characteristics. Association of Public Health Laboratories. (February 19, 2020). Available at: https://www.aphl.org/programs/preparedness/Crisis-Management/COVID-19-Response/Pages/Lab-resources.aspx. Accessed: April 15, 2021.

A Compendium of U.S. Wastewater Surveillance for COVID-19 Public Health Efforts
76
Argonaut. 2020. Multidisciplinary research teams investigate evidence of the COVID-19 virus in University of Idaho, City of Moscow wastewater. The University of Idaho. (October 7, 2020.) Available online at: https://www.uiargonaut.com/2020/10/07/multidisciplinary-research-teams-investigate-evidence-of-covid-19-in-university-of-idaho-city-of-moscow-wastewater/. Accessed: May 17, 2021.
Auburn, Luke. 2020. Wastewater surveillance provides RIT another tool in the COVID-19 prevention toolbox. Rochester Institute of Technology. (October 19, 2020). Available online at: https://www.rit.edu/news/wastewater-surveillance-provides-rit-another-tool-covid-19-prevention-toolbox. Accessed: May 18, 2021.
Betancourt, W., Schmitz, B., Innes, G., Prasek, S., Pogreba Brown, K., Stark, E., Foster, A., Sprissler, R., Harris, D., Sherchan, S., Gerba, C., and Pepper, I. 2021. COVID-19 containment on a college campus via wastewater-based epidemiology, targeted clinical testing and an intervention. Science of the Total Environment, 779 (146408). (March 13, 2021). Available online at: https://www.sciencedirect.com/science/article/pii/S0048969721014765. Accessed: July 6, 2021.
Biobot. 2021a. U.S. Dept. of Health and Human Services selects Biobot to establish a national wastewater-based disease monitoring program. Biobot Analytics. (May 25, 2021). Available online at: https://www.biobot.io/files/Press-Release_Biobot_HHS_Award.pdf. Accessed: June 14, 2021.
Biobot. 2021b. HHS enrollment form. Biobot Analytics. (n.d.). Available online at: https://www.app.biobot.io/sign-up. Accessed: June 14, 2021.
Biobot. 2020. Biobot COVID-19 pro-bono campaign. Biobot Analytics. (May 2020). Available online at: https://www.biobot.io/files/BiobotProBonoOnePager_2020.pdf. Accessed: April 15, 2021.
Bio-Rad. 2021. SARS-CoV-2/COVID-19 wastewater testing. Bio-Rad Laboratories, Inc. (n.d.). Available online at: https://www.bio-rad.com/featured/en/wastewater-surveillance-for-sars-cov-2.html. Accessed: April 26, 2021.
BMGF. 2021. Issued grants. Bill and Melinda Gates Foundation. (April 19, 2021). Available online at: https://www.gatesfoundation.org/-/media/files/bmgf-grants.csv. Accessed: April 30, 2021.
Bohrerova, Zuzana. 2021. Personal communication with Zuzana Bohrerova. (April 23, 2021).
Boise. 2021. Boise wastewater dashboard. City of Boise, North Dakota. (n.d.). Available online at: https://www.cityofboise.org/departments/mayor/coronavirus-covid-19-information/covid-19-data/wastewater-testing/. Accessed: April 15, 2021.
Borough of Indiana. 2021. Weekly trends report – Wastewater surveillance. Borough of Indiana, Pennsylvania. (n.d.). Available online at: https://www.indianaboro.com/news/categories/wastewater-surveillance. Accessed: May 18, 2021.
Brouwer, A.F., Eisenberg, J.N.S., Pomeroy, C.D., Shulman, L.M., Hindiyeh, M., Manor, Y., Grotto, I., Koopman, J.S., and Eisenberg, M.C. 2018. Epidemiology of the silent polio outbreak in Rahat, Isreal, based on modeling of environmental surveillance data. Proceedings of the National Academies of Sciences, 115 (45): E10625-E10633. (October 18, 2018). Available online at: https://www.pnas.org/content/115/45/E10625. Accessed: June 15, 2021.

A Compendium of U.S. Wastewater Surveillance for COVID-19 Public Health Efforts
77
Buffy, Megan. 2021. Residence hall wastewater testing supports App State’s COVID-19 management strategy. Appalachian Today – Appalachian State University. (April 15, 2021). Available online at: https://today.appstate.edu/2021/04/15/wastewater. Accessed: May 18, 2021.
Burlington. 2021. Burlington coronavirus dashboard. City of Burlington, Vermont. (n.d.). Available online at: https://coronavirus-response-burlingtonvt.hub.arcgis.com/pages/wastewater-monitoring. Accessed: May 10, 2021.
Carmel. 2020. Water tests forecast COVID. Carmel, Indiana. (December 9, 2020). Available online at: https://www.carmel.in.gov/Home/Components/News/News/6340/25. Accessed: May 18, 2021.
CDC. 2021a. National wastewater surveillance system. Centers for Disease Control and Prevention. (June 23, 2021). Available online at: https://www.cdc.gov/coronavirus/2019-ncov/cases-updates/wastewater-surveillance.html. Accessed: July 7, 2021.
CDC. 2021b. Epidemiology and laboratory capacity for prevention and control of emerging infectious diseases (ELC). Centers for Disease Control and Prevention. (February 3, 2021). Available online at: https://www.cdc.gov/ncezid/dpei/epidemiology-laboratory-capacity.html. Accessed: April 25, 2021.
CDC. 2021c. Personal communication with Dr. Amy Kirby and Dr. Jeffrey Mercante. Centers for Disease Control and Prevention. (June 10, 2021).
CDC. 2021d. ELC enhancing detection through coronavirus response and relief (CRR) supplemental funds. Centers for Disease Control and Prevention. (January 12, 2021). Available online at: https://www.cdc.gov/ncezid/dpei/pdf/elc-enhancing-detection-expansion-guidance-508.pdf. Accessed: July 7, 2021.
CDC. 2021e. Developing a wastewater surveillance sampling strategy. Centers for Disease Control and Prevention. (June 23, 2021). Available online at: https://www.cdc.gov/coronavirus/2019-ncov/cases-updates/wastewater-surveillance/developing-a-wastewater-surveillance-sampling-strategy.html. Accessed: July 7, 2021.
CDC. 2021f. Wastewater surveillance testing methods. Centers for Disease Control and Prevention. (June 23, 2021). Available online at: https://www.cdc.gov/coronavirus/2019-ncov/cases-updates/wastewater-surveillance/testing-methods.html. Accessed: July 2, 2021.
CDC. 2021g. National wastewater surveillance system – implementation for COVID-19 and beyond. Amy Kirby, Centers for Disease Control and Prevention, presented to National Tribal Water Council. (August 11, 2021).
CDC. 2020a. Federal coordination and partnering for wastewater surveillance. Centers for Disease Control and Prevention. (June 23, 2021). Available online at: https://www.cdc.gov/coronavirus/2019-ncov/cases-updates/wastewater-surveillance/federal-coordination-partnering-wastewater-surveillance.html. Accessed: July 7, 2021.
CDC. 2020b. Amy E. Kirby, PhD MPH to Whom it May Concern. Centers for Disease Control and Prevention. (December 4, 2020). Available online at: https://www.vdh.virginia.gov/content/uploads/sites/20/2020/12/AquaVitas-Project-Support-Letter-04DEC2020.pdf. Accessed: April 15, 2021.
https://www.cdc.gov/coronavirus/2019-ncov/cases-updates/wastewater-surveillance/testing-methods.html
A Compendium of U.S. Wastewater Surveillance for COVID-19 Public Health Efforts
78
CDC. 2020c. ELC CARES 2020. Centers for Disease Control and Prevention. (2020). Available online at: https://www.cdc.gov/ncezid/dpei/pdf/elc-cares-guidance-2020.pdf. Accessed: April 15, 2021.
CDC. 2020d. HHS delivers funding to expand testing capacity for states, territories, tribes. Centers for Disease Control and Prevention. (May 18, 2020). Available online at: https://www.cdc.gov/media/releases/2020/p0518-hhs-funding-expand-testing-states.html. Accessed: September 8, 2021.
CDC. 2020e. Research use only 2019-novel coronavirus (2019-nCoV) real-time RT-PCR primers and probes. Centers for Disease Control and Prevention. (June 6, 2020). Available online at: https://www.cdc.gov/coronavirus/2019-ncov/lab/rt-pcr-panel-primer-probes.html. Accessed: April 15, 2021.
CDM Smith. 2020. CDM Smith partners with US Department of Veterans Affairs for COVID wastewater testing at 8 community living centers. CDM Smith, Inc. (December 23, 2020). Available online at: https://cdmsmith.com/en/News/Veterans-Affairs-COVID-Wastewater-Testing. Accessed: April 6, 2021.
Chapin, Elizabeth. 2020. UK researchers advancing wastewater testing to track COVID-19. University of Kentucky News. (November 18, 2020). Available online at: https://uknow.uky.edu/research/uk-researchers-advancing-wastewater-testing-track-covid-19. Accessed: May 18, 2021.
Chattanooga. 2021. COVID-19 data – Biobot Analytics prevalence study. Chattanooga, Tennessee. (n.d.). Available online at: https://connect.chattanooga.gov/covid-19-data/. Accessed: May 18, 2021.
Chen, I-Chun. 2020. AECOM teams with NJ’s Bergen County, Columbia on COVID-19 wastewater testing. L.A. Biz. (December 11, 2020). Available online at: https://www.bizjournals.com/losangeles/news/2020/12/11/aecom-bergen-county-columbia-covid-wastewater-test.html. Accessed: May 18, 2021.
City of Clemson. 2021. SARS-CoV-2 results for samples collected May 4, 2021. City of Clemson, South Carolina. (n.d.). Available online at: https://clemsoncity.org/Activityfeed/Myarticles/tabid/197/ArtMID/2433/ArticleID/4253/Default.aspx. Accessed: May 11, 2021.
City of Clemson. 2020a. City council special called meeting June 24, 2020. City of Clemson, South Carolina. (June 24, 2020). Available online at: https://clemsoncity.org/Activityfeed/Myarticles/TabId/197/ArtMID/2433/ArticleID/3895/City-Council-Special-Called-Meeting-June-24-2020.aspx. Accessed: April 28, 2021.
City of Clemson. 2020b. Quick reference guide CC-2020-16 mandatory face coverings ordinance. City of Clemson, South Carolina. (June 24, 2020). Available online: https://clemsoncity.org/Portals/0/CoCGovernment/City%20Council/CC-2020-16%20Executed%20Emergency%20Ordinance%20Face%20Coverings%20(1).pdf?ver=v9r9vZ0AY-LIGbQ6gggeVQ%3d%3d. Accessed: April 28, 2021.
Clark, Christine. 2020b. Waste not: Transparency and proactivity key in SARS CoV-2 early detection program. UC San Diego News Center. (September 9, 2020). Available online at: https://ucsdnews.ucsd.edu/pressrelease/waste-not-transparency-and-proactivity-key-in-sars-cov-2-early-detection-program. Accessed: April 15, 2021.

A Compendium of U.S. Wastewater Surveillance for COVID-19 Public Health Efforts
79
Clemson. 2021a. COVID-19 wastewater dashboard. Clemson University. (n.d.). Available online at: https://www.clemson.edu/covid-19/testing/wastewater-dashboard.html. Accessed: April 28, 2021.
Clemson. 2021b. Meeting minutes with Clemson University wastewater surveillance team. Clemson University. (February 12, 2021).
Clemson. 2020. Wastewater testing provides an early warning of community coronavirus levels, research says. Clemson University News. (August 17, 2020). Available online at: https://news.clemson.edu/wastewater-testing-provides-an-early-warning-of-community-coronavirus-levels-researcher-says/. Accessed: April 28, 2021.
CNBC. 2020. HHS wants to test 30% of U.S. wastewater for the coronavirus as an ‘early warning system.’ CNBC LLC. (September 25, 2020). Available online at: https://www.cnbc.com/2020/09/25/hhs-wants-to-test-30percent-of-us-wastewater-for-the-coronavirus.html. Accessed: April 15, 2021.
CO State. 2020. Targeted testing – A team of CSU scientists work to curb the spread of COVID-19. Colorado State University. (October 5, 2020). Available online at: https://source.colostate.edu/csu-scientists-work-to-curb-the-spread-of-covid-19-with-targeted-testing/. Accessed: May 17, 2021.
Colorado DPH. 2021. Colorado COVID monitoring wastewater monitoring data. Colorado Department of Public Health. (n.d.). Available online at: https://cdphe.maps.arcgis.com/apps/opsdashboard/index.html#/d79cf93c3938470ca4bcc4823328946b. Accessed: May 17, 2021.
Cooper, Renee . 2021. North Dakota begins testing sewage for COVID-19 variants. KX News. (April 7, 2021). Available online at: https://www.kxnet.com/news/local-news/north-dakota-begins-testing-sewage-for-covid-19-variants/. Accessed: May 17, 2021.
Corvallis. 2021. Corvallis wastewater project. Corvallis, Oregon. Available online at: https://agsci-labs.oregonstate.edu/levit/corvallis-wastewater-project/. Accessed: July 12, 2021.
COVID-19 WBE Collaborative. 2021. COVID-19 WBE Collaborative. (n.d.). Available online at: https://www.covid19wbec.org/. Accessed: April 15, 2021.
Cox, Jay. 2020. Wastewater surveillance. Syracuse University. (November 12, 2020). Available online at: https://www.syracuse.edu/stories/wastewater-surveillance/. Accessed: May 18, 2021.
Crawford, Kirstie. 2020. University of Tennessee COVID-19 wastewater, saliva sampling testing underway. WATE 6 On Your Side. (September 24, 2020). Available online at: https://www.wate.com/news/university-of-tennessee-covid-19-wastewater-saliva-sampling-testing-underway/. Accessed: May 18, 2021.
CU Boulder. 2020. How sampling campus wastewater aims to keep COVID-19 in check. University of Colorado Boulder. (August 27, 2020). Available online at: https://www.colorado.edu/today/2020/08/27/how-sampling-campus-wastewater-aims-keep-covid-19-check. Accessed: May 17, 2021.
CWN. 2020a. COVID-19 wastewater coalition. Canadian Water Network. (n.d.). Available online at: https://cwn-rce.ca/covid-19-wastewater-coalition/#bc5526171202eada2/. Accessed: April 15, 2021.

A Compendium of U.S. Wastewater Surveillance for COVID-19 Public Health Efforts
80
CWN. 2020b. Canadian coalition on wastewater-related COVID-19 research. Canadian Water Network. (September 2020). Available online at: https://cwn-rce.ca/wp-content/uploads/COVID19-Wastewater-Coalition-Ethics-and-Communications-Guidance-v4-Sept-2020.pdf. Accessed: April 15, 2021.
Deshpande, J., Shetty, S., and Siddiqui, Z. 2003. Environmental surveillance system to track wild poliovirus transmission. Applied Environmental Microbiology, 69(5): 2919-2927. (May 2003). Available online at: https://www.ncbi.nlm.nih.gov/pmc/articles/PMC154486/. Accessed: June 15, 2021.
DHS. 2021. Feature article: S&T joins coalition seeking to ‘flush’ out COVID-19 in wastewater. United States Department of Homeland Security. (January 14, 2021). Available online at: https://www.dhs.gov/science-and-technology/news/2021/01/14/feature-article-st-joins-coalition-seeking-flush-out-covid-19-in-wastewater. Accessed: April 15, 2021.
Ducey. 2021. Governor Ducey announces innovative partnership to expand Yuma wastewater testing. Office of the Governor Doug Ducey. (January 6, 2021). Available online: https://azgovernor.gov/governor/news/2021/01/governor-ducey-announces-innovative-partnership-expand-yuma-wastewater-testing. Accessed: May 17, 2021.
Dura, Jack. 2020. Federal aid expands North Dakota COVID-10 wastewater study, but some cities say no. The Bismark Tribune. (November 21, 2020). Available online: https://bismarcktribune.com/news/local/govt-and-politics/federal-aid-expands-north-dakota-covid-19-wastewater-study-but-some-cities-say-no/article_29be9305-8677-5886-9f3f-d69bb6d09fce.html. Accessed: May 17, 2021.
EPA. 2021. Assessing SARS-CoV-2 virus levels in sewage. EPA ORD. (n.d.). Available online at: https://www.epa.gov/covid19-research/assessing-sars-cov-2-virus-levels-sewage. Accessed: June 14, 2021.
EPA. 2013. Wastewater sampling operating procedures. EPA Region 4 Science and Ecosystems Support Division. (February 28, 2013). Available online at: https://www.epa.gov/sites/production/files/2015-06/documents/Wastewater-Sampling.pdf. Accessed: May 5, 2021.
Erie News Now. 2021. Erie wastewater study shows increasing COVID-19 virus transmission. (March 1, 2021). Available online at: https://www.erienewsnow.com/story/43426175/erie-wastewater-study-shows-increasing-covid19-virus-transmission. Accessed: May 18, 2021.
ESRI and ASTHO. 2020. Detection of COVID-19 in wastewater. Environmental Research Institute of States and Association of State and Territorial Health Officials. (November 2020). Available online at: https://www.eristates.org/wp-content/uploads/2020/11/Wasterwater-COVID-Brief-Final_111920.pdf. Accessed: April 26, 2021.
FPDS. 2021. Wastewater data testing PIID: “75P00121P00009.” Federal Procurement Data System. (n.d.).
Available online at: https://www.fpds.gov/ezsearch/fpdsportal?q=wastewater+data+testing+PIID%3A%2275P00121P00009%22&s=FPDS.GOV&templateName=1.5.1&indexName=awardfull&x=27&y=7. Accessed: April 15, 2021.
Frederick County. 2020. County undertakes innovative approach to studying coronavirus – wastewater testing provides tool to measure community health. Frederick County, Maryland. (July 13, 2020). Available
A Compendium of U.S. Wastewater Surveillance for COVID-19 Public Health Efforts
81
online at: https://frederickcountymd.gov/DocumentCenter/View/327213/Wastewater-study-for-covid-071320. Accessed: May 18, 2021.
Gable, L., Ram, N., and Ram, J. L. 2020. Legal and ethical implications of wastewater monitoring of SARS-CoV-2 for COVID-19 surveillance. Journal of Law and the Biosciences, 7(1), lsaa039. (June 24, 2020). Available online at: https://academic.oup.com/jlb/article/7/1/lsaa039/5861905. Accessed: May 10, 2021.
Gerba. 2021. Wastewater epidemiology and disinfection of SARS-CoV-2. Dr. Charles Gerba, University of Arizona, presented at Water@Wayne Seminar Series. (February 11, 2021).
Gilbert. 2021. COVID-19 Gilbert tracking. Gilbert, Arizona. (n.d.). Available online at: https://experience.arcgis.com/experience/19a447509ff44fcf922ad0892b7b2cce/page/page_10/. Accessed: May 17, 2021.
Gonzalez, R., Curtis, K., Bivins, A., Bibby, K., Weir, M.H., Yetka, K., Thompson, H., Keeling, D., Mitchell, J., and Gonzalez, D. 2020. COVID-19 surveillance in Southeastern Virginia using wastewater-based epidemiology. Water Research, Volume 186, 2020. (November 1, 2020). Available online at: https://www.sciencedirect.com/science/article/pii/S0043135420308320. Accessed: February 12, 2021.
Harris-Lovett, S., Nelson, K., Beamer, P., Bischel, H., Bivens, A., Bruder, A., Butler, C., Camenisch, T., De Long, S., Karthikeyan, S., Larsen, D., Meierdiercks, K., Mouser, P., Pagsuyoin, S., Prasek, S., Radniecki, T., Ram, J., Roper, K., Safford, H., Sherchan, S., Shuster, W., Stalder, T., Wheeler, R., and Korfmacher, K. 2021. Wastewater surveillance for SARS-CoV-2 on college campuses: Initial efforts, lessons learned and research needs. International Journal of Environmental Research and Public Health. 18(9):4455. (April 22, 2021). Available online at: https://www.medrxiv.org/content/10.1101/2021.02.01.21250952v1.full-text. Accessed: June 14, 2021.
Healthy Davis Together. 2021. Wastewater testing. Davis, California. (May 18, 2021). Available online at: https://healthydavistogether.org/wastewater-testing/. Accessed: July 7, 2021.
Healthy Gallatin. 2021. Wastewater testing and COVID-19. Gallatin, Montana. (n.d.). Available online at: https://www.healthygallatin.org/coronavirus-covid-19/wastewater-data/. Accessed: May 18, 2021.
Healthy KY. 2020. Mayfield wastewater testing offers early warning of COVID-19 outbreak. Foundation for a Healthy Kentucky. (December 30, 2020). Available online at: https://www.healthy-ky.org/newsroom/news-releases/article/486/mayfield-wastewater-testing-offers-early-warning-of-covid-19-outbreaks. Accessed: April 30, 2021.
HHD. 2020. Pinpointing and stopping emerging outbreaks goal of Houston Health Department’s COVID-19 wastewater monitoring project. Houston Health Department. (September 24, 2020). Available online at: https://www.houstontx.gov/health/NewsReleases/pinpointing-and-stopping-emerging-outbreaks-goal-of-houston-health-departments-covid-19-wastewater-monitoring-project.html. Accessed: April 12, 2021.
HHS. 2021. Attachment A. SOO, RFP No. 75P00121Q00029, Amendment 1. United States Department of Health and Human Services. (February 28, 2021).
Hope College. 2021. COVID-19 and wastewater: implications at hope and beyond. Hope College Blog Network. (January 18, 2021). Available online at: https://blogs.hope.edu/alumni/alumni/covid-19-and-wastewater-implications-at-hope-and-beyond/. Accessed: May 18, 2021.
A Compendium of U.S. Wastewater Surveillance for COVID-19 Public Health Efforts
82
Houston. 2021. Meeting minutes with the City of Houston wastewater surveillance team. Houston, Texas. (February 11, 2021, and March 26, 2021).
HRSD. 2021a. HRSD COVID-19 surveillance dashboard. Hampton Roads Sanitation District. (n.d.). Available online at: https://www.hrsd.com/HRSD-COVID-19-Surveillance. Accessed: April 6, 2021.
HRSD. 2021b. Meeting minutes with Hampton Roads Sanitation District COVID-19 surveillance team. Hampton Roads Sanitation District. (February 11, 2021).
IDEXX. 2021. Water SARS-CoV-2 RT-PCR Test. IDEXX Laboratories. (n.d.). Available online at: https://www.idexx.com/en/water/water-products-services/water-sars-cov-2-rt-pcr-test/. Accessed: April 15, 2021.
IFA. 2021. Homepage. Indiana Finance Authority. (n.d.) Available online at: https://www.in.gov/ifa/. Accessed: May 10, 2021.
IFA. 2020. Angola Utilities weekly SARS-CoV-2 wastewater result report. Indiana Finance Authority. (November 16, 2020).
Indiana. 2021. Meeting minutes with the Indiana wastewater surveillance team. (February 10, 2021).
Indiana. 2020. Indiana Wastewater Monitoring Report, Sampling Community Sewersheds for SARS-CoV-2. 120Water, University of Notre Dame, Microbac, and Indiana Finance Authority. (n.d.). Available online at: https://www.in.gov/ifa/files/Indiana-Wastewater-Monitoring-Report-2020.pdf. Accessed: April 15, 2021.
Ivanova, O. E., Yarmolskaya, M.S., Eremeeva, T.P., Babkina, G.M., Baykova, O.Y., Akhmadishina, L.V., Kradota, A.Y., Kozlovskaya, L.I., and Lukashev, A.N. 2019. Environmental surveillance for poliovirus and other enteroviruses: Long-term experience in Moscow, Russian Federation, 2004–2017. Viruses, 11(5): 424. (May 2019). Available online at: https://www.ncbi.nlm.nih.gov/pmc/articles/PMC6563241/. Accessed: June 15, 2021.
Kazama, S., Miura, T., Masago, Y., Konta, Y., Tohma, K., Manaka, T., Liu, X., Nakayama, D., Tanno, T., Saito, M., Oshitani, H., and Omura, T. 2017. Environmental surveillance of norovirus genogroups I and II for sensitive detection of epidemic variants. Applied Environmental Microbiology, 83(9): e3406-e3416. (May 1, 2017). Available online at: https://www.ncbi.nlm.nih.gov/pmc/articles/PMC5394333/. Accessed: June 15, 2021.
Keene. 2021. Keene State College and city of Keene wastewater epidemiology project. Keene State College. (n.d.). Available online at: https://www.keene.edu/featured/fall2020/assets/documents/keene-wastewater-surveillance/download/. Accessed: May 18, 2021.
Kelvin, Jim. 2020. SUNY Oneonta experiments with wastewater testing. All Ostego. (August 25, 2020). Available online at: https://www.allotsego.com/suny-oneonta-experiments-with-waste-water-testing/. Accessed: May 18, 2021.
Kilgannon, Corey. 2020. What New York City’s sewers reveal about the virus. New York Times. (December 8, 2020). Available online at: https://www.nytimes.com/2020/12/08/nyregion/covid-testing-sewers.html. Accessed: May 18, 2021.
A Compendium of U.S. Wastewater Surveillance for COVID-19 Public Health Efforts
83
LA County. 2021. Coronavirus in sewage at inlet to Joint Water Pollution Control Plant. Los Angeles County Sanitation Districts. (July 6, 2021). Available online at: https://www.lacsd.org/civicax/filebank/blobdload.aspx?blobid=%2022002. Accessed: May 17, 2021.
Lago, P., Gary, H.E. Jr, Perez, L.S., Caceres, V., Olivera, J.B., Puentes, R.P., Corredor, M.B., Jimenez, P., Pallansch, M.A., and Cruz, R. G. 2003. Poliovirus detection in wastewater and stools following an immunization campaign in Havana, Cuba. International Journal of Epidemiology, 32(5): 772-777. (October 2003). Available online at: https://academic.oup.com/ije/article/32/5/772/665718. Accessed: June 15, 2021.
LaJeunesse, Sara. 2020. Wastewater sampling may give advanced warning of potential COVID-19 outbreaks. Penn State News. (September 20, 2020). Available online at: https://news.psu.edu/story/632398/2020/09/20/research/wastewater-sampling-may-give-advanced-warning-potential-covid-19. Accessed: May 18, 2021.
La Rosa, G., Iaconelli, M., Mancini, P., Bonanno Ferraro, G., Veneri, C., Bonadonna, L., Lucentini, L., and Suffredini, E. 2020. First detection of SARS-CoV-2 in untreated wastewaters in Italy. The Science of the Total Environment, 736, 139652. (May 23, 2020). Available online at: https://doi.org/10.1016/j.scitotenv.2020.139652. Accessed: May 12, 2021.
Lavery, Kevin. 2020. Testing the waters: MSU searches for COVID beneath the campus. WKAR Public Media for Michigan State University. (August 26, 2020). Available online at: https://www.wkar.org/post/testing-waters-msu-searches-covid-beneath-campus#stream/0. Accessed: May 18, 2021.
Lawrence. 2021. Influent wastewater COVID-19 monitoring. Lawrence, Kansas. (n.d.). Available online: https://experience.arcgis.com/experience/4456bae8a38f4b6180e008477382fff9/. Accessed: May 17, 2021.
Lott, M., Norfolk, W., Robertson, M., Foley, A., and Lipp, E. 2020. Wastewater surveillance for SARS-CoV-2 in Athens, GA. COVID-19 Portal, Center for the Ecology of Infectious Diseases, University of Georgia. (July 7, 2021). Available online at: https://www.covid19.uga.edu/wastewater-athens.html. Accessed: April 15, 2021.
LRD. 2021. Wastewater surveillance. Loxahatchee River District. (n.d.). Available online at: https://loxahatcheeriver.org/wastewater-surveillance/. Accessed: May 17, 2021.
LuminUltra. 2021. GeneCount® qPCR testing solutions. LuminUltra Technologies Ltd. (n.d.). Available online at: https://www.luminultra.com/tech/genecount-qpcr/. Accessed: April 15, 2021.
LuminUltra. 2020. LuminUltra files patent for the world’s first rapid, on-site COVID-19 wastewater testing solution. LuminUltra Technologies Ltd. (October 21, 2020). Available online at: https://www.luminultra.com/blog/luminultra-files-patent-for-the-worlds-first-rapid-on-site-covid-19-wastewater-testing-solution/. Accessed: April 15, 2021.
Maine. 2021. Weekly wastewater sampling for the presence of SARS-CoV-2. Maine’s Public Universities – University of Maine System. (n.d.). Available online at: https://www.maine.edu/together/wastewater/. Accessed: May 18, 2021.

A Compendium of U.S. Wastewater Surveillance for COVID-19 Public Health Efforts
84
Mariposa County. 2021. Wastewater surveillance data. Mariposa County, California. (June 24, 2021). Available online at: https://www.mariposacounty.org/2449/Wastewater-Surveillance-Data. Accessed: May 17, 2021.
Maryland. 2021. Sewer sentinel initiative dashboard. (n.d.). Available online at: https://mdewin64.mde.state.md.us/WSA/SSI/index.html. Accessed: May 17, 2021.
Mathematica. 2020. Traces of novel coronavirus in wastewater provide early signs of changes in local infection rate. (September 30, 2020). Available online at: https://www.mathematica.org/news/traces-of-novel-coronavirus-in-wastewater-provide-early-signs-of-changes-in-local-infection-rate. Accessed: May 18, 2021.
McMinn, B.R., Korajkic, A., Kelleher J., Herrmann, M.P., Pemberton, A.C., Ahmed, W., Villegas, E.N., and Oshima, K. 2021. Development of a large volume concentration method for recovery of coronavirus from wastewater. Science of the Total Environment. 774: 145727. (February 9, 2021). Available online at: https://doi.org/10.1016/j.scitotenv.2021. Accessed: June 14, 2021.
Medema, G., Heijnen, L., Elsinga, G., Italiaander, R., and Brouwer, A. 2020. Presence of SARS-Coronavirus-2 RNA in sewage and correlation with reported COVID-19 prevalence in the early stage of the epidemic in the Netherlands. Environmental Science & Technology Letters. (May 20, 2020). Available online at: https://pubs.acs.org/doi/10.1021/acs.estlett.0c00357. Accessed: May 3, 2021.
Michigan. 2021a. Meeting minutes with the Michigan wastewater surveillance program team. (February 10, 2021).
Michigan. 2021b. Wastewater surveillance for COVID-19 dashboard. (n.d.). Available online at: https://www.michigan.gov/coronavirus/0,9753,7-406-98163_98173-545439--,00.html. Accessed: May 10, 2021.
Michigan EGLE. 2021. Michigan COVID-19 wastewater surveillance map. Michigan Department of Environment, Great Lakes, and Energy. (n.d.). Available online at: https://egle.maps.arcgis.com/apps/webappviewer/index.html?id=8e3cb66aca204876a1db0e1b663af805. Accessed: May 10, 2021.
Missouri DHSS. 2021. The sewershed surveillance project. Missouri Department of Health and Senior Services. (July 2, 2021). Available online at: https://storymaps.arcgis.com/stories/f7f5492486114da6b5d6fdc07f81aacf. Accessed: April 15, 2021.
NACCHO. 2021. Preparedness summit – schedule. National Association of County and City Health Officials. (April 12–13, 2021). Available online at: https://prepsummit.secure-platform.com/a/. Accessed: May 11, 2021.
NACCHO. 2020a. WASH during COVID-19: Guidance for local jurisdictions. National Association of County and City Health Officials. (August 4, 2020). Available online at: https://www.naccho.org/blog/articles/wash-during-covid-19-guidance-for-local-jurisdictions. Accessed: April 15, 2021.
NACCHO. 2020b. Webinar: Water, sanitation & hygiene during the COVID-19 pandemic: Guidance for local jurisdictions. National Association of County and City Health Officials. (June 24, 2020). Available online at: https://www.naccho.org/uploads/full-width-images/WASH-During-COVID-19_Guidance_-Slides_Final.pdf. Accessed: April 15, 2021.

A Compendium of U.S. Wastewater Surveillance for COVID-19 Public Health Efforts
85
NACWA. 2020. NACWA publishes utility considerations document on surveilling wastewater for COVID-19. National Association of Clean Water Agencies. (July 10, 2020). Available online at: https://www.nacwa.org/news-publications/clean-water-current-archives/clean-water-current/2020/07/10/nacwa-publishes-utility-considerations-document-on-surveilling-wastewater-for-covid-19. Accessed: April 26, 2021.
Nantucket. 2021. Surfside Wastewater Treatment Facility COVID-19 results. Nantucket, Massachusetts. (n.d.). Available online at: https://nantucket-ma.gov/1864/Surfside-Wastewater-Treatment-Facility-C. Accessed: May 18, 2021.
Naughton, C., Roman, F., Alvarado, A., Tariqi, A., Deeming, A., Bibby, K., Bivins, A., Medema, G., Ahmed, A., Katsivelis, P., Allan, V., Sinclair, R., Zhang, Y., and Kinya, M. 2021. Show us the data: Global COVID-10 wastewater monitoring efforts, equity, and gaps. medRxiv pre-print. Available online at: https://www.medrxiv.org/content/10.1101/2021.03.14.21253564v1.
NCCo. 2021. NCCo COVID-19 wastewater testing. New Castle County, Delaware. (April 2020). Available online at: https://compassred.shinyapps.io/ncco_wastewater/. Accessed: May 17, 2021.
NEHA. 2020. Sewage monitoring in rural communities: A powerful strategy for COVID-19 surveillance. National Environmental Health Association. (December 2020). Available online at: https://www.neha.org/node/61667. Accessed: April 15, 2021.
Nemeth, J.M., Padamsee, T.J., and the Needs Assessment Writers’ Team. 2020. Ohio’s COVID-19 populations needs assessment: Minimizing the disparate impact of the pandemic and building foundations for health equity. The Ohio State University College of Public Health. (October 2020). https://cph.osu.edu/sites/default/files/docs/covid19inequities/1-Full%20Report.pdf. Accessed: May 10, 2021.
Neugeboren, Eric. 2020. UMD researchers have found traces of the COVID-19 virus in campus wastewater. The Diamondback. (October 22, 2020). Available online at: https://dbknews.com/2020/10/22/umd-researchers-coronavirus-wastewater-high-touch-surfaces/. Accessed: May 18, 2021.
NIH. 2021a. Rapid acceleration of diagnostics (RADX). United States National Institutes of Health. (n.d.). Available online at: https://www.nih.gov/research-training/medical-research-initiatives/radx. Accessed: April 15, 2021.
NIH. 2021b. RADx funded projects. United States National Institutes of Health. (April 15, 2021). Available online at: https://www.nih.gov/research-training/medical-research-initiatives/radx/funding. Accessed: April 15, 2021.
NIH. 2021c. Project details: Development and proof-of-concept implementation of the South Florida Miami RADx-rad SARS-CoV-2 wastewater-based surveillance infrastructure. United States National Institutes of Health. (n.d.). Available online at: https://projectreporter.nih.gov/project_info_description.cfm?aid=10264591&icde=53205467. Accessed: April 15, 2021.
NIH. 2021d. Project details: Wastewater analysis of SARS CoV-2 in tribal communities. United States National Institutes of Health. (n.d.). Available online at: https://projectreporter.nih.gov/project_info_description.cfm?aid=10264713&icde=53205490. Accessed: April 15, 2021.

A Compendium of U.S. Wastewater Surveillance for COVID-19 Public Health Efforts
86
NIH. 2021e. Project Details: Improved scalability, sensitivity, and interpretability of pathogen detection, including SARS-CoV-2, in wastewater using high-throughput, highly multiplexed digital array PCR technology. United States National Institutes of Health. (n.d.). Available online at: https://projectreporter.nih.gov/project_info_description.cfm?aid=10264252&icde=53205504. Accessed: April 15, 2021.
NIH. 2021f. Project details: Wastewater assessment for coronavirus in Kentucky: Implementing enhanced surveillance technology. United States National Institutes of Health. (n.d.). Available online at: https://projectreporter.nih.gov/project_info_description.cfm?aid=10264317&icde=53205513. Accessed: April 15, 2021.
NIH. 2021g. Project details: Wastewater detection of COVID-19. United States National Institutes of Health. (n.d.). Available online at: https://projectreporter.nih.gov/project_info_description.cfm?aid=10263681&icde=53205538. Accessed: April 15, 2021.
NIH. 2021h. Project details: Optimizing SARS-CoV-2 wastewater based surveillance in urban and university campus settings. United States National Institutes of Health. (n.d.). Available online at: https://projectreporter.nih.gov/project_info_description.cfm?aid=10264634&icde=53205567. Accessed: April 15, 2021.
NIH. 2021i. Project details: Bioinformatics framework for wastewater-based surveillance of infectious diseases. United States National Institutes of Health. (n.d.), Available online at: https://projectreporter.nih.gov/project_info_details.cfm?aid=10246003&icde=53218087. Accessed: April 15, 2021.
NIH. 2021j. Project details: RADx-rad discoveries & data: Consortium Coordination Center program organization. United States National Institutes of Health. (n.d.). Available online at: https://reporter.nih.gov/project-details/10274180. Accessed: April 26, 2021.
NIH. 2021k. RADxSM Radical Discoveries and Data Coordinating Center (DCC). United States National Institutes of Health. (n.d.). https://www.radxrad.org. Accessed: April 26, 2021.
NIH. 2020a. RADx programs. United States National Institutes of Health. (December 23, 2020). Available online at: https://www.nih.gov/research-training/medical-research-initiatives/radx/radx-programs. Accessed: April 15, 2021.
NIH. 2020b. Funding opportunities for radical approaches to rapid acceleration of diagnostics. United States National Institutes of Health. (August 19, 2020). Available online at: https://www.niaid.nih.gov/grants-contracts/radical-approaches-rapid-acceleration-diagnostics. Accessed: April 15, 2021.
NIH. 2020c. NIH to support radical approaches to nationwide COVID-19 testing and surveillance. United States National Institutes of Health. (December 21, 2020). Available online at: https://www.nih.gov/news-events/news-releases/nih-support-radical-approaches-nationwide-covid-19-testing-surveillance. Accessed: April 15, 2021.
NIH. 2020d. Emergency awards: RADx-rad wastewater detection of SARS-COV-2 (COVID-19) (U01 – clinical trials not allowed). United States National Institutes of Health, RFA-OD-20-015. (August 6, 2020). Available online at: https://grants.nih.gov/grants/guide/rfa-files/rfa-od-20-015.html. Accessed: April 15, 2021.

A Compendium of U.S. Wastewater Surveillance for COVID-19 Public Health Efforts
87
NIH. 2020e. Emergency awards: RADx-rad Data Coordination Center (DCC) funding opportunity. United States National Institutes of Health. (August 6, 2020). Available online at: https://grants.nih.gov/grants/guide/rfa-files/RFA-OD-20-019.html. Accessed: April 26, 2021.
NIST. 2020. A NIST-hosted webinar on measuring SARS-CoV-2 in wastewater and fecal material: A call for standards. United States National Institute of Standards and Technology. (June 16, 2020). Available online at: https://www.nist.gov/news-events/events/2020/06/nist-hosted-webinar-measuring-sars-cov-2-wastewater-and-fecal-material. Accessed: April 15, 2021.
NJIT. 2021. NJIT’s COVID environmental sampling method overview. New Jersey Institute of Technology. (n.d.). Available online at: https://www.njit.edu/pandemicrecovery/njits-covid-environmental-sampling-method-overview. Accessed: May 18, 2021.
NMED. 2021a. New Mexico Wastewater Surveillance System data dashboard. New Mexico Environment Department. (n.d.). Available online at: https://www.env.nm.gov/wastewater-surveillance-system-data-dashboard/. Accessed: February 17, 2021.
NMED. 2021b. Meeting minutes from meeting with New Mexico Environment Department wastewater surveillance team. New Mexico Environment Department. (February 17, 2021).
NMED. 2021c. Fighting the pandemic from the sewers: COVID-19 wastewater surveillance program shows early success. New Mexico Environment Department. (January 11, 2021). Available online at: https://www.env.nm.gov/wp-content/uploads/2021/01/2021-01-11-Wastewater-surveillance-program-early-success-1.pdf. Accessed: February 17, 2021.
NMED. 2021d. New Mexico Wastewater Surveillance System dashboard FAQs. New Mexico Environment Department. (April 28, 2021). https://www.env.nm.gov/wp-content/uploads/2021/04/NMWSS_FAQs_V2-4-28-21.pdf. Accessed: May 10, 2021.
NSF. 2020a. Dear colleague letter on the coronavirus disease 2019 (COVID-19). United States National Science Foundation. (April 3, 2020). Available online at: https://www.nsf.gov/pubs/2020/nsf20052/nsf20052.pdf. Accessed: July 7, 2021.
NSF. 2020b. RAPID responders: How NSF support is enabling the fight against COVID-19 in real time. United States National Science Foundation. (May 20, 2020). Available online at: https://beta.nsf.gov/science-matters/rapid-responders-how-nsf-support-enabling-fight-against-covid-19-real-time. Accessed: April 23, 2021.
NSF. 2020c. Proposal and award policies and procedures guide. United States National Science Foundation. (June 1, 2020). https://www.nsf.gov/pubs/policydocs/pappg20_1/nsf20_1.pdf. Accessed: July 7, 2021.
NSF. 2020d. At a glance: Review of the National Science Foundation CARES Act spending plan report No. OIG 20-6-001. United States National Science Foundation. (May 21, 2020). Available online at: https://www.nsf.gov/oig/_pdf/20-6-001_CARES_Act_Spending_Plan.pdf. Accessed: July 7, 2021.
NSF. 2020e. COVID-19 response funding update. United States National Science Foundation. (January 19, 2021). Available online at: https://www.nsf.gov/about/congress/funding%20updates/COVID_update_Jan19.pdf. Accessed: July 7, 2021.
A Compendium of U.S. Wastewater Surveillance for COVID-19 Public Health Efforts
88
NSF. 2020f. Search results for: COVID AND RAPID AND wastewater. (n.d.). Available online at: https://www.nsf.gov/awardsearch/simpleSearchResult?queryText=COVID+AND+RAPID+AND+wastewaterhttps://www.nsf.gov/awardsearch/simpleSearchResult?queryText=COVID+AND+RAPID+AND+wastewater. Accessed: April 15, 2020.
NSF. 2020g. Award abstract # 2027752 – collaborative research: RAPID: Wastewater informed epidemiological monitoring for SARS-CoV-2. United States National Science Foundation. (April 21, 2020). Available online at: https://www.nsf.gov/awardsearch/showAward?AWD_ID=2027752. Accessed: May 12, 2021.
NSF. 2020h. Award abstract # 2027758 – collaborative research: RAPID: Wastewater informed epidemiological monitoring for SARS-CoV-2. United States National Science Foundation. (April 21, 2020). Available online at: https://www.nsf.gov/awardsearch/showAward?AWD_ID=2027758&HistoricalAwards=false. Accessed: May 13, 2021.
NSF. 2020i. Award abstract # 2023057 – collaborative research: RAPID: Coronavirus persistence, transmission, and circulation in the environment. United States National Science Foundation. (March 17, 2020). Available online at: https://www.nsf.gov/awardsearch/showAward?AWD_ID=2023057&HistoricalAwards=false. Accessed: May 12, 2021.
NSF. 2020j. Award abstract # 2022877 – collaborative research: RAPID: Coronavirus persistence, transmission, and circulation in the environment. United States National Science Foundation. (March 17, 2020). Available online at: https://www.nsf.gov/awardsearch/showAward?AWD_ID=2022877&HistoricalAwards=false. Accessed: May 13, 2021.
NSF. 2020k. Award abstract # 2027679 – RAPID: Tracking the coronavirus in municipal wastewater. United States National Science Foundation. (April 27, 2020). Available online at: https://www.nsf.gov/awardsearch/showAward?AWD_ID=2027679&HistoricalAwards=false. Accessed: May 12, 2021.
NSF. 2020l. Award abstract # 2038372 – RAPID: Tribal capacity to evaluate COVID-19 using wastewater-based epidemiology. United States National Science Foundation. (July 7, 2020). Available online at: https://www.nsf.gov/awardsearch/showAward?AWD_ID=2038372&HistoricalAwards=false. Accessed: May 12, 2021.
NSF. 2020m. Award abstract # 2028564 – RAPID: COVID-19’s impact on the urban environment, behavior, and wellbeing. United States National Science Foundation. (April 28, 2020). Available online at: https://www.nsf.gov/awardsearch/showAward?AWD_ID=2028564&HistoricalAwards=false. Accessed: May 12, 2021.
NSF. 2020n. Award abstract # 2026599 – RAPID: Viral structure-function-activity in the engineered wastewater cycle. United States National Science Foundation. (April 27, 2020). Available online at: https://www.nsf.gov/awardsearch/showAward?AWD_ID=2026599&HistoricalAwards=false. Accessed: May 12, 2021.
NSF. 2020o. Award abstract # 2029025 – RAPID: Monitoring for SARS-CoV-2 in municipal wastewater and sewage to elucidate infection dynamics across major metropolitan areas of the United States. United States National Science Foundation. (May 12, 2020). Available online at:
A Compendium of U.S. Wastewater Surveillance for COVID-19 Public Health Efforts
89
https://www.nsf.gov/awardsearch/showAward?AWD_ID=2029025&HistoricalAwards=false. Accessed: April 15, 2021.
NSF. 2020p. Award abstract # 2027059 – RAPID: Determine community disease burden of COVID-19 by probing wastewater microbiome. United States National Science Foundation. (April 23, 2020). Available online at: https://www.nsf.gov/awardsearch/showAward?AWD_ID=2027059&HistoricalAwards=false. Accessed: July 7, 2021.
NSF. 2020q. Award abstract # 2029515 – RAPID: Determination of health risks and status from SARS-CoV-2 presence in urban water cycle. United States National Science Foundation. (May 14, 2020). Available online at: https://www.nsf.gov/awardsearch/showAward?AWD_ID=2029515&HistoricalAwards=false. Accessed: May 12, 2021.
NSF. 2020r. Award abstract # 2038087 – EAGER: RCN: Wastewater surveillance of SARS-CoV-2. United States National Science Foundation. (July 15, 2020). Available online at: https://www.nsf.gov/awardsearch/showAward?AWD_ID=2038087&HistoricalAwards=false. Accessed: April 15, 2021.
NSF. 2020s. Award abstract # 2029866 – RAPID: Identifying geographic and demographic drivers of rural disease transmission for improved modeling and decision making. United States National Science Foundation. (June 4, 2020). Available online at: https://www.nsf.gov/awardsearch/showAward?AWD_ID=2029866&HistoricalAwards=false. Accessed: May 13, 2021.
NSF. 2020t. Award abstract # 2041400 – SBIR phase I: Automated in-situ high-resolution COVID-19 wastewater-based epidemiology. United States National Science Foundation. (March 31, 2021). Available online at: https://www.nsf.gov/awardsearch/showAward?AWD_ID=2041400&HistoricalAwards=false. Accessed: May 13, 2021.
NSF. 2020u. Award abstract # 2033137 – RAPID COVID-19 DCL response: Wastewater pathogen tracking dashboard. United States National Science Foundation. (May 26, 2020). Available online at: https://www.nsf.gov/awardsearch/showAward?AWD_ID=2033137&HistoricalAwards=false. Accessed: May 13, 2021.
NSF. 2020v. Award abstract # 2034045 – RAPID-REU site: Mitigating the impact of COVID-19 pandemic on undergraduate research training in the biosciences. United States National Science Foundation. (June 2, 2020). Available online at: https://www.nsf.gov/awardsearch/showAward?AWD_ID=2034045&HistoricalAwards=false. Accessed: May 13, 2021.
Ohio. 2021. Meeting minutes with Ohio Water Resources Center and U.S. EPA Office of Research and Development about Ohio’s wastewater surveillance program. (February 16, 2021).
Ohio DOH. 2020; 2021. Ohio Coronavirus Wastewater Monitoring Network. Ohio Department of Health. (n.d.). Available online at: https://coronavirus.ohio.gov/wps/portal/gov/covid-19/dashboards/other-resources/wastewater. Accessed: April 15, 2021.

A Compendium of U.S. Wastewater Surveillance for COVID-19 Public Health Efforts
90
OHIO News. 2021. OHIO professors help monitor COVID-19 on campus with wastewater surveillance. (February 4, 2021). Available online at: https://www.ohio.edu/news/2021/02/ohio-professors-help-monitor-covid-19-campus-wastewater-surveillance. Accessed: August 4, 2021.
Oregon Health Authority. 2021. Oregon’s SARS-CoV-2 wastewater monitoring. (October 27, 2020). Available online at: https://public.tableau.com/profile/oregon.health.authority.covid.19#!/vizhome/OregonsSARS-CoV-2WastewaterMonitoring/WastewaterDashboard. Accessed: May 17, 2021.
OSHA. 2020. COVID-19 control and prevention, solid waste and wastewater management workers and employers. United States Occupational Safety and Health Administration. (n.d.). Available online at: https://www.osha.gov/coronavirus/control-prevention/solid-waste-wastewater-mgmt. Accessed: April 25, 2021.
Palm Springs. 2021. Wastewater treatment plant COVID-19 test reports. City of Palm Springs, California. (n.d.). Available online at: https://www.palmspringsca.gov/government/departments/community-economic-development-department/wastewater-treatment-plant-covid-19-test-reports. Accessed: May 17, 2021.
Pecson, B.M., Darby, E., Haas, C.N., Amha, Y.M., Bartolo, M., Danielson, R., Dearborn, Y., Di Giovanni, G., Ferguson, C., Fevig, S., Gaddis, E., Gray, D., Lukasik, G., Mull, B., Olivas, L., Olivieri, A., Qu, Y., and SARS-CoV-2 Interlaboratory Consortium. 2021. Reproducibility and sensitivity of 36 methods to quantify the SARS-CoV-2 genetic signal in raw wastewater: Findings from an interlaboratory methods evaluation in the U.S. Environ. Sci.: Water Res. Technol. 7, 504–520. (January 20, 2021). Available online at: https://pubs.rsc.org/en/content/articlehtml/2021/ew/d0ew00946f. Accessed: March 23, 2021.
Peters, Susan. 2021. Personal communication with Susan Peters. (March 22, 2021).
Qiagen. 2021. Wastewater testing for SARS-CoV-2. (n.d.). Available online at: https://www.qiagen.com/us/applications/infectious-disease/coronavirus/research-solutions/covid-wastewater-testing. Accessed: April 26, 2021.
Randall, Amber. 2020. The secret to COVID’s spread might be buried in wastewater. Sun Sentinel. (December 16, 2020). Available online at: https://www.sun-sentinel.com/coronavirus/fl-ne-fau-researchers-waste-water-coronavirus-cases-20201216-6kjjrcczrjhh5fynbenclo23xa-story.html. Accessed: May 17, 2021.
Rddad, Youssef. 2020. LSU researchers have been testing wastewater for coronavirus. Here’s what they found. The Advocate. (October 31, 2020). Available online at: https://www.theadvocate.com/baton_rouge/news/coronavirus/article_6875f9c2-1a04-11eb-8691-c35de508be2e.html. Accessed: May 18, 2021.
Rice. 2020. Rice helps give Houston early COVID-19 warnings. Rice University. (September 24, 2020). Available online at: https://news.rice.edu/2020/09/24/rice-helps-give-city-early-covid-19-warnings/. Accessed: April 12, 2021.
Santa Clara County. 2021. SARS-CoV-2 sewage monitoring data. Santa Clara County Public Health Department. (n.d.). Available online at: https://covid19.sccgov.org/dashboard-wastewater. Accessed: May 17, 2021.

A Compendium of U.S. Wastewater Surveillance for COVID-19 Public Health Efforts
91
Shah, Anvi. 2020. Wastewater surveillance could promote early COVID-19 detection. University of Southern California Viterbi School of Engineering. (May 28, 2020). Available online at: https://viterbischool.usc.edu/news/2020/05/wastewater-surveillance-could-promote-early-covid-19-detection/. Accessed: April 15, 2021.
Sherman, Lucille. 2020. A dirty job: NC researchers use wastewater to detect COVID-19 and understand it. The News & Observer. (December 28, 2020). Available online at: https://www.newsobserver.com/news/coronavirus/article247949710.html. Accessed: May 18, 2021.
Siena. 2020. Looking for clues in the toilet. Siena College. (September 4, 2020). Available online at: https://www.siena.edu/news/story/looking-for-clues-in-the-toilet/. Accessed: May 18, 2021.
St. John Fisher. 2020. Fisher implements wastewater saliva surveillance to boost COVID-19 detection. St. John Fisher College. (August 31, 2020). Available online at: https://www.sjfc.edu/news-and-events/news-archive/summer-2020/wastewater-saliva-surveillance-boost-detection/. Accessed: May 18, 2021.
St. Mary’s. 2021. COVID-19 virus in wastewater. St. Mary’s County Health Department. (n.d.). Available online at: https://smchd.org/covid-19-wastewater/. Accessed: May 18, 2021.
Stafford County. 2020. Stafford County participating in a COVID-19 mapping program pilot on the forefront of wastewater epidemiology. Stafford County, Virginia. (May 24, 2020). Available online at: https://fredericksburg.today/2020/05/24/stafford-county-participating-in-a-covid-19-mapping-program-pilot-on-the-forefront-of-wastewater-epidemiology/. Accessed: May 18, 2021.
Tempe. 2021a. COVID-19 wastewater results. Tempe, Arizona. (June 8, 2020). Available online at: https://tempegov.maps.arcgis.com/apps/dashboards/45f1871d65824746a46aa25ea5955a5f. Accessed: March 9, 2021.
Tempe. 2021b. Fighting coronavirus/COVID-19 with public health data: The city of Tempe and Arizona State University partner to study city wastewater to advance community health. Tempe, Arizona. (July 10, 2020). Available online at: https://storymaps.arcgis.com/stories/e6a45aad50c24e22b7285412d2d6ff2a. Accessed: March 9, 2021.
Tempe. 2021c. Fighting opioid misuse by monitoring community health: The city of Tempe and Arizona State University partner to study wastewater for public health information. Tempe, Arizona. (n.d.). Available online at: https://www.arcgis.com/apps/Cascade/index.html?appid=92073d7f6a6a498b987f2afdab1b9471. Accessed: March 9, 2021.
Tempe. 2021d. Tempe, Arizona. Meeting minutes with Tempe, Arizona, wastewater surveillance team. Tempe, Arizona. (February 9, 2021).
UC Berkeley. 2021. Coronavirus dashboard – wastewater. University of California, Berkeley. (n.d.). Available online at: https://coronavirus.berkeley.edu/dashboard/wastewater/. Accessed: May 17, 2021.
UC Merced. 2021. COVIDPoops19 summary of global SARS-CoV-2 wastewater monitoring efforts by UC Merced researchers. University of California, Merced. (n.d.). Available online at: https://ucmerced.maps.arcgis.com/apps/opsdashboard/index.html#/c778145ea5bb4daeb58d31afee389082. Accessed: May 10, 2021.

A Compendium of U.S. Wastewater Surveillance for COVID-19 Public Health Efforts
92
UC San Diego. 2021. UC San Diego COVID-19 daily dashboard – wastewater monitoring dashboard. University of California, San Diego. (n.d.). Available online at: https://returntolearn.ucsd.edu/dashboard/index.html. Accessed: May 17, 2021.
UC San Diego. 2020a. Wastewater detection of SARS CoV-2, campus notice: Office of the Chancellor. University of California, San Diego. (September 5, 2020). Available online at: https://returntolearn.ucsd.edu/news-and-updates/wastewater-detection-sept-5.html. Accessed: April 15, 2021.
UConn. 2021. Storrs campus wastewater testing results. University of Connecticut. (n.d.). Available online at: https://covid-testing.uconn.edu/dashboard/#. Accessed: May 17, 2021.
UGA. 2021. Wastewater surveillance for SARS-CoV-2 in Athens, GA. University of Georgia. (July 2, 2021). Available online at: https://www.covid19.uga.edu/wastewater-athens.html. Accessed: May 17, 2021.
UIC. 2020. Tracking coronavirus in wastewater and sewers. University of Illinois, Chicago. (September 28, 2020). Available online at: https://publichealth.uic.edu/news-stories/tracking-coronavirus-in-wastewater-and-sewers/. Accessed: May 18, 2021.
UMD. 2020. Monitoring wastewater for COVID-19. University of Maryland – A. James Clark School of Engineering. (August 31, 2020). Available online at: https://eng.umd.edu/news/story/monitoring-wastewater-for-covid19. Accessed: May 18, 2021.
UMich. 2020. Researchers look for coronavirus in campus environment, potential links to infection risks. University of Michigan School of Public Health. (August 28, 2020). Available online at: https://sph.umich.edu/news/2020posts/researchers-look-for-coronavirus-in-campus-environment.html. Accessed: May 18, 2021.
UNC Charlotte. 2020. UNC Charlotte’s campus-based early detection research system aims to prevent COVID-19 spread. University of North Carolina at Charlotte. (August 31, 2020). Available online at: https://inside.uncc.edu/unc_charlotte_wastewater_covid-19_testing. Accessed: May 18, 2021.
UNH. 2020. Flushing out COVID-19: UNH research tests campus wastewater for virus surveillance. University of New Hampshire. (October 28, 2020). Available online at: https://www.unh.edu/unhtoday/2020/10/flushing-out-covid-19. Accessed: May 18, 2021.
University of Arizona. 2021. Meeting minutes with the University of Arizona wastewater surveillance team. (February 16, 2021).
University of Arizona. 2020a. Wastewater testing at UArizona stops coronavirus spread; garners national attention. University of Arizona Water & Energy Sustainable Technology Center. (August 31, 2020). Available online at: https://west.arizona.edu/news/2020/08/wastewater-testing-uarizona-stops-coronavirus-spread-garners-national-attention. Accessed: March 17, 2021.
University of Arizona. 2020b. WEST monitors wastewater to keep campus safe. University of Arizona Water & Energy Sustainable Technology Center. (August 24, 2020). Available online at: https://west.arizona.edu/news/2020/08/west-monitors-wastewater-keep-campus-safe. Accessed: March 17, 2021.

A Compendium of U.S. Wastewater Surveillance for COVID-19 Public Health Efforts
93
University of Kansas. 2020. KU, KDHE partner to trace COVID-19 in wastewater treatment plants. (May 4, 2020). Available online at: http://news.ku.edu/ku-partners-kansas-department-health-environment-trace-covid-19-wastewater-treatment-plants. Accessed: May 17, 2021.
University of Notre Dame. 2021. Wastewater Surveillance for SARS-CoV-2. NSF Research Coordination Network. (n.d.). Available online at: https://sites.nd.edu/rcn-wastewater-sarscov2/about-us/. Accessed: April 25, 2021.
USC. 2021. Meeting minutes from call between EPA and University of Southern California wastewater surveillance team. University of Southern California. (March 2, 2021).
USU. 2021. Wastewater monitoring for COVID-19. Utah State University. (n.d.). Available online at: https://www.usu.edu/covid-19/operations/wastewater. Accessed: May 18, 2021.
Utah DEQ. 2021. Utah DEQ SARS-CoV-2 sewage monitoring. Utah Department of Environmental Quality. (March 12, 2021). Available online at: https://deq.utah.gov/water-quality/sars-cov-2-sewage-monitoring. Accessed: April 15, 2021.
Water Action Platform. 2021. (n.d.). Available online at: https://www.wateractionplatform.com/. Accessed: April 15, 2021.
WaterWorld. 2020. A secret weapon in the fight against COVID-19. (October 13, 2020). Available online at: https://www.waterworld.com/wastewater/article/14184342/a-secret-weapon-in-the-fight-against-covid19. Accessed: May 17, 2021.
Watkins, Katie. 2021. A key tool in Houston’s research on COVID-19 Variants? Your poop. (May 10, 2021). Available online at: https://www.houstonpublicmedia.org/articles/news/health-science/2021/05/10/397734/tracking-covid-19-in-your-poop/. Accessed: August 4, 2021.
WEF. 2021a. CDC to expand use of wastewater-based disease surveillance with Water Environment Federation. Water Environment Federation. (April 13, 2021). Available online at: https://www.wef.org/resources/pressroom/press-releases2/wef-press-releases/cdc-to-expand-use-ofwastewater-based-disease-surveillance-with-water-environment-federation/. Accessed: April 30, 2021.
WEF. 2021b. Network of wastewater-based epidemiology. Water Environment Federation. (April 12, 2021). Available online at: http://nwbe.org/. Accessed: June 25, 2021.
WEF. 2021c. Personal communication with Lisa McFadden. Water Environment Federation. (June 21, 2021).
WEF. 2021d. Current priority: Coronavirus. Water Environment Federation. (July 5, 2021). Available online at: https://www.wef.org/news-hub/current-priorities/coronavirus/. Accessed: April 15, 2021.
WEF. 2020a. The water professional’s guide to COVID-19. Water Environment Federation. (February 11, 2020). Available online at: https://www.wef.org/news-hub/wef-news/the-water-professionals-guide-to-the-2019-novel-coronavirus/. Accessed: April 15, 2021.
WEF. 2020b. Water Environment Federation. Protecting Wastewater Professionals from COVID-19 and Other Biological Hazards. (2020). Available online at: https://www.ae2s.com/pdfs/Protecting_Wastewater_Professionals_from_COVID-19_and_Other_Biological_Hazards.pdf. Accessed: April 25, 2021.

A Compendium of U.S. Wastewater Surveillance for COVID-19 Public Health Efforts
94
Whitman, Wende. 2020. University of Virginia. Evidence of COVID-19. (October 1, 2020). Available online at: https://engineering.virginia.edu/news/2020/10/inside-science-testing-wastewater-uva-evidence-covid-19. Accessed: May 18, 2021.
WHO. 2020. World Health Organization. Status of environmental surveillance for SARS-CoV-2 virus. (August 5, 2020). Available online at: https://www.who.int/publications/i/item/WHO-2019-nCoV-sci-brief-environmentalSampling-2020-1. Accessed: April 15, 2021.
WHO. 2017. World Health Organization. WHO guidelines on ethical issues in public health surveillance. World Health Organization. (2017). Available online at: https://apps.who.int/iris/rest/bitstreams/1085882/retrieve. Accessed: April 15, 2021.
Winn, Zach. 2020. MIT News. MIT begins testing wastewater to help detect COVID-19 on campus. (October 2, 2020). Available online at: https://news.mit.edu/2020/testing-wastewater-covid-19-1002. Accessed: May 18, 2021.
Wisconsin DOHS. 2020; 2021. COVID-19: Wisconsin Coronavirus Wastewater Monitoring Network. Wisconsin Department of Health Services. (June 27, 2021). Available online at: https://www.dhs.wisconsin.gov/covid-19/wastewater.htm. Accessed: April 15, 2021.
Wölfel, R., Corman, V.M., Guggemos, W., Seilmaier, M., Zange, S., Müller, M.A., Niemeyer, D., Jones, T. C., Vollmar, P., Rothe, C., Hoelscher, M., Bleicker, T., Brünink, S., Schneider, J., Ehmann, R., Zwirglmaier, K., Drosten, C., Wendtner, C. 2020. Virological assessment of hospitalized patients with COVID-2019. Nature 581, 465–469 (April 1, 2020). Available online at: https://doi.org/10.1038/s41586-020-2196-x. Accessed: May 12, 2021.
WRF. 2021a. COVID-19 wastewater surveillance symposium – a global update. Water Research Foundation. (April 26, 2021). Available online at: https://www.waterrf.org/resource/covid-19-wastewater-surveillance-symposium-global-update/. Accessed: May 10, 2021.
WRF. 2021b. COVID-19 guidance and resources. Water Research Foundation. (n.d.). Available online at: https://www.waterrf.org/covid-19-guidance-and-resources. Accessed: April 15, 2021.
WRF. 2020a. Virtual International Water Research Summit on COVID-19. Water Research Foundation. (May 22, 2020). Available online at: https://www.waterrf.org/event/virtual-international-water-research-summit-covid-19. Accessed: April 15, 2021.
WRF. 2020b. The Water Research Foundation announces new COVID-19 research effort. Water Research Foundation. (May 12, 2020). Available online at: https://www.waterrf.org/news/water-research-foundation-announces-new-covid-19-research-effort. Accessed: April 15, 2021.
WRF. 2020c. Request for qualifications: Interlaboratory and methods assessment of the SARS-CoV-2 genetic signal in wastewater (WRF 5089). Water Research Foundation. (June 19, 2020). Available online at: https://www.waterrf.org/sites/default/files/file/2020-06/RFQ_5089.pdf. Accessed: April 15, 2021.
WRF. 2020d. The Water Research Foundation names Trussell Technologies as lead researcher for COVID-19 study. Water Research Foundation. (July 6, 2020). Available online at: https://www.waterrf.org/news/water-research-foundation-names-trussell-technologies-lead-researcher-covid-19-study. Accessed: April 15, 2021.

A Compendium of U.S. Wastewater Surveillance for COVID-19 Public Health Efforts
95
WRF. 2020e. Project #5089 – interlaboratory and methods assessment of the SARS-CoV-2 genetic signal in wastewater. Water Research Foundation. (July 15, 2020). Available online at: https://www.waterrf.org/research/projects/interlaboratory-and-methods-assessment-sars-cov-2-genetic-signal-wastewater. Accessed: April 15, 2021.
WRF. 2020f. Request for qualifications: Understanding the factors that affect the detection and variability of SARS-CoV-2 in wastewater (WRF 5093). Water Research Foundation. (August 10, 2020). Available online at: https://www.waterrf.org/sites/default/files/file/2020-08/RFQ_5093.pdf. Accessed: April 15, 2021.
WRF. 2020g. WRF Names UC Irvine as lead researcher for SARS-CoV-2 study. Water Research Foundation. (October 21, 2020). Available online at: https://www.waterrf.org/news/wrf-names-uc-irvine-lead-researcher-sars-cov-2-study. Accessed: April 15, 2020.
WRF. 2020h. Project #5093 – understanding the factors that affect the detection and variability of SARS-CoV-2 in wastewater. Water Research Foundation. (July 1, 2020). Available online at: https://www.waterrf.org/research/projects/understanding-factors-affect-detection-and-variability-sars-cov-2-wastewater. Accessed: April 15, 2021.
WRF. 2020i. Project #5029 – environmental persistence and disinfection of the Lassa virus and SARS-CoV-2 to protect worker and public safety. Water Research Foundation. (September 1, 2019). Available online at: https://www.waterrf.org/research/projects/environmental-persistence-and-disinfection-lassa-virus-and-sars-cov-2-protect. Accessed: April 15, 2021.
WRF. 2020j. Wastewater Surveillance of the COVID-19 Genetic Signal in Sewersheds Recommendations from Global Experts. Water Research Foundation. (n.d.). Available online at: https://www.waterrf.org/sites/default/files/file/2020-06/COVID-19_SummitHandout-v3b.pdf. Accessed: April 15, 2021.
WRF. 2020k. Executive summary: Interlaboratory and methods assessment of the SARS-CoV-2 genetic signal in wastewater (project 5089). Water Research Foundation. (November 2020). Available online at: https://www.waterrf.org/system/files/resource/2020-11/EXECSUM-5089.pdf. Accessed: April 15, 2021.
WRF. 2020l. Best practices for collection and storage of wastewater samples to support wastewater surveillance of the COVID-19 signal in sewersheds. Water Research Foundation. (n.d.). Available online at: https://www.waterrf.org/sites/default/files/file/2020-06/COVID-19_FieldSampleCollectionForm.pdf. Accessed: April 15, 2021.
Wu, F., Xiao, A., Zhang, J., Gu X., Lee W., Kauffman, K., Hanage, W., Matus, M., Ghaeli, N., Endo, N., Duvallet, C., Poyet, M., Moniz, K., Washburne, A., Erickson, T., Chai, P., Thompson, J., and Alm, E.J. 2020. SARS-CoV-2 titers in wastewater are higher than expected from clinically confirmed cases. medRxiv 5(4). (July 21, 2020). Available online at: https://pubmed.ncbi.nlm.nih.gov/32694130/.
Wyoming. 2021. Meeting minutes with the Wyoming wastewater surveillance team. (February 10, 2021).
Wyoming PHL. 2021. Wyoming COVID-19 wastewater monitor. Wyoming Public Health Laboratory. (n.d.). Available online at: https://covidwastewatermonitor.wyo.gov/. Accessed: February 26, 2021.

A Compendium of U.S. Wastewater Surveillance for COVID-19 Public Health Efforts
96
Yale University. 2021a. Yale Covid-19 wastewater tracker. Yale University and State of Connecticut's Department of Health. (n.d.). Available online at: https://yalecovidwastewater.com/reports. Accessed: April 15, 2021.
Yale University. 2021b. Yale Covid-19 wastewater tracker FAQs. Yale University and State of Connecticut's Department of Health. (n.d.). Available online at: https://yalecovidwastewater.com/faq. Accessed: April 15, 2021.
YBSD. 2021. Kendall County COVID-19 in wastewater dashboard. Yorkville Bristol Sanitary District. (n.d.). Available online at: https://portal.rjngroup.com/arcgisportal/apps/opsdashboard/index.html#/594d4b1b2dd840958cedb50b1381982b. Accessed: May 18, 2021.
Zacharias, Serena. 2020. Residents of Lyons Hall report for surveillance testing after COVID-19 genetic material found in wastewater. The Observer. (September 21, 2020). Available online at: https://ndsmcobserver.com/2020/09/residents-of-lyons-hall-report-for-surveillance-testing-after-covid-19-genetic-material-found-in-wastewater/. Accessed: May 18, 2021.
Zhou, N.A., Tharpe, C., Meschke, J.S., and Ferguson, C.M. 2021. Survey of rapid development of environmental surveillance methods for SARS-CoV-2 detection in wastewater. Science of the Total Environment, 769, 144852. (May 15, 2021). Available online at: https://doi.org/10.1016/j.scitotenv.2020.144852. Accessed: May 17, 2021.
Zobel, Sarah. 2020. Wastewater surveillance targets critical locations for COVID-19. Tulane University School of Public Health and Tropical Medicine. (October 22, 2020). Available online at: https://sph.tulane.edu/news/wastewater-surveillance-targets-critical-locations-covid-19. Accessed: May 18, 2021.
Zymo. 2021. Zymo Environ Water RNA Kit for SARS-CoV-2 wastewater surveillance. Zymo Research Cooperation. (n.d.). Available online at: https://www.zymoresearch.com/pages/zymo-environ-water-rna-kit. Accessed: April 26, 2021.
A Compendium of U.S. Wastewater Surveillance for COVID-19 Public Health Efforts
Appendix A. Summary of Wastewater Surveillance Programs
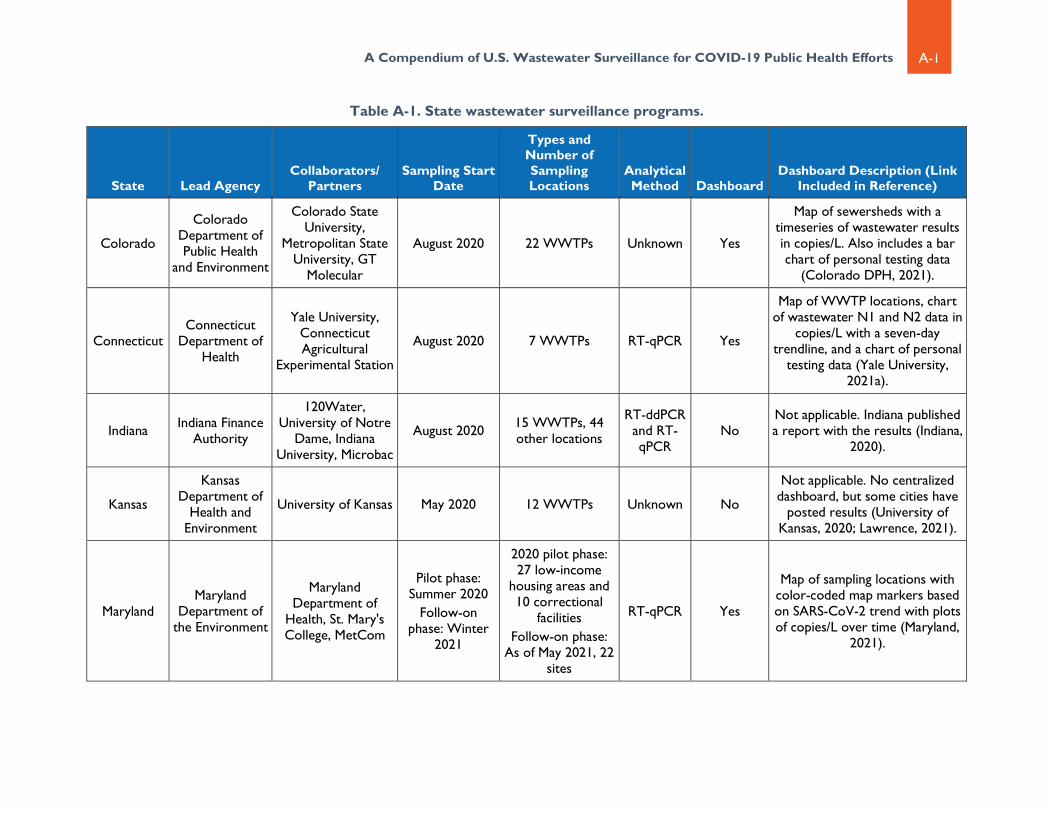
A Compendium of U.S. Wastewater Surveillance for COVID-19 Public Health Efforts
A-1
Table A-1. State wastewater surveillance programs.
State Lead Agency Collaborators/
Partners Sampling Start
Date
Types and Number of Sampling Locations
Analytical Method Dashboard
Dashboard Description (Link Included in Reference)
Colorado
Colorado Department of Public Health
and Environment
Colorado State University,
Metropolitan State University, GT
Molecular
August 2020 22 WWTPs Unknown Yes
Map of sewersheds with a timeseries of wastewater results in copies/L. Also includes a bar chart of personal testing data
(Colorado DPH, 2021).
Connecticut Connecticut
Department of Health
Yale University, Connecticut Agricultural
Experimental Station
August 2020 7 WWTPs RT-qPCR Yes
Map of WWTP locations, chart of wastewater N1 and N2 data in
copies/L with a seven-day trendline, and a chart of personal
testing data (Yale University, 2021a).
Indiana Indiana Finance Authority
120Water, University of Notre
Dame, Indiana University, Microbac
August 2020 15 WWTPs, 44 other locations
RT-ddPCR and RT-qPCR
No Not applicable. Indiana published a report with the results (Indiana,
2020).
Kansas
Kansas Department of
Health and Environment
University of Kansas May 2020 12 WWTPs Unknown No
Not applicable. No centralized dashboard, but some cities have
posted results (University of Kansas, 2020; Lawrence, 2021).
Maryland Maryland
Department of the Environment
Maryland Department of
Health, St. Mary's College, MetCom
Pilot phase: Summer 2020
Follow-on phase: Winter
2021
2020 pilot phase: 27 low-income
housing areas and 10 correctional
facilities Follow-on phase:
As of May 2021, 22 sites
RT-qPCR Yes
Map of sampling locations with color-coded map markers based on SARS-CoV-2 trend with plots of copies/L over time (Maryland,
2021).

A Compendium of U.S. Wastewater Surveillance for COVID-19 Public Health Efforts
A-2
Table A-1. State wastewater surveillance programs.
State Lead Agency Collaborators/
Partners Sampling Start
Date
Types and Number of Sampling Locations
Analytical Method Dashboard
Dashboard Description (Link Included in Reference)
Michigan
Michigan Department of
Health and Human Services
Michigan Environment, Great Lakes, and Energy;
universities
September 2020 270 WWTPs and facilities RT-ddPCR Yes
Map of testing sites and relevant detail such as lab name, grant award and amount, start date, sample type, and partner name
(Michigan EGLE, 2021).
Missouri
Missouri Department of
Health and Senior Services
Missouri Department of
Natural Resources, University of
Missouri
July 2020 50 WWTPs Unknown Yes
Map of WWTPs with color-coded points based on
wastewater trend, and a timeseries plot of viral copies/day
(Missouri DHSS, 2021).
New Mexico New Mexico Environment Department
None December 2020 22 congregate facilities Unknown Yes
Timeseries plots of copies/L sampling results over time for each facility, along with current
level of concern and current trend (NMED, 2021a).
North Dakota
North Dakota Department of Environmental
Quality
North Dakota State University July 2020 21 WWTPs Unknown No
Not applicable. No public dashboard (Dura, 2020; Cooper,
2021).
Ohio Ohio
Department of Health
Ohio EPA, Ohio WRC, U.S. EPA, and other participating
universities
July 2020 66 WWTPs Unknown Yes
A map of WWTPs color-coded to show the status of SARS-CoV-2 in wastewater (e.g., increasing). Also includes a timeseries plot for each WWTP with showing
million gene copies/day and average N2 gene copies/L over
time (Ohio DOH, 2020).

A Compendium of U.S. Wastewater Surveillance for COVID-19 Public Health Efforts
A-3
Table A-1. State wastewater surveillance programs.
State Lead Agency Collaborators/
Partners Sampling Start
Date
Types and Number of Sampling Locations
Analytical Method Dashboard
Dashboard Description (Link Included in Reference)
Oregon Oregon Health Authority
Oregon State University August 2020 42 WWTPs Unknown Yes
Map of WWTPs that indicates whether SARS-CoV-2 was
detected or not detected in the week of monitoring; can adjust
the date to see over time (Oregon Health Authority, 2021).
Utah
Utah Department of Environmental
Quality
Utah Department of Health. University of
Utah, Utah State University, and Brigham Young
University
April 2020 42 WWTPs Unknown Yes
Map of WWTP sewersheds with timeseries plot of wastewater
data in million gene copies/person/day and daily new
individual testing cases (Utah DEQ, 2021).
Wisconsin Wisconsin
Department of Health Services
Wisconsin State Lab of Hygiene,
University of Wisconsin-Milwaukee
October 2020 65 WWTPs,
including 4 tribal WWTPs
Unknown Yes
Map of WWTP sewersheds with a timeseries plot of SARS-CoV-2 in million gene copes/person/day
and the seven-day average individual case rate of COVID-19
(Wisconsin DOHS, 2020).
Wyoming Wyoming Public
Health Laboratory
Wyoming Department of
Health, University of Wyoming, Wyoming Association of Rural
Water Systems
July 2020 34 WWTPs and 13 facilities RT-qPCR Yes
Map of WWTPs color coded by percent of modeled prevalence of
COVID-19 infections based on wastewater results. Also includes
timeseries plots of modeled prevalence, Ct count, and
copies/mL for WWTPs and facilities (Wyoming PHL, 2021)

A Compendium of U.S. Wastewater Surveillance for COVID-19 Public Health Efforts
A-4
Table A-2. Municipality and university wastewater surveillance programs.
Locality Name or Academic Institution State
Collaborators/ Partners
Sampling Start Date
Types and Number of Sampling Locations
Analytical Method Dashboard? Dashboard Description
University of Alaska–Anchorage AK Unknown—program details were not researched (see Section 3)
University of Alaska–Fairbanks AK Unknown—program details were not researched (see Section 3)
Birmingham Southern College AL Unknown—program details were not researched (see Section 3)
University of Arkansas AR Unknown—program details were not researched (see Section 3)
Gilbert AZ Arizona State University May 2020 3 areas in
collection system RT-qPCR Yes
Map of sewershed areas for each sample location with a timeseries
bar chart with average weekly results in copies/L (Gilbert,
2021).
Tempe and Guadalupe AZ Arizona State
University March 2020 8 WWTPs and sewersheds RT-qPCR Yes
Map of sewershed areas for each sample location with a timeseries bar charts with average weekly
results in copies/L (Tempe, 2021a).
University of Arizona AZ University of
Nevada- Las Vegas March 2020 18 dorms RT-qPCR No
Not Applicable. No public dashboard (University of
Arizona, 2020a; University of Arizona, 2020b; University of
Arizona, 2021).
University of Northern Arizona AZ Unknown—program details were not researched (see Section 3)

A Compendium of U.S. Wastewater Surveillance for COVID-19 Public Health Efforts
A-5
Table A-2. Municipality and university wastewater surveillance programs.
Locality Name or Academic Institution State
Collaborators/ Partners
Sampling Start Date
Types and Number of Sampling Locations
Analytical Method Dashboard? Dashboard Description
Navajo Nation AZ Unknown—program details were not researched (see Section 3)
Alameda County CA Unknown—program details were not researched (see Section 3)
City of Davis CA University of California - Davis
November 2020 11 sewersheds Unknown Yes
Timeseries plot for each sewershed with virus
concentration normalized to fecal strength, city-wide wastewater results, and
detection limit (Healthy Davis Together, 2021).
City of Palm Springs CA GT Molecular August 2020 1 WWTP Unknown Yes
Weekly reports with timeseries plots of copies/L and trendline; includes significant events. Also
evaluating for variants (Palm Springs, 2021).
Contra Costa County CA Unknown—program details were not researched (see Section 3)
Loma Linda University CA Unknown—program details were not researched (see Section 3)
Los Angeles County Sanitation Districts CA
University of Arizona,
California State Water Resources
Control Board
August 2020 2 WWTPs Unknown Yes
Timeseries plots with weekly average copies/L, seven-day
average new COVID-19 cases, and three-day average LA
County hospitalizations (LA County, 2021).
Marin County CA Unknown—program details were not researched (see Section 3)

A Compendium of U.S. Wastewater Surveillance for COVID-19 Public Health Efforts
A-6
Table A-2. Municipality and university wastewater surveillance programs.
Locality Name or Academic Institution State
Collaborators/ Partners
Sampling Start Date
Types and Number of Sampling Locations
Analytical Method Dashboard? Dashboard Description
Mariposa County CA Biobot Analytics May 2020 3 locations Unknown Yes
Timeseries plots with data from each of the three sampling
locations as virus concentration/L (Mariposa
County, 2021).
San Francisco County CA Unknown—program details were not researched (see Section 3)
Santa Clara County CA
Santa Clara County
Department of Environmental Health, City of
Palo Alto, City of San Jose,
Sunnyvale, Gilroy, Stanford
University
October 2020 4 WWTPs Unknown Yes
Timeseries plot for each WWTP with the S and N genes
normalized to pepper mild mottle virus (Santa Clara
County, 2021).
Stanford University CA Unknown—program details were not researched (see Section 3)
University of California–Berkeley CA None August 2020 5 locations on
campus RT-qPCR Yes
Map of sampling locations with icons indicating detected or not
detected SARS-CoV-2 or no sample collected (UC Berkeley,
2021).
University of California–Irvine CA Unknown—program details were not researched (see Section 3)
University of California–Merced CA Unknown—program details were not researched (see Section 3)
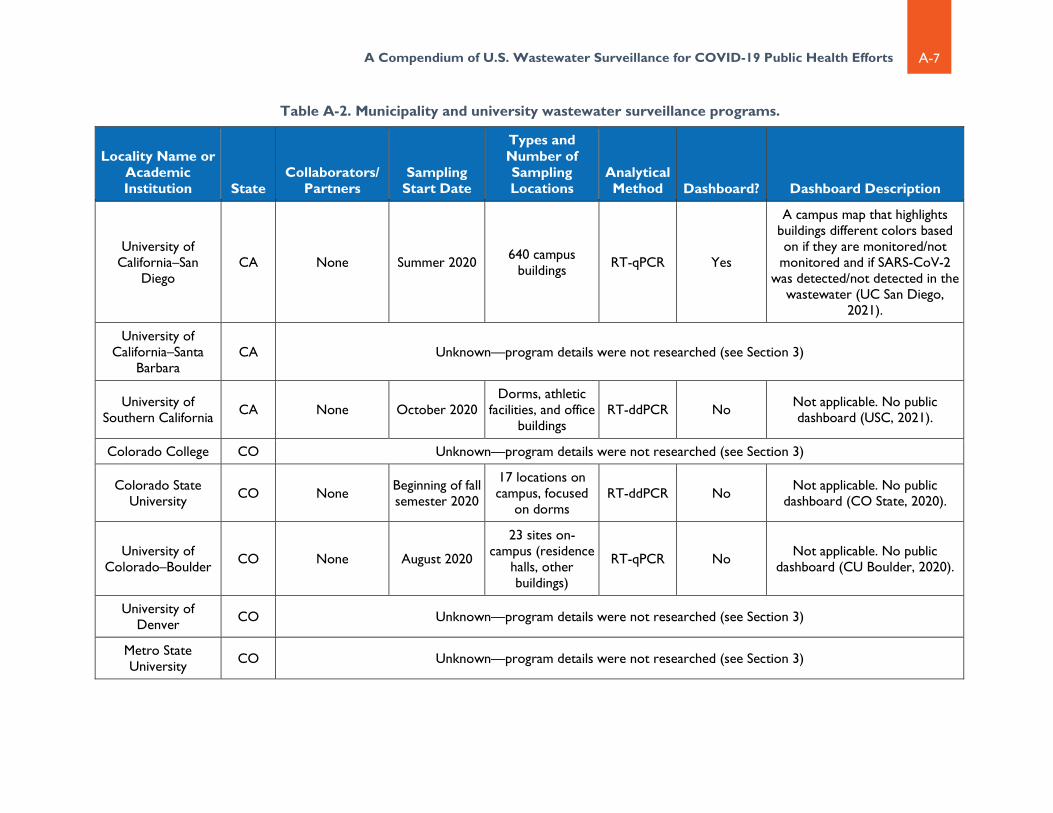
A Compendium of U.S. Wastewater Surveillance for COVID-19 Public Health Efforts
A-7
Table A-2. Municipality and university wastewater surveillance programs.
Locality Name or Academic Institution State
Collaborators/ Partners
Sampling Start Date
Types and Number of Sampling Locations
Analytical Method Dashboard? Dashboard Description
University of California–San
Diego CA None Summer 2020 640 campus
buildings RT-qPCR Yes
A campus map that highlights buildings different colors based on if they are monitored/not
monitored and if SARS-CoV-2 was detected/not detected in the
wastewater (UC San Diego, 2021).
University of California–Santa
Barbara CA Unknown—program details were not researched (see Section 3)
University of Southern California CA None October 2020
Dorms, athletic facilities, and office
buildings RT-ddPCR No Not applicable. No public
dashboard (USC, 2021).
Colorado College CO Unknown—program details were not researched (see Section 3)
Colorado State University CO None Beginning of fall
semester 2020
17 locations on campus, focused
on dorms RT-ddPCR No Not applicable. No public
dashboard (CO State, 2020).
University of Colorado–Boulder CO None August 2020
23 sites on-campus (residence
halls, other buildings)
RT-qPCR No Not applicable. No public dashboard (CU Boulder, 2020).
University of Denver CO Unknown—program details were not researched (see Section 3)
Metro State University CO Unknown—program details were not researched (see Section 3)

A Compendium of U.S. Wastewater Surveillance for COVID-19 Public Health Efforts
A-8
Table A-2. Municipality and university wastewater surveillance programs.
Locality Name or Academic Institution State
Collaborators/ Partners
Sampling Start Date
Types and Number of Sampling Locations
Analytical Method Dashboard? Dashboard Description
University of Connecticut CT None June 2020 1 WWTP and 14
buildings RT-qPCR Yes
Timeseries plot of the ratio of the E and N1 genes to a fecal indicator virus on collection
dates for each of the sampling locations (UConn, 2021).
University of Hartford CT Unknown—program details were not researched (see Section 3)
Howard University DC Unknown—program details were not researched (see Section 3)
New Castle County DE Biobot Analytics,
University of Delaware
April 2020 3 WWTPs and sewersheds PCR Yes
Timeseries plot of the aggregate sewer system viral copies/L and
rolling seven-day average confirmed COVID-19 cases. Also includes latest viral copes/L for
each sampling location and timeseries plots of viral copies/L
with 95% confidence interval shading for each sampling result. Also includes sewershed maps
for each sampling location (NCCo, 2021).
Broward County FL Unknown—program details were not researched (see Section 3)
Florida Atlantic University FL None March 2020 Campus lift
stations PCR No Not applicable. No public dashboard (Randall, 2020).

A Compendium of U.S. Wastewater Surveillance for COVID-19 Public Health Efforts
A-9
Table A-2. Municipality and university wastewater surveillance programs.
Locality Name or Academic Institution State
Collaborators/ Partners
Sampling Start Date
Types and Number of Sampling Locations
Analytical Method Dashboard? Dashboard Description
Loxahatchee River District FL
Biobot Analytics, Florida
Department of Health
May 2020 1 WWTP qPCR Yes
Timeseries plots with copies/L in log scale and linear scale are
compared to new clinical cases and seven-day rolling average
clinical cases (LRD, 2021).
Miami-Dade County FL Biobot Analytics March 2020 3 WWTPs Unknown No Not applicable. No public dashboard (WaterWorld, 2020).
Ringling College of Art and Design FL Unknown—program details were not researched (see Section 3)
Rollins College FL Unknown—program details were not researched (see Section 3)
University of Florida FL Unknown—program details were not researched (see Section 3)
Athens-Clarke County GA University of
Georgia June 2020 3 WWTPs RT-PCR Yes
Timeseries plot of total viral copies with a 95% confidence interval, predicted total viral copies, along with daily and seven-day rolling average
COVID-19 reported cases (UGA, 2021).
Emory University GA Unknown—program details were not researched (see Section 3)
University of Hawaii–Manoa HI Unknown—program details were not researched (see Section 3)
City of Boise ID University of
Missouri, Boise State University
May 2020 2 WWTPs Unknown Yes
Timeseries plot with wastewater results in copies/L and a plot of
confirmed and probable COVID-19 cases (Boise, 2021).

A Compendium of U.S. Wastewater Surveillance for COVID-19 Public Health Efforts
A-10
Table A-2. Municipality and university wastewater surveillance programs.
Locality Name or Academic Institution State
Collaborators/ Partners
Sampling Start Date
Types and Number of Sampling Locations
Analytical Method Dashboard? Dashboard Description
City of Moscow ID Biobot Analytics,
University of Idaho
May 2020 1 WWTP RT-PCR No Not applicable. No public dashboard (Argonaut, 2020).
Twin Falls ID Unknown—program details were not researched (see Section 3)
University of Idaho ID None May 2020 9 campus locations RT-PCR No Not applicable. No public
dashboard (Argonaut, 2020).
Chicago IL
University of Illinois - Chicago, Northwestern
University, Argonne National
Laboratory, Metropolitan
Water Reclamation District of
Greater Chicago, Chicago
Department of Public Health
Unknown 3 WWTPs and sewersheds Unknown No Not applicable. No public
dashboard available (UIC, 2020).
Kendell County IL
Yorkville-Bristol Sanitary District, RJN Group, GT
Molecular
November 2020 1 WWTP Unknown Yes
Map with WWTP sewershed, timeseries plot of virus
concentration and number of positive COVID-19 tests and average COVID-19 positivity
percent for Kendall County. Also includes wastewater result trend
(YBSD, 2021).

A Compendium of U.S. Wastewater Surveillance for COVID-19 Public Health Efforts
A-11
Table A-2. Municipality and university wastewater surveillance programs.
Locality Name or Academic Institution State
Collaborators/ Partners
Sampling Start Date
Types and Number of Sampling Locations
Analytical Method Dashboard? Dashboard Description
Northern Illinois University IL Unknown—program details were not researched (see Section 3)
University of Illinois at Chicago–School of Public Health
IL Unknown—program details were not researched (see Section 3)
City of Carmel IN
Biobot Analytics, University of Notre Dame, Pace Analytical
May 2020 1 WWTP Unknown No Not applicable. No public
dashboard available (Carmel, 2020).
University of Notre Dame IN None July 2020 Throughout
campus RT-ddPCR No Not applicable. No public
dashboard available (Zacharias, 2020).
City of Lawrence KS University of Kansas June 2020 2 WWTPs Unknown Yes
Map of the sewersheds for each WWTP along with interactive
timeseries plots with the N1 and N2 copies/L and average in
copies/day, along with the 14-day rolling average new COVID-19
cases (Lawrence, 2021).
University of Kentucky KY None September
2020 Campus dorms PCR No Not applicable. No public
dashboard available (Chapin, 2020).
University of Louisville KY Unknown—program details were not researched (see Section 3)
Murray State University KY Unknown—program details were not researched (see Section 3)

A Compendium of U.S. Wastewater Surveillance for COVID-19 Public Health Efforts
A-12
Table A-2. Municipality and university wastewater surveillance programs.
Locality Name or Academic Institution State
Collaborators/ Partners
Sampling Start Date
Types and Number of Sampling Locations
Analytical Method Dashboard? Dashboard Description
Louisiana State University LA Baton Rouge June 2020
Throughout campus and surrounding community
qPCR No Not applicable. No public
dashboard available (Rddad, 2020).
Tulane University LA New Orleans January 2020
Throughout campus and surrounding community
Unknown No Not applicable. No public
dashboard available (Zobel, 2020).
Massachusetts Institute of Technology
MA None October 2020 7 campus buildings RT-qPCR No Not applicable. No public
dashboard available (Winn, 2020).
Northeastern University MA Unknown—program details were not researched (see Section 3)
Town and County of Nantucket MA Biobot Analytics April 2020 1 WWTP RT-qPCR Yes
PDF with weekly results that includes a timeseries plot of viral copies/L sewage with the daily
and seven-day rolling average of new COVID-19 cases. Also
includes comparisons of wastewater to samples
nationwide. Includes Biobot's COVID-19 incidence estimate of
new cases/day based on the wastewater results (Nantucket,
2021).
University of Massachusetts
Lowell MA Unknown—program details were not researched (see Section 3)
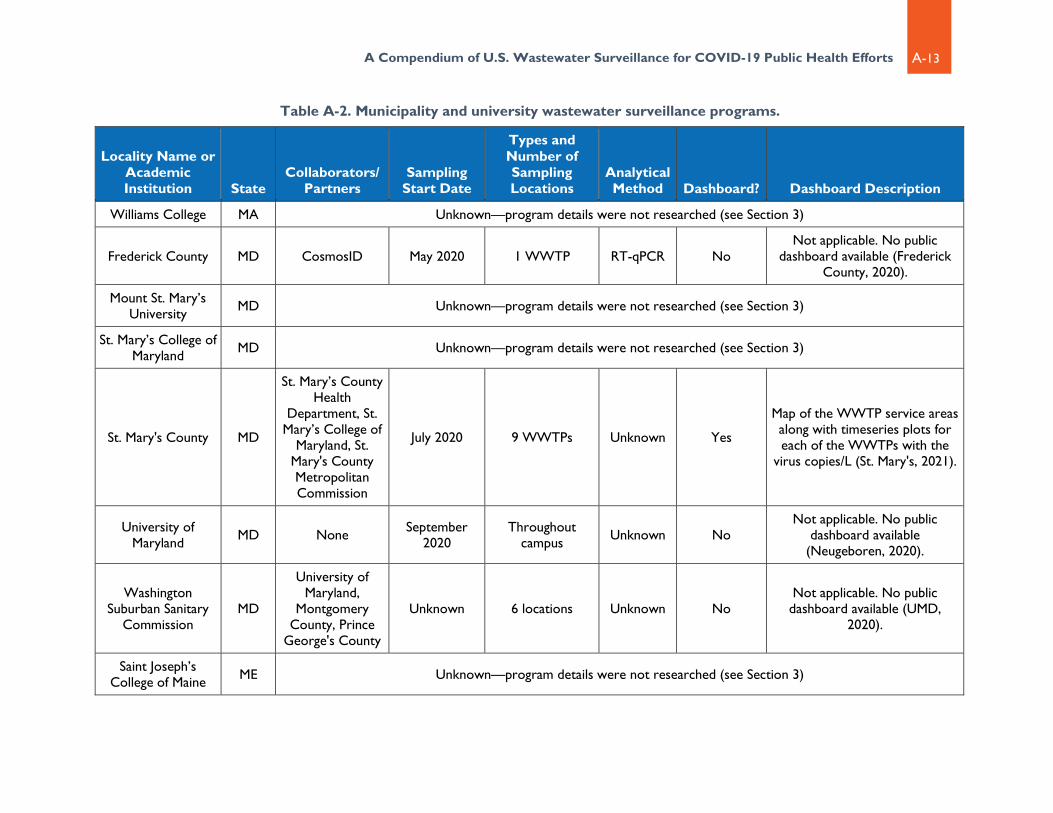
A Compendium of U.S. Wastewater Surveillance for COVID-19 Public Health Efforts
A-13
Table A-2. Municipality and university wastewater surveillance programs.
Locality Name or Academic Institution State
Collaborators/ Partners
Sampling Start Date
Types and Number of Sampling Locations
Analytical Method Dashboard? Dashboard Description
Williams College MA Unknown—program details were not researched (see Section 3)
Frederick County MD CosmosID May 2020 1 WWTP RT-qPCR No Not applicable. No public
dashboard available (Frederick County, 2020).
Mount St. Mary’s University MD Unknown—program details were not researched (see Section 3)
St. Mary’s College of Maryland MD Unknown—program details were not researched (see Section 3)
St. Mary's County MD
St. Mary’s County Health
Department, St. Mary’s College of
Maryland, St. Mary's County Metropolitan Commission
July 2020 9 WWTPs Unknown Yes
Map of the WWTP service areas along with timeseries plots for each of the WWTPs with the
virus copies/L (St. Mary's, 2021).
University of Maryland MD None September
2020 Throughout
campus Unknown No Not applicable. No public
dashboard available (Neugeboren, 2020).
Washington Suburban Sanitary
Commission MD
University of Maryland,
Montgomery County, Prince
George's County
Unknown 6 locations Unknown No Not applicable. No public dashboard available (UMD,
2020).
Saint Joseph’s College of Maine ME Unknown—program details were not researched (see Section 3)
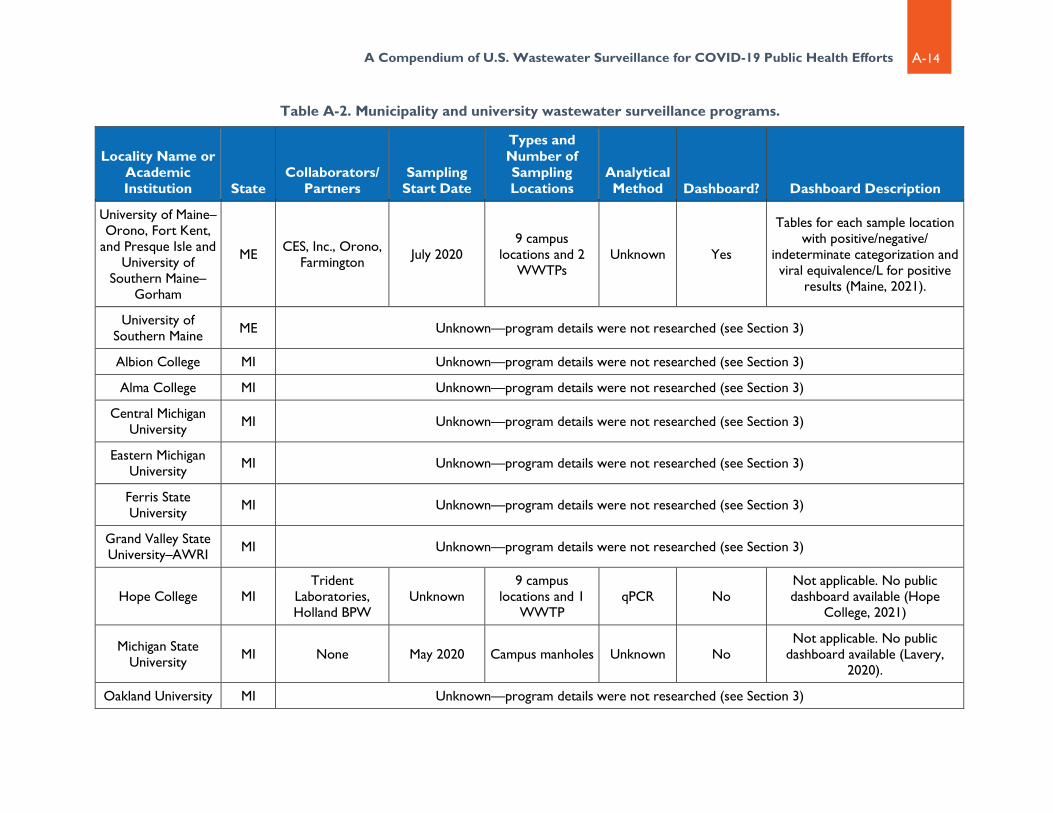
A Compendium of U.S. Wastewater Surveillance for COVID-19 Public Health Efforts
A-14
Table A-2. Municipality and university wastewater surveillance programs.
Locality Name or Academic Institution State
Collaborators/ Partners
Sampling Start Date
Types and Number of Sampling Locations
Analytical Method Dashboard? Dashboard Description
University of Maine–Orono, Fort Kent,
and Presque Isle and University of
Southern Maine– Gorham
ME CES, Inc., Orono, Farmington July 2020
9 campus locations and 2
WWTPs Unknown Yes
Tables for each sample location with positive/negative/
indeterminate categorization and viral equivalence/L for positive
results (Maine, 2021).
University of Southern Maine ME Unknown—program details were not researched (see Section 3)
Albion College MI Unknown—program details were not researched (see Section 3)
Alma College MI Unknown—program details were not researched (see Section 3)
Central Michigan University MI Unknown—program details were not researched (see Section 3)
Eastern Michigan University MI Unknown—program details were not researched (see Section 3)
Ferris State University MI Unknown—program details were not researched (see Section 3)
Grand Valley State University–AWRI MI Unknown—program details were not researched (see Section 3)
Hope College MI Trident
Laboratories, Holland BPW
Unknown 9 campus
locations and 1 WWTP
qPCR No Not applicable. No public dashboard available (Hope
College, 2021)
Michigan State University MI None May 2020 Campus manholes Unknown No
Not applicable. No public dashboard available (Lavery,
2020).
Oakland University MI Unknown—program details were not researched (see Section 3)

A Compendium of U.S. Wastewater Surveillance for COVID-19 Public Health Efforts
A-15
Table A-2. Municipality and university wastewater surveillance programs.
Locality Name or Academic Institution State
Collaborators/ Partners
Sampling Start Date
Types and Number of Sampling Locations
Analytical Method Dashboard? Dashboard Description
Saginaw Valley State University MI Unknown—program details were not researched (see Section 3)
University of Michigan MI None Unknown Throughout
campus Unknown No Not applicable. No public
dashboard available (UMich, 2020).
University of Minnesota MN Unknown—program details were not researched (see Section 3)
University of Minnesota Duluth MN Unknown—program details were not researched (see Section 3)
University of Minnesota Rochester
MN Unknown—program details were not researched (see Section 3)
Missouri State University MO Unknown—program details were not researched (see Section 3)
University of Mississippi MS Unknown—program details were not researched (see Section 3)
Carroll College MT Unknown—program details were not researched (see Section 3)
Montana State University MT Unknown—program details were not researched (see Section 3)
Appalachian State University NC University of
North Carolina Fall 2020 8 dorms RT-ddPCR No Not applicable. No public dashboard available (Buffy, 2021).

A Compendium of U.S. Wastewater Surveillance for COVID-19 Public Health Efforts
A-16
Table A-2. Municipality and university wastewater surveillance programs.
Locality Name or Academic Institution State
Collaborators/ Partners
Sampling Start Date
Types and Number of Sampling Locations
Analytical Method Dashboard? Dashboard Description
Jackson County NC
Tuckaseigee Water and Sewer Authority, Jackson
County Department of Public Health, University of Wisconsin-Milwaukee,
Dogwood Health Trust,
Mathematica
July 2020 1 WWTP Unknown No Not applicable. No public
dashboard available (Mathematica, 2020).
Raleigh NC North Carolina State University March 2020
1 WWTP, 2 residential
sewersheds, and hospital
Unknown No Not applicable. No public
dashboard available (Sherman, 2020).
North Carolina State University NC Unknown—program details were not researched (see Section 3)
University of North Carolina–Chapel Hill NC Unknown—program details were not researched (see Section 3)
University of North Carolina–Charlotte NC None Unknown
20 locations throughout
campus Unknown No
Not applicable. No public dashboard available (UNC
Charlotte, 2020).
University of North Carolina–
Wilmington NC Unknown—program details were not researched (see Section 3)

A Compendium of U.S. Wastewater Surveillance for COVID-19 Public Health Efforts
A-17
Table A-2. Municipality and university wastewater surveillance programs.
Locality Name or Academic Institution State
Collaborators/ Partners
Sampling Start Date
Types and Number of Sampling Locations
Analytical Method Dashboard? Dashboard Description
North Dakota State University ND Unknown—program details were not researched (see Section 3)
University of Nebraska NE Unknown—program details were not researched (see Section 3)
Darmouth-Hitchcock Medical
Center NH Unknown—program details were not researched (see Section 3)
Keene State College NH City of Keene,
Cheshire Medical Center
August 2020 Campus and off-campus WWTPs Unknown Yes
Bar chart with sampling results for both sampling locations along
with two trendlines in viral copies/L. Chart also includes
significant events. Note that the dashboard does not include the entire timeframe (Keene, 2021).
University of New Hampshire NH None August 2020 Throughout
campus RT-ddPCR No Not Applicable. No public dashboard available (UNH,
2020).
Bergen County NJ
Columbia University, Bergen County Utilities
Authority, AECOM
March 2020 1 WWTP and throughout sewershed
RT-qPCR No Not applicable. No public
dashboard available (AECOM, 2020; Chen, 2020).
New Jersey Institute of Technology NJ None September
2020 Each occupied
dorm PCR No Not applicable. No public dashboard available (NJIT, 2021).
New Mexico State University NM Unknown—program details were not researched (see Section 3)
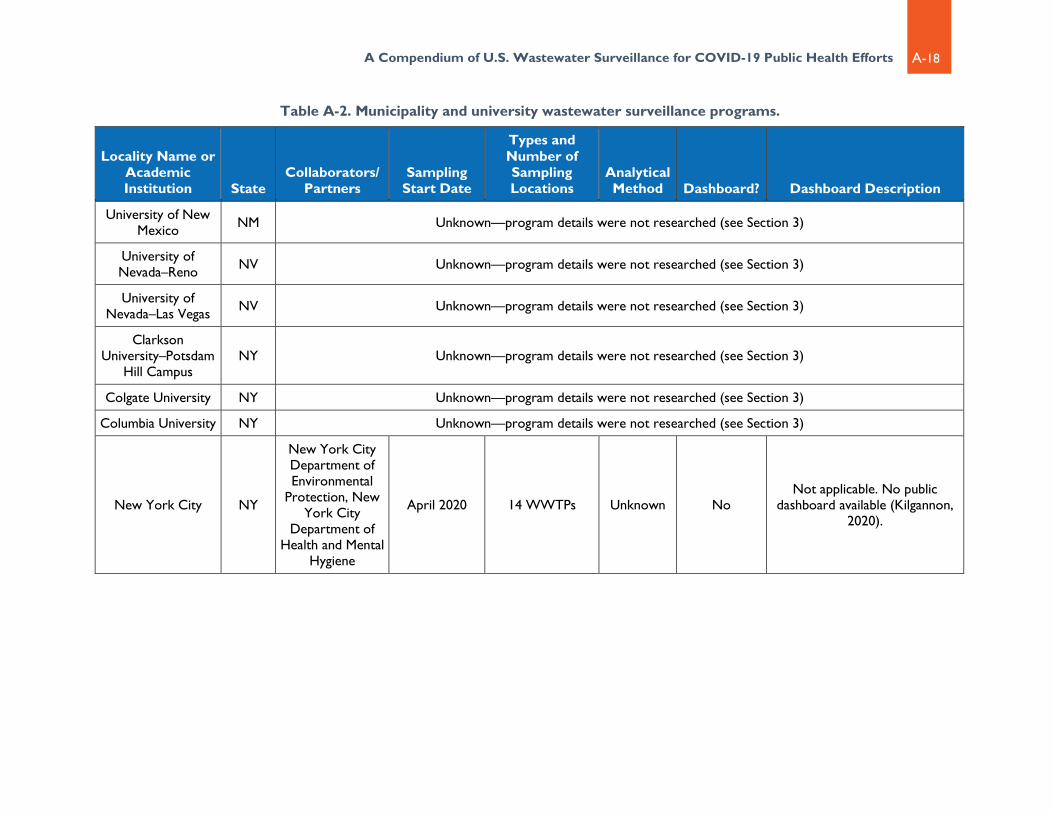
A Compendium of U.S. Wastewater Surveillance for COVID-19 Public Health Efforts
A-18
Table A-2. Municipality and university wastewater surveillance programs.
Locality Name or Academic Institution State
Collaborators/ Partners
Sampling Start Date
Types and Number of Sampling Locations
Analytical Method Dashboard? Dashboard Description
University of New Mexico NM Unknown—program details were not researched (see Section 3)
University of Nevada–Reno NV Unknown—program details were not researched (see Section 3)
University of Nevada–Las Vegas NV Unknown—program details were not researched (see Section 3)
Clarkson University–Potsdam
Hill Campus NY Unknown—program details were not researched (see Section 3)
Colgate University NY Unknown—program details were not researched (see Section 3)
Columbia University NY Unknown—program details were not researched (see Section 3)
New York City NY
New York City Department of Environmental
Protection, New York City
Department of Health and Mental
Hygiene
April 2020 14 WWTPs Unknown No Not applicable. No public
dashboard available (Kilgannon, 2020).

A Compendium of U.S. Wastewater Surveillance for COVID-19 Public Health Efforts
A-19
Table A-2. Municipality and university wastewater surveillance programs.
Locality Name or Academic Institution State
Collaborators/ Partners
Sampling Start Date
Types and Number of Sampling Locations
Analytical Method Dashboard? Dashboard Description
Onondaga County NY
Syracuse University, State
University of New York College of Environmental Science and
Forestry, State University of New
York Upstate Medical University
August 2020 6 WWTPs Unknown No Not applicable. No public dashboard available (Cox, 2020).
Queens College, City University of
New York NY Unknown—program details were not researched (see Section 3)
Rochester Institute of Technology NY None August 2020
15 locations throughout
campus Unknown No
Not applicable. No public dashboard available (Auburn,
2020).
Siena College NY None August 2020 9 areas of campus Unknown No Not applicable. No public dashboard available (Siena, 2020).
St. John Fisher College NY None August 2020 All dorms Unknown No
Not applicable. No public dashboard available (St. John
Fisher, 2020).
St. Lawrence University NY Unknown—program details were not researched (see Section 3)
State University of New York–Albany NY Unknown—program details were not researched (see Section 3)
State University of New York–Canton NY Unknown—program details were not researched (see Section 3)

A Compendium of U.S. Wastewater Surveillance for COVID-19 Public Health Efforts
A-20
Table A-2. Municipality and university wastewater surveillance programs.
Locality Name or Academic Institution State
Collaborators/ Partners
Sampling Start Date
Types and Number of Sampling Locations
Analytical Method Dashboard? Dashboard Description
State University of New York–College of Environmental
Science and Forestry
NY Unknown—program details were not researched (see Section 3)
State University of New York–Morrisville
NY Unknown—program details were not researched (see Section 3)
State University of New York–Oneonta NY
Cornell, Syracuse University,
Upstate Medical, Quadrant
Biosciences
August 2020 3 points
throughout campus
Unknown No Not applicable. No public
dashboard available (Kelvin, 2020).
State University of New York–Oswego NY Unknown—program details were not researched (see Section 3)
Stony Brook University NY Unknown—program details were not researched (see Section 3)
Kent State University OH Unknown—program details were not researched (see Section 3)
Kenyon College OH Unknown—program details were not researched (see Section 3)
Ohio University OH Unknown—program details were not researched (see Section 3)
University of Oklahoma OK Unknown—program details were not researched (see Section 3)
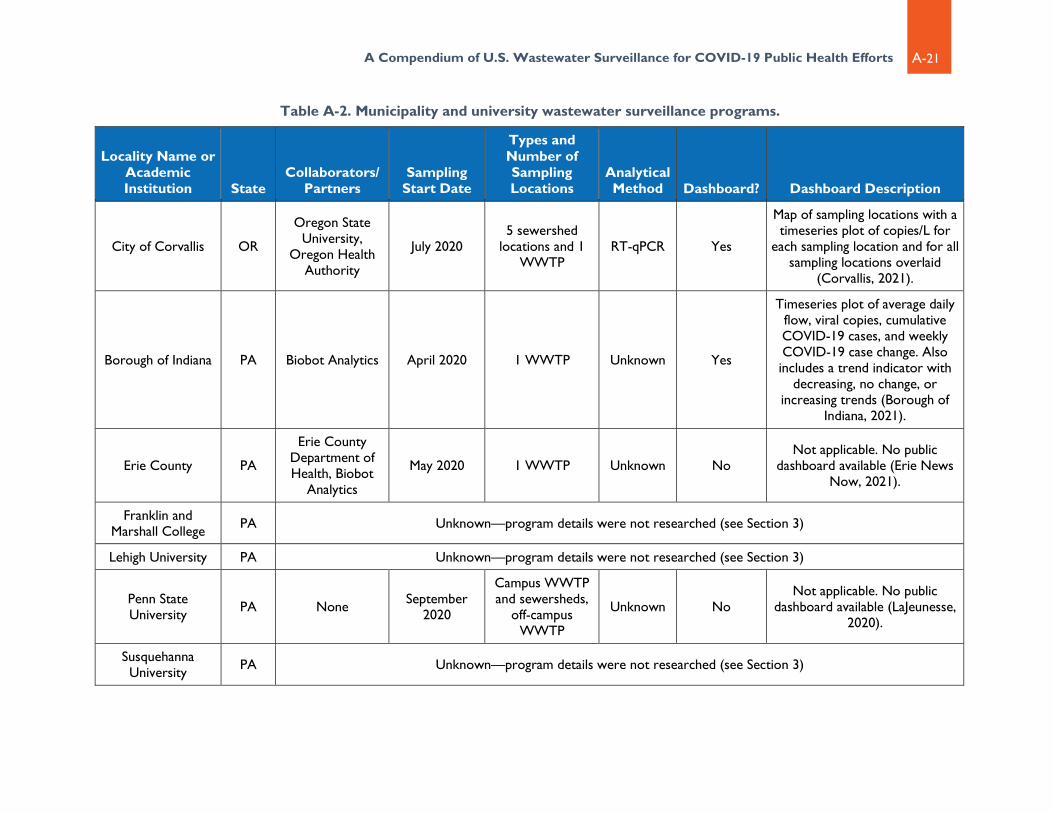
A Compendium of U.S. Wastewater Surveillance for COVID-19 Public Health Efforts
A-21
Table A-2. Municipality and university wastewater surveillance programs.
Locality Name or Academic Institution State
Collaborators/ Partners
Sampling Start Date
Types and Number of Sampling Locations
Analytical Method Dashboard? Dashboard Description
City of Corvallis OR
Oregon State University,
Oregon Health Authority
July 2020 5 sewershed
locations and 1 WWTP
RT-qPCR Yes
Map of sampling locations with a timeseries plot of copies/L for
each sampling location and for all sampling locations overlaid
(Corvallis, 2021).
Borough of Indiana PA Biobot Analytics April 2020 1 WWTP Unknown Yes
Timeseries plot of average daily flow, viral copies, cumulative COVID-19 cases, and weekly COVID-19 case change. Also includes a trend indicator with
decreasing, no change, or increasing trends (Borough of
Indiana, 2021).
Erie County PA
Erie County Department of Health, Biobot
Analytics
May 2020 1 WWTP Unknown No Not applicable. No public
dashboard available (Erie News Now, 2021).
Franklin and Marshall College PA Unknown—program details were not researched (see Section 3)
Lehigh University PA Unknown—program details were not researched (see Section 3)
Penn State University PA None September
2020
Campus WWTP and sewersheds,
off-campus WWTP
Unknown No Not applicable. No public
dashboard available (LaJeunesse, 2020).
Susquehanna University PA Unknown—program details were not researched (see Section 3)

A Compendium of U.S. Wastewater Surveillance for COVID-19 Public Health Efforts
A-22
Table A-2. Municipality and university wastewater surveillance programs.
Locality Name or Academic Institution State
Collaborators/ Partners
Sampling Start Date
Types and Number of Sampling Locations
Analytical Method Dashboard? Dashboard Description
Clemson University SC City of Clemson May 2020 3 WWTPs RT-qPCR Yes
A map of collection areas color coded by the current impact
based on the wastewater results. Also includes timeseries plots of results in viral copies/L for each WWTP and timeseries plots of
variant ratios in percentages over the same time (Clemson, 2021a).
University of South Carolina SC Unknown—program details were not researched (see Section 3)
City of Chattanooga TN Biobot Analytics May 2020 1 WWTP RT-qPCR Yes
Bar chart with SARS-CoV-2 concentrations. Also includes Biobot weekly reports with
normalized viral copies/L sewage compared to daily and seven-day rolling average COVID-19 cases;
includes comparisons of wastewater to samples
nationwide and Biobot’s COVID-19 incidence estimate of new
cases/day based on the wastewater results
(Chattanooga, 2021).
Gallatin City–County Health Department
MT
Archer Biologicals, LLC; Montana State
University
March 2020 5 WWTP qPCR Yes
Timeseries plot of N1 and N2 in genome copies/L compared to
the number of COVID-19 cases for Bozeman. Remaining
WWTPs present table with results (Healthy Gallatin, 2021).

A Compendium of U.S. Wastewater Surveillance for COVID-19 Public Health Efforts
A-23
Table A-2. Municipality and university wastewater surveillance programs.
Locality Name or Academic Institution State
Collaborators/ Partners
Sampling Start Date
Types and Number of Sampling Locations
Analytical Method Dashboard? Dashboard Description
University of Tennessee TN None Unknown At least 10
campus buildings Unknown No Not applicable. No public
dashboard available (Crawford, 2020).
Baylor College of Medicine TX Unknown—program details were not researched (see Section 3)
Houston TX
Houston Health Department, Rice University, Baylor
College of Medicine
May 2020 39 WWTPs RT-ddPCR
and RT-qPCR
No Not applicable. No public
dashboard available (Houston, 2021).
Texas A&M University TX Unknown—program details were not researched (see Section 3)
University of Texas TX Unknown—program details were not researched (see Section 3)
University of Texas–San Antonio TX Unknown—program details were not researched (see Section 3)
Utah State University UT
Utah Department of Environmental
Quality July 2020
6 communities at Logan campus, 4 dorms at Eastern
campus, and 2 dorms at Blanding
campus
Unknown No Not applicable. No public dashboard available (USU, 2021).
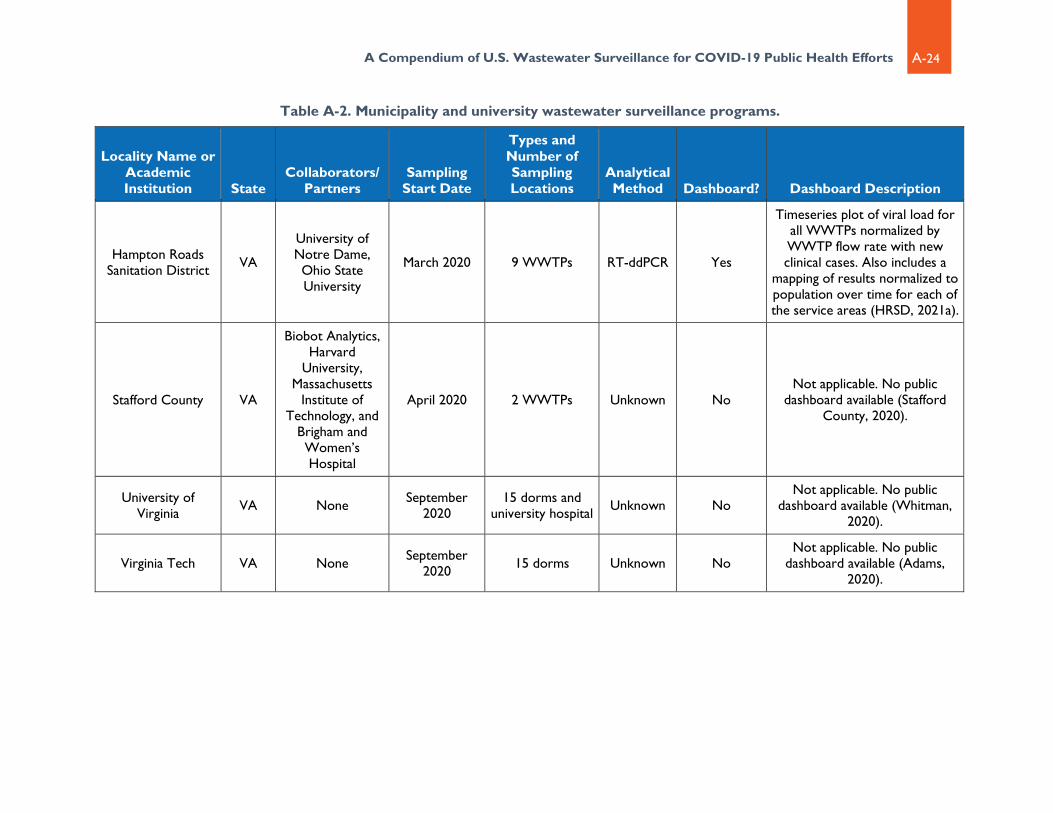
A Compendium of U.S. Wastewater Surveillance for COVID-19 Public Health Efforts
A-24
Table A-2. Municipality and university wastewater surveillance programs.
Locality Name or Academic Institution State
Collaborators/ Partners
Sampling Start Date
Types and Number of Sampling Locations
Analytical Method Dashboard? Dashboard Description
Hampton Roads Sanitation District VA
University of Notre Dame, Ohio State University
March 2020 9 WWTPs RT-ddPCR Yes
Timeseries plot of viral load for all WWTPs normalized by WWTP flow rate with new clinical cases. Also includes a
mapping of results normalized to population over time for each of the service areas (HRSD, 2021a).
Stafford County VA
Biobot Analytics, Harvard
University, Massachusetts
Institute of Technology, and
Brigham and Women’s Hospital
April 2020 2 WWTPs Unknown No Not applicable. No public
dashboard available (Stafford County, 2020).
University of Virginia VA None September
2020 15 dorms and
university hospital Unknown No Not applicable. No public
dashboard available (Whitman, 2020).
Virginia Tech VA None September 2020 15 dorms Unknown No
Not applicable. No public dashboard available (Adams,
2020).

A Compendium of U.S. Wastewater Surveillance for COVID-19 Public Health Efforts
A-25
Table A-2. Municipality and university wastewater surveillance programs.
Locality Name or Academic Institution State
Collaborators/ Partners
Sampling Start Date
Types and Number of Sampling Locations
Analytical Method Dashboard? Dashboard Description
City of Burlington VT
Vermont Department of
Health, Dartmouth
Hitchcock Medical Center, University
of Vermont, GoAigua
August 2020 3 WWTPs Unknown Yes
Timeseries plot of copies/L for each of the WWTPs; timeseries
plot of percent of variant (Del6970 [B117], N501Y [B117], and E484K [Unknown]) for each WWTP starting February 2021
(Burlington, 2021).
Norwich University VT Unknown—program details were not researched (see Section 3)
University of Vermont VT Unknown—program details were not researched (see Section 3)
University of Washington WA Unknown—program details were not researched (see Section 3)
University of Wisconsin–Oshkosh WI Unknown—program details were not researched (see Section 3)
West Virginia University WV Unknown—program details were not researched (see Section 3)
University of Wyoming WY Unknown—program details were not researched (see Section 3)