Theoretical Perspectives Systemic and comparative approaches of Media Accountability
A Comparative Theoretical Analysis ofthe Impact of The Food Stamp Program
as Opposed to Cash Transfers onthe Demand for Food
Kathryn S. Phillips and David W. Price
Comparative analysis of food demand expansion of a cash program, as compared tothe food stamp program, is important for measuring trade-offs between goals of raisingfarm income and increasing food expenditures of the poor. A theoretical basis forassessing food demand impacts under each program is presented. Two effects areanalyzed: 1) The effect on food demand of the individual household and 2) The effect offood demand at the aggregate level. Both indifference curve analysis and psychologicalneed level theory are used.
The purpose of the food stamp program isto raise farm income and improve diets of lowincome people [Gold, Hoffman, andWaugh]. It has been argued that substitutionof cash grants in lieu of food stamps could domore to increase farm income, provide assist-ance to more people, and would cost thegovernment less than the present program. Anational sample involving an "experimental"cash transfer among elderly food stamp par-ticipants is currently under way [U.S. Officeof the Federal Register]. Comparative analy-sis of aggregate food demand expansion ef-fects stimulated by food stamps or a cashprogram is important for measuring tradeoffs(or lack of tradeoffs) between raising farmincome and increasing food expenditures oflow-income households.
A framework for showing the effects ofdifferent kinds of food subsidy measures on
Kathryn S. Phillips is a doctoral student in AgriculturalEconomics at Washington State University. David W.Price is Professor of Agricultural Economics at Washing-ton State University.
Scientific Paper No. SP6144, Project 0570, College ofAgriculture, Washington State University, Pullman,Washington.
food consumption of an individual householdwas developed by Southworth in 1945. Otherresearchers have applied Southworth's theo-retical framework to show food consumptioneffects of an individual household under thefood stamp program prior to elimination ofthe purchase requirement in 1979 [Clarkson,MacDonald]. However, attempts to assessthe impact of food subsidies on food expendi-tures indicate a lack of adequate theory ex-plaining the transition from the householdlevel to the aggregate level. Southworth rec-ognized the problem by stating, "To turn thisqualitative conclusion into a quantitative for-mula for the distribution of a subsidy amongdifferent income groups so as to maximizethe total increase in aggregate food consump-tion would present a much more complexproblem" (p. 57). Mittelhammer and Westmade a major contribution toward filling thisgap by developing a theoretical analysis ofthe food stamp program (prior to eliminationof the purchase requirement). Relying on thetheory of the individual household, they for-mulated a quantitative rule to measure theimpact of the food stamp program on foodexpenditures at the aggregate level.
The purpose of this paper is to present acomparison based on a theoretical analysis of
53
Western Journal of Agricultural Economics
the aggregate food demand impacts underthe food stamp program prior to eliminationof the purchase requirement, with that undercurrent program provisions, and with thatunder a cash program. Data requirementsnecessary to estimate differences betweenaggregate food demand impacts under thecurrent food stamp program and a proposedcash subsidy program will also be discussed.
The Effects on Food Expendituresof the Individual Household
Since the overall increase in food con-sumption under programs of different typeswill equal the total of program effects onparticipating households, this analysis ofaggregate food expenditure changes will be-gin at the household level. Food stamps mustbe spent on food, but the increase in foodexpenditures of the participating householdis not necessarily equivalent to the bonusvalue of stamps issued. The bonus value ofstamps is the face value of the stamps minusthe amount paid for the stamps by recipients.The food stamp program, by "freeing up"cash spent for food before participation, al-lows substitution of non-food for food items.A food stamp household receives a specifiedamount of food stamps and will choose amongthree options: 1
1. The household will use the stamps toincrease food expenditures by thebonus value of the stamps.
2. The household will not change theiramount of food expenditures, and sub-stitute an amount of cash equivalent tothe bonus value of the stamps on non-food items.
3. The household will increase food ex-penditures by less than the bonus valueof stamps, and substitute some of themoney formerly spent on food for non-food purchases.
1Assumes both food and nonfood are not inferior goods;that is, the income elasticity for the good cannot benegative. The options correspond to current food stampregulations.
54
If all participating households selected (1),the aggregate level of increased food expen-ditures would be equivalent to the total valueof bonus stamps issued. If all householdsselected (2), there would be no increase infood demand. Summing across all house-holds, it can be expected that demand expan-sion due to food stamps lies somewherebetween the two extremes (option 3). Thisconclusion follows because both food andnonfood, as categorical groupings, are normalgoods for most low-income households in theUnited States. The increase in aggregate foodexpenditures could be interpreted as the in-crease in the retail demand for food. Theestimated farm food share in 1977 for U.S.farm food for at-home consumption was 38¢[Boehm and Belongia].
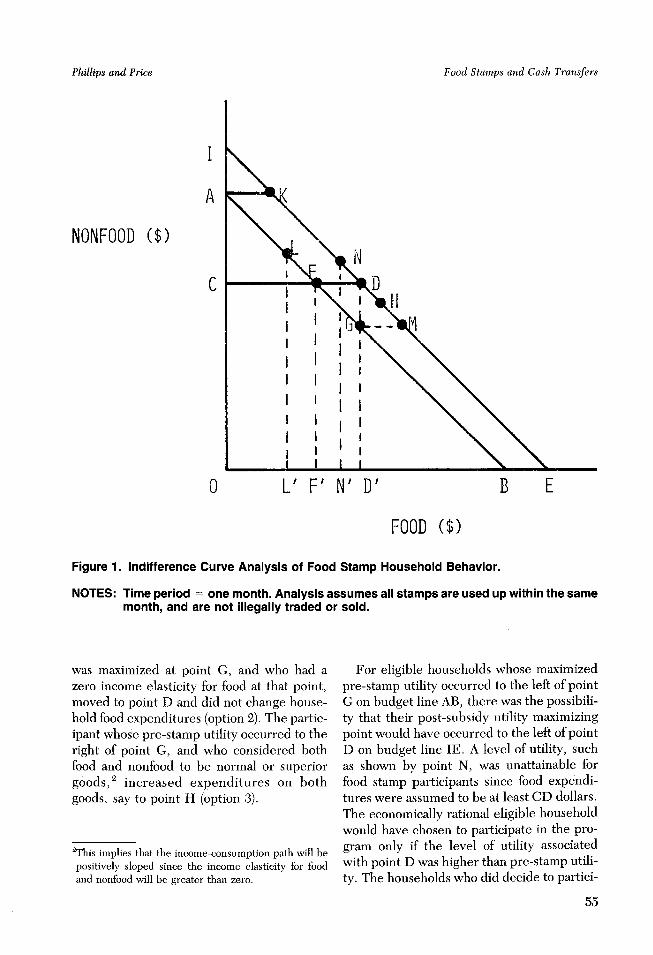
Indifference curve analysis can be used toillustrate behavior of the food stamp house-hold under the three listed options. It canalso illustrate the effects of changing programregulations on food demand. Figure 1 showsthe graphical analysis of indifference curvetheory applied to the food stamp program asit existed before and after elimination of thepurchase requirement, and as it would existunder a cash transfer program.
Before elimination of the purchase re-quirement, food stamp participants were re-quired to pay AC =CF dollars to receive agreater dollar amount of food stamps, CD.The value of the free (bonus) stamps, F'D',depended on household size and incomecriteria. The participant's budget line wasCDE, and the participant, assumed to use allstamps in the month they were received,consumed at least CD dollars worth of food.The participant whose pre-stamp utility wasmaximized at point F, and who had a zeroincome elasticity for nonfood at that point,maximized post-stamp utility at point D. Ifall participants consumed at least CF dollarsworth of food prior to participation, and had azero income elasticity for nonfood, the in-crease in aggregate food expenditures wouldhave been equal to the value of bonus stampsissued (option 1).
The participant whose pre-stamp utility
July 1982
Food Stamps and Cash Transfers
I
A
NONFOOD ($)
C
0
N
L' F' N' D' B E
FOOD ($)
Figure 1. Indifference Curve Analysis of Food Stamp Household Behavior.
NOTES: Time period = one month. Analysis assumes all stamps are used up within the samemonth, and are not illegally traded or sold.
was maximized at point G, and who had azero income elasticity for food at that point,moved to point D and did not change house-hold food expenditures (option 2). The partic-ipant whose pre-stamp utility occurred to theright of point G, and who considered bothfood and nonfood to be normal or superiorgoods, 2 increased expenditures on bothgoods, say to point H (option 3).
2 This implies that the income-consumption path will bepositively sloped since the income elasticity for foodand nonfood will be greater than zero.
For eligible households whose maximizedpre-stamp utility occurred to the left of pointG on budget line AB, there was the possibili-ty that their post-subsidy utility maximizingpoint would have occurred to the left of pointD on budget line IE. A level of utility, suchas shown by point N, was unattainable forfood stamp participants since food expendi-tures were assumed to be at least CD dollars.The economically rational eligible householdwould have chosen to participate in the pro-gram only if the level of utility associatedwith point D was higher than pre-stamp utili-ty. The households who did decide to partici-
55
Phillips and Price
II1tII
III
IIIIIII
Western Journal of Agricultural Economics
pate were "constrained" to operate at pointD; that is, the household was forced to spendmore on food than it would have spent if thebonus value of stamps had been given in theform of cash transfer. The amount of con-straint can be defined as the minimum foodexpenditure required of the food stamphousehold, CD, minus what the householdwould have spent for food if the bonus valueof stamps had been given in the form of cash.The constraint is defined for positiveamounts - otherwise, the household is re-ferred to as "unconstrained." The amount ofconstraint for the participating householdwhose post-stamp utility would have oc-curred at point N if the bonus value of stampshad been given as cash was equal to N'D' =CD - ON'). The household was "con-strained" to be at point D because of theminimum required food expenditure.
Prior to elimination of the purchase re-quirement, a fourth option was possible. InFigure 1, the participating household whosepre-stamp utility occurred at point L in-creased its food expenditure by the amountL'D', which was more than the bonus valueof the stamps, FD = F'D'. Thus, under foodstamp regulations in effect before eliminationof the purchase requirement, a fourth optionwas:
4. A participating household will increasefood expenditures by more than thebonus value of the stamps.
In 1979, the purchase requirement waseliminated. Households are now given bonusstamps free of charge. The budget line of theparticipating household is now AKE. Undercurrent regulations, a "constrained" par-ticipating household will never increase itsfood expenditures by more than the bonusvalue of the stamps.
If a cash program were to be enacted,there would be no "constrained" households.Assuming the amount of cash subsidy wouldbe equal to the bonus value of stamps, thebudget line of the household would be IE.Any level of utility on budget line IE wouldbe attainable.
The effect of a cash subsidy on food expen-ditures would be the same as the effect offood stamps on food expenditures for thoseparticipating households who are in an "un-constrained" position under the current foodstamp program. For example, the householdwhose pre-stamp utility occurs at point G andwho considers both food and nonfood to benormal goods may move to point H, regard-less of whether the subsidy is in the form offood stamps or cash (Figure 1). Becauseaggregate food demand impacts under a pro-posed cash program are of interest, the im-mediate question that arises is: how manyhouseholds are "unconstrained" under thepresent food stamp program?
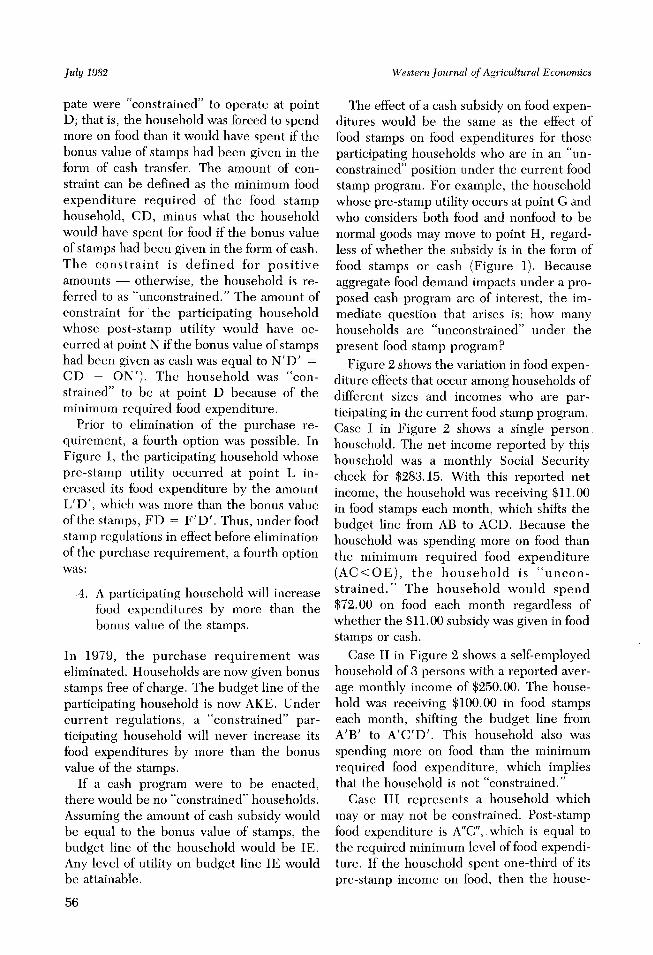
Figure 2 shows the variation in food expen-diture effects that occur among households ofdifferent sizes and incomes who are par-ticipating in the current food stamp program.Case I in Figure 2 shows a single personhousehold. The net income reported by thishousehold was a monthly Social Securitycheck for $283.15. With this reported netincome, the household was receiving $11.00in food stamps each month, which shifts thebudget line from AB to ACD. Because thehousehold was spending more on food thanthe minimum required food expenditure(AC<OE), the household is "uncon-strained." The household would spend$72.00 on food each month regardless ofwhether the $11.00 subsidy was given in foodstamps or cash.
Case II in Figure 2 shows a self-employedhousehold of 3 persons with a reported aver-age monthly income of $250.00. The house-hold was receiving $100.00 in food stampseach month, shifting the budget line fromA'B' to A'C'D'. This household also wasspending more on food than the minimumrequired food expenditure, which impliesthat the household is not "constrained."
Case III represents a household whichmay or may not be constrained. Post-stampfood expenditure is A"C", which is equal tothe required minimum level of food expendi-ture. If the household spent one-third of itspre-stamp income on food, then the house-
56
July 1982
Food Stamps and Cash Transfers
LASE 1: SINGLE PERSON HOUSEHOLD
283.15 NET MONTHLY INCOME
11,00 FOOD STAMPS/MONTH
61.00 SPENT ON FOOD IN ADDITION
TO STAMPS
UNCONSTRAINED UTILITY MAXIMUM
OCCURS AT POINT E
CASE II: HOUSEHOLD OF SIZE 3,
PAID BY THE JOB
250 AVERAGE INCOME/MONTH
100 SPENT ON FOOD IN ADDITION
TO FOOD STAMPS/MONTH
UNCONSTRAINED UTILITY MAXIMUM
OCCURS AT POINT E'
CASE III: HOUSEHOLD OF SIZE 2
350 NET MONTHLY INCOME
128 FOOD STAMPS/MONTH
0 SPENT IN ADDITION TO
FOOD STAMPS
POSSIBLY CONSTRAINED, SAY AT
POINT E"
FOOD ($)
Figure 2: Food Expenditure Effects of Food Stamp Households of Different Sizes andIncomes.
NOTE: The data were obtained by household responses to a questionnaire study conductedby the authors in Washington State in February and March of 1981.
57
NONFOOD($)
NONFOOD($) AA
A"
NONFOOD($)
(1
Phillips and Price
t, T r% - - r) - - - - - I - - . .
- I.

Western Journal of Agricultural Economics
hold may or may not move from point E" topoint C" if the subsidy was paid in cash. Forexample, if one-third of the household's pre-stamp income was devoted to food and thehousehold has a zero income elasticity forfood, the household will be "constrained."Under this assumption, the amount of con-straint would be $128 - $116.67 = $11.33.One can conclude that if this household spentone-third of pre-stamp income for food, theamount of constraint lies somewhere be-tween $0.00 and $11.33.
The comparison of a household with a verylow income (Case III, Figure 2) with anotherthat is barely eligible (Case I) emphasizes thedifferent effects on food expenditures amonghouseholds of different sizes and incomes.Total impact, of course, depends on the dis-tribution of households among various in-come levels and household sizes, and thedistribution will affect the aggregate demandfor food.
The Effects of Food Expendituresat the Aggregate Level
The aggregate effect of alternative foodsubsidy programs on food demand can beestimated by summing up the amount ofincreased food expenditures of all participat-ing households. Indifference curve theoryindicates that the aggregate increase in foodexpenditures prior to elimination of the pur-chase requirement could be measured by anamount consistent with households' incomeelasticity for food (for example, point F topoint N in Figure 1) plus an additionalamount (N'D in Figure 1) needed to meetthe minimum required food expenditure. 3
Summing across all households, the increaseof aggregate food expenditures is expressedin equation 1.
3The 1974 food stamp regulations also permitted thehousehold to purchase any quarterly fraction of itsallotment. Although inclusion of this consideration gavethe eligible household more choice of budget lines,indifference curve analysis can be used to show that allchoices open to the participant in 1974 fit into one of thefour options of participant behavior.
58
n(1) E
i=l
[(%AQfA i(%AI)i(Qf,) + Fi]\ %AI /
= Aggregate increase in foodexpenditures
where:
n= number of participating
%AQfi\%AI/\~ AfI/
households;
= income elasticity for food ofith household;
(%AI) i = the ratio of bonus stampvalue to pre-stamp incomefor ith household;
Qf,i = pre-stamp food expenditureby ith household; and
Fi = additional food expendi-tures motivated by the re-quired minimum level offood consumption (Fi = 0if household is uncon-strained).
With elimination of the purchase require-ment in 1979, equation (1) is still applicablefor calculating the aggregate increase in foodexpenditures, although elimination of thepurchase requirement implies that there isless probability that a participant will be"constrained" since the required minimumfood expenditure is less than the food expen-diture required with a purchase requirement(AK < CD in Figure 1). However, equation(1) should not be used to immediately con-clude that the aggregate increase in fooddemand after elimination of the purchaserequirement would be less than before itselimination. Elimination of the purchase re-quirement should expand the set of par-ticipating households, say to m where m > n.Some eligible households who chose not toparticipate when there was a purchase re-quirement would be expected to participatein the present program because elmination of
July 1982

Food Stamps and Cash Transfers
the purchase requirement would then allowthem a higher level of utility.4
Equation (1) is also appropriate for estimat-ing food demand impacts under a cash pro-gram. Under a cash transfer all Fi = 0 inequation (1). One would expect the set ofparticipants to increase to p where p > m >n, because no household would be restrictedto a minimum food purchase requirement.Assuming p > m > n, a cash transfer pro-gram would be most consistent with reachingthe most people in need. However, to deter-mine whether increasing the "participationrate" and food demand expansion objectivesare complementary goals or involve a tradeoffit would be necessary to compare estimatesof equation (1) under the current food stampprogram and a proposed cash program.
Testing the Validity of IndifferenceTheory to Explain Nonparticipation
While data from the USDA 1977-78Nationwide Food Consumption Survey isavailable to estimate equation (1) under thecurrent food stamp program, estimates ofthese parameters under a cash program canonly be hypothesized. Analyzing the reasonsfor not participating in the food stamp pro-gram can aid in developing an empiricalmodel that would accurately predict the ef-fect on participation of cashing out the pro-gram. The previous section showed that thecash out has the potential of increasing aggre-gate food demand. This would occur if anincrease in food demand that would resultfrom an increase in the participation ratewould offset the decrease in food demandthat would be caused by "constrained" food
4 Elimination of the purchase requirement was simul-taneously accompanied by important rule changeswhich tightened food stamp eligibility requirements.These changes tended to lower participation, and cloudthe participation impact associated only with elimina-tion of the purchase requirement. The simultaneousimplementation of these changes means that there willnever be data available which will enable a clean cutidentification of the participation impact of eliminatingthe purchase requirement.
stamp households who would become "un-constrained" under a cash program.
During the 1974-75 period, it was theopinion of Food and Nutrition Service per-sonnel that about 50 percent of all eligiblehouseholds participated in the food stampprogram. In other words, about one half ofthe households eligible for food stamps in theU.S. chose not to participate in the programbecause their preference for nonfood relativeto food was such that the value of the stampswas considerably more than they wished tospend for food, or for other reasons whichwill be subsequently explored.
To examine the validity of indifferencecurve theory to explain nonparticipation andto help elicit other reasons for nonparticipa-tion, characteristics of participants and non-participants from two recent surveys will beexamined. The 1973-74 BLS Consumer Ex-penditure Survey showed the following dif-ferences between food stamp participantsand eligible nonparticipants (Table 1). Totalhousehold income was higher among eligiblenonrecipients while household size wassmaller. This implies that if the eligible non-recipients were to have participated, the av-erage value of the bonus stamps would havebeen lower than for the recipients. Com-pared to recipients, a larger percentage ofeligible nonrecipients were older and ownedtheir homes. Recipients also had less edu-cation. There were a greater proportion ofblack households and female headed house-holds among recipients. The percentage ofcurrent income from earnings was signifi-cantly higher among nonrecipients since alarger proportion were in the work force.
Food stamp recipients on the averagespent more per month for food than the valueof the stamps. The exact figure is difficult tocalculate since not all food stamp householdsfully participated 5 in the program. The aver-age exchange value was $91.60 per month,
5The food stamp regulations at this time permitted ahousehold to purchase any quarterly fraction of itsallotment.
59
Phillips and Price

Western Journal of Agricultural Economics
TABLE 1. Socioeconomic Characteristics of Households Eligible for Food Stamps: U.S. 1973-74 BLS Consumer Expenditure Survey.
Food Stamp EligibleProgram Non-
Characteristic Recipients recipients
Exchange value of stamps per household(monthly mean) 91.60
Purchase requirement per household(monthly mean) 40.38
Value of bonus stamps per householdc
(monthly mean) 51.22Total food expenditure (at home) per
household (monthly mean)* 118.73 88.44Food away from home per household*
(monthly mean) 10.01 19.06Household size* 3.40 2.98Total money incomea (annual mean)NS 3,468.00 3,622.00Total earnings (annual mean)* 1,377.00 2,398.00Welfare, alimony, private pensions*
(annual mean) 1,389.00 295.00Other income sources (annual mean)NT 710.00 929.00Head did not work past year (%)* 63.90 46.80Percentage of income spent for food at homeb/NT 34.50 29.30Home Ownership (5)* 24.50 46.90Age of head 65 + years (%)* 24.20 34.10Female head (%)* 59.30 40.10Race of head: Black (%)* 39.50 18.90Education of head 12+ years (%)* 26.40 39.70
SOURCE: WestaDoes not include bonus stamps.blncludes bonus stamps as income.CComputed as the exchange value less the purchase requirement.
*Difference significant at the .05 level.NS Nonsignificant at the .05 level.NT Not tested for significance.
but a 3 person household was eligible toreceive $94.00 per month in stamps accord-ing to the July 1973 issuance schedule. For a4 person household the exchange value was$116.00. Thus, for a 3.4 person householdthe exchange value would be $102.80. Usingthis figure the average amount spent in addi-tion to stamps was $15.93. Thus, the "aver-age" recipient was to the right of point D(Figure 1).
Food expenditures for the eligible nonreci-pients were slightly less than the value ofstamps at the monthly mean for participating
60
households, indicating that the "average"nonrecipient was slightly to the left of pointG in Figure 1. The study by West, Price andPrice indicated the propensity to consumefood from a dollar's worth of bonus stampswas $.31 in 1973. The 1973 food stamp is-suance schedule showed a household with 3persons and a $300.00 per month incomereceived $19.00 in bonus stamps. This shouldhave resulted in an increase in food expendi-ture of $5.89 ($5.89 = 19 x .31), for anestimated total after receiving stamps of$94.33 ($5.89 + $88.44) which was almost
July 1982

Food Stamps and Cash Transfers
exactly equal to the minimum required foodexpenditure of $94.00 for a 3 person par-ticipating household (as shown by the is-suance schedule). According to this analysis,the "average" eligible nonrecipient shouldhave been very near point D in Figure 1 ifthe household had participated in the pro-gram.
Another point of interest is point F inFigure 1. For any point to the right of F onthe nonrecipients budget line, it was rationalto participate in the food stamp program.Over this portion of the budget line it isimpossible to have an indifference curve witha negative slope and increase utility fromnonparticipation. For the above BLS sample,the amount of cash spent on food by theparticipating 3 person household at point Dwas $94.00 - $19.00 = $75.00. The amountof money spent on food by a nonparticipant atpoint F would be $75.00. This is $13.44below the mean of $88.44 for nonpartici-pants. The standard deviation of at homefood expenditures was $78.65. Thus, point Fis .17 of a standard deviation from the mean.If food expenditures were normally distrib-uted 56.8 percent of the nonrecipient house-hold were to the right of point F. Thus, atmost, 43.2 percent of the eligible nonreci-pients failed to participate before eliminationof the purchase requirement because of therestriction on the minimum food purchases.One would expect the actual percentage tobe much less than 43.2 with expected mar-ginal rates of substitution between food andnonfood. With elimination of the purchaserequirement in 1979, some eligible house-holds who chose not to participate whenthere was a purchase requirement would beexpected to participate in the present pro-gram because elimination of the purchaserequirement would then allow them a higherutility.
These results suggest that other reasons fornonparticipation in the food stamp programare important. Several possible reasons havebeen suggested [MacDonald]. Lack of knowl-edge of the program and its eligibility stan-dards are one possible cause. A much higher
proportion of recipients' income stems fromwelfare payments than is the case for nonre-cipients (Table 1). Many welfare recipientsare made aware of the provisions of the foodstamp program when applying for welfare.Employed persons, even though receiving alow income, may consider themselves ineli-gible for food stamps.
Another factor is the cost incurred by therecipient in being certified as eligible for theprogram. The recipient must travel to a givenlocation and spend some amount of time inbecoming eligible and in obtaining stamps.Actual out-of-pocket costs in traveling areincurred and if time has some positive mone-tary value, this is also a monetary cost. If thepotential recipient has a relatively high in-come, and consequently would receive fewdollars worth of bonus stamps, these costswould make participation worth little ornothing. These factors have the effect of in-creasing the number of nonparticipatinghouseholds.
Another factor possibly affecting participa-tion is the social stigma attached to beinginterviewed about finances or being seenusing food stamps. This has the effect ofreducing the utility derived from obtainingbonus stamps. It has the effect of shifting theindifference curve downward and to the left.If this shift is large enough, total utility fromfood stamp participation will be less thanwithout participation.
Recent findings by West, Price and Priceindicate that certain aspects of human moti-vation theory relate to participation in thefood stamp program. This theory, refined byMaslow, conceives human needs as fallinginto a hierarchy. Once needs at one level aresatisfied to a certain degree, the individualmoves to a higher level.
The lowest level is physiological need.This need is a concern for basic physicalcomfort. There is a concern for basic needssuch as food, clothing and shelter. In thepresent day U.S. these basic needs are rela-tively well satisfied for most individuals andhouseholds. However, means of satisfyingthese needs are reflected in a desire for a
61
Phillips and Price
Western Journal of Agricultural Economics
sufficient supply of tasty and nutritious foodrather than a simple desire for something toeat.
The second level of need is security need.Relative to food consumption, persons with ahigher security need would be hypothesizedto refrain from trying new things. Theywould consume familiar foods. The thirdlevel of need is love and belonging. Peoplewith high levels of this need have a highconcern for family and friends. The fourthlevel of need is self esteem. People at thislevel of need desire the respect and admira-tion of others. The fifth and highest level ofneed is self actualization. This includes thedesire to be creative, and to try new things.People with high self actualization needstend to have a concern for all people.
West, Price and Price found that foodstamp recipients had a significantly higherlevel of physiological need than did nonreci-pients. Furthermore, in a model includingother relevant variables,6 food expenditureswere positively related to physiological need.This shows that the shape of the indifferencecurve is flatter for food stamp recipients thanfor nonrecipients. Thus, nonrecipients wouldbe less likely to participate in the food stampprogram because of a lower physiologicalneed.
Other characteristics of nonrecipients sub-stantiate the differences in physiologicalneed. More nonrecipients own their ownhomes (Table 1). Home ownership theoreti-cally should reduce the level of physiologicalneed since the need should be moresatisified. Nonrecipients have a higher levelof income than recipients. This also indicatesa lower level of physiological need.
The lower level of physiological needamong nonrecipients implies that other
60ther variables included in the model were currentincome, liquid assets, a food stamp recipient dummy,value of free school lunches, pay period, householdsize, ethnic group, and a dummy for home producedmeat. Food expenditures, income, liquid assets, andthe value of lunches were placed on an adult equivalentbasis.
needs are relatively higher. Examination ofthe correlation coefficients using theWashington State data [West, Price andPrice] shows self actualization and securityneeds to be somewhat higher among nonreci-pients (r = .061 and .034 respectively). Thehigher self actualization need fits with theo-retical expectations as a reason for nonpar-ticipating in the food stamp program. Morecreative persons may prefer to find their ownways of coping with a low income situationrather than relying on government transferprograms.
Reasons for not participating in the foodstamp program must be incorporated in anempirical model that could be used to hy-pothesize the effect on participation of cash-ing out the program. The cash out has thepotential of increasing the participation ratebecause restrictions on minimum foodexpenditures are eliminated. On firstexamination, the minimum food expenditurerequired by food stamp recipients did notappear to be an important factor in explainingnonparticipation. However, when the recipi-ent cost of obtaining the stamps is counted asan actual cost and because nonrecipientshave a higher relative preference for non-food, use of indifference curve theory to ex-plain nonparticipation is given some validity.
Other reasons for nonparticipation alsomay be important in explaining the change inparticipation if a cash program replaced thefood stamp program. The psychological effortand the consequent reduction in utility frombeing interviewed about eligibility and ob-taining the stamps presumably would not beaffected by a cash out. However, from theviewpoint of the five need levels, a cash outhas at least two effects. First, the stigmaattached to the use of stamps in the grocerystore is directly related to self esteem need.The cash out will tend to increase fulfillmentof this need for recipients. Second, elimina-tion of the restriction of the minimum foodpurchase may increase fulfillment of the selfactualization need. These two effects resultin an increase in utility to the recipient.
In summary, indifference curve theory
62
July 1982
Food Stamps and Cash Transfers
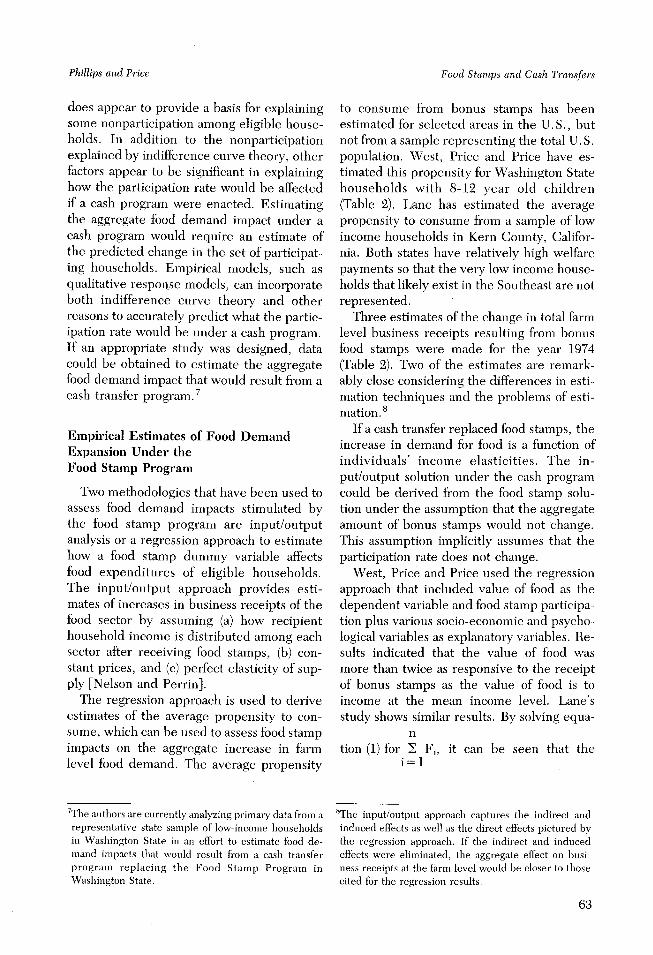
does appear to provide a basis for explainingsome nonparticipation among eligible house-holds. In addition to the nonparticipationexplained by indifference curve theory, otherfactors appear to be significant in explaininghow the participation rate would be affectedif a cash program were enacted. Estimatingthe aggregate food demand impact under acash program would require an estimate ofthe predicted change in the set of participat-ing households. Empirical models, such asqualitative response models, can incorporateboth indifference curve theory and otherreasons to accurately predict what the partic-ipation rate would be under a cash program.If an appropriate study was designed, datacould be obtained to estimate the aggregatefood demand impact that would result from acash transfer program. 7
Empirical Estimates of Food DemandExpansion Under theFood Stamp Program
Two methodologies that have been used toassess food demand impacts stimulated bythe food stamp program are input/outputanalysis or a regression approach to estimatehow a food stamp dummy variable affectsfood expenditures of eligible households.The input/output approach provides esti-mates of increases in business receipts of thefood sector by assuming (a) how recipienthousehold income is distributed among eachsector after receiving food stamps, (b) con-stant prices, and (c) perfect elasticity of sup-ply [Nelson and Perrin].
The regression approach is used to deriveestimates of the average propensity to con-sume, which can be used to assess food stampimpacts on the aggregate increase in farmlevel food demand. The average propensity
7The authors are currently analyzing primary data from arepresentative state sample of low-income householdsin Washington State in an effort to estimate food de-mand impacts that would result from a cash transferprogram replacing the Food Stamp Program inWashington State.
to consume from bonus stamps has beenestimated for selected areas in the U.S., butnot from a sample representing the total U.S.population. West, Price and Price have es-timated this propensity for Washington Statehouseholds with 8-12 year old children(Table 2). Lane has estimated the averagepropensity to consume from a sample of lowincome households in Kern County, Califor-nia. Both states have relatively high welfarepayments so that the very low income house-holds that likely exist in the Southeast are notrepresented.
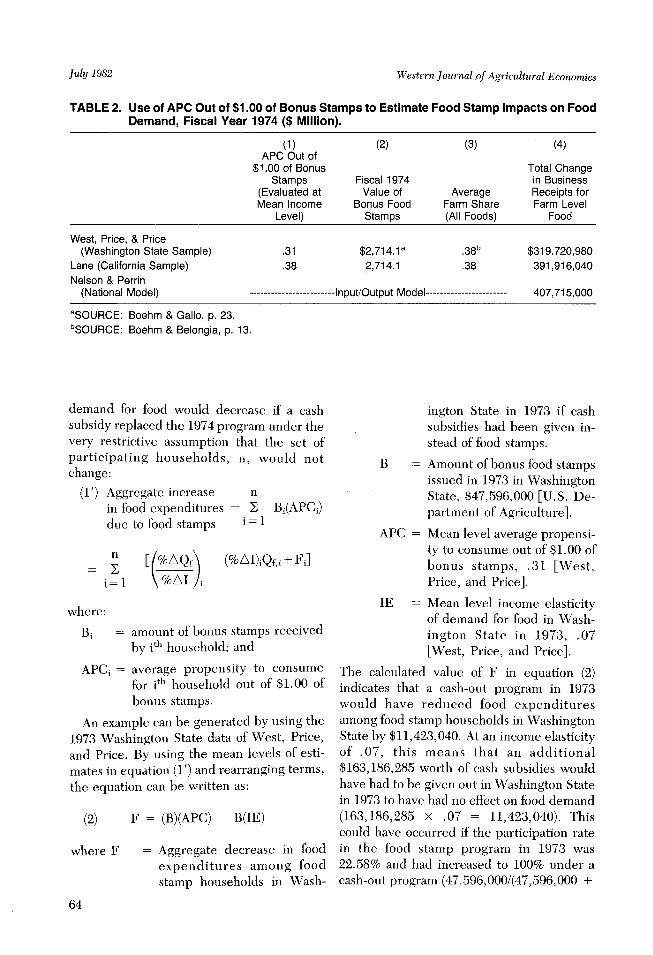
Three estimates of the change in total farmlevel business receipts resulting from bonusfood stamps were made for the year 1974(Table 2). Two of the estimates are remark-ably close considering the differences in esti-mation techniques and the problems of esti-mation.8
If a cash transfer replaced food stamps, theincrease in demand for food is a function ofindividuals' income elasticities. The in-put/output solution under the cash programcould be derived from the food stamp solu-tion under the assumption that the aggregateamount of bonus stamps would not change.This assumption implicitly assumes that theparticipation rate does not change.
West, Price and Price used the regressionapproach that included value of food as thedependent variable and food stamp participa-tion plus various socio-economic and psycho-logical variables as explanatory variables. Re-sults indicated that the value of food wasmore than twice as responsive to the receiptof bonus stamps as the value of food is toincome at the mean income level. Lane'sstudy shows similar results. By solving equa-
ntion (1) for E Fi, it can be seen that the
i=l
8The input/output approach captures the indirect andinduced effects as well as the direct effects pictured bythe regression approach. If the indirect and inducedeffects were eliminated, the aggregate effect on busi-ness receipts at the farm level would be closer to thosecited for the regression results.
63
Phillips and Price
Western Journal of Agricultural Economics
TABLE 2. Use of APC Out of $1.00 of Bonus Stamps to Estimate Food Stamp Impacts on FoodDemand, Fiscal Year 1974 ($ Million).
(1) (2) (3) (4)APC Out of
$1.00 of Bonus Total ChangeStamps Fiscal 1974 in Business
(Evaluated at Value of Average Receipts forMean Income Bonus Food Farm Share Farm Level
Level) Stamps (All Foods) Food
West, Price, & Price(Washington State Sample) .31 $2,714.1a .38b $319.720,980
Lane (California Sample) .38 2,714.1 .38 391,916,040Nelson & Perrin
(National Model) ------------------------Input/Output Model----------------------- 407,715,000
aSOURCE: Boehm & Gallo, p. 23.bSOURCE: Boehm & Belongia, p. 13.
demand for food would decrease if a cashsubsidy replaced the 1974 program under thevery restrictive assumption that the set ofparticipating households, n, would notchange:
(1') Aggregate increase nin food expenditures = E Bi(APCi)due to food stamps = 1
n [/ %AQf\ (%AI)iQf,i + Fi]
i=l %AI /
where:
Bi = amount of bonus stamps receivedby ith household; and
APCi = average propensity to consumefor itl household out of $1.00 ofbonus stamps.
An example can be generated by using the1973 Washington State data of West, Price,and Price. By using the mean levels of esti-mates in equation (1') and rearranging terms,the equation can be written as:
(2) F = (B)(APC) - B(IE)
where F = Aggregate decrease in foodexpenditures among foodstamp households in Wash-
64
ington State in 1973 if cashsubsidies had been given in-stead of food stamps.
B = Amount of bonus food stampsissued in 1973 in WashingtonState, $47,596,000 [U.S. De-partment of Agriculture].
APC = Mean level average propensi-ty to consume out of $1.00 ofbonus stamps, .31 [West,Price, and Price].
IE = Mean level income elasticityof demand for food in Wash-ington State in 1973, .07[West, Price, and Price].
The calculated value of F in equation (2)indicates that a cash-out program in 1973would have reduced food expendituresamong food stamp households in WashingtonState by $11,423,040. At an income elasticityof .07, this means that an additional$163,186,285 worth of cash subsidies wouldhave had to be given out in Washington Statein 1973 to have had no effect on food demand(163,186,285 x .07 = 11,423,040). Thiscould have occurred if the participation ratein the food stamp program in 1973 was22.58% and had increased to 100% under acash-out program (47,596,000/(47,596,000 +
July 1982
Food Stamps and Cash Transfers
163,186,285) = .2258). Without knowinghow the participation rate would havechanged, the effect of a cash-out enactedduring 1973 (before elimination of the pur-chase requirement) cannot be clearly ascer-tained. Taking account of the sensitivity ofthe impact on food expenditures to variabilityof parameter estimates in equation (2), theonly conclusion that can be made is that thechange in total food expenditures resultingfrom a cash-out would have been somewherebetween zero and a substantial decrease.
The comparison between the present foodstamp program and a cash-out would be sub-stantially different. The average propensityto consume food from bonus stamps shouldbe less than before elimination of the pur-chase requirement. This can be expectedbecause less households will be constrainedwith elimination of the purchase require-ment. Consequently, the increase in partici-pation needed to offset the decrease in foodexpenditures of the individual householdwould be less. Neither the regression ap-proach nor the input/output approach ad-dress how the set of participating householdswould change if a cash transfer replaced thecurrent food stamp program. Although eitherof these approaches could be used to esti-mate food demand impacts under the currentfood stamp program (no purchase require-ment), the food demand impact under a cashprogram will remain unclear until studies arecompleted that incorporate models to explainhow the set of participating households willchange if a cash program were to be enacted.
Summary
This theoretical framework shows that foodexpenditures of food stamp households willdecrease with a cash out. This effect wouldbe substantial judging by results from pastempirical studies. Participation rates are,however, expected to increase. Thus, to em-pirically measure the comparative effect of aproposed cash program on the demand forfood will require further studies designed toestimate the effect on participation under acash out program.
Indifference curve analysis shows that ifthe relative preference for nonfood is highenough, some households can be on a higherutility curve by not participating in the FoodStamp Program. However, this probablydoes not explain why a large number ofhouseholds do not participate in the FoodStamp Program. Reasons such as the actualcost of obtaining stamps, the psychologicalcost and stigma attached to the use of foodstamps should be combined with indifferencecurve theory to predict what the set of par-ticipating households would be under a cashprogram.
Past research on psychological need theoryshows the relative preference of food wasgreater for food stamp recipients than foreligible nonrecipients. Needs other than bas-ic physiological needs may be enhanced bynot participating in the Food Stamp Pro-gram. A cash out has the potential for in-creasing the fulfillment of some of the needsabove the physiological level.
Input/output analysis and regression mod-els have been used to estimate food demandimpacts prior to elimination of the purchaserequirement. Such models are also appropri-ate for estimating food demand impacts sinceelimination of the purchase requirement.However, food demand impacts that wouldoccur under a cash program requires anempirical model that can predict how theparticipation rate would change if a cash pro-gram replaced the current food stamp pro-gram. An example of an empirical modelappropriate for this purpose is a qualitativeresponse model. A representative sample ofparticipating and eligible nonparticipatinghouseholds could be designed to obtain infor-mation to empirically estimate the food de-mand impact that would likely occur if a cashprogram were enacted.
References
Boehm, W. T. and M. Belongia. "The Farmer's Share: ASummary of Statistical Measures." National Food Re-view, June 1978, pp. 13-14.
65
Phillips and Price

Western Journal of Agricultural Economics
Boehm, W. T. and A. E. Gallo. "Has Food AssistanceHelped?" National Food Review, June 1978, pp. 23-26.
Clarkson, Kenneth W. Food Stamps and Nutrition,(American Enterprise for Public Policy Research;Washington, D.C.), 1975.
Gold, N. L., A. C. Hoffman, and F. V. Waugh. "Eco-nomic Analysis of the Food Stamp Program, A SpecialReport." U.S. Government Printing Office, 1940.
Lane, S. "Food Distribution and Food Stamp ProgramEffects on Food Consumption and NutritionalAchievement of Low Income Persons in Kern County,California." American Journal of Agricultural Eco-nomics, 60(1978):108-16.
MacDonald, Maurice. Food, Stamps, and IncomeMaintenance, New York: Academic Press; 1977.
Mittelhammer, R. C. and D. A. West. "Food StampParticipation Among Low Income Households: Theo-retical Considerations of the Impact on The Demandfor Food." Southern Journal of Agricultural Econom-ics, 7(1975):223-31.
Nelson, P. E., Jr. and J. Perrin. "Effects of the U.S.Food Stamp and National School Lunch Programs,Fiscal Year 1974." American Journal of AgriculturalEconomics, 58(1976):1000-1005.
Southworth, Herman M. "The Economics of PublicMeasures to Subsidize Food Consumption." Journalof Farm Economics, 27(1945):38-66.
United States Department of Agriculture. AgriculturalStatistics: 1980 (Superintendent of Documents, U.S.Government Printing Office, Washington, D.C.20402).
U.S. Office of the Federal Register, Vol. 44, No. 199(Friday, Oct. 12, 1979) pp. 59052-56.
West, D. A. "Effects of Food Stamp Program on FoodExpenditures: An Analysis of the BLS Consumer Ex-penditure Survey, 1973-74 Diary Data." Unpublishedpaper, Washington State University, Pullman.
West, D. A., D. W. Price, and D. Z. Price. "Impact ofthe Food Stamp program on Value of Food Consumedand Nutrient Intake Among Washington Householdswith 8-12 Year Old Children." Western Journal ofAgricultural Economics, 2(1978):131-44.
66
July 1982