A comparative study of wireless communication … · A comparative study of wireless communication...
8
A comparative study of wireless communication protocols for monitoring vital signs in athletes in a soccer field G. KIOKES 1 , P. GKONIS 2 , E. ZOUNTOURIDOU 2 1 Department of Electronics, Electric Power and Telecommunications, 2 School of Electrical and Computer Engineering, 1 Hellenic Air-Force Academy, 2 National Technical University of Athens, 1 Air Base Dekeleia, 2 9 Iroon Politechniou str. ,Zografou, Athens GREECE [email protected], [email protected], [email protected] Abstract: - This paper provides a comprehensive investigation of two wireless protocols performance over short range communications for monitoring vital signs in athletes, mainly during training. Live physiological monitoring of athletes during sports can help to optimize their performance at a specific time in order to maximize athlete efficiency and preventing undesirable events like injuries. ZigBee (over IEEE 802.15.4) is becoming a popular way to create wireless personal area network due to its low power consumption and scalability while Wi-Fi (over IEEE 802.11g) provides the solution for portability with connection of mobility as well. This article presents the evaluation results of system performance using OPNET simulation for the two different wireless standards. The evaluation is concentrated on providing results regarding network values such as end-to-end delay, traffic, average throughput captured from global and objects statistics. Key-Words: - Wireless sensor networks, Performance evaluation, OPNET, Simulation, Throughput 1 Introduction The evolution on sensors technology over the last decades has opened completely new fields for the modern technological applications. Nowadays, wireless sensors networks (WSNs) [1] constitute a promising field of research in the area of Wireless Communications, given the extensive breadth of applications that they can support. They represent a new order of operating calculating systems that extends the interaction between humans and the natural environment. While up to today the wired sensors networks were globally used, the growth of microelectronic systems technology in the wireless communications sector, made feasible the use wireless sensors. The wireless technology provides more flexibility, easiness of use and fast growth of sensors networks; although in certain critical applications there are data transfer reliability issues. More analytically, the WSNs are constituted by one or more sink or base stations and by tens or thousands sensor nodes, which are scattered in a space. These nodes collect information from the environment and depending on the application, either process the information and send it to a central node, or they send it without processing. These nodes, usually sensor the temperature, the light, the vibration, the sound, e.t.c.. This information “travels” into the network, having as final destination the nodes sink. Depending on the application, sinks sent queries to the nodes, in order to gather useful information. The most important advantage of this type of network is that, the beforehand knowledge of the topology is not required. This ability allows the rapid growth of networks in remotely and wild regions. The nodes have low cost and low consumption, as they have the ability of communicating in small distances, executing limited local data process and sensor signals of various types, in their application region. A sensor network is characterized from its lifetime, its expandability, its coverage, the production cost, the fault detection and correction, its synchronization, the response time, as well as the safety it provides. The storage energy capacity of the devices is the restrictive factor of life duration. It should be noted that the critical characteristic in a lot of applications, is not the average lifetime of one node, but the minimum estimated lifetime. Training is a repeating (rollover) process consisting of four steps: assessment, planning, implementation, WSEAS TRANSACTIONS on COMMUNICATIONS G. Kiokes, P. Gkonis, E. Zountouridou E-ISSN: 2224-2864 433 Volume 14, 2015
-
Upload
nguyenkien -
Category
Documents
-
view
220 -
download
4
Transcript of A comparative study of wireless communication … · A comparative study of wireless communication...

A comparative study of wireless communication protocols for
monitoring vital signs in athletes in a soccer field
G. KIOKES1, P. GKONIS
2, E. ZOUNTOURIDOU
2
1Department of Electronics, Electric Power and Telecommunications,
2School of Electrical and Computer Engineering,
1Hellenic Air-Force Academy,
2National Technical University of Athens,
1Air Base Dekeleia,
29 Iroon Politechniou str. ,Zografou, Athens
GREECE
[email protected], [email protected], [email protected]
Abstract: - This paper provides a comprehensive investigation of two wireless protocols performance over short
range communications for monitoring vital signs in athletes, mainly during training. Live physiological
monitoring of athletes during sports can help to optimize their performance at a specific time in order to maximize athlete efficiency and preventing undesirable events like injuries. ZigBee (over IEEE 802.15.4) is
becoming a popular way to create wireless personal area network due to its low power consumption and
scalability while Wi-Fi (over IEEE 802.11g) provides the solution for portability with connection of mobility as well. This article presents the evaluation results of system performance using OPNET simulation for the two
different wireless standards. The evaluation is concentrated on providing results regarding network values such
as end-to-end delay, traffic, average throughput captured from global and objects statistics.
Key-Words: - Wireless sensor networks, Performance evaluation, OPNET, Simulation, Throughput
1 Introduction The evolution on sensors technology over the last decades has opened completely new fields for the
modern technological applications. Nowadays,
wireless sensors networks (WSNs) [1] constitute a promising field of research in the area of Wireless
Communications, given the extensive breadth of
applications that they can support. They represent a
new order of operating calculating systems that extends the interaction between humans and the
natural environment. While up to today the wired
sensors networks were globally used, the growth of microelectronic systems technology in the wireless
communications sector, made feasible the use
wireless sensors. The wireless technology provides more flexibility, easiness of use and fast growth of
sensors networks; although in certain critical
applications there are data transfer reliability issues.
More analytically, the WSNs are constituted by one or more sink or base stations and by tens or
thousands sensor nodes, which are scattered in a
space. These nodes collect information from the environment and depending on the application,
either process the information and send it to a
central node, or they send it without processing.
These nodes, usually sensor the temperature, the light, the vibration, the sound, e.t.c.. This
information “travels” into the network, having as
final destination the nodes sink. Depending on the application, sinks sent queries to the nodes, in order
to gather useful information.
The most important advantage of this type of network is that, the beforehand knowledge of the
topology is not required. This ability allows the
rapid growth of networks in remotely and wild
regions. The nodes have low cost and low consumption, as they have the ability of
communicating in small distances, executing limited
local data process and sensor signals of various types, in their application region. A sensor network
is characterized from its lifetime, its expandability,
its coverage, the production cost, the fault detection
and correction, its synchronization, the response time, as well as the safety it provides. The storage
energy capacity of the devices is the restrictive
factor of life duration. It should be noted that the critical characteristic in a lot of applications, is not
the average lifetime of one node, but the minimum
estimated lifetime. Training is a repeating (rollover) process consisting
of four steps: assessment, planning, implementation,
WSEAS TRANSACTIONS on COMMUNICATIONS G. Kiokes, P. Gkonis, E. Zountouridou
E-ISSN: 2224-2864 433 Volume 14, 2015

and monitoring [2]. Overtraining is a non desirable
process of excessive exercise training in high-
performance athletes that may lead to overtraining
syndrome. According author [3], overtraining syndrome is a neuroendocrine disorder
characterized by poor performance in competition,
inability to maintain training loads, persistent fatigue, reduced catecholamine excretion, frequent
illness, disturbed sleep and alterations in mood state.
In order to detect overtraining, the training load of each athlete needs to be monitored and
individualized. Monitoring training load requires
quantification of the intensity and duration of the
physiological stress imposed on the athlete . Consequently, training volume and intensity are the
basic training variables that characterize training
load [4],[5]. Athlete monitoring is key to achieving both short
term and long term competitive success. The more
consistent the monitoring, the more meaningful the information will be. The increased athletic
competiveness and at the same time the technology
revolution, led to discover ways of monitoring the
athletes training and performance. Monitoring each athlete data, such as heart rate, nutrition, provides
useful information, enabling the personalization of
the training, avoiding overtraining, which eventually lead performance maximization. In recent years,
several wireless access technologies are broadening
and changing our habits. Each wireless solution
offers a specific mix of transmission band, costs, and coverage according to the needs that originated
it.
A comparative study of the two technologies is given in [6]. The authors presented a broad
overview of the four most popular wireless
standards, Bluetooth, UWB, ZigBee, and Wi-Fi with a quantitative valuation in terms of the transmission
time, data coding efficiency, protocol complexity,
and power consumption. The performance analysis
of the 802.15.4 standard has been extensively studied in the literature such as [7], [8], [9]. For
instance, in [7] authors investigate the performance
of the aforementioned network through simulations in the OPNET Modeler environment and came to
the conclusion that the ZigBee protocol is well
suited for monitoring athletes subscribers and similar applications.
In this paper, firstly an overview of the mentioned
wireless protocols is presented. Following a
performance evaluation comparison of the two standards in an soccer athletic field area is
conducted using OPNET simulator, in order to
investigate the more appropriate protocol for monitoring athletes vital signs by training. A
specific scenario is analyzed and simulated and then
network values such as end-to-end delay, traffic and
throughput are exported. The rest of this paper is
organized as follows. Tthe architecture of the protocols specified for wireless sensor networks is
described in Sec. 2. Following that, Sec. 3 presents
the simulation results achieved by using OPNET Simulator for Physical and MAC layer performance
estimation. Finally, conclusions are given, offering
quantitative evaluation of the proposed approach in Sec. 4.
2 Wireless Technologies Οverview
2.1 Zigbee IEEE 802.15.4 standard [10], determines the specifications of the Physical layer and the Medium
Access Control (MAC) sub-layer of wireless
personal area networks (WPANs) using devices they consume low power. ZigBee systems are being
designed to provide wireless short-range
communications (up to 100m), depending on power output and environmental characteristics.
WSN have particularly different requirements than
standard local networks of ultra-high data
transmission speed. It is reminded that devices like sensors are able to record and transmit information
to environments inaccessible to human factors for
particularly long periods. This implies that the design of each protocol related to them must take
account of the following features:
a) the need for low power and energy consumption,
b) the need for self-configuration of the wireless network and adaptation thereof to the environment
data, and
c) the signal “shielding” mechanism against interference, at physical level.
On another aspect, the high transmission speeds
required in WLAN is of no particular concern, as the information usually transmitted relate to the
recording of certain environment data (that is a few
bytes of information) and not large volume files, as
in the case of WLAN. ZigBee specification focuses only on upper
layers (Fig. 1): starting from the network layer to the
final application layer, including the application objects themselves. The ZigBee application layer
consists of the Application Support sub-layer (APS),
the ZigBee Device Object (ZDO) and the manufacturer-defined application objects. The
responsibilities of the APS sub-layer include
maintaining tables for binding, which is the ability
WSEAS TRANSACTIONS on COMMUNICATIONS G. Kiokes, P. Gkonis, E. Zountouridou
E-ISSN: 2224-2864 434 Volume 14, 2015

to match two devices together based on their
services and their needs, and forwarding messages
between bound devices. Another responsibility of
the APS sub-layer is discovery, which is the ability to determine which other devices are operating in
the personal operating space of a device [11].
Wireless connections under 802.15.4 standard can operate in three ISM (Industrial Scientific
Medical) frequency bands with the following data
rates: 1) 250kbps in the 2.4 GHz band (O-QPSK
encoding),
2) 40kbps in the 915 MHz band (BPSK encoding)
and 3) 20 kbps in the 868 MHz band (BPSK encoding)
Fig. 1 ZigBee Communication Stack
2.2 The WI-FI standard Wireless Local Area Networks (WLANs) are one of
the internet-related technologies that during the last
decade marked the greatest expansion at global level. The replacement of analog lines with digital
ones, the expansion of optics communications (fiber
optics), and the increased information transmission
rates occurred in parallel to the replacement of certain wired functions by wireless ones. Currently,
every household, or work area with internet access
supports a wireless network through the router antenna and the wireless network card of a laptop.
Therefore, it is obvious that any design – at least in
an urban environment - of a network other than WLAN, such as those of 802.15.4 which operate in
the same frequencies and at a lower transmission
strength, must take into account the interference
caused by wireless local area networks. IEEE 802.11 protocol defines two types of
equipment (Fig 2), a wireless station, which is
usually a PC equipped with a wireless network
interface card and an access point acting as a bridge
between the wireless and wired areas of the
network. The access point usually consists of an antenna, a wired network interface and a software
that responds to protocol 802.11d, which “transfers”
data from the wireless to the wired network. Access point operates as a base-station for the wireless
network, allowing multiple terminal devices
connection to the wired network. IEEE 802.11 standard defines two operating modes: (a)
infrastructure mode and (b) ad hoc mode [12]
Fig. 2 Wi-Fi network topology
Wi-Fi standard defines the following networking
topologies:
IBSS (Independent Basic Service Set) or ad hoc
topology
This is the most simple wireless network topology (Fig. 3). The stations are peers and communicate
directly between them, peer to peer, without a
central station. This networking mode is used primarily by small networks. A necessary
precondition for the communication between two
stations is that each one is within the range of the other.
Fig. 3 IBSS topology
Infrastructure
BSS topology is a more complex networking topology in which the wireless network has cluster
form. In each cluster there is a number of wireless
WSEAS TRANSACTIONS on COMMUNICATIONS G. Kiokes, P. Gkonis, E. Zountouridou
E-ISSN: 2224-2864 435 Volume 14, 2015

stations (clients), which communicate between them
through a central distributor BS (Base Station) or,
more commonly, AP (Access Point).
There is determination of two service types, depending on the number of Aps, and therefore the
number of clusters [13]:
a) Infrastructure Basic Service Set. b) ESS, Extended Service Set
A wireless network can also consist of more than
one clusters, which can be bridged over a Distribution System. The distribution system is the
network connecting APs between them and with the
other networks. The entire interconnected network,
including the distribution system and the APs constitutes the ESS topology. That is, it is a set of
clusters, each one of which consists of an access
point AP, with all APs being connected to a network structure. This achieves larger wireless coverage
range. In this case, each wireless station can
commute from on cluster to the other without the station itself, or the network experiencing any
change. This ability of the network is called
roaming.
IEEE 802.11g protocol operates on the same bandwidth with 802.11b, namely 22MHz, which
allows it to achieve higher transmission speeds.
Moreover, depending on the environmental noise, the protocol is able to select among new operation
speeds which are 6,9,12,18,24,46,48,54Mbps. In
addition, it is compatible with 802.11b as it can also
support 1, 2, 5.5 and 11Mbps speeds using DSSS and CCK encoding. The need to increase
transmission speeds while maintaining bandwidth at
22MHz, in conjunction with the resistance of the system to intersymbol interference, were the key
parameters for the use of a new configuration,
OFDM (Orthogonal Frequency Division Multiplexing). New speeds (6,9,12...54) are the
result of OFDM configuration. OFDM is the sole
configuration able to achieve high transmission rates
while resisting interference. The following table depicts the frequency bands and the theoretical and
actual speeds of the various 802.11 standards [14]
Table 1 The frequency bands of 802.11 standard
Standard
Frequency Band
Typical
Transmission Rate
Theoretical
Transmission Rate
Range
Indoors
802.11a 5GHz 23Mbps 54Mbps 35m
802.11b 2.4GHz 4.3Mbps 11Mbps 38m
802.11g 2.4GHz 19Mbps 54Mbps 38m
3 Simulation Results
3.1 Simulation model description OPNET Modeler [15] constitutes a specialized tool
in the area of communications, having graphic
environment for modelling and simulation, of various types of networks. The platform allows the
design and thorough study of telecommunication
networks offering great flexibility depending on the layer of the network concerned. Moreover
simulating separate models for each network, it is
possible to take measurements of global and object parameters, such as packet delay, packet loss,
throughput, e.t.c. and through them can export
general conclusions of the systems performance.
The main objective was the development and study of the two communication networks between
athletes and coordinator (coach). The area selected
for the simulation was a typical soccer field. The length of a full-size soccer pitch must be between
100 yards (90 metres) and 130 yards (120 metres)
and the width between 50 yards (45 metres) and 100
yards (90 metres) with 11 players. Each of the 11 players was able to move in a specific territory
clockwise in a parallelogram trajectory round the
area depending on its playing position. For example, a Goalkeeper player, can move along the sidelines
of the playing area near the goalposts (Fig. 4 and
Fig. 5). The subscribers are moving with different speeds (10 to 15 Km/h). The scenario primary
objectives were the recording of the communication
link between the nodes and the coach, the collection
of the identification and status data transmitted over a short period of time for each network topology
whereas depending on the results, conclusions
would arise regarding each protocol’s performance.
Fig. 4. Geographic positioning in simulation environment
for WLAN IEEE 802.11g protocol
WSEAS TRANSACTIONS on COMMUNICATIONS G. Kiokes, P. Gkonis, E. Zountouridou
E-ISSN: 2224-2864 436 Volume 14, 2015

Fig. 5 Geographic positioning in simulation
environment for ZigBEE protocol.
At the beginning, mobile stations of the network
were requested to send a large amount of
information related to their status. For this reason, in
the simulation model, the size of packets transferred via Database Access application was set to Medium
Load. The duration of the simulation was selected to
be 10 minute due to the amount of data required to be processed. Data rate was set to 250 kbits/second
in the 2.4 GHz for ZigBee and 54 Mbits/second in
the same frequency band for 802.11g.
3.2. Results One can collect values from individual nodes in the
network (node statistics) or from the entire network
(global statistics). Global statistics can be used to gather information about the network as a whole.
Node statistics provide information about individual
node such as coordinator, router or end device. The
eleven nodes in the athletic field topology were identical. The Global Statistics of the network,
whose graphs will be examined, are listed and
analyzed in the following:
End to End delay (sec): is the time that
lapsed between creation and reception of an
application packet.
Throughput (bits/sec): Represents the total
number of bits (in bits/sec) forwarded from wireless LAN to higher layers in all WLAN nodes of the
network.
The Node Statistics for the Coordinator and one
node (player 5) of the network are analyzed below:
Throughput (bits/sec): represents the total
data traffic in bits/sec successfully received and
forwarded to the higher layer by the WLAN.
Data traffic received (bits/sec): represents
the average number of bits per second for traffic successfully received by the MAC from the physical
layer. This includes retransmissions.
Data traffic sent (bits/sec): represents the
traffic transmitted by the MAC in bits/sec. While
computing the size of the transmitted packets for
this statistic, the physical layer and MAC headers of
the packet are also included.
The results and graphs are presented in the
following Figs 6-10. Fig. 6 demonstrate the end to
end delay of the network for the 802.11g (blue curve) and ZigBee (red curve) technologies
respectively. As a result, the delay is higher in
ZigBee than in 802.11g. The main reason for this is the different data rate according the used
technology. The next graph (Fig. 7) represents
network throughput (bps). It can be seen that throughput is heavily influenced by the traffic load
since none of the networks achieves theoretical
transmission values and 802.11g performs better.
Similarly results can be obtain for Fig. 8. It can been observed that WIFI throughput is higher and
coordinator does not accept packets until the
pending data are not completely transmitted avoiding collisions situations. Fig. 9,10 represents
traffic received and sent (bits/sec) values for
coordinator and node 5 player. In both cases, it is
observed that WLAN technology continues to perform better. Fig. 11 and 12 also shows that all
nodes have more or less equivalent traffics. Taking
everything into account 802.11g provides fast networking connections and outperform the other
standard.
4. CONCLUSIONS The objective of this paper is to examine the
performance of the IEEE 802.11g and IEEE
802.15.4 standards for wireless sensor networks applications. At the beginning an overview of the
two wireless technologies adapted in monitoring
vital signs of athletes, mainly during training is presented. Furthermore through simulations in
OPNET Modeler environment global and node
statistics in soccer field area with eleven nodes is
examined. The trajectory on each mobile node is configured on specific destination round the field.
According to simulation results the 802.11g
protocol tends to outperform IEEE 802.15.4 protocol mainly due to its high transmission rate.
More specific it gives less network end to end delay
and higher average throughput.
In the future authors intend to perform further experiments in order to examine power consumption
and energy efficiency of the two technologies.
WSEAS TRANSACTIONS on COMMUNICATIONS G. Kiokes, P. Gkonis, E. Zountouridou
E-ISSN: 2224-2864 437 Volume 14, 2015

ZigBee's lower data rates, can support much lower
power consumption rates. Extending this work
authors will develop the whole physical layer
transmitter and receiver for the two protocols using Nallatech XtremeDSP Development Kit with Xilinx
FPGA for real time implementations and study the
theoretical model variation.
Fig. 6. Global statistics - end to end delay (sec) comparison for both protocols
Fig. 7. Global statistics – Throughput (bits/sec) comparison for both protocols
Object (global) - IEEE 802.15.4 (bits/sec) Object (global) - IEEE 802.11g (bits/sec)
Object (global) - IEEE 802.11g (bits/sec) Object (global) - IEEE 802.15.4 (bits/sec)
WSEAS TRANSACTIONS on COMMUNICATIONS G. Kiokes, P. Gkonis, E. Zountouridou
E-ISSN: 2224-2864 438 Volume 14, 2015

Fig. 8. Coordinator statistics – Throughput (bits/sec) comparison for both protocols
Fig. 9. Coordinator statistics -Traffic received, Traffic sent (bits/sec) comparison for both protocols
Object (Coordinator) - IEEE 802.11g – Traffic Rcvd (bits/sec) Object (Coordinator) - IEEE 802.15.4 Traffic Rcvd (bits/sec)
Object (Coordinator) - IEEE 802.11g - Traffic Sent (bits/sec) Object (Coordinator) - IEEE 802.15.4 Traffic Sent (bits/sec)
Object (Coordinator) - IEEE 802.15.4 (bits/sec) Object (Coordinator) - IEEE 802.11g (bits/sec)
WSEAS TRANSACTIONS on COMMUNICATIONS G. Kiokes, P. Gkonis, E. Zountouridou
E-ISSN: 2224-2864 439 Volume 14, 2015
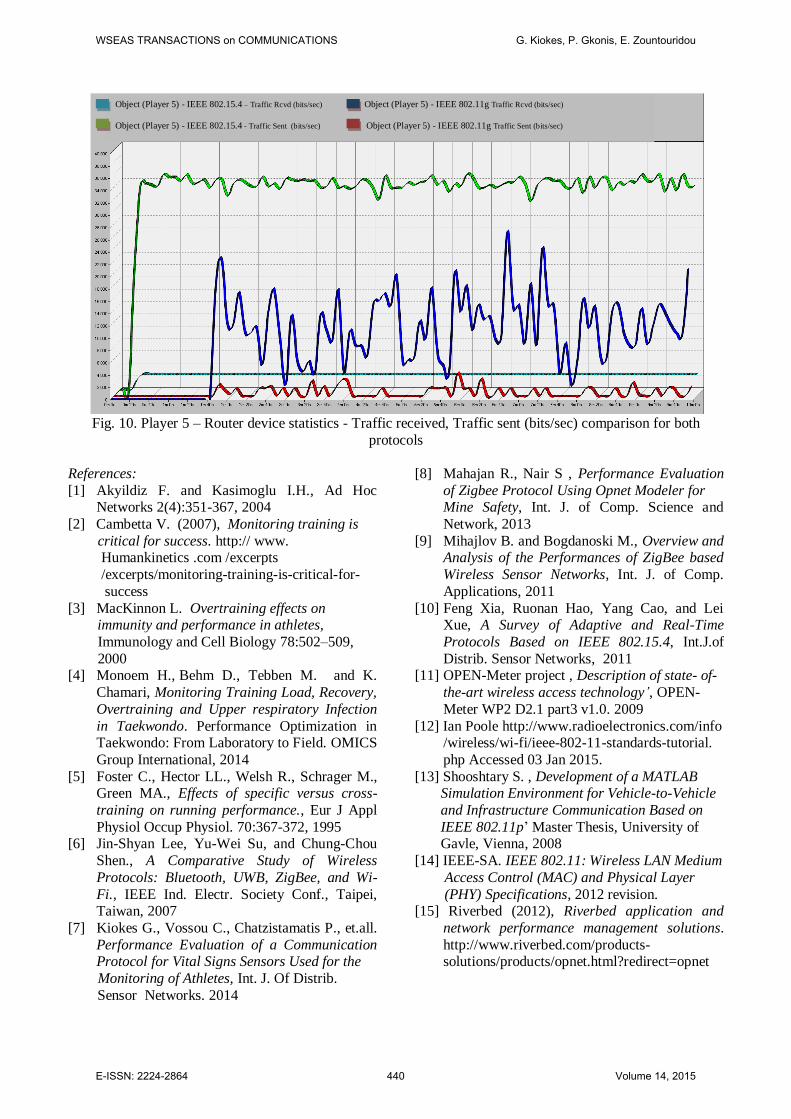
Fig. 10. Player 5 – Router device statistics - Traffic received, Traffic sent (bits/sec) comparison for both
protocols
References:
[1] Akyildiz F. and Kasimoglu I.H., Ad Hoc Networks 2(4):351-367, 2004
[2] Cambetta V. (2007), Monitoring training is
critical for success. http:// www. Humankinetics .com /excerpts
/excerpts/monitoring-training-is-critical-for-
success
[3] MacKinnon L. Overtraining effects on immunity and performance in athletes,
Immunology and Cell Biology 78:502–509,
2000 [4] Monoem H., Behm D., Tebben M. and K.
Chamari, Monitoring Training Load, Recovery,
Overtraining and Upper respiratory Infection
in Taekwondo. Performance Optimization in Taekwondo: From Laboratory to Field. OMICS
Group International, 2014
[5] Foster C., Hector LL., Welsh R., Schrager M., Green MA., Effects of specific versus cross-
training on running performance., Eur J Appl
Physiol Occup Physiol. 70:367-372, 1995 [6] Jin-Shyan Lee, Yu-Wei Su, and Chung-Chou
Shen., A Comparative Study of Wireless
Protocols: Bluetooth, UWB, ZigBee, and Wi-
Fi., IEEE Ind. Electr. Society Conf., Taipei, Taiwan, 2007
[7] Kiokes G., Vossou C., Chatzistamatis P., et.all.
Performance Evaluation of a Communication Protocol for Vital Signs Sensors Used for the
Monitoring of Athletes, Int. J. Of Distrib.
Sensor Networks. 2014
[8] Mahajan R., Nair S , Performance Evaluation
of Zigbee Protocol Using Opnet Modeler for Mine Safety, Int. J. of Comp. Science and
Network, 2013
[9] Mihajlov B. and Bogdanoski M., Overview and Analysis of the Performances of ZigBee based
Wireless Sensor Networks, Int. J. of Comp.
Applications, 2011
[10] Feng Xia, Ruonan Hao, Yang Cao, and Lei Xue, A Survey of Adaptive and Real-Time
Protocols Based on IEEE 802.15.4, Int.J.of
Distrib. Sensor Networks, 2011 [11] OPEN-Meter project , Description of state- of-
the-art wireless access technology’, OPEN-
Meter WP2 D2.1 part3 v1.0. 2009
[12] Ian Poole http://www.radioelectronics.com/info /wireless/wi-fi/ieee-802-11-standards-tutorial.
php Accessed 03 Jan 2015.
[13] Shooshtary S. , Development of a MATLAB Simulation Environment for Vehicle-to-Vehicle
and Infrastructure Communication Based on
IEEE 802.11p’ Master Thesis, University of Gavle, Vienna, 2008
[14] IEEE-SA. IEEE 802.11: Wireless LAN Medium
Access Control (MAC) and Physical Layer
(PHY) Specifications, 2012 revision. [15] Riverbed (2012), Riverbed application and
network performance management solutions.
http://www.riverbed.com/products-solutions/products/opnet.html?redirect=opnet
Object (Player 5) - IEEE 802.15.4 – Traffic Rcvd (bits/sec) Object (Player 5) - IEEE 802.11g Traffic Rcvd (bits/sec)
Object (Player 5) - IEEE 802.15.4 - Traffic Sent (bits/sec) Object (Player 5) - IEEE 802.11g Traffic Sent (bits/sec)
WSEAS TRANSACTIONS on COMMUNICATIONS G. Kiokes, P. Gkonis, E. Zountouridou
E-ISSN: 2224-2864 440 Volume 14, 2015