A comparative and predictive model to determine factors ...
154
Retrospective eses and Dissertations Iowa State University Capstones, eses and Dissertations 1989 A comparative and predictive model to determine factors related to preparation and entry into the teaching profession Beverly Jean Young Iowa State University Follow this and additional works at: hps://lib.dr.iastate.edu/rtd Part of the Higher Education Administration Commons , and the Higher Education and Teaching Commons is Dissertation is brought to you for free and open access by the Iowa State University Capstones, eses and Dissertations at Iowa State University Digital Repository. It has been accepted for inclusion in Retrospective eses and Dissertations by an authorized administrator of Iowa State University Digital Repository. For more information, please contact [email protected]. Recommended Citation Young, Beverly Jean, "A comparative and predictive model to determine factors related to preparation and entry into the teaching profession " (1989). Retrospective eses and Dissertations. 9256. hps://lib.dr.iastate.edu/rtd/9256
Transcript of A comparative and predictive model to determine factors ...

Retrospective Theses and Dissertations Iowa State University Capstones, Theses andDissertations
1989
A comparative and predictive model to determinefactors related to preparation and entry into theteaching professionBeverly Jean YoungIowa State University
Follow this and additional works at: https://lib.dr.iastate.edu/rtd
Part of the Higher Education Administration Commons, and the Higher Education and TeachingCommons
This Dissertation is brought to you for free and open access by the Iowa State University Capstones, Theses and Dissertations at Iowa State UniversityDigital Repository. It has been accepted for inclusion in Retrospective Theses and Dissertations by an authorized administrator of Iowa State UniversityDigital Repository. For more information, please contact [email protected].
Recommended CitationYoung, Beverly Jean, "A comparative and predictive model to determine factors related to preparation and entry into the teachingprofession " (1989). Retrospective Theses and Dissertations. 9256.https://lib.dr.iastate.edu/rtd/9256

INFORMATION TO USERS
The most advanced technology has been used to photograph and reproduce this manuscript from the microfilm master. UMI films the text directly from the original or copy submitted. Thus, some thesis and dissertation copies are in typewriter face, while others may be from any type of computer printer.
The quality of this reproduction is dependent upon the quality of the copy submitted. Broken or indistinct print, colored or poor quality illustrations and photographs, print bleedthrough, substandard margins, and improper alignment can adversely affect reproduction.
In the unlikely event that the author did not send UMI a complete manuscript and there are missing pages, these will be noted. Also, if unauthorized copyright material had to be removed, a note will indicate the deletion.
Oversize materials (e.g., maps, drawings, charts) are reproduced by sectioning the original, beginning at the upper left-hand corner and continuing from left to right in equal sections with small overlaps. Each original is also photographed in one exposure and is included in reduced form at the back of the book. These are also available as one exposure on a standard 35mm slide or as a 17" x 23" black and white photographic print for an additional charge.
Photographs included in the original manuscript have been reproduced xerographically in this copy. Higher quality 6" x 9" black and white photographic prints are available for any photographs or illustrations appearing in this copy for an additional charge. Contact UMI directly to order.
University Microfilms International A Bell & Howell Information Company
300 North Zeeb Road, Ann Arbor, Ml 48106-1346 USA 313/761-4700 800/521-0600


Order Number 8920201
A comparative and predictive model to determine factors related to preparation and entry into the teaching profession
Young, Beverly Jean, Ph.D.
Iowa State University, 1989
U M I SOON.ZeebRd. Ann Aibor, MI 48106


A comparative and predictive model to determine
factors related to preparation and entry
into the teaching profession
by
Beverly Jean Young
A Dissertation Submitted to the
Graduate Faculty in Partial Fulfillment of the
Requirements for the Degree of
DOCTOR OF PHILOSOPHY
Department: Professional Studies in Education Major: Education (Higher Education)
Approved:
In Charge of Major Work
Fop^the Graduate Collège
Iowa State University Ames, Iowa
1989
Signature was redacted for privacy.
Signature was redacted for privacy.
Signature was redacted for privacy.
Signature was redacted for privacy.

i i
TABLE OF CONTENTS
Page
CHAPTER I 1
Introduction 1
Statement of the Problem 9
Purpose of the Study 1 0
Importance of the Study 10
Issues to be Addressed 12
Independent and Dependent Variables 12
Basic Assumptions 13
Delimitations of the Study 14
Definition of Terms 14
Organization of the Study 15
CHAPTER II 16
Review of Selected Literature 16
Those Who Leave and Those Who Remain in Teaching 26
Teacher Preparation 34
Do Higher Ability Students Enter Education? 38
Job Characteristics 44
Would You Choose Teaching Again? 47
Extracurricular Activities and Educational 50 Aspirations
CHAPTER III 57
Methodology 57
The Iowa State University Sample 57

ill
Page
High School and Beyond Senior Cohorts 61
Treatment of the Data 66
The Theoretical Framework 72
Research Hypotheses to be Tested 80
CHAPTER IV 82
Hypothesis 1 83
Hypothesis 2 86
Hypothesis 3 88
Hypothesis 4 89
Hypothesis 5 94
Hypothesis 6 102
Hypothesis 7 103
Hypothesis 8 110
CHAPTER V 116
Summary, Discussion and Recommendation for 116 Future Research
Recommendations for Further Research 124
BIBLIOGRAPHY 126
ACKNOWLEDGEMENTS 137
APPENDIX 138

1
CHAPTER 1
Introduction
For many years, education was seen as the key to
unlocking a myriad of opportunities that would lead to
achievement and success. Public education has, however,
come under severe criticism in the past several years and
the once invincible ability of education to deliver its
promises is dubious at best (Carnegie Forum on Education
and the Economy, 1986).
Teaching is a feminized occupation, taking its ,
current form in the 1930s and 1940s when women were
expected to subordinate their careers to childrearing.
Teaching salaries, therefore, rank at the bottom of all
occupations requiring a college degree (Carnegie Forum on
Education and the Economy, 1986; Chapman & Hutcheson,
1982; Darling-Hammond, 1984).
After years of teacher surplus, teaching jobs and
applicants were roughly in balance in 1985. For at least
the next ten years, however, it is anticipated that jobs
will be more abundant than applicants. This demand for
teachers is expected to increase due to three factors:
student enrollment increases; pupil teacher ratio reforms;
and education reforms (U.S. Dept. of Education, 1987).

2
Although many researchers question the existence of a
teacher shortage, using the available supply and demand
criteria (Berryman, 1985; Weaver, 1981), other researchers
assert a shortage is imminent. The 1970s marked the end
of the baby boom and consequently, the demand for
significant numbers of new teachers. Since the children
of these baby boomers are now entering school, the demand
for teachers is expected to rise again. As shown in Table
1, an increase in the demand for elementary teachers is
expected through the early 1990s with only 63% of the
demand for school teachers expected to be met in 1993
(Harris & Harris, 1988).
The fall in teacher supply can also be attributed to
the increased opportunities for women and minorities in
other professions (Langway, 1980; A Nation at Risk, 1983).
Many of the most accomplished teachers are now declaring
they would not choose a teaching career if they had to
start all over (National Education Association, 1981;
Wangberg et al., 1982; Heyns, 1988).
The academic ability of teacher education graduates
has been cast into doubt by many researchers (Chapman &
Hutcheson, 1982; Schlecty & Vance, 1982; Weaver, 1979;

3
Table 1. Estimated supply of new teacher graduates compared to estimated total demand for additional teachers in regular elementary and secondary schools
Year (fall)
Estimated supply of new teacher graduates
Estimated demand for additional teachers
Supply as a
percent of demand
Intermediate alternative projections
1983 146 148 98.6
1984 146 142 102.8
1985 1 44 157 91 .7
1986 142 170 83.5
1987 1 40 160 87.5
1983-87 718 777 92.4
1 988 139 1 64 84.8
1989 139 173 80.3
1 990 139 183 76.0
1 991 1 38 1 95 70.8
1992 137 209 65.6
1988-92 692 924 74.9
^National Education Association. Teacher Supply and Demand in Public Schools, 1982-83.
4
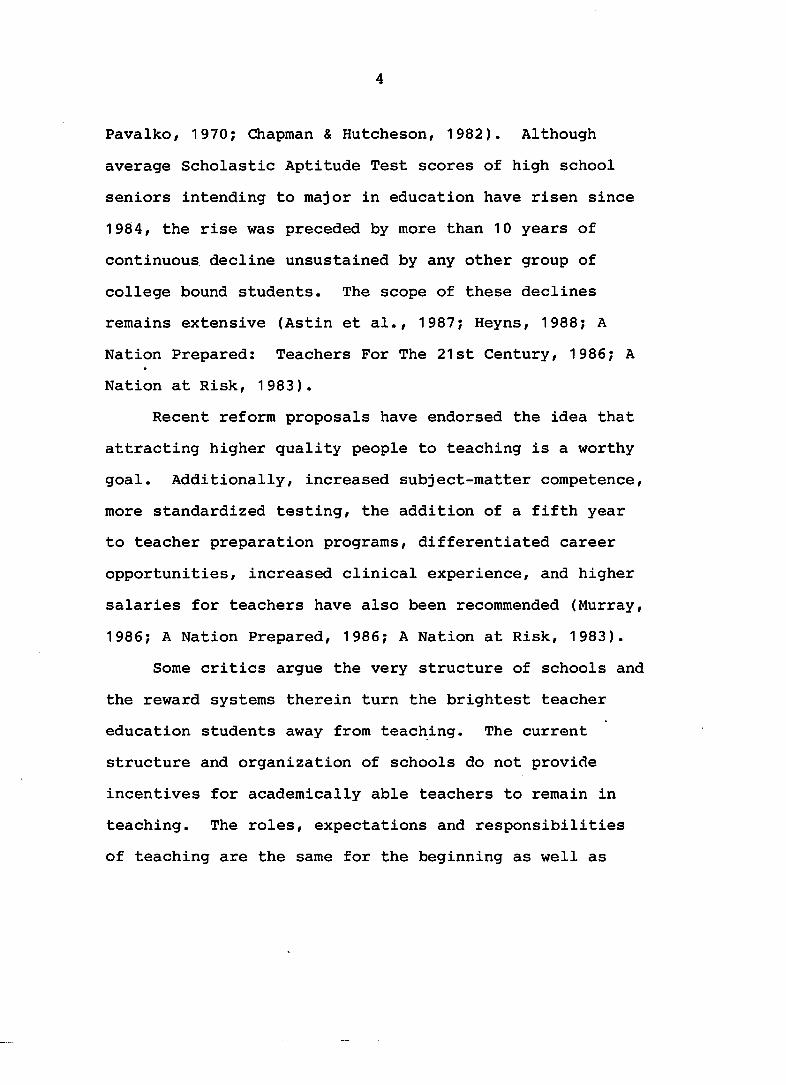
Pavalko, 1970; Chapman & Hutcheson, 1982). Although
average Scholastic Aptitude Test scores of high school
seniors intending to major in education have risen since
1984, the rise was preceded by more than 10 years of
continuous decline unsustained by any other group of
college bound students. The scope of these declines
remains extensive (Astin et al., 1987; Heyns, 1988; A
Nation Prepared; Teachers For The 21st Century, 1986; A
Nation at Risk, 1983).
Recent reform proposals have endorsed the idea that
attracting higher quality people to teaching is a worthy
goal. Additionally, increased subject-matter competence,
more standardized testing, the addition of a fifth year
to teacher preparation programs, differentiated career
opportunities, increased clinical experience, and higher
salaries for teachers have also been recommended (Murray,
1986; A Nation Prepared, 1986; A Nation at Risk, 1983).
Some critics argue the very structure of schools and
the reward systems therein turn the brightest teacher
education students away from teaching. The current
structure and organization of schools do not provide
incentives for academically able teachers to remain in
teaching. The roles, expectations and responsibilities
of teaching are the same for the beginning as well as
5
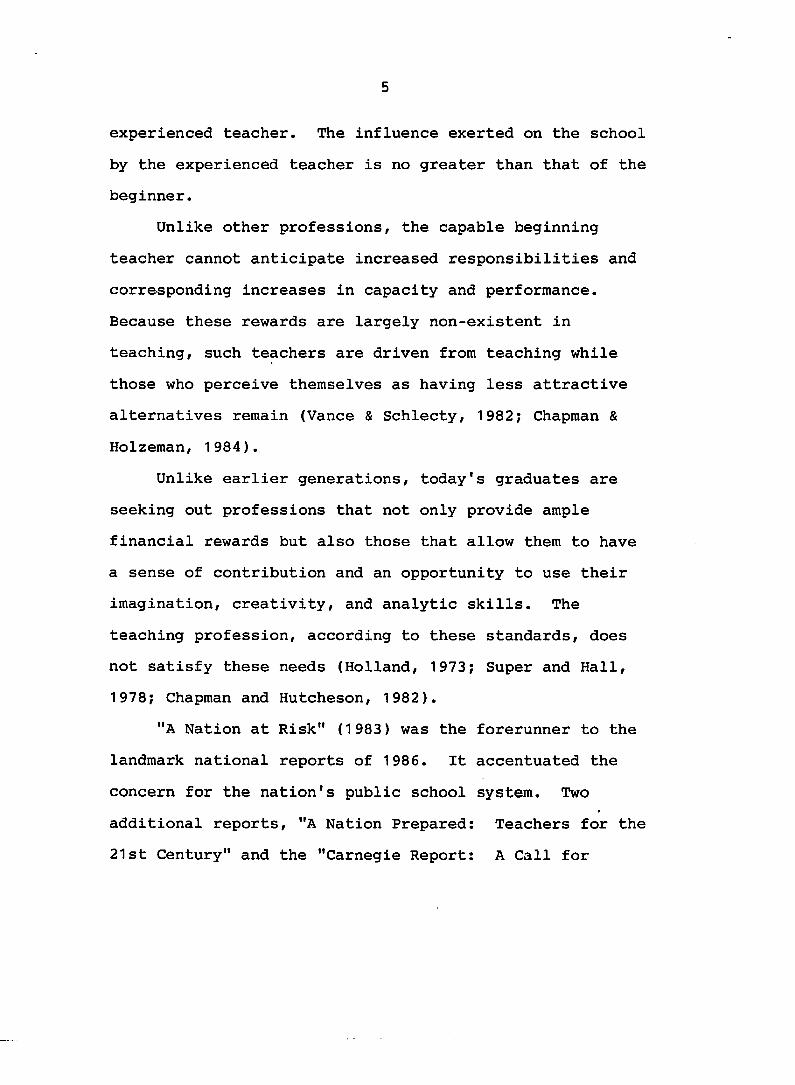
experienced teacher. The influence exerted on the school
by the experienced teacher is no greater than that of the
beginner.
Unlike other professions, the capable beginning
teacher cannot anticipate increased responsibilities and
corresponding increases in capacity and performance.
Because these rewards are largely non-existent in
teaching, such teachers are driven from teaching while
those who perceive themselves as having less attractive
alternatives remain (Vance & Schlecty, 1982; Chapman &
Holzeman, 1984).
Unlike earlier generations, today's graduates are
seeking out professions that not only provide ample
financial rewards but also those that allow them to have
a sense of contribution and an opportunity to use their
imagination, creativity, and analytic skills. The
teaching profession, according to these standards, does
not satisfy these needs (Holland, 1973; Super and Hall,
1978; Chapman and Hutcheson, 1982).
"A Nation at Risk" (1983) was the forerunner to the
landmark national reports of 1986. It accentuated the
concern for the nation's public school system. Two
additional reports, "A Nation Prepared: Teachers for the
21st Century" and the "Carnegie Report: A Call for
6
Redesigning the Schools" were issued to assess the status
of teaching and teacher training. Although different in
form and origin, these reports did converge on the need
to reform the country's public schools.
The release of "A Nation Prepared: Teachers for the
21st Century" gave impetus to some of the most
controversial recommendations of the report: the
establishment of a National Board for Professional
Standards, greatly increased pay for teachers, the
abolition of the undergraduate major in education, and the
creation of Master in Teaching degree programs for
professional teacher education. As a result of this
education reform movement, states and local school board»
have raised standards for students and teachers,
substantially raised teacher salaries in many districts,
created career ladders, and instituted merit pay plans.
The conditions that characterize teaching are
increasingly undesirable to people who qualify for jobs
in the upper stratum of the American work force. Most
occupations characterized as a "profession" bestow upon
their members a certain amount of esoteric knowledge as
well as autonomy in performing duties. Members have some
input regarding standards used to judge their work, they
judge the qualifications of newly entering professionals

7
in their field, and they have a major voice in deciding
what preparation program is appropriate for professionals
in their field.
Teaching, conversely, is diffused with bureaucracy.
The rules that guide teachers' actions are made by others.
The textbook and curriculum dictate what teachers can do
(A Nation at Risk, 1983). As much as 50 percent of
teachers' workday may be laden with non-instructional
duties (e.g., lunchroom duties and hall monitoring). The
experienced teacher's skills are used no differently than
those of the beginning teacher. Policies continuously
constrain the exercise of independent judgement on the
part of teachers (Carnegie Forum on Education and the
Economy, 1986; Chapman & Hutcheson, 1982).
A major determinant of professionalism for any
occupation is salary structure.. Most occupations hold the
prospect of higher salaries either for the beginner or
after years of experience in a profession. The salary
configuration of teachers holds no such prospects at
either end of the continuum. Beginning teachers' salaries
are lower than the majority of all other fields requiring
a college degree, even after they are adjusted to reflect
a twelve-month base (Darling-Hammond, 1984). Teachers'
wages reach a plateau within ten to 12 years after entry

8
with no prospects for real salary increases. These
conditions are driving many capable teachers out of the
profession and the task of attracting new students to
teaching will reach insurmountable proportions unless
fundamental changes are made (Carnegie Forum on Education
and the Economy, 1986; A Nation at Risk, 1983; Chapman,
.1 984; Vance & -Schlecty, 1982; Weaver, 1979; Pavalko, 1 970;
Chapman & Hutcheson, 1982).
The inquiry into teacher quality will require school
administrators to consider seriously the role of
compensation in holding and attracting more capable
teachers (U.S. Dept. of Education, 1987). Teaching must
offer salaries, benefits and working conditions
approximating other professions if the goal is to attract
and retain individuals of better than average intellectual
ability (Carnegie Forum on Education and the Economy,
1986). It is imperative that teaching become a more
desirable occupational pursuit inasmuch as the widening
range of careers available to men and women has resulted
in a smaller pool of able college graduates willing to opt
for a teaching career (Chapman, 1984; Vance & Schlecty,
1982). It is important to make the most efficient use of
our teachers but it is more important to make the most
efficient use of our very best teachers (Tucker & Mandel,
1986).

9
Statement of the Problem
The decline in the number of students opting for a
teaching career seriously threatens our children and our
future as a nation. Teacher education institutions are
being confronted with many challenges resulting from
students' lack of interest in teaching careers.
This study will investigate selected characteristics
that help to identify teacher education students who
enroll in a beginning education course, graduate in
teacher education and choose to enter the teaching
profession from those who cease to persist through this
preparation and entry cycle. The sample of teachers
remaining will be compared to a representative national
sample of beginning teachers based upon certain background
characteristics including;
1. Demographic and background variables.
2. Importance of job characteristics.
3. Adequacy of teacher preparation.
4. Academic ability as measured by high school rank
and high school grades.
5. Long range career plans.
6. Decision to choose teaching again.
7. High school extracurricular activities.

1 0
8. Satisfaction with the teacher preparation
program.
Purpose of the Study
According to Borg and Gall (1983), the causal
comparative method seeks to discover possible causes of
a phenomenon being studied by comparing subjects in whom
a characteristic is present with similar subjects in whom
the characteristic is absent or present to a lesser
degree. The purpose of this study is to examine a causal-
comparative model of selected characteristics of students
who graduate in teacher education and enter the teaching
profession and those who do not. The extent to which
these students differ will be investigated via two student
samples: an Iowa State University data base of teacher
education graduates and "High School and Beyond," a
national longitudinal data base. The extent to which
these variables predict a student's entry into the
teaching profession will also be explored.
Importance of the Study
The enormous turnover in the teaching profession
means that decisions made in the next decade will have an
impact on the composition of our teaching force for years
to come (Carnegie Forum on Education and the Economy,
1 1
1986). Previous research examining the rate at which
teachers leave the teaching profession has shown that
about one of every four teachers eventually changes to
another career (Charters, 1970; Mark & Anderson, 1978).
Less emphasis has been placed on the differences in
characteristics (e.g., skills, abilities, and job
perceptions) between those who leave or do not enter
teaching and those who remain in the field. Little
research has been done examining the types of high school
extracurricular activities beginning teachers and their
non-education counterparts participate in during high
school. Information on such differences can be of
considerable importance in the career counseling of
prospective teachers and in the design of teacher
preparation. Additional insight into the experience of
being a teacher may also be obtained from this
investigation. This study may have implications for
school administrators, curriculum designers, and career
counselors.

1 2
Issues to Be Addressed
Studies have suggested that high ability students are
not opting to go into teaching after college (Chapman &
Hutcheson, 1982; Vance and Schlecty, 1982; Weaver, 1979).
The present investigation will explore this position.
Spady (1971) and Otto (1975) have found that
students' participation in extracurricular activities is
a positive influence on educational attainment. This
study will explore how this participation correlates with
students going into the teaching profession after college.
Independent and Dependent Variables
Dependent variable
The dependent variable to be used in this study is
teaching or non-teaching one year after graduation. The
dependent variable will be measured by the response to
item 1 from the Iowa State questionnaire which asks
respondents to check "teaching" or "non-teaching"
regarding their current employment situation. The item
used to assess the employment situation during the same
time period in the High School and Beyond sample will be
question 8 (part A) which asks students to list the first
job they held since graduating from college.

1 3
Independent variables
The independent variables for the dependent variable
in both samples are: (1) gender; (2) high school rank;
(3) high school grade point average (GPA); (4)
participation in high school extracurricular activities;
(5) job orientation, TIME1 for the Iowa State sample and
TIME3 for High School and Beyond; (6) evaluation of the
teacher preparation program; (8) adequacy of teacher
preparation program; (9) plan to teach; (10) willingness
to "do it over" again; and (11) satisfaction with the
teacher preparation program (High School and Beyond only).
Basic Assumptions
1. The survey instruments and data collection procedures
utilized by the Research Institute for Studies in
Education (RISE) were valid and reliable.
2. The survey instruments and data collection procedures
used by the Center for Education Statistics' High
School and Beyond Data Base were reliable and valid.
3. The two survey instruments are valid measures for
making generalizations about each sample of teacher
education students.
4. The data used in this study are accurate.
5. The two year difference in the ages of those students
who are on track for the Iowa State sample (college

1 4
sophomores in 1980) and High School and Beyond (high
school seniors in 1980) is inconsequential to the
results of the study.
Delimitations of the Study
1. The data analysis for this study will be limited to
cases having complete and usable responses.
2. The Iowa State sample is only representative of Iowa
State teacher education students.
3. The Iowa State sample includes only those students who
enrolled in Elementary or Secondary Education 204.
4. The High School and Beyond data sample is restricted
to only those students who were high school seniors
in 1980 and completed the third follow-up
questionnaire.
Definition of Terms
Talent loss theory - This refers to the contention
that education is losing its most academically talented
teachers to other professions.
Beginning teacher - A teacher who has been in the
work force one year or less.
Reality shock - The disillusionment experienced by
beginning teachers when they graduate from pre-service
academic training to the "real world" of the profession.

1 5
Organization of the Study
This study is divided into five chapters, an appendix
and references. Chapter 1, the introduction, includes
some background data pertaining to the teaching
profession. Also included are the statement of the
problem, purpose of the study, importance of the study,
research hypotheses, basic assumptions, delimitations of
the study, definition of terms and organization of the
study. Chapter II presents a review of the literature
summarizing pertinent research related to the teacher
shortage, teacher candidates' academic ability, job
characteristic items, gender differences in teacher
attrition and retention, adequacy of teacher preparation
programs, high school extracurricular activities, and the
decision of teachers to choose the teaching profession
again. Chapter III contains the methodology for this
study. The survey instruments and population are
described as well as data analysis procedures and
techniques. Chapter IV provides analyses and
interpretation of the data. Chapter V includes a summary
of the research and recommendations for future studies.

1 6
CHAPTER II
Review of Selected Literature
Many disciplines are ranked according to their
abilities to attract and retain qualified employees. The
commitment to these professions seem to be manifest in the
very nature of the way they replenish themselves. As
employees leave or retire, there is a ready supply of
candidates willing to take their places. This kind of
stability is not characteristic of the teaching
profession, at present. The profession is volatile at
best. Persons may leave the field temporarily to take
care of children or rear a family; others may leave
permanently for financial reasons. At any given time, the
teaching force is comprised of individuals from diverse
backgrounds and experiences who are constantly making
career decisions.that impact on the potential supply of
teachers (Hafner and Owings, 1988).
Trends in the number and type of bachelor degrees
awarded provide useful information to college
administrators for program planning. Table 2 (U.S. Dept.
of Education, 1987) shows the number of students earning
degrees in education has been steadily decreasing since
1972 while the fields of business, engineering and

Table 2. Bachelor's degrees conferred, by field: Selected years 1972-1973 to 1984-1985^
Field 1972-73 1974-75 1976-77 1978-79 1980-81 1982-83 1984-85
Total 922,362 922.933 919.549 921,390 935,140 969,510 979,477
Arts and 442,873 429,342 400,765 372,191 353,425 344,502 340,800 sciences
Sciences 289,613 276,853 254,550 234,242 219,424 211,292 208,595
Physical & 85,996 90,700 90,298 83,859 78,246 75,840 77,323 biological sciences
Social 203,617 186,153 164,252 150,383 141,178 135,452 131,272 sciences
Humanities 153,260 152,489 146,215 137,949 134,001 133,210 132,205
Technical & 479,489 493,591 518,784 549,199 581,715 625,008 638,677 professional
Business 126,263 133,010 150,964 171,764 199,338 226,893 233,351
Education 194,229 167,015 143,722 126,109 108,309 97,991 88,161
Other tech- 158,997 193,66 224,098 251,326 274,068 300,124 317,165 nical and professional
U.S. Department of Education. Center for Education Statistics. (1983, 1984, 1986, 1987). Digest of Education Statistics. Washington, D.C.: U.S. Department of Education.

Table 2. Continued
Field 1972-73 1974-75 1976-77 1978-79 1980-81 1982-83 1984-85
Computer & 4, information sciences
304 5 ,033 6,407 8,719 15, 121 24, 510 38,878
Engineering 51, & engineering technologies
265 46 ,852 49,283 62,375 75, 000 00
270 96,105
Other 103, 428 141 ,681 168,408 180,232
n
CO
947 186, 344 182,182
1 9
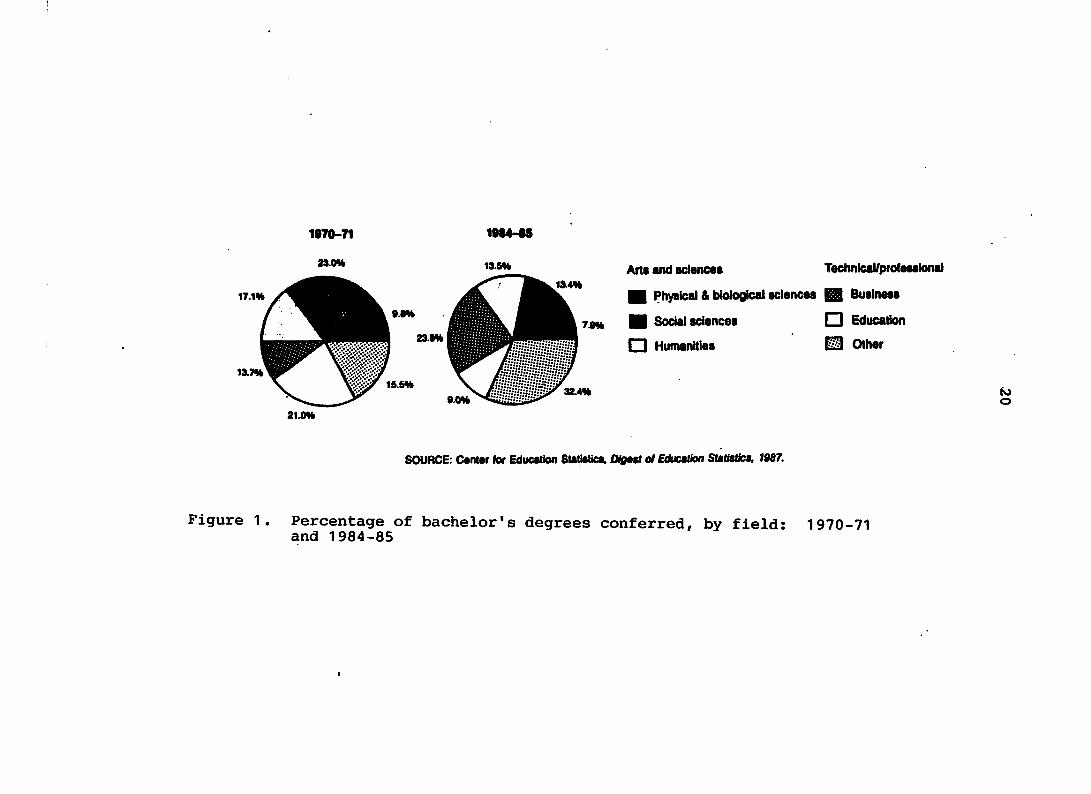
computer science have experienced increases. Degrees in
Arts and Sciences have been decreasing since 1972 while
technical and professional degrees have increased.
Proportionately, as demonstrated in Figure 1 (U.S. Dept.
of Education, 1987), the percentage of education degrees
have decreased from 21 percent in 1971 to just 9 percent
in 1985.
Teaching has always been an occupation with somewhat
high turnover and little professional status (Lortie,
1975; Heyns, 1972). Teaching has been a predominantly
female profession since the Civil War (Tyack & Strober,
1981), and women make up two-thirds of its corp (National
Education Association, 1981). For women, a teaching
career allowed for more flexibility and although vertical
mobility was limited, it did provide geographic and
lateral mobility (Heyns, 1972; Langway, 1980).
Despite the flexibility and mobility teaching
affords, the number of college graduates pursuing a degree
in education after high school graduation has steadily
declined, in spite of an overall increase in the total
number of students enrolled in higher education
institutions. Astin et al. (1987) points out that student
interest in education toppled between 1966 when 21.7% of
the freshmen were interested in majoring in education and
1970-71 1M4-M
23.0*
1T1*
ik
13.6H
13.4*
9.6*
23.#*
13.7*̂
214*
1S.S*
7.9*
32.4*
Arts and sclencas Technleal/proteMlonal
g Physical & biological sciences B Business
H Sodai sciences Q Education
O Humanities ̂Other
SOURCE: C#nlw for Education SiatlaUca. Ogut of EducêUon Statfstfca, 1987.
N) o
Figure 1. Percentage of bachelor's degrees conferred, by field: 1970-71 and 1984-85

21
1985 when only 6.2% expressed a similar interest. This
represents a 71% decrease in the proportion of freshmen
planning to launch a teaching career. Within education,
interest in a career in secondary education fell by four-
fifths from 14.1% in 1966 to 2.4% in 1985. Elementary
education fell by roughly one-half, from 7.6% in 1966 to
3.8% in 1985. The percentage of students planning to
pursue a teaching career dropped from 21.7% in 1966 to an
all time low of 4.7% in 1982. By 1986, however, that
figure had risen to 7% (Astin et al. 1987). Even with
this increase, student interest in education falls short
of previous decades and comes short of the demand
anticipated for the 1990s (Astin et al. 1987; U.S. Dept.
of Education, 1987).
Table 3 (U.S. Dept. of Education, 1987) shows the
proportion of students who were teaching one year after
graduation. The number of bachelor degree recipients
entering the teaching profession fell by 11,500,
representing a 25 percent decrease in education majors
overall (U.S. Dept. of Education, 1987). Mark and
Anderson (19-78) and Chapman and Hutcheson (1982) assert
that an estimated twenty-five percent of students who
complete a teacher preparation program never enters
teaching or leaves the profession within the first five
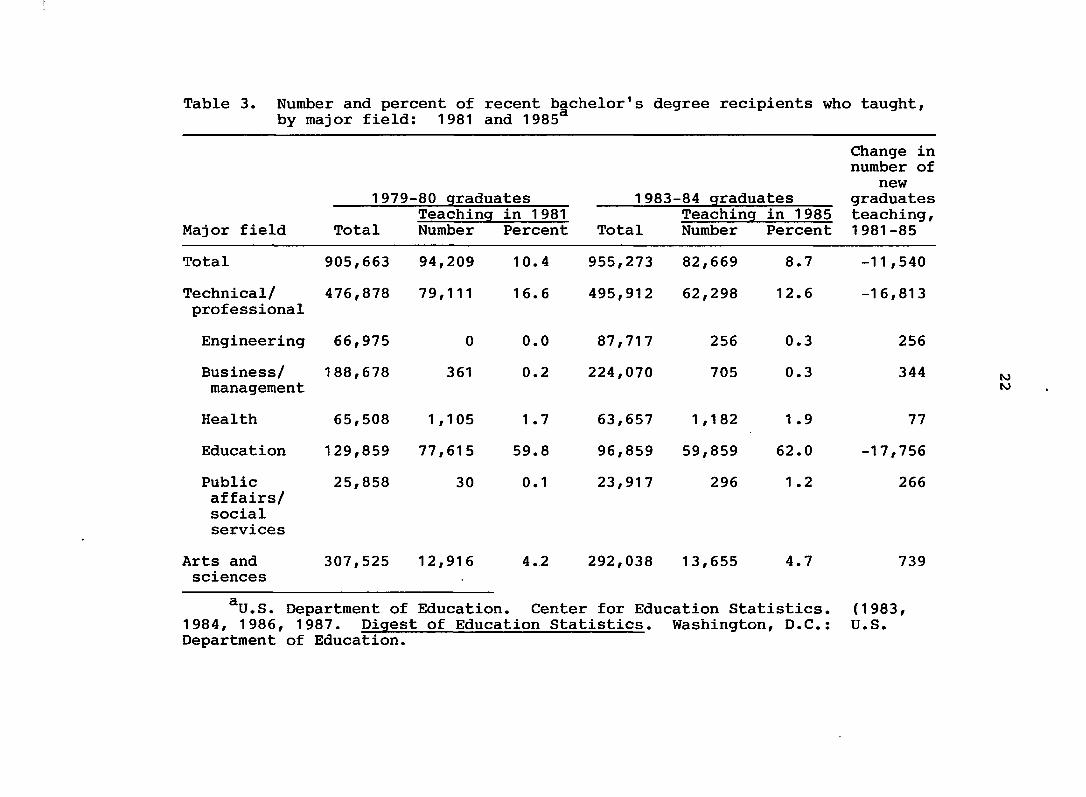
Table 3. Number and percent of recent bachelor's degree recipients who taught, by major field; 1981 and 1985
Change in number of
new graduates
Teaching in 1981 Teaching in 1985 teaching. Major field Total Number Percent Total Number Percent 1981-85
1979-80 graduates 1983-84 graduates Teaching in 1985 Number Percent
Total
Technical/ professional
Engineering
Business/ management
Health
Education
Public affairs/ social services
Arts and sciences
905,663
476,878
66,975
188,678
65,508
129,859
25,858
94,209
79,111
0
361
1 ,105
77,615
30
10.4
1 6 . 6
0 . 0
0 . 2
1 .7
59.8
0 .1
955,273
495,912
87,717
224,070
63,657
96,859
23,917
82,669
62,298
256
705
1 ,182
59,859
296
8.7
12 .6
0.3
0.3
1 .9
6 2 . 0
1 . 2
307,525 12,916 4.2 292,038 13,655 4.7
U.S. Department of Education. Center for Education Statistics. 1984, 1986, 1987. Digest of Education Statistics. Washington, D.C.: Department of Education.
-11,540
-16,813
256
344
77
-17,756
266
739
(1983, U.S.
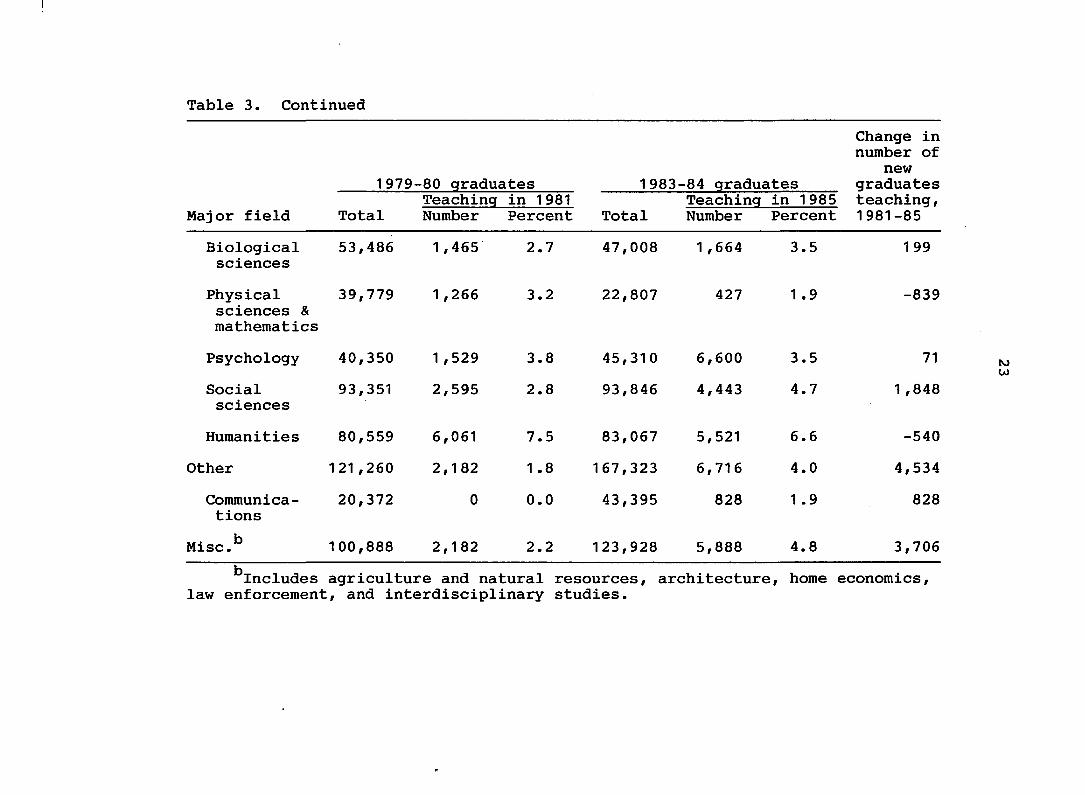
Table 3. Continued
1979 -80 graduates 1983 -84 graduates
Change in number of
new graduates
Major field Total Teaching Number
in 1981 Percent Total
Teaching Number
in 1985 Percent
teaching, 1981-85
Biological sciences
53,486 1,465 2.7 47,008 1 ,664 3.5 199
Physical sciences & mathematics
39,779 1 ,266 3.2 22,807 427 1 .9 -839
Psychology 40,350 1 ,529 3.8 45,310 6,600 3.5 71
Social sciences
93,351 2,595 2.8 93,846 4,443 4.7 1 ,848
Humanities 80,559 6,061 7.5 83,067 5,521 6.6 -540
Other 121 ,260 2,182 1 .8 167,323 6,716 4.0 4,534
Communications
20,372 0 0.0 43,395 828 1 .9 828
Misc.^ 100,888 2,182 2.2 123,928 5,888 4.8 3,706
^Includes agriculture and natural resources, architecture, home economics. law enforcement, and interdisciplinary studies.
24
years. Other research suggests that figure may be as high
as 55% (Hafner & Owings, 1988).
The United States particularly is experiencing a
severe shortage of trained secondary school mathematics
and science teachers (Guthrie & Zusman, 1982; Astin et
al., 1987). A nationwide survey by the National Education
Association found that of nearly one million college
graduates, only about 8,000 elect to prepare to be a
teacher in math or science (Graybeal, 1981). Palavin et
al. (1984) conclude that, as a result of increased state
mandated graduation requirements, the demand for science
and math teachers at the secondary level will exceed those
projected for the aggregate of education.
A survey conducted by the Association for School,
College, and University Staffing reported math and science
teacher shortages in at least 42 states (Akin, 1982). The
National Education Association reports that as a result
of these shortages, 22 percent of all secondary math
positions remain vacant or are filled by persons who are
not certified to teach the subject (Graybeal, 1981).
This situation is likely to worsen considering many
of the teachers who were hired in the 1950s and 60s to
meet the teacher demands of the "baby boomers" will be
retiring in the 1980s and 90s (Guthrie and Zusman, 1982;

25
Musemeche & Adams, 1978). If current trends continue,
only 75% of the demand for teachers will be met in 1990
(U.S. Department of Education, 1984) and this demand is
expected to increase through 1993 (Plisko and Stern,
1985) .
Some research fails to confirm that a shortage does
exist and asserts that too little data exist to make any
conclusions about teacher demand and supply (Berryman,
1985; Weaver, 1978). Hafner and Owings (1988), using
national longitudinal teacher education data, found that
61% of the individuals who were trained to teach in 1972
were still teaching in 1986. They found no evidence that
attrition among teachers was greater than in previous
years.
Although teaching as a career may have lost its
appeal during the last fifteen years, some research has
shown that a majority of teachers do plan to remain in the
classroom (Page et al., 1983; Dravland & Greene, 1980,
Keith et al., 1983). The downward trend may also be
ending as far as public school parents are concerned. In
1969, 76% of public school parents favored one of their
children becoming a public school teacher; in 1983, only
43% expressed this view. In 1984, fully 50% of those
interviewed said they would like to see a daughter become

26
a public school teacher and 46% had the same goal for one
of their sons (Gallup Poll, 1984b).
Some research does not confirm that a teacher
shortage exists, yet, the majority of the sources cited
do warn of a curtailment in the number of available
teachers, in the next decade, who are willing and
qualified to teach. The fields of mathematics and science
are expected to sustain the largest losses. Because of
the nature and importance of the shortage areas, the
gravity of a possible teacher shortage is evident.
Those Who Leave and Those Who Remain in Teaching
Research has indicated that teachers who remain in
education can be differentiated by a desire to work with
children or contribute to society (Chapman & Hutcheson,
1982; Wood, 1978), whereas those who leave the profession
or never teach assign more importance to salary, autonomy
and responsibility (Chapman & Hutcheson, 1982; Bloland and
Selby, 1980; Chapman, 1984; Roberson et al., 1983).
The profile of students who remain in education and
those who do not has been of considerable interest to
researchers. This research can give program
administrators insight into some characteristics of
students who become teachers compared to their

27
non-teaching counterparts. Factors inducing teachers to
defect from the profession could also be analyzed from
these data. This section is divided into major headings
to provide a profile of teachers who persist and those who
do not.
The beginning teacher
Previous research has shown that one of every four
teachers eventually changes to another career (Charters,
1970; Mark & Anderson, 1985). The critical decision to
remain in or leave teaching seems to be made within the
first three to five years after graduation. The beginning
teacher, then, is the most volatile in the teaching
profession.
The fact that beginning teachers do not remain in the
teaching profession is documented. Mark and Anderson
(1985) found that for the teachers in the Missouri public
school system, there were rapid dropouts in the first few
years of teaching with declining percentages in later
years. Twenty-nine percent dropped out within two years,
another 30 percent dropped out within seven years and an
additional 11 percent did not remain through the 14th
year.

28
The National Education Association (1980) studied
1,738 teachers and found that only 43 percent planned to
remain in teaching until retirement; 9 percent wanted to
leave the classroom as soon as possible. Moracco et al.
(1983) did a similar study of 691 teachers in a large
metropolitan school system and found 52 percent of those
sampled unwilling to become teachers again if given the
choice. Mason (1966) reported that 65 percent of
beginning teachers expect to leave teaching within five
years and 70 percent of new women teachers hope to be
"homemakers," although five of six of these women
eventually want to return to teaching.
Gender differences
Gender differences in teacher attrition are small,
however, males are more likely to leave teaching than
females, especially after a few years of teaching
(Charters, 1970; Mueller, 1976). These findings were
consistent with Bloland and Selby (1980) who found an
interaction between sex, age and marital status with
single males and those under thirty more likely to leave
education while older males tend to pursue administrative
positions. Single women were more likely to leave
teaching than married women and older and more experienced
29
teachers were less likely to seek another career than were
younger teachers. Chapman and Hutcheson (1982) found no
gender linked differences in their study of graduates from
three Indiana universities. When Mark and Anderson (1978)
studied successive cohorts of new teachers in St. Louis,
they also found no gender linked differences in these
groups over time.
Demographics and salary
Certain demographic data have been found to
distinguish teachers who remain in the profession from
those who do not. The following studies address some
methods that have been employed to differentiate between
students who enter the profession and those who do not.
Murnane and Olsen (1987) employed an econometric
regression method to predict duration in teaching on a
large sample of individuals who began teaching careers in
1972, 1973, 1974, or 1975 in Michigan public schools.
They found that teachers with the highest salaries were
more likely to remain in teaching longer. High school
teachers were more likely to leave teaching than
elementary teachers (Feldvebel, 1968), and the groups with
the most predicted attrition from teaching tended to be
in the areas of chemistry, physics, and foreign

30
languages. They also discovered that a teacher would be
more likely to leave teaching if he/she could command a
higher salary in another occupation. In addition, women
less than thirty years of age were less likely to remain
in teaching than women over thirty.
A study by Hafner and Owings (1988) utilizing the
National Longitudinal Data Base of 1972, with an excess
of one thousand cases, found the positive predictors of
teacher retention to be 1) number of years in teaching;
2) satisfaction with job; 3) teaching in public schools;
4) teaching full-time; 5) satisfaction with teaching; 6)
number of continuing education activities; 7) number of
education credits; and 8) low parental education. The
predictors of attrition from teaching were 1) high
parental education; 2) teaching as a first job; 3) a large
number of children; 4) high satisfaction with pay in 1986;
5) teaching in a secondary school; (Heyns, 1988; Pavalko,
1970; Feldvebal, 1968) and 6) teaching in a large urban
school system (Heyns, 1988; Pavalko, 1970; Feldvebal,
1968).
Chapman (1984) and Roberson et al. (1983) found those
teachers who left the profession assigned more importance
to salary as a criterion of success. Additional analyses
revealed those who never taught had the highest levels of

31
job and life satisfaction and enjoyed more career mobility
than those teaching. Those who left teaching reported
less career satisfaction.
Job characteristics
The degree to which an occupation provides persons
with certain intrinsic and extrinsic rewards is important
in attracting people to its ranks. Brayfield et al.
(1957) assert that workers function within and outside a
number of social systems and that differences in
orientation and motivational structure account for
variability in job performance and satisfaction
(Feldvebel, 1968). This type of job satisfaction has been
found to be a good indicator of satisfaction with
teaching.
Super and Hall (1978) have identified job autonomy,
job challenge, and financial compensation as important
considerations in career retention. Fields that inhibit
achievement of autonomy, job challenge or compensation are
more likely to experience more attrition. The teaching
profession seems to be one such field. Several aspects
of teaching seemingly contribute to this attrition:
first, teachers are bound by the demands of the curriculum
with their choice of activities constrained by the desire
32
students to perform well on standardized tests; secondly,
the daily activities of teachers may not change with
additional years of experience; and third, the teachers'
salary structure is tightly tied to seniority (Chapman &
Hutcheson, 1982).
Chapman and Hutcheson (1982) conducted a study to
investigate the differences between individuals whose
first job after graduation was teaching and remained
teaching and those whose first job was teaching but made
a subsequent career change.
Based upon Holland (1973) and Super and Hall (1978),
Chapman and Hutcheson speculated that teachers who
remained in teaching and those who left teaching could be
differentiated by their judgements pertaining to career
success. Those leaving teaching would assign more value
to autonomy than those remaining in teaching. Other
distinguishing traits of those remaining in teaching would
be the importance placed on the reactions of supervisors
and/or administrators, approval from other persons and
less emphasis on salary (Roberson et al., 1983). Six
hundred ninety students, from three public universities
in Indiana, were considered.
Results of the study showed those who remained in
teaching and those who left teaching had different
33
standards for judging career success. Those changing
careers were more positive about their abilities at
analyzing and evaluating, working on long-term projects,
and persuading others to accept their ideas. Those
remaining in teaching were more positive about their
abilities to organize time effectively, plan or organize
activities, and deal with the public (Roberson et
al., 1983). Those who left teaching were more positive
about their abilities to interpret numerical data,
cooperate with a work team, analyze and evaluate, and
write effectively. They assigned greater importance to
salary increases (Roberson et al., 1983), job
responsibility and autonomy, the opportunity to learn new
things, and the chance to contribute to important
decisions. Those who remained in teaching valued
recognition by supervisors and administrators. Those
remaining in teaching were characterized as regarding
approval from family and/or close friends and recognition
by supervisors/administrators as more important in
estimating career success.
Chapman (1984) and Roberson et al. (1983) found those
teachers who left the profession assigned more importance
to salary as a criterion of success. Those who never
taught had the highest levels of job and life satisfaction

34
and enjoyed more career mobility than those teaching.
Those who left teaching reported less career satisfaction.
Summary
Research appears to show that the decision to remain
or leave the teaching profession is made early in the
career of a beginning teacher. Although gender
differences in teaching may be decreasing, the majority
of teachers who remain in teaching tend to be female, with
those who are young and single more likely to switch to
another career. Males, as a group are more likely to
leave teaching, however, the older ones tend to vie for
administrative positions within education. Extrinsic
rewards such as autonomy and salairy seem to be
characteristic of those persons who leave the profession.
Teacher Preparation
The concern for relevancy in teacher training
programs has been voiced by teacher education students
across the country. The teacher training program is,
after all, the conduit between being a student and a
professional. For the beginning teacher, this period is
suffused with theory as well as application. The success,
then, of any teacher training program will depend upon how
appropriate the theory and application learned in teacher

35
training fit the actual job situation. The closer the
training to the realities of the job, the better the
teacher preparation program. Beginning teachers'
assessment of their training program have been sought to
provide insight into how well teacher programs are
achieving this goal.
There is little doubt that the first year of teaching
can be an ordeal for a beginning teacher. The first year
teacher must, among other things, establish a favorable
reputation among students, faculty and administrators;
organize and prepare lessons for courses never taught
before; and conform to a role of adult, professional and
teacher. Chapman (1984) found the first year teaching
experience to be more strongly related to retention in the
field than both academic performance and adequacy of
teacher training programs. According to Dewey (1904), the
task confronting a beginning teacher is enormous. Dewey
addressed the task in this way:
"The difficulties which face a beginning teacher who is set down for the first time before a class of from thirty to sixty children, in the responsibilities not only of instruction, but of maintaining the required order in the room as a whole, are most trying. It is almost impossible for an old teacher who has acquired the requisite skill of doing two or three things simultaneously—skill to see the room as a whole while hearing one individual in one class recite, or keeping the

36
program of the day and, yes, of the week and of the month in the fringe of consciousness while the work of the hour is in its center—it is almost impossible for such a teacher to realize all the difficulties that confront the average beginner."
As a result of the beginning teacher's plight, a kind
of "culture shock" takes place produced by the inability
to cope with the situation at hand. The teacher becomes
insecure at this point because his notions about how to
behave are not appropriate. This kind of "culture shock"
is intensifying in public schools (Salzillo & Van Fleet,
1977).
Page et al. (1983) investigated a random sample of
300 Georgia first year teachers to ascertain their
perception of their teacher education training. They
found a majority (80%) of the teachers rated their
preparation as good or excellent in the following areas:
a) identifying and composing instructional objectives; b)
planning instruction according to objectives to be
achieved; c) using oral reinforcement techniques with
students; d) using diverse teaching methods; e) working
with individuals, small groups and large groups; f)
understanding and using subject matter; g) maintaining an
attractive and orderly environment; h) communicating

37
enthusiasm for learning and i) assisting students in
developing a positive self-image.
Forty percent of the respondents rated their
preparation fair or poor in the following areas: a)
maintaining class discipline (Elliot & Steinkellner, 1979,
Warren et al., 1982; Veenman, 1984); b) understanding the
role of other school personnel; c) working with parents
(Warren et al., 1982); d) understanding legal issues in
education (Elliot & Steinkellner, 1979); and e)
understanding public school organization. Motivation of
students (Veenman, 1984) and dealing with individual
differences among students (Veenman, 1984; Warren et al.,
1982) were also cited by beginning teachers as inadequate.
In addition to the weaknesses cited above, Elliot and
Steinkellner (1979) found the inability to manage large
blocks of time with a large quantity of materials a
problem for the forty teachers in their sample.
Ryan et al. (1979) conducted a field study in which
seven researchers observed eighteen teachers, in various
geographical locations, throughout their first year, to
determine how beneficial their training had been. The two
salient themes emerging from the study were the usefulness
of first-hand experience and the need for longer student
teaching (Warren et al., 1982; Page et al., 1983).
38
According to the Gallup Poll of Teachers' Attitudes
Toward the Public School (1984a), 51 percent of the
elementary school teachers and 48 percent of the high
school teachers gave their teacher training programs a
grade of B or better. A survey by the National Science
Teachers Association (Testimony to subcommittee on HUD,
1982), however, found that more than half of the
elementary school teachers felt their college training did
not prepare them to teach.
In the aggregate, teachers appear to be giving
positive ratings to most aspects of their teacher
preparation programs. The two areas that consistently
seem to be inadequate are length of student teaching
experience and effective classroom management.
Do Higher Ability Students Enter Education?
Some research has confirmed that schools are unable
to attract high ability students and, once hired, these
students are not likely to remain in teaching. Moreover,
the more academically talented students tend not to opt
for a teaching position after graduating from college
(Chapman, 1984; Vance & Schlecty, 1982; Weaver, 1979).
A discriminant analysis by Hafner and Owings (1988) found
that teachers who left the field had higher aptitude
scores than those who remained (Pavalko, 1970) and

.39
individuals who never taught had the highest aptitude
scores of the group.
Chapman and Hutcheson (1982) did a discriminant
analysis with a sample of 892 teachers with teaching
certificates who graduated from the University of Michigan
in 1963, 1967, and 1971. They found no achievement
related pattern to a teaching career choice (Warren et
al., 1982). This finding was consistent with Chapman
(1984) who found no differences in grade point averages
of those students who entered teaching and those leaving
the profession (n = 2,933). Research done by Hafner and
Owings (1988), using national longitudinal data, found
that grades were not strong predictors of attrition,
although those with high academic aptitude were more
likely to leave teaching (r = .11, p. < .05).
Some research suggests that students who aspire to
teaching careers tend to be of lower ability as measured
by grades when compared to the average high school senior
planning to complete college (Roberson et al., 1983; Vance
& Schlechty, 1982; U.S. Dept. of Education, 1986).
According to Peng (1982), this gap between students
planning to major in education and those in other fields
widened between 1972 and 1980. Even though there was a
concomitant drop in achievement scores overall during this

40
period, there was a precipitous decline among the teaching
group. Astin et al. (1987) found that today's aspiring
teachers were the least prepared of all career groups.
The same pattern seems to be manifested in the
National Teacher Examination (NTE) scores. In North
Carolina, teachers who scored above average on the NTE
were more likely to leave teaching; two-thirds of the
teachers who scored in the top decile in 1973 left
teaching by 1980, whereas only one-third of the bottom
decile had done so (Schlechty and Vance, 1982).
The talent loss theory was partially supported by
Heyns (1988), examining a national longitudinal data base
of teachers, who found that former teachers tended to
score better than current teachers on the SAT and high
school achievement tests in Math. They tended to score
lower on tests of verbal skills, however. Overall,
teachers who took a break from teaching and those who
entered the profession late tended to be more talented.
The talent loss to other professions was thought to
eventually be restored to the teaching profession at some
future time since the majority of the sample either
entered or re-entered teaching after 1980. Also, nearly
half of the former teachers indicated a desire to return
to teaching at some point.
41
Stein and Williams (1986) contrasted the Scholastic
Aptitude Test (SAT) scores and cognitive test scores of
the National Longitudinal Study of the High School Class
of 1972 (NLS-72) with three groups of 1972 high school
seniors: (1) teachers who taught from the fall of 1976
through the fall of 1979; (2) teachers who taught in the
fall of 1976 but changed careers by the fall of 1979; and
(3) all bachelor degree recipients from the high school
class of 1972. The data suggested that both teachers who
left teaching and those teachers who stayed scored lower
on standardized tests than the average college graduate;
additionally, the teachers who left teaching were more
academically skilled than those who remained in teaching
(see Table 4).
Dravland and Greene (1980) compared a group of
students who entered the teacher education program at the
University of Lethbridge with those students who did not
based upon certain biographical and academic
characteristics. Grade point averages at admission to the
teacher education program did not reveal any significant
differences for the two groups, however, the mean entering
and termination grade point averages for females who
entered teacher education was higher than those who did
not. Male grade point averages revealed no differences.

Table 4. Test scores of teachers and all college graduates^
Performance measure Teachers, who stayed
Teachers, who leftb
All college graduates
Mean level of performance
SAT (Total) 921.57 935.32 1011 .80
NLS (Total test) 1.39 1 .45 2.25
^U.S. Department of Education (1987).
'^Differences between teachers who stayed and teachers who left are not statistically significant.

43
This finding is inconsistent with other research showing
the academic ability of aspiring teachers is diminishing
(Schalock, 1979; Schlechty & Vance, 1981).
A study by Roberson et al., utilizing subjects from
High School and Beyond, a national longitudinal data base
of 1980 high school seniors, representing approximately
1,015 schools across the country, revealed that females
who aspired to teach were less capable academically. This
finding contrasts that of Dravland and Greene (1980).
Ability for males was found to have no direct effect on
becoming a teacher.
Villeme and Hall (1983-84, Winter) found no
significant differences in the grade point averages of 458
University of Florida students who were employed in
teaching and those who were not. This relationship also
held true for ACT scores. The graduates who demonstrated
high intellectual capacity were as likely as those of low
intellectual capacity to express satisfaction with
teaching, indicate plans to stay in teaching and express
a positive attitude toward pursuing a teaching career.
A post hoc comparison, however, revealed the students with
the highest grade point average tended to be in teaching.
The talent loss theory in teacher education still
appears to be far from resolved. Although some research

44
found no differences in the academic ability of those
students entering and remaining in teaching and those
leaving or never entering the profession, several studies
do support the idea that the academically talented
students are not opting for teaching careers.
Job Characteristics
Research on sex differences in job factor preferences
have traditionally categorized job factors into intrinsic
and extrinsic job dimensions (Herzberg et al., 1957).
Herzberg found that intrinsic factors such as achievement,
recognition, and advancement were more important to men
while extrinsic factors such as working conditions and
interpersonal relationships were more salient for women.
It is hypothesized that boys, as a result of identifying
with their fathers, learn the importance of being good
providers while girls acquire the socio-emotional concerns
of their mothers. These roles are said to persist into
adulthood with women emphasizing affiliation and an
orientation toward persons rather than objects, whereas
men's roles tend to be instrumental and reward
independence, aggressiveness and competitiveness (Pleck
& Sawyer, 1974; Feldvebel; 1968). These roles are
theorized to be reflected in sex-linked preferences for
job outcomes (Keith, 1980).

45
Several studies have addressed gender preferences as
they relate to occupational attributes. Keith (1980),
using an adaptation of Rosenberg's (1957) study, surveyed
207 men and 281 women education graduates from three
public universities in the Midwest to determine the
importance of 11 job characteristics in selecting their
present employment. Factor analysis using the Varimax
rotation yielded the following factors: (a) opportunity
for advancement, (b) opportunity to use special abilities
and aptitudes, (c) opportunity to be creative and
original, (d) help and serve others. She found that women
did not emphasize extrinsic rewards and potential to
exercise leadership. The men were more likely to value
the opportunity to use special abilities, to engage in
self-expression in their work, salary, status,
opportunities for advancement, and benefits as overriding
factors in their present occupation. Service to others
was found to be equally important to both groups. Younger
graduates, irrespective of sex, were found to be less
concerned with personal development and long range career
plans.
Keith et al. (1983) conducted an investigation to
determine the effect of career plans and teaching level
on job preference factors of 486 teacher education

46
graduates. The respondents rated the importance of
eighteen job characteristics on a scale of 5 (very
important) to 1 (very unimportant). Results showed a
comparable tendency on the part of men and women to seek
extrinsic rewards from work. Career plans were, however,
sex-linked with more men desiring non-academic employment.
Teaching level was found to be more closely linked to job
preferences than to gender.
Manhardt (1972) queried 365 male and 301 female
employees at a large eastern insurance company over a
four-year period to assess gender differences related to
25 job characteristics. Significant sex differences were
found on 11 of the 25 items. He found that men emphasized
long-term career outcomes (Bartol, 1974) and women valued
a comfortable work environment and pleasant interpersonal
relationships (Lortie, 1975; Wangberg et al., 1982).
Brenner and Tomkiewicz (1979) replicated the Manhardt
study to ascertain whether gender differences in job
orientation decreased. The sample consisted of 127 male
and 122 female graduating seniors from the School of
Business at an eastern state university. Gender
differences were found to be present but to a lesser
degree than in the previous study. A noteworthy trend
found in the second study was that women were more

47
concerned with self-development as shown in their
preference for positions which develop skills, knowledge
and intelligence.
Centers and Bugental (1966) studied 692 employed
adults and found few overall sex differences, however,
women did assign more importance to co-workers and men
placed higher value on self-expression. Still other
research has shown that women have a stronger preference
for jobs that offer the opportunity to help and serve
others than do men (Rosenberg, 1957; Singer & Stefflre,
1954).
Research has shown that although gender differences
in job orientations may be diminishing, they have not
disappeared completely. Males and females still differ
in job orientation but the research seems to indicate the
gender gap may be narrowing (Brenner & Tomkiewicz, 1979).
Would You Choose Teaching Again?
Many researchers feel a good indicator of job
satisfaction can be derived by asking persons in their
chosen profession if they would choose the same occupation
if they were allowed to make the choice again (Heyns,
1988; the National Education Association, 1980; Wangberg
et al., 1982). Several studies have asked this question

48
of teachers at varying points in their careers as a gauge
of teachers' satisfaction with teaching.
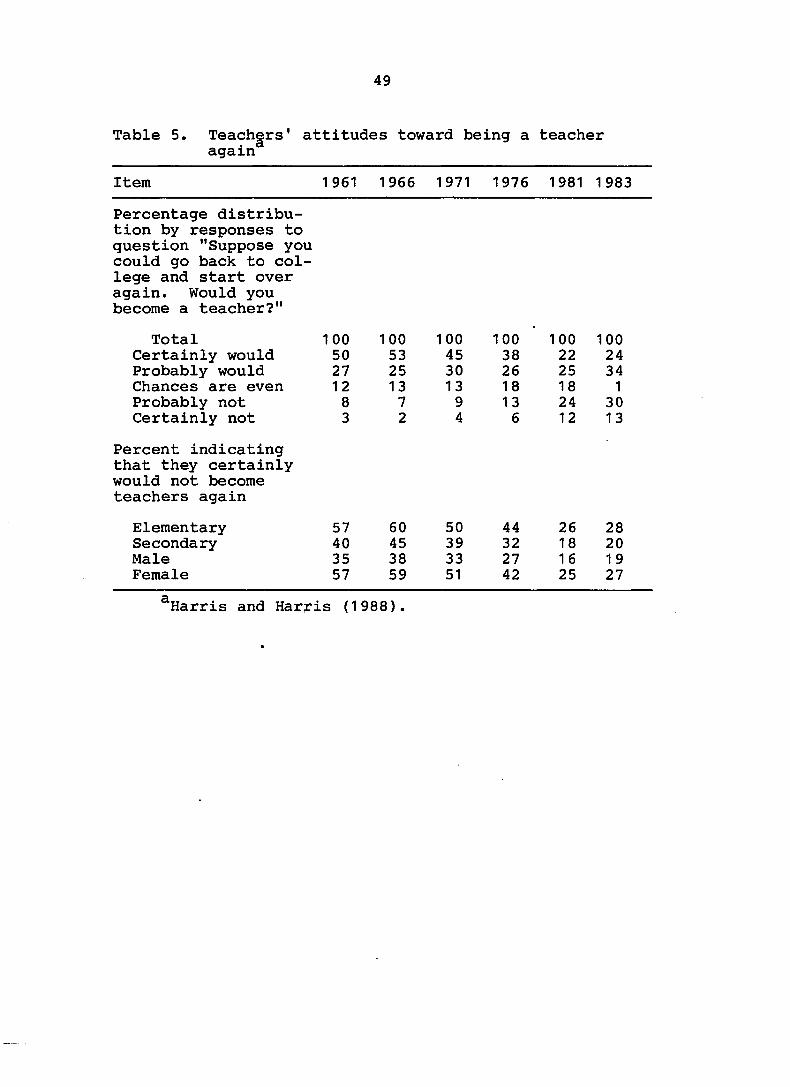
As shown in Table 5, a majority of beginning teachers
in the 1960s indicated the desire to become teachers again
if they had to "do it over"; by the 1980s, less than one
quarter shared that view. Those more likely to choose the
teaching profession again are female and elementary
teachers (Harris and Harris, 1988).
Teaching dissatisfaction is not limited to beginning
teachers but also to teachers who remain in education
(Wangberg et al., 1982). The National Education
Association (1981) conducted a survey to assess teaching
satisfaction and found that less than one-fourth of the
teachers interviewed would "certainly" become a teacher
again if they could start over. Over half (53.6%) thought
the chances to be about even that they would choose
teaching again and only 22% indicated they "certainly"
would not or that they were unsure. When the sample was
asked this question in 1966, over half (52.6%) said they
would "certainly" choose teaching again.
Wangberg et al. (1982) surveyed a cross-sectional 20
percent of the female elementary classroom teachers (n =
255) of four school districts and found that 40 percent
of the women said if they had to do it over, they would
49
Table 5. Teach|rs' attitudes toward being a teacher again
Item 1961 1966 1971 1976 1981 1983
Percentage distribution by responses to question "Suppose you could go back to college and start over again. Would you become a teacher?"
Total 100 100 100 100 100 100 Certainly would 50 53 45 38 22 24 Probably would 27 25 30 26 25 34 Chances are even 12 13 13 18 18 1 Probably not 8 7 9 1 3 24 30 Certainly not 3 2 4 6 12 13
Percent indicating that they certainly would not become teachers again
Elementary 57 60 50 44 26 28 Secondary 40 45 39 32 18 20 Male 35 38 33 27 16 1 9 Female 57 59 51 42 25 27
^Harris and Harris (1988).
50
not choose a teaching career. The National Education
Association (1980) studied 1,738 teachers and found that
only 41 percent would choose a teaching career if they had
to do it over.
Heyns (1988) studied a national sample of teachers
who were seniors in high school in 1971 and found 29
percent of those students who were teaching in 1986
willing to enter the teaching profession if they could "do
it over"; 18 percent of former teachers felt this way.
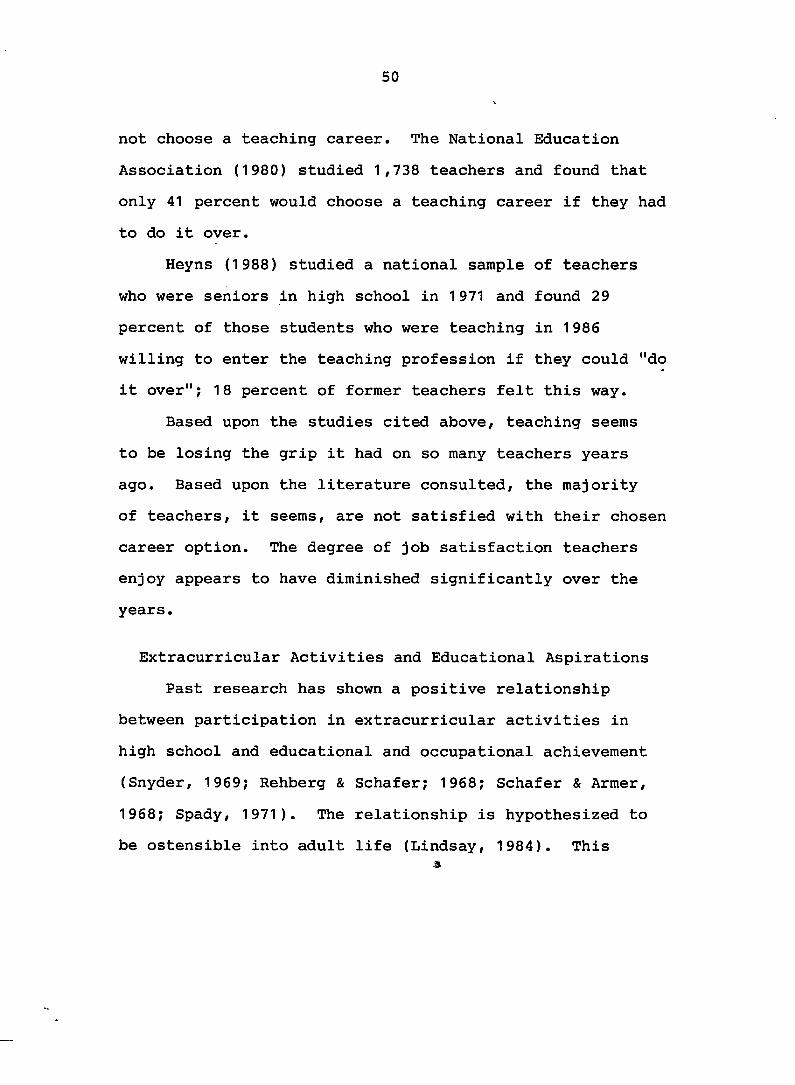
Based upon the studies cited above, teaching seems
to be losing the grip it had on so many teachers years
ago. Based upon the literature consulted, the majority
of teachers, it seems, are not satisfied with their chosen
career option. The degree of job satisfaction teachers
enjoy appears to have diminished significantly over the
years.
Extracurricular Activities and Educational Aspirations
Past research has shown a positive relationship
between participation in extracurricular activities in
high school and educational and occupational achievement
(Snyder, 1969; Rehberg & Schafer; 1968; Schafer & Armer,
1968; Spady, 1971). The relationship is hypothesized to
be ostensible into adult life (Lindsay, 1984). This

51
participation is based in part on theory that posits a
process of selection whereby students with particular
attitudes and dispositions select or compete for extra
curricular roles which they feel will enhance their status
and success orientations.
These auxiliary activities tend to attract certain
kinds of students to its ranks and influences members'
college aspirations above and beyond their high school
academic performance. The precursors to high school
social participation is believed to be curriculum track
placement and academic performance, which, in turn, are
affected by individual student background characteristics
such as academic ability, socioeconomic status, gender and
sociability. Research has suggested that students of high
socioeconomic status are more likely to participate in
most activities except athletics and hobby clubs (Lindsay,
1984). Extracurricular activities tends to enhance a
student's popularity and visibility, thereby increasing
the likelihood of contact with college-bound peers and
school personnel (Coleman, 1961; Rehberg, 1969).
Hanks and Eckland (1976) assert that extracurricular
participation consolidates school and college by promoting
the transference of status across adolescent and adult
social systems. This participation serves as a conduit
52
between parents and their children where socioeconomic
advantages are transmitted and mechanisms are set in place
for student compliance (Spady, 1970; Otto, 1976; Hyman and
Wright, 1971).
Hanks and Eckland (1976) developed a path model to
determine what role the extracurricular program plays in
the educational attainment process. Students who were
high school sophomores in 1955 were sampled, using
national longitudinal data. They found that athletics did
not have a strong effect on educational attainment (Spady,
1971) whereas social participation had a direct effect on
academic performance and achievement in both school and
college for males and females (Spady, 1971; Kerckhoff,
1974). Middle class and lower class males were found to
be equally as likely to participate in high school sports,
however, low ability students were more likely to
participate than high ability students.
Spady (1971), in a study controlling on background
socioeconomic status, mental ability, and academic
performance, found that extracurricular participation does
affect levels of educational attainment (Snyder, 1969).
According to Spady (1970) and Otto (1976), extracurricular
53
activities provide important socialization experiences for
students with mobility aspirations and participation
facilitates development and use of these organizational
and leadership skills.
Snyder (1969) used longitudinal data on a 1962 high
school graduating class (n = 186) in a small Midwestern
community to assess relationships among students' high
school values, social participation and educational and
occupational achievement. Parental socioeconomic status
and intelligence were control variables. Weighted scores
were assigned to each activity to indicate its importance
in the school social structure (i.e., class officer given
more weight than pep clubs). The results of the study
showed that students who were athlètes or leaders in
social activities in high school were more likely to
complete college than students who were not. A positive
correlation betwen high school social participation and
occupational status five years after graduation was
established.
Spady (1971) gathered information on 297 male seniors
who graduated from two West Coast high schools in 1963;
they were sampled again in 1967. The purpose of the study
was to clarify the influences of athletics and
service-leadership roles as catalysts for success goals.

54
controlling for peer status, formal academic achievement
capacity, and intrinsic motivation of the student.
Patterns of involvement seemed to differentiate between
the college and non-college aspirant. He found that
service-oriented students were about 15% more likely to
have college goals and to be successful in college.
Athletes were no different than average students. Results
also indicated that students who did not participate in
a major extracurricular activity, regardless of grades or
performance, were 30% less likely to have college
aspirations. Additionally, those who were unsuccessful
in academic and extracurricular endeavors were nearly 60%
less likely, than those who were successful, to have
college aspirations as a future goal.
Research has also shown a positive relationship
between athletic involvement and educational attainments.
Rehberg and Schafer (1968) found, in their study of 785
males, that 62% of the athletes expected to go to college
compared to 45% of the non-athletes. This finding was
strongest among those athletes less disposed to college.
Edismore (1963) studied participants and non-participants
in varsity football teams from twenty-four of the top
thirty Iowa high school teams. The grade point average
(on a scale of 4.0) of the athletes across all subjects
55
was 2.523 whereas the non-athletes grade point average was.
2.085. Spreitzer and Pugh (1973) found that of the 1,638
male and female students they sampled in five Connecticut
school districts, 71% were in a college preparatory
curriculum compared to 58% of the non-athletes.
Otto and Alwin (1977) gathered follow-up data from
males who were seventeen years old and enrolled in certain
Michigan high schools in 1957. Data gathered from the 340
respondents to the 1972 survey confirmed that
participation in athletics has a positive effect on both
educational aspirations and educational attainment. This
effect was observable even after controlling on variables
usually-associated with the status attainment process such
as socioeconomic origins, mental ability, academic
performance, significant others influence, aspirations,
and attainments.
By far, the greatest facilitator of college success
seems to be extracurricular involvement of students during
high school. Participants in these activities have a 37%
greater chance of realizing their college goals than do
non-participants, net of their academic performance and
intrinsic motivation. The majority of the research
studies consulted confirms that the formal and informal
achievement systems of high school have considerable

56
influence on students' desires for further education which
cannot be traced to achievement alone. Furthermore, the
type of participation also appears to affect the chances
of students' consummating their goals. The role athletics
plays in educational and occupational attainment is less
clear (Spady, 1971).

57
CHAPTER III
Methodology
Two data sets will be examined for the purposes of
this study. The first data set includes teacher education
students at Iowa State University. The second data set
entitled, "High School and Beyond," was derived from a
national sample of students who were high school seniors
in 1980. Only those students who majored in teacher
education in college will be examined in this study.
The Iowa State University Sample
The Research Institute for Studies in Education
(RISE) implemented a comprehensive model to assess and
improve the teacher preparation program at Iowa State
University (ISU). This model incorporates longitudinal
data from students at various stages in their career
development. With its inception in 1974, RISE began
compiling profile data on students who entered the teacher
preparation program in the College of Education at ISU.
These profile reports are generated annually and are
available for public review.
58
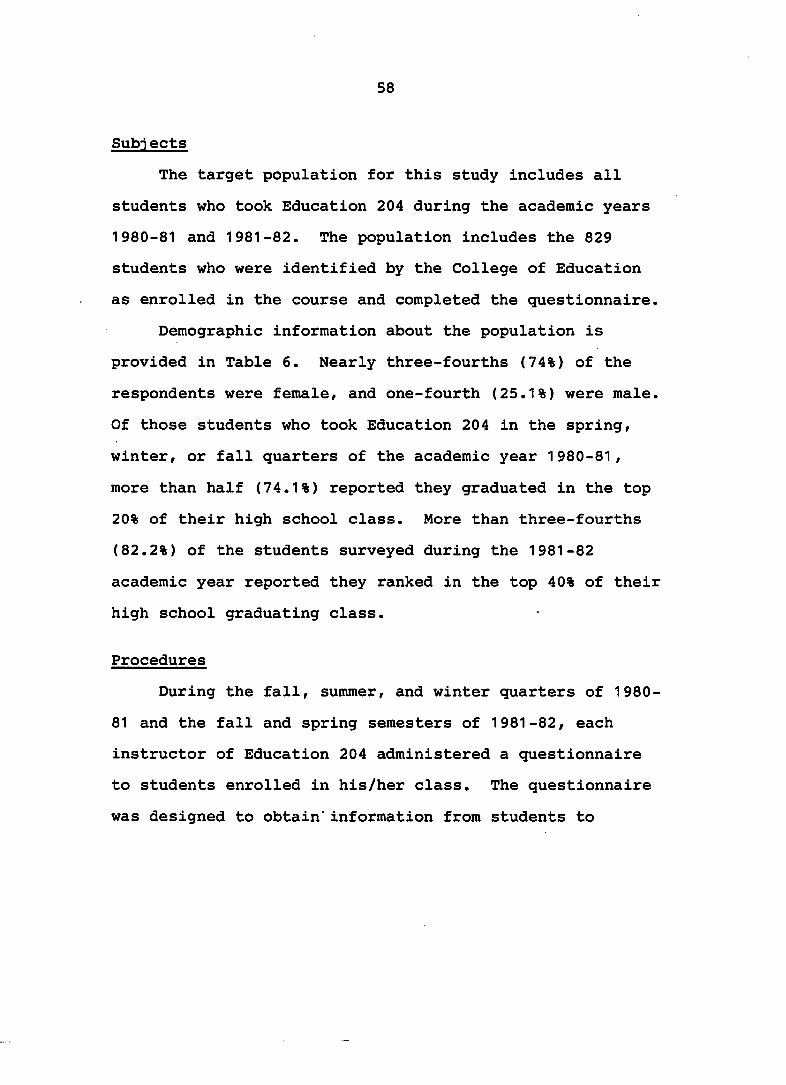
Subjects
The target population for this study includes all
students who took Education 204 during the academic years
1980-81 and 1981-82. The population includes the 829
students who were identified by the College of Education
as enrolled in the course and completed the questionnaire.
Demographic information about the population is
provided in Table 6. Nearly three-fourths (74%) of the
respondents were female, and one-fourth (25.1%) were male.
Of those students who took Education 204 in the spring,
winter, or fall quarters of the academic year 1980-81,
more than half (74.1%) reported they graduated in the top
20% of their high school class. More than three-fourths
(82.2%) of the students surveyed during the 1981-82
academic year reported they ranked in the top 40% of their
high school graduating class.
Procedures
During the fall, summer, and winter quarters of 1980-
81 and the fall and spring semesters of 1981-82, each
instructor of Education 204 administered a questionnaire
to students enrolled in his/her class. The questionnaire
was designed to obtain information from students to

59
Table 6. Demographic characteristics of Teacher Education 204 students (Iowa State Sample)
Relative Adjusted Characteristic Number Percent Percent
Time of survey 1980-81 (quarter)
Fall 80 183 35.5 35.5 Winter 81 187 36.2 36.2 Spring 81 146 28.3 28.3 Total 516 100.0 100.0
Time of survey 1981-82 (semester)
Fall 81 134 42.8 42.8 Spring 82 179 57.2 57.2 Total 313 100.0 100.0
Gender
Female 620 74.8 74.8 Male 208 25.1 25.1 Not specified 1_ 0.1 0.1 Total 829 100.0 100.0
High school rank (summer, spring and winter quarters 1981-1982)
Upper 10% 98 31 .3 31 .7 Upper 11-25% 134 42.8 43.4 Upper 26-50% 55 17.6 17.8 Upper 51-75% 20 6.4 6.5 Lower 25% 2 .6 .6 Not specified 4 1 .3 Total 313 1 00.0 100.0
High school rank (fall and spring semesters 1980-1981)
Top 20% 307 59.5 59.8 Second 20% 115 22.3 22.4 Middle 20% 82 15.9 16.0 Fourth 20% 8 1.6 1.6 Lowest 20% 1 .2 .2 Not specified 3 .6
516 100.0 100.0

60
evaluate and Improve the teacher education program at Iowa
State University. Each questionnaire contained a cover
sheet explaining the nature of the questionnaire and an
assurance of confidentiality of responses. Social
security numbers were requested of students for purposes
of tracking students through their program. Participation
in the survey was voluntary.
Data pertaining to students' academic ability were
obtained from their permanent record cards. The following
information pertaining to academic ability will be used
in this study: (1) gender; (2) GPA at the time of
graduation; and (3) high school rank.
Instrumentation
This study will utilize data obtained from three
survey instruments developed by RISE personnel. Each of
the survey instruments is designed to obtain data
regarding the attitudes and perceptions of students
enrolled in the Teacher Education Program at Iowa State
University. The questions from each survey instrument
that are of significance to this study will be described.
The Education 204 questionnaire contains 25 items. Seven
questions are relevant to this study. They include: (1)
long-range career plans (item 4); (2) importance of job
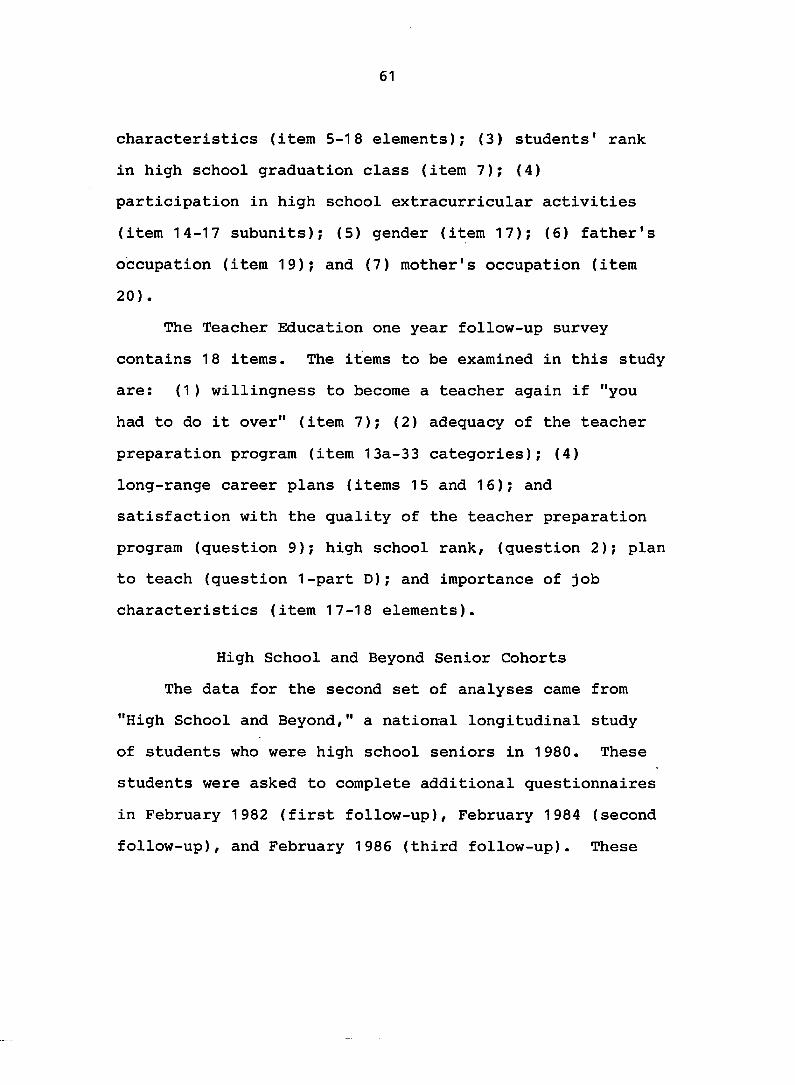
61
characteristics (item 5-18 elements); (3) students' rank
in high school graduation class (item 7); (4)
participation in high school extracurricular activities
(item 14-17 subunits); (5) gender (item 17); (6) father's
occupation (item 19); and (7) mother's occupation (item
20).
The Teacher Education one year follow-up survey
contains 18 items. The items to be examined in this study
are: (1) willingness to become a teacher again if "you
had to do it over" (item 7); (2) adequacy of the teacher
preparation program (item 13a-33 categories); (4)
long-range career plans (items 15 and 16); and
satisfaction with the quality of the teacher preparation
program (question 9); high school rank, (question 2); plan
to teach (question 1-part D); and importance of job
characteristics (item 17-18 elements).
High School and Beyond Senior Cohorts
The data for the second set of analyses came from
"High School and Beyond," a national longitudinal study
of students who were high school seniors in 1980. These
students were asked to complete additional questionnaires
in February 1982 (first follow-up), February 1984 (second
follow-up), and February 1986 (third follow-up). These

62
surveys included questions about employment, postsecondary
educational and occupational aspirations, marital status,
demographics (race, ethnicity), and family background.
Questions inquiring about students' beliefs were also
included (NCES, 1983).
A data file containing the merged base year and
follow-up files were used to obtain data for this study.
The merged file included base year and follow-up data
information on school, family, work experience,
educational and occupational aspirations, values, and test
scores for sample participants.
Subjects
The population for the High School and Beyond survey
represented the total number of high schools in the United
States. Schools were selected with probabilities
proportional to their 12th grade enrollments. The Base
Year survey, conducted in 1980, was a highly stratified
national probability sample of 1,100 secondary schools in
the first stage of selection. Thirty-six seniors were
randomly selected from each school. All seniors in a
particular school were selected if fewer than 36 seniors
were enrolled. More than 28,000 seniors participated in
the base year survey. Each student was assigned a weight

63
equal to the number of students in the universe they
represented. Only the students who declared themselves
to be teacher education majors in college and have
completed base year and all follow-up information will be
included in this study. The sample for this study totals
76,097 weighted cases (NCES, 1983). Demographic
information about this sample is presented in Table 7.
The majority of the respondents were female (87%) while
13% were male. More than three-fourths (78%) of the
participants reported having a "B" average or above.
Nearly two-thirds (63%) of the students reported they were
enrolled in a college preparatory program in high school.
Data collection techniques
Base year data were collected from students in 1,015
high schools between February 1 and May 15, 1980.
Personnel from the National Opinion Research Center and/or
School Coordinators explained the survey procedures and
answered questions. An orientation day was held prior to
administering the questionnaire explainingthe purpose of
the study, tasks to be undertaken, and assurances of
confidentiality. Parental permission was secured, where
required. Each student was provided with a Student
Identification Pages (SIP) booklet, which requested

64
Table 7. Demographic characteristics of teacher education students (High School and Beyond sample)
Characteristic (Weighted cases) Number
Valid Percent
1982 first follow-up 1984 second follow-up 1986 third follow-up 76,097 100
Gender
Male Female
9,910 66,187
13 87
High school grades (1980 base year)
Mostly A Half A/Half B Mostly B Half B/Half C Mostly C Half C/Half D Below D Not specified Total
720 818
...615 19,852
15, 18 ,
1 4 1 ,877 ,659 1 00 98
76,097
6 . 2 20.9 24.7 26.2 19.6
2 . 2 . 1
100.0
High school program type
General College prep Agricultural Business Distributive education Health Home economic education Not specified Total
25,469 47,728
341 • 689 289 59 322
1 ,199 76,097
34.0 63.7 .5 .9 .4 . 1 .4
100.0

65
information about how students may be contacted in the
future. Students were allowed an hour to complete the
survey instrument.
All subsequent data were collected from seniors via
mail-back questionnaires. The first, second and third
follow-up surveys were mailed to all members of the senior
cohort for whom current addresses had been obtained. Non-
respondents were mailed reminder postcards and were later
contacted by telephone or personal interview. The
respondents who completed the questionnaire by telephone
were required to have a copy of the instrument in front
of them. The responses of those persons interviewed were
validated via re-collection of specific data and comparing
these data with the original information (NCES, 1983).
Instrumentation
This study will utilize specific questions from each
of the four questionnaire administrations. The questions
to be examined from the base year data include: (1) sex
(question FLAG14); (2) high school extracurricular
activities (questions 32-15 subunits); (3) high school
grades (question 7); and (4) occupational aspirations—age
30 (question (62).

66
The question to be investigated from the first
follow-up survey is college major (question 34-part B).
The questions to be used from the second follow-up
questionnaire are occupational aspirations—age 30
(question 55—part A) and probability of teaching in the
public schools (question 54). High school grades is the
only question used from the second follow-up.
The third follow-up questionnaire items include; (1)
first job held since 3/83 (question 8—part A); (2) second
job held since 3/83 (question 9—part A); (3) satisfaction
with teacher preparation (question 12—parts BA through
BG, BI; (4) importance of job characteristics (question
16—sections A through J); and (5) occupational
aspirations (question 15—part A). A copy of the
instruments used in this study is included in the
Appendix.
Treatment of the Data
The data for this study will be analyzed using the
Statistical Package for the Social Sciences (SPSS)
(Norusis, 1987). The preliminary analyses of the data
will include frequency counts.
Factor analyses have been computed, in other research
studies, for questionnaire items from the Iowa State
sample pertaining to the adequacy of teacher preparation

67
program and the importance of job characteristics (TIME1
and TIME2, respectively). Sweeney (1987) factor analyzed
the thirty-three teacher preparation content areas. The
factors that will be used in this study are presented in
Table 8. Boatwright (1988) computed composite factors for
the eighteen job characteristics used in this study and
found five independent factors. Table 9 summarizes these
factors. Factor analyses will also be calculated for the
seventeen extracurricular activities in both the Iowa
State and High School and Beyond samples.
The six criteria established by Sweeney (1987) to
guide the development of the composite measures will be
adopted for use in this study. They were;
1. Eigenvalues for each factor should be one or greater;
2. Each factor should explain at least 4% of the variance
for initial statistics.,
3. Cronbach's alpha reliability estimates should be at
least .60.
4. Independent items and those with low correlation
coefficients should be extracted.
5. Items selected as factors should have factor loadings
of .40 or greater. Items with factor loadings of .38
to .40 may be included if they are similar in content
to other qualified factors.

68
Table 8. Adequacy of preparation content areas—results of factor analysis
Item No. Content area
Factor one: Planning and delivering instruction
1 Planning units of instruction and individual lessons
19 Locating, and using materials and resources in specialty area
20 Evaluating your own instruction
21 Individualizing instruction
22 Selecting and organizing materials
23 Using a variety of instructional techniques
Factor two: Interpersonal relationships
24 Understanding teachers' roles in relation to administrators, supervisors and counselors
25 Ability to work with parents
26 Ability to work with other teachers
Factor three: Student motivation and discipline
3 Maintaining student interest in the classroom
4 Understanding and managing behavior problems in the classroom
18 Relating activities to interests and abilities of students
^Sweeney, J. C. (1987) Unpublished dissertation.

69
Table 8. Continued
Item No. Content area
Factor four: Assessing and dealing with learning problems
1 0 Methods of working with children with learning problems
11 Assessing learning problems
Factor five: Monitoring student achievement
12 Ability to develop tests
1 3 Interpreting and using standardized tests
17 Evaluating and reporting student work and achievement
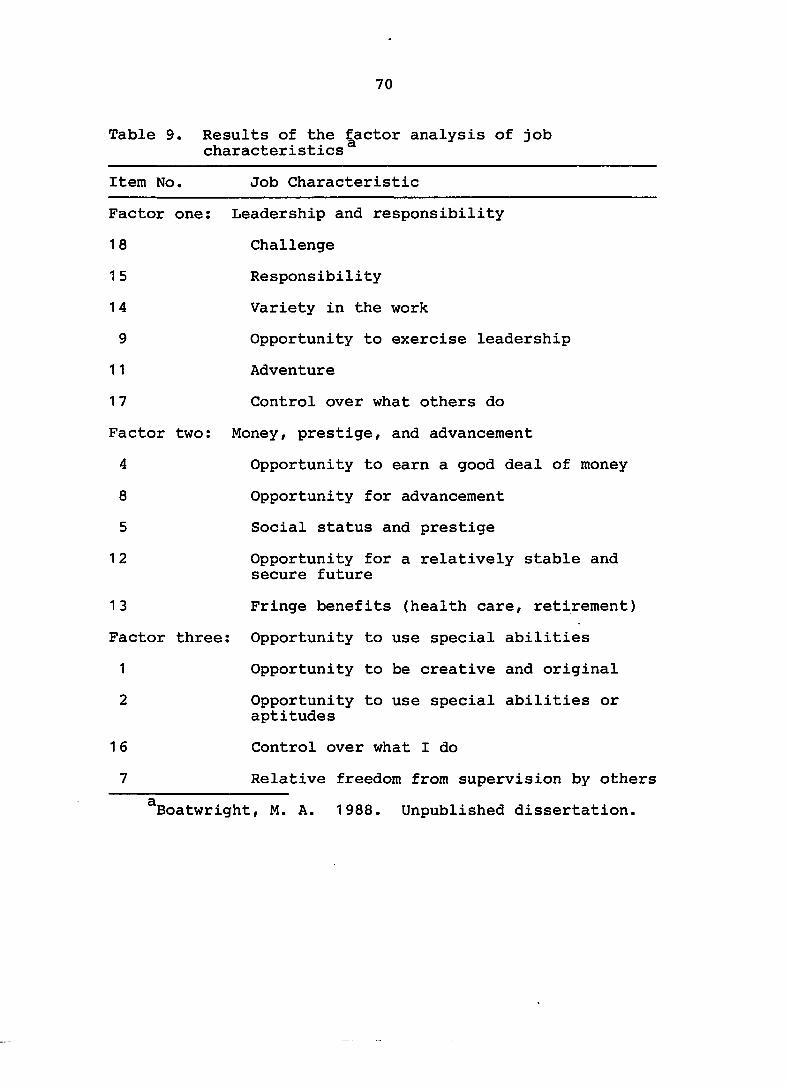
70
Table 9. Results of the factor analysis of job characteristics
Item No. Job Characteristic
Factor one: Leadership and responsibility
18 Challenge
15 Responsibility
14 Variety in the work
9 Opportunity to exercise leadership
11 Adventure
17 Control over what others do
Factor two: Money, prestige, and advancement
4 Opportunity to earn a good deal of money
8 Opportunity for advancement
5 Social status and prestige
12 Opportunity for a relatively stable and secure future
13 Fringe benefits (health care, retirement)
Factor three: Opportunity to use special abilities
1 Opportunity to be creative and original
2 Opportunity to use special abilities or aptitudes
16 Control over what I do
7 Relative freedom from supervision by others
^Boatwright, M. A. 1988. Unpublished dissertation.
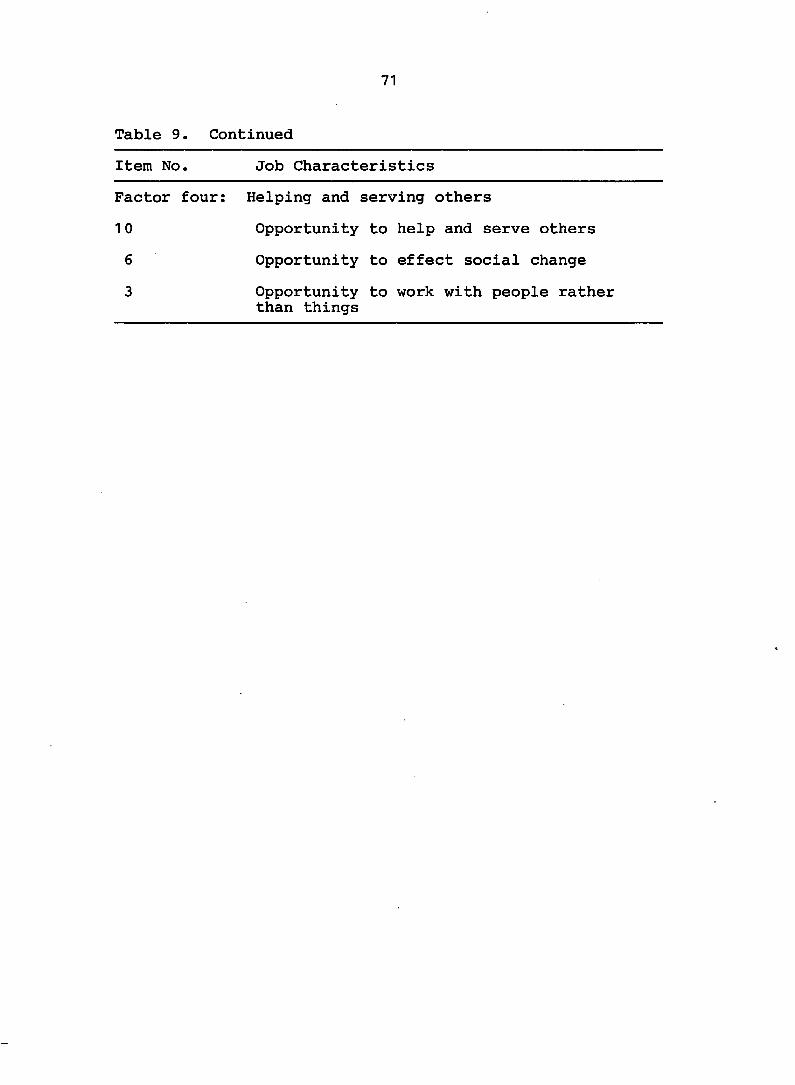
71
Table 9. Continued
Item No. Job Characteristics
Factor four; Helping and serving others
10 Opportunity to help and serve others
6 Opportunity to effect social change
Opportunity to work with people rather than things

72
6. Item composite scores should be as similar in content
as possible.
The Theoretical Framework
This study will focus on a theoretical framework that
encompasses the variables deemed important to
understanding factors related to the retention of
beginning teachers. These variables that will be examined
in this study include sex, academic aptitude, long-range
career plans, adequacy of teacher preparation program,
participation in high school extracurricular activities,
job characteristics preference and willingness to "do it
over" if one had the opportunity to choose a career again.
Several research studies have presented theoretical
frameworks aimed at explaining career decisions faced by
students, who upon graduation, must decide which career
path to take. Holland (1973) posits that vocational
satisfaction and stability depend on the congruence
between one's personality and the environment in which one
works. His model makes the explicit assumption that
people search for environments that will let them exercise
their skills and abilities, express their attitudes and
values and take on agreeable problems. According to
Holland, career changes may result from: (1) changes in
personality that may be triggered by life-stage
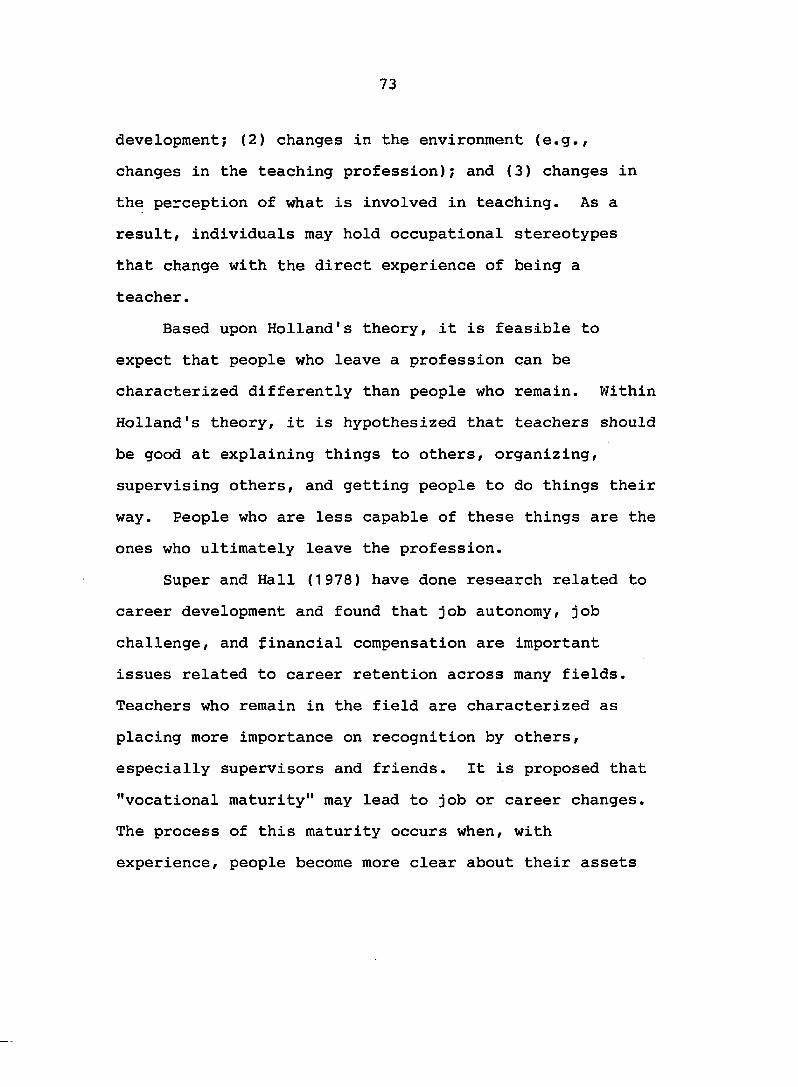
73
development; (2) changes in the environment (e.g.,
changes in the teaching profession); and (3) changes in
the perception of what is involved in teaching. As a
result, individuals may hold occupational stereotypes
that change with the direct experience of being a
teacher.
Based upon Holland's theory, it is feasible to
expect that people who leave a profession can be
characterized differently than people who remain. Within
Holland's theory, it is hypothesized that teachers should
be good at explaining things to others, organizing,
supervising others, and getting people to do things their
way. People who are less capable of these things are the
ones who ultimately leave the profession.
Super and Hall (1978) have done research related to
career development and found that job autonomy, job
challenge, and financial compensation are important
issues related to career retention across many fields.
Teachers who remain in the field are characterized as
placing more importance on recognition by others,
especially supervisors and friends. It is proposed that
"vocational maturity" may lead to job or career changes.
The process of this maturity occurs when, with
experience, people become more clear about their assets

74
and liabilities as well as about the opportunities and
limitations of their jobs.
Super (1980) postulates yet another approximation
of career development. This model, designated the "Life
span, Life Space Approach to Career Development" presumes
that a career is the combination and sequences of roles
played by a person during the course of a lifetime.
These roles include that of child, student, leisurite,
citizen, worker, spouse, homemaker, parent and pensioner.
A person may play one role or a combination of roles at
some point in life. Emotional involvement also takes on
the characteristics of a role and varies with the life
stage. This involvement may be impaired, however, if
work does not provide a challenge or prospects for
advancement within a workplace.
The principal theaters for these roles are ( 1 ) the
home, (2) the community, (3) the school (including the
college or university), and (4) the workplace. The
simultaneous combination of life roles constitutes the
life style; their sequential combinations structure the
life space and constitutes the life cycle. The entire
structure is the career pattern.
As Figure 2 shows, the decision points of a life
career reflect encounters with a variety of personal and
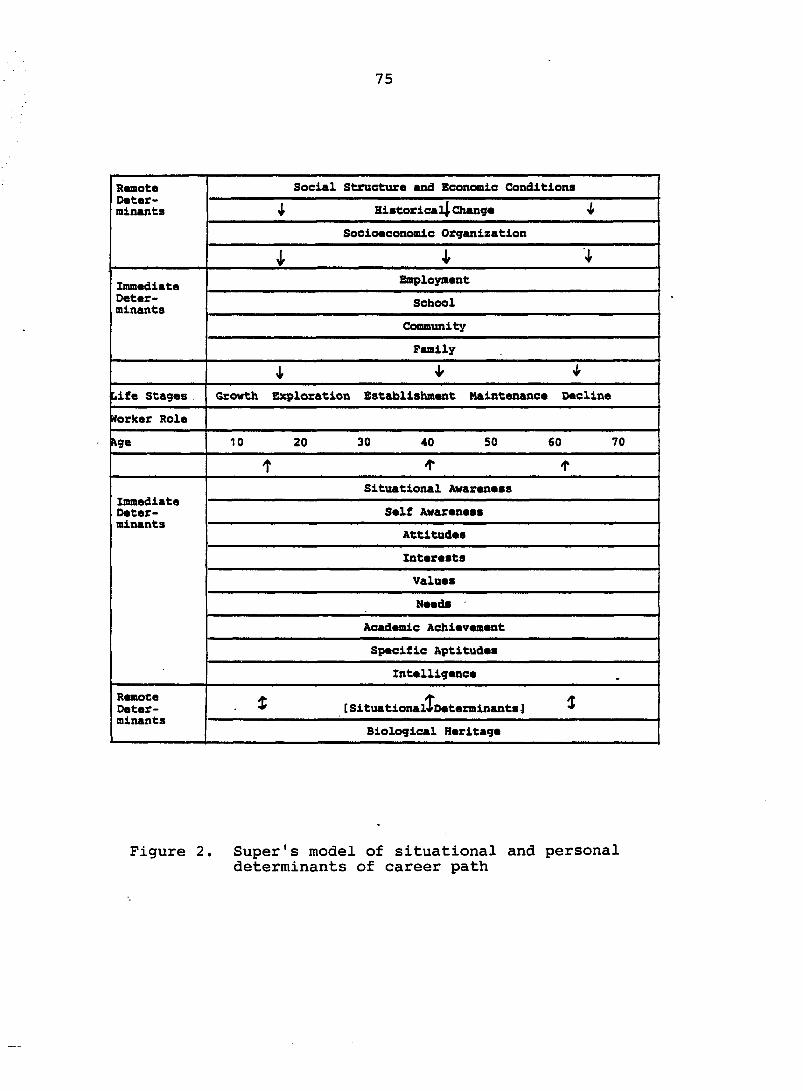
75
Remote Determinants
Social Structure and Economic Conditions Remote Determinants 4 Historical^ Change i
Remote Determinants
Socioeconomic Organization
Remote Determinants
Jr : i
Immediate Determinants
Employment Immediate Determinants
School
Immediate Determinants
Community
Immediate Determinants
Family
^ i
[life Stages Growth Exploration Establishment Maintenance Decline
Worker Role
Age 10 20 30 40 50 60 70
Immediate Determinants
Situational Awareness Immediate Determinants
Self Awareness Immediate Determinants
Attitudes
Immediate Determinants
Interests
Immediate Determinants
Values
Immediate Determinants
Needs
Immediate Determinants
Academic Achievement
Immediate Determinants
Specific Aptitudes
Immediate Determinants
Intelligence
Remote Determinants
^ [SituationalToeterminants] ^ Remote Determinants
Biological Heritage
Figure 2. Super's model of situational and personal determinants of career path

76
situational determinants. Some determinants are the
result of genetic factors modified by experiences in the
womb, home, and community. Other determinants are
geographic, historic, social and economic conditions in
which the individual functions from infancy through
adulthood. The continuous effects of these personal and
situational determinants are depicted by continuous lines
and repeated arrows which act to push the individual up
or down. The biological heritage interacts with
situational determinants thereby producing intelligence,
specific aptitudes, awareness, educational and
occupational information, academic achievement, and other
cognitive traits.
Krumboltz's (1979) social learning theory has also
been used in research studies to explain how
psychological functioning interacts with personal
characteristics, previous behavior and environmental
determinants. He contends that this theory can be used
to identify the interaction of genetic factors,
environmental conditions, learning experiences, cognitive
and emotional responses, and performance skills that
produce movement along one career path or another.
Different combinations produce different career
decisions.

77
The model in Figure 3 offers specific application
to teaching. It suggests that one has to consider (1)
the personal characteristics of the teachers, (2) the
nature of teacher training and early teaching
experiences, (3) the degree to which the teacher is
socially and professionally integrated into the teaching
profession, (4) the satisfaction teachers derive from
their careers, and (5) the external environmental
influences impinging on the teachers' careers.
No model can portray all details as accurately as
desired, therefore, the model that will guide this study
will use selected variables deemed appropriate in
studying the relationship of certain factors affecting
the career paths of students who enter the teaching
profession after graduation and those who do not. Figure
4 represents the variables theorized to be related to
teacher education students choosing an education or non-
education career. They are: (1) gender; (2) high school
rank; (3) high school grade point average (GPA); (4)
participation in high school extracurricular activities;
(5) job orientation (TIME3); (6) evaluation of teacher
preparation program; (7) adequacy of teacher preparation
program; (8) plan to teach; and (9) willingness to "do
it over" again. This framework guided the review of
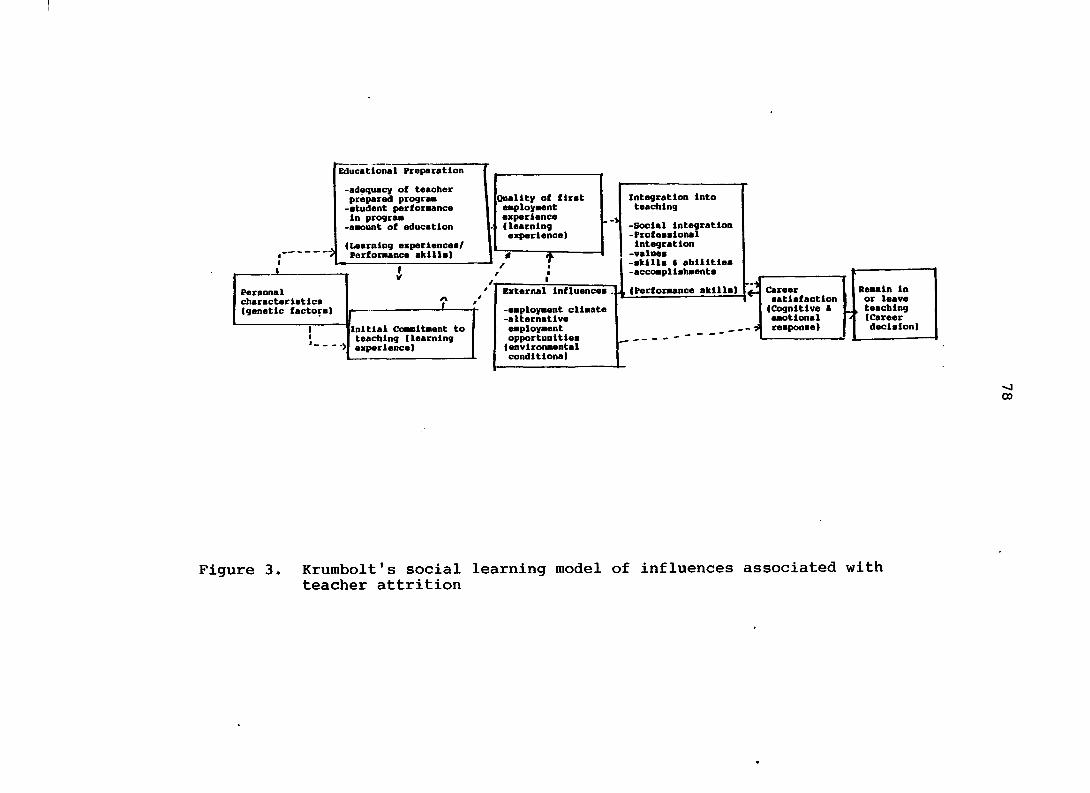
Educational Preparation
-adequacy of teacher prepared program -atudent performance In program -amount of education
(Learning experlencea/ Performance akllla)
Personal cbaracterlatlca (genetic factorsI
T I
Quality of flrat employment experience (learning experience)
Initial Commitment to teaching (learning experience)
External influences
-employment climate -alternative employment opportunities
(environmental condltlona)
Integration into teaching
-Social integration -Professional Integration -values -skills • abilities -accomplishments
(Performance skills) "1 Career
satisfaction (Cognitive ( emotional response)
Remain in or leave
I teaching (Career decision)
Figure 3. Krumbolt's social learning model of influences associated with teacher attrition
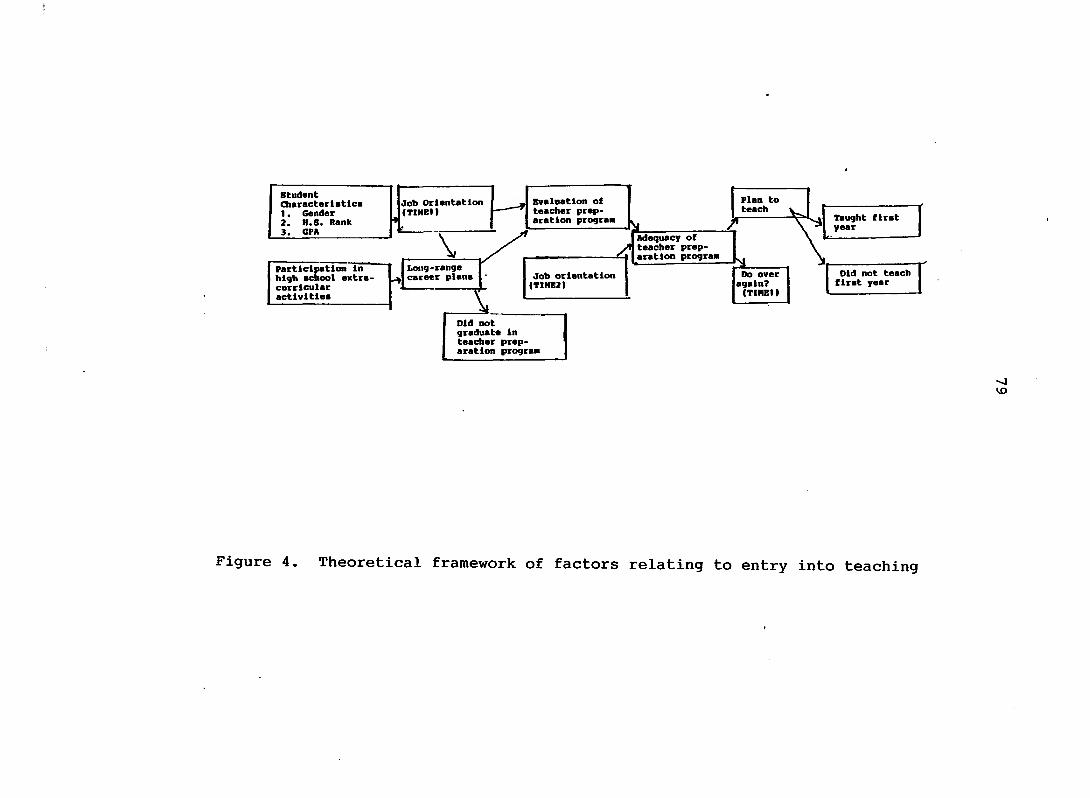
!
Student Characteristics 1. Gender 2. n.S. Rank 3. CPA
Job Orientation (TIHBII
Taught first year
Adequacy of teacher preparation program
Participation in high school extracurricular activities
Do over again? (TXHEtI
Did not graduate in teacher preparation program
Plan to teach
Did not teach first year
Job orientation ITIHB2I
Evaluation of teacher preparation program
VO
Figure 4. Theoretical framework of factors relating to entry into teaching

80
selected literature (Chapter II) and all subsequent
chapters.
Research Hypotheses to Be Tested
Based upon the review of selected literature, the
following hypotheses will be tested for both the Iowa
State sample and the High School and Beyond sample.
1. The mean academic indicators of teacher education
students who teach the first year after graduation
is not significantly different from those students
who do not teach the first year.
2. There is no significant difference between the mean
academic indicators of male teacher education
students who teach the first year after graduation
and those who do not.
3. There is no significant difference between the mean
academic indicators of female teacher education
students who teach the first year after graduation
and those who do not.
4. There is no significant difference between sex and
academic indicators for students who teach the first
year after graduation and those who do not.

81
5. There is no significant difference between gender and
the ratings of certain job characteristics between
those teacher education students who teach the first
year after graduation and those who do not.
6. There is no significant difference between the high
school activities of those students who teach one
year after graduation and those who do not.
7. The decision to "do it over" is not independent of
teaching level.
8. There is no significant relationship between teaching
or not teaching the first year after graduation and
a combination of independent variables.

82
CHAPTER IV
The statistical analysis will be presented in this
chapter. Hypotheses testing will be utilized to determine
the relationship between selected background
characteristics and variables deemed important to
understanding which variables contribute most to the
prediction of which teacher education students are more
likely to be attracted to teaching after graduating and
which ones are not. The data used in this study were
compiled in three phases and included: 1) students who
declared a teacher education major; 2) students who
graduated in teacher education; and 3) students who taught
the first year after graduation. The Iowa State sample
consists of 829 students who indicated they were
interested in teacher education. An additional
twenty-four students were lost due to missing information
or social security numbers. The final sample, upon which
the following analyses are made, consists of 211 students
who graduated and completed the first year follow-up
questionnaire. The High School and Beyond sample consists
of 76,057 students who indicated an interest in majoring
in education during their college sophomore year. The
analyses for this sample will utilize their data.

83
Statistical tests yielding a significance level of .05 or
higher will be considered significant in this study.
Indicators of scholastic standing are important
variables to be examined in this study, therefore, each
sample will have different but comparable measures to
denote scholastic achievement. High school rank, as
indicated by students' permanent record files, will be the
index of academic ability for the Iowa State sample. This
variable is measured from 1 (indicating high academic
standing) to 3 (which indicates low academic standing).
The scholastic index for the High School and Beyond sample
is self-reported high school grades when the students were
sophomores in college. The grades are appraised on a
scale of 1 (mostly As) to 8 (below D) (see Appendix).
These two measures will be assessed relative to individual
samples and will be referred to as "academic indicators"
throughout the remainder of this study. The sample for
each hypothesis consists of teacher education students
who, in their sophomore year of college, indicated an
interest in majoring in teacher education.
Hypothesis 1
Hypothesis 1 states that the mean academic indicators
of teacher education students who teach the first year

84
after graduation is significantly different from those
students who do not teach the first year. A t-test was
used to test this hypothesis. The results of this
analysis are presented in Table 10.
The Iowa State sample
The results of the t-test for the Iowa State sample
revealed that students who were teaching one year after
graduation had a higher mean academic indicator than
students who graduated in teacher education but did not
teach. High school rank was a continuous variable on a
scale of 1 - 85. It was coded as follows: '1' (1-25); '2'
(26-50); and *3' (51-85). On a scale of 1 (high) to 3
(low), students who majored in teacher education and
taught the first year had a mean academic indicator of
1.39 (n = 127) and the mean academic indicator for the
students who did not teach was 1.50 (n = 61). The
resulting t-value of -1.01 was not significant.
Hypothesis 1 is, therefore, rejected.
The High School and Beyond sample
Results of the t-test of the mean academic indicators
of students who teach the first year after graduation and
those who do not indicate a significant difference between
the mean indicators of these two groups. High school CPA,
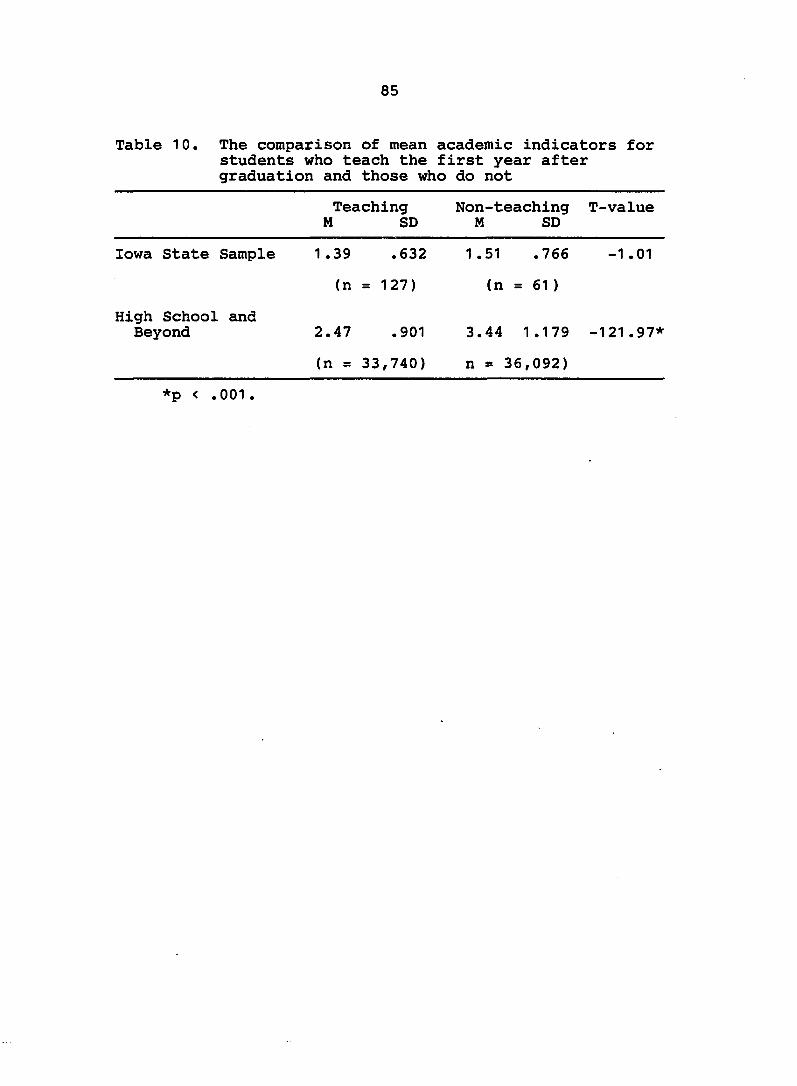
85
Table 10. The comparison of mean academic Indicators for students who teach the first year after graduation and those who do not
Teaching Non-teaching T-value M SD M SD
Iowa State Sample 1.39 .632 1 . 51 .766 -1 .01
(n = 127) (n = 61 )
High School and Beyond 2.47 .901 3. 44 1 .179 -121 .97*
(n = 33,740) n = 36, 092)
*p < .001.

86
the academic indicator for this sample, was rated as
follows: 1 (mostly A); 2 (Half A/Half B); 3 (Mostly B);
4 (Half B/Half C); 5 (Mostly C); 6 (Half C/Half D); 7
(Mostly D); and 8 (Below). The mean indicator on a scale
of 1 (high) to 8 (low) was 2.47 (n = 33,740) for students
who teach the first year after graduation. The mean
indicator for students who did not teach one year after
graduation was 3.44 (n = 36,092). The t-value of -121.97
was found to be significant at the p.001 level.
Hypothesis 1 was, therefore, supported.
Hypothesis 2
Hypothesis 2 states that there is no significant
difference between the mean academic indicators of male
teacher education students who teach the first year after
graduation and those who do not. A t-test was calculated
to test this hypothesis. The results are shown in Table
1 1 .
Iowa State sample
This hypothesis required the computation of a t-test.
The results indicate that the mean academic indicator of
males who teach after graduation is higher (1.45) than the
mean indicator of males who do not teach (1.63). The t-

87
Table 11. The comparison of mean academic indicators for males who teach the first year after graduation and those who do not
Teaching Non-teaching T-value M SD M SD
Iowa State Sample 1 .45 .793 1 .63 .806 -.51
(n = 22) (n = 16)
High School and 2.11 .322 3.50 .949 -73.27* Beyond sample •
(n = 2,638) (n = 6,136)
*p < .001.
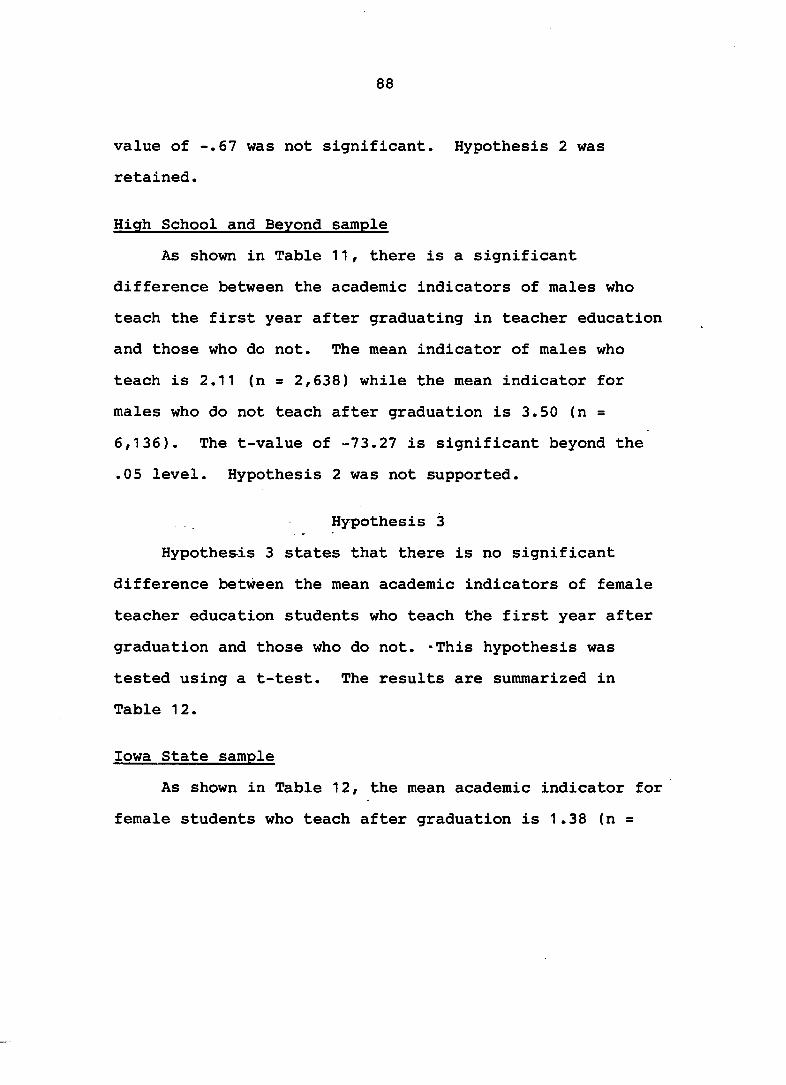
88
value of -.67 was not significant. Hypothesis 2 was
retained.
High School and Beyond sample
As shown in Table 11, there is a significant
difference between the academic indicators of males who
teach the first year after graduating in teacher education
and those who do not. The mean indicator of males who
teach is 2.11 (n = 2,638) while the mean indicator for
males who do not teach after graduation is 3.50 (n =
6,136). The t-value of -73.27 is significant beyond the
.05 level. Hypothesis 2 was not supported.
Hypothesis 3
Hypothesis 3 states that there is no significant
difference between the mean academic indicators of female
teacher education students who teach the first year after
graduation and those who do not. -This hypothesis was
tested using a t-test. The results are summarized in
Table 12.
Iowa State sample
As shown in Table 12, the mean academic indicator for
female students who teach after graduation is 1.38 (n =

89
Table 12. Comparison of the mean academic indicators of female students who teach the first year after graduation and those who do not
Teaching M SD
Non-teaching M SD
T-value
Iowa State Sample 1.38 .611 1.46 .757 -.67
(n = 105) (n = 45)
High School and 2.50 .928 3.43 1.221 -106.38* Beyond sample
(n - 31,101 ) (n - 29,956)
*p < .001.

90
105) while the mean indicator for those females who do not
teach is 1.46. The t-value was found not to be
significant. Hypothesis 3 was supported.
High School and Beyond sample
The calculated means in Table 12 indicate that there
is a significant difference between the mean academic
indicator of female teacher education students who teach
the first year after graduation and those who do not in
this sample. The mean indicator for the females who went
into teaching was 2.50; the mean college grades for
females who did not teach the first year after graduation
was 3.43. The t-values for both means were significant
at the .001 level. Hypothesis 3 was not supported based
upon these results.
Hypothesis 4
Hypothesis 4 states that there is no significant
difference between sex and academic indicators for
students who teach the first year after graduation and
those who do not. A two-way analysis of variance was
computed to test this hypothesis. The results are shown
in Tables 13 and 14.

91
Table 13. ANOVA of academic indicators by gender and teaching status (Iowa State sample)
N M F-ratio
Gender
Male 38 1.53^
Female 150 1.41 .741
Current employment status
Teaching 127 1.39
Non-teaching 61 1.51 .970
Gender by employment status
Men--teaching 45 1.47
Men--non-teaching 16 1.63
Women--teaching 105 1.38
Women—non-teaching 22 1.45 .111
^The rating scale was 1 to 3 with 1 = high, 3 = low.

92
Table 14. ANOVA of academic indicators by gender and teaching status (High School and Beyond sample)
N M F-ratio
38.37*
Gender
Men 8,774 3.09'
Women 61,057 2.96
Current employment status
Teaching 33,740 2.47
Non-teaching 36,092 3.44
Gender by employment status
Men--teaching 2,638 2.12
Men—non-teaching 6,136 3.50
Women--teaching 31,101 2.50
Women—non-teaching 29,956 3.43
14872.83*
309.28
.The rating scale was 1 to 8 with 1 = high, 8 = low, °p < .001.

93
Results of the Iowa State sample
The means in Table 13 indicate that females had a
higher mean than the males. Those students who were not
teaching had a higher mean than those who were. There was
no significant differences in the means for gender and
teaching status. Hypothesis 4 was supported.
Results of the High School and Beyond sample
As shown in Table 14, there is a gender difference
in the mean academic indicators of students who teach
after graduation and those who do not. The mean indicator
of females who go into teaching was 2.50. The mean
indicator for the males who went into teaching was 2.12.
The mean indicator for females who did not go into
teaching was 3.43 while the mean indicator for their male
counterparts was 3.50. The combined results of the means
indicated a mean of 2.47 for all students who go into
teaching and a mean of 3.44 for students who did not teach
the first year after graduation. The F ratio for the
combination of gender and teaching status was 309.283
which was significant beyond the .001 level. The
interaction between the two groups revealed that males,
as a group, had higher means than the females. Hypothesis
4 was not supported.

94
Hypothesis 5
Hypothesis 5 states that there is no significant
differences between gender and the ratings of certain job
characteristics between those teacher education students
who teach the first year after graduation and those who
do not. A two-way analysis of variance was computed to
test this hypothesis. The results are furnished in Tables
15 and 16.
Results of the Iowa State sample
The composite factors that will be used to test this
hypothesis are: 1) leadership and responsibility; 2)
money, prestige, and advancement; 3) opportunity to use
special abilities; and 4) helping and serving others.
Table 15 shows the results of the ANOVA used to test
whether there was a difference in the ratings of these job
characteristics by gender and by teaching level. As
shown, the females in the sample tended to rate the
importance of 1) leadership and responsibility and 2)
helping and serving others higher than the males. The
males rated 1) opportunity to use special abilities and
2) money, prestige and advancement higher than the
females. The F-ratio indicated that these differences
were not significant. The mean ratings of the four job
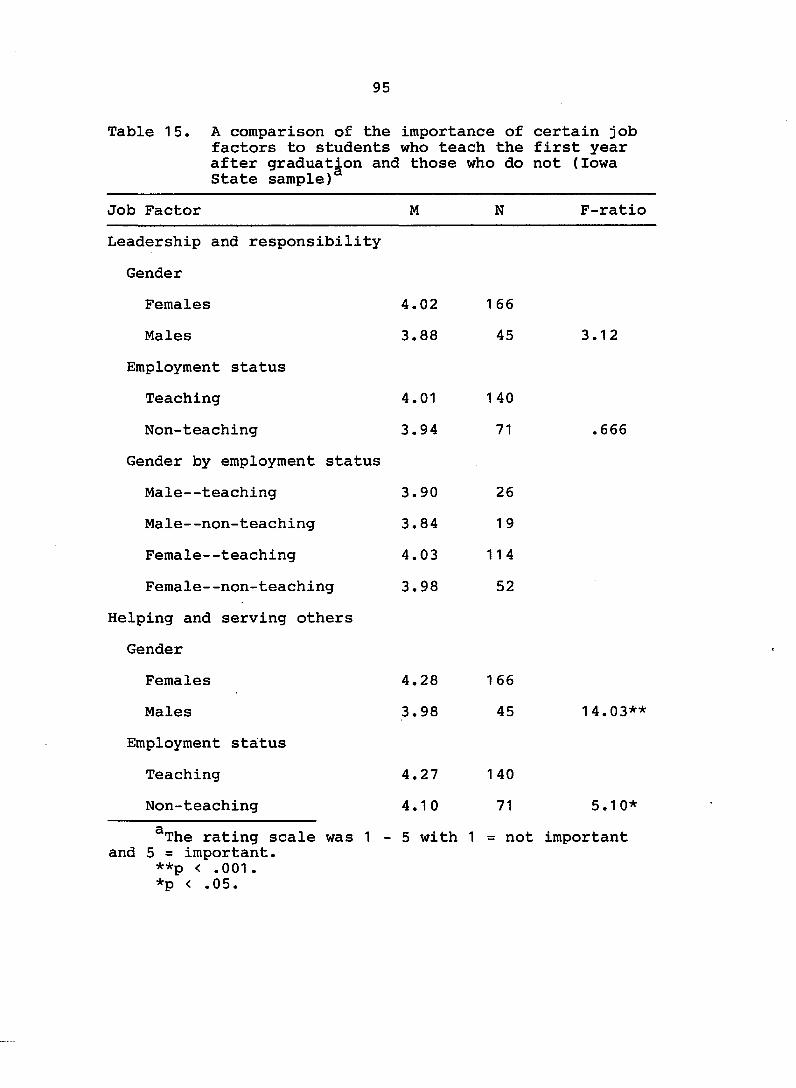
95
Table 15. A comparison of the importance of certain job factors to students who teach the first year after graduation and those who do not (Iowa State sample)
Job Factor M N F-ratio
Leadership and responsibility
Gender
Females 4.02 166
Males 3.88 45 3.12
Employment status
Teaching 4.01 140
Non-teaching 3.94 71 .666
Gender by employment status
Male--teaching 3.90 26
Male—non-teaching 3.84 19
Female--teaching 4.03 114
Female--non-teaching 3.98 52
Helping and serving others
Gender
Females 4.28 166
Males 3.98 45 14.03**
Employment status
Teaching 4.27 140
Non-teaching 4.10 71 5.10*
The rating scale was 1-5 with 1 = not important and 5 = important.
**p < .001. *p < .05.
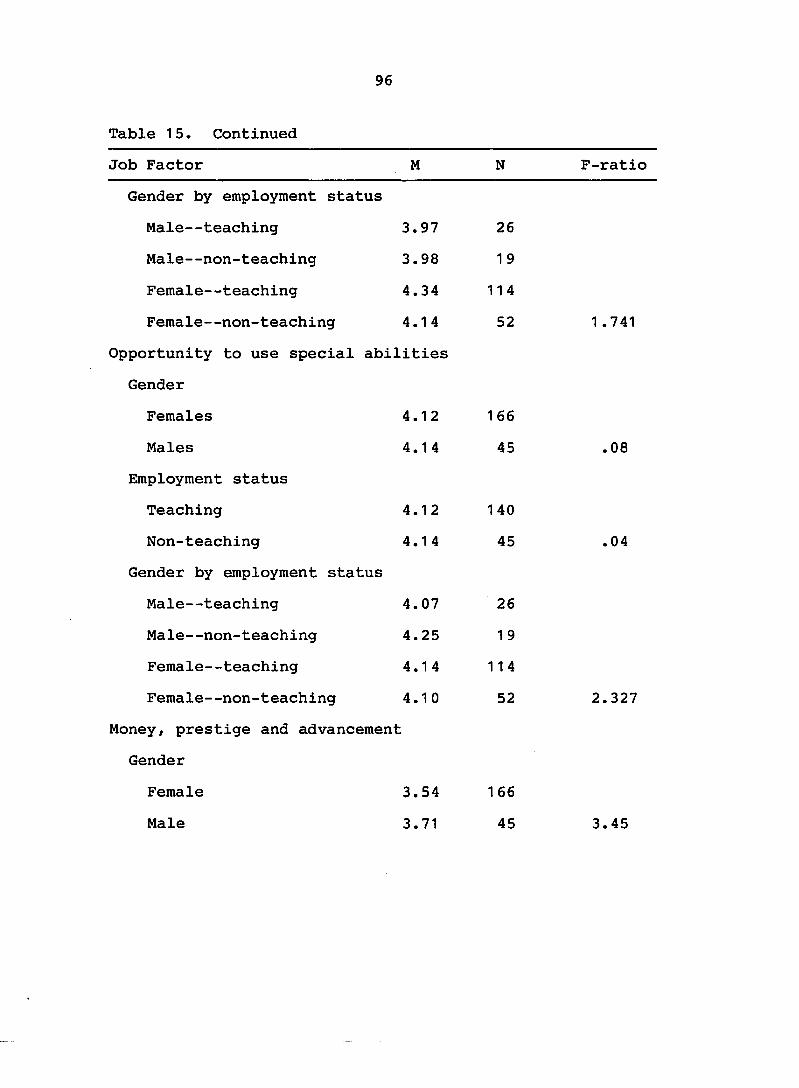
96
Table 15. Continued
Job Factor M N F-ratio
Gender by employment status
Male--teaching 3.97 26
Male--non-teaching 3.98 19
Female--teaching 4.34 114
Female--non-teaching 4.14 52 1.741
Opportunity to use special abilities
Gender
Females 4.12 166
Males 4.14 45 .08
Employment status
Teaching 4.12 140
Non-teaching 4.14 45 .04
Gender by employment status
Male--teaching 4.07 26
Male--non-teaching 4.25 19
Female—teaching 4.14 114
Female--non-teaching 4.10 52 2.327
Money, prestige and advancement
Gender
Female 3.54 166
Male 3.71 45 3.45

97
Table 15. Continued
Job Factor
Employment status
Teaching
Non-teaching
Gender by employment status
Male—teaching
Male—non-teaching
Female--teaching
Female--non-teaching
M N F-ratio
3.56 140
3.60 71 .115
3.69 26 .
3.73 19
3.53 114
3.55 52 .003
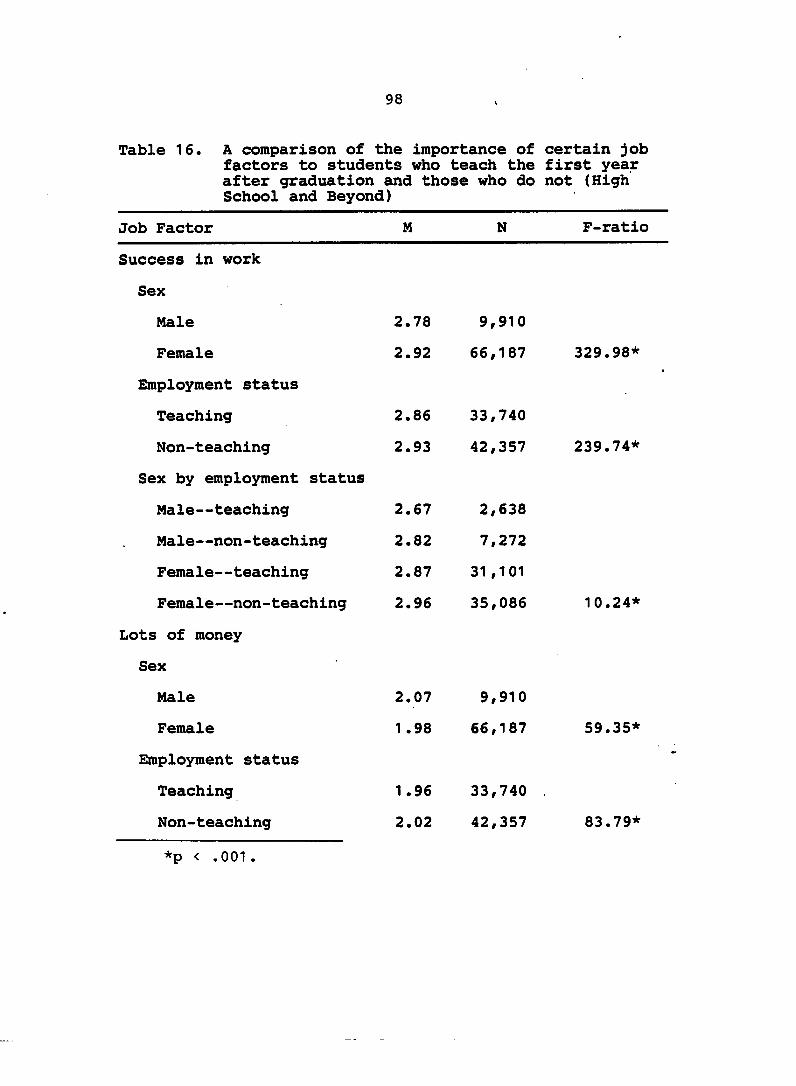
98
Table 16. A comparison of the importance of certain job factors to students who teach the first year after graduation and those who do not (High School and Beyond)
Job Factor M N F-ratio
Success in work
Sex
Male 2.78 9,910
Female 2.92 66,187 329.98*
Employment status
Teaching 2.86 33,740
Non-teaching 2.93 42,357 239.74*
Sex by employment status
Male—teaching 2.67 2,638
Male—non-teaching 2.82 7,272
Female—teaching 2.87 31 ,101
Female—non-teaching 2.96 35,086 10.24*
Lots of money
Sex
Male 2.07 9,910
Female 1 .98 66,187 59.35*
Employment status
Teaching 1.96 33,740
Non-teaching 2.02 42,357 83.79*
*p < .001.

99
Table 16. Continued
Job Factor M N F-ratio
Sex by employment status
Male—teaching 2.02 2,638
Male—non-teaching 2.09 7.272
Female—teaching 1.95 31 ,010
Female—non-teaching 2.01 35,086 .459
Steady work
Sex
Male 3.02 9,910
Female 2.86 66,187 294.19*
Employment status
Teaching 2.86 33,740
Non-teaching 2.90 42,357 29.92*
Sex by employment status
Male—teaching 3.00 2,638
Male—non-teaching . 3.02 7,272
Female—teaching 2.85 31,101
Female—non-teaching 2.88 35,086 .282
Correcting inequities
Sex
Male 1 .54 9,910
Female 1 .95 66,187 1,703.87*
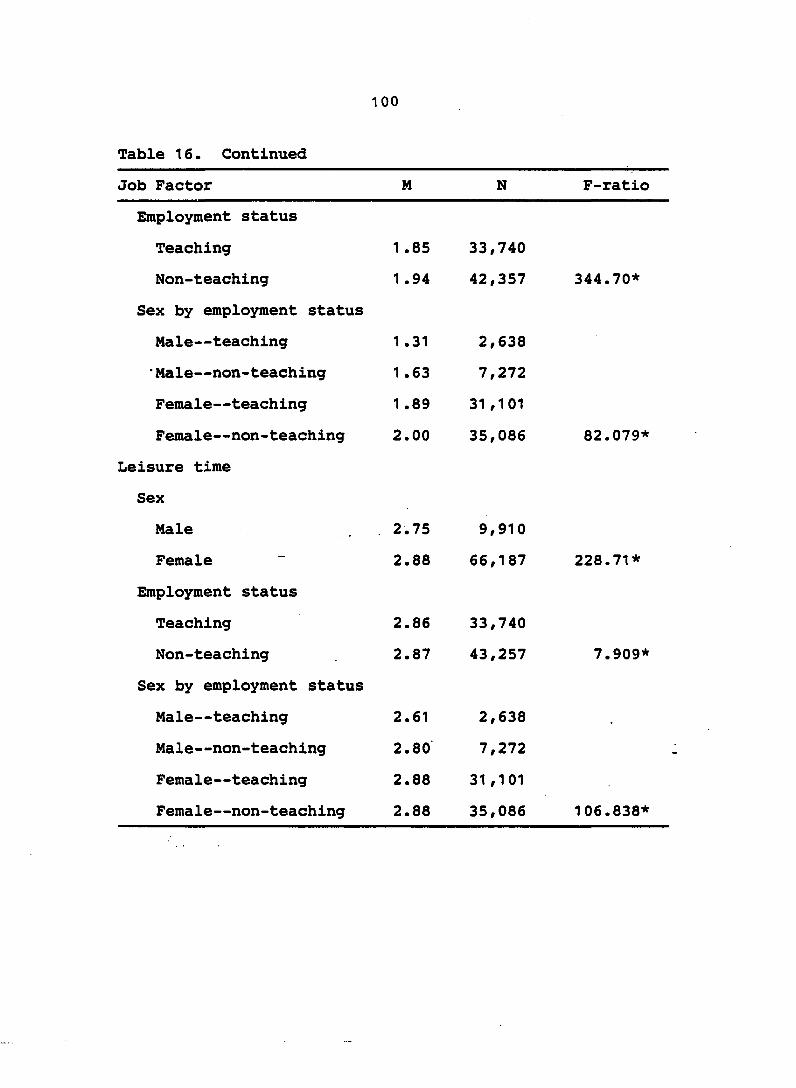
100
Table 16. Continued
Job Factor M N F-ratio
Employment status
Teaching 1 .85 33,740
Non-teaching 1 .94 42,357 344.70*
Sex by employment status
Male—teaching 1 .31 2,638
•Male—non-teaching 1 .63 7,272
Female—teaching 1 .89 31 ,101
Female—non-teaching 2.00 35,086 82.079*
Leisure time
Sex
Male . 2.75 9,910
Female ~ 2.88 66,187 228.71*
Employment status
Teaching 2.86 33,740
Non-teaching 2.87 43,257 7.909*
Sex by employment status
Male—teaching 2.61 2,638
Male—non-teaching 2.80 7,272
Female—teaching 2.88 31 ,101
Female—non-teaching 2.88 35,086 106.838*

101
characteristics by students who teach or do not teach
indicate that students who teach after graduating rate 1)
leadership and responsibility and 2) helping and serving
others as being more important in a job than those
students who did not teach. Students who did not teach,
on the average, rated 1) the opportunity to use special
abilities and 2) money, prestige and advancement as more
important job characteristics. The mean rating of
teachers (4.27) and non-teachers (4.10) on the importance
of helping and serving others was significantly different
at the .05 level. The significant difference in the
rating of the importance of helping others by gender
indicating that females (4.28) had a higher mean rating
than the males (3.98) was found to be significant beyond
the .001 level of significance. Hypothesis 5 is partially
supported. There was no significant interaction effect
for any of the job characteristics in the Iowa State
sample.
Results of the High School and Beyond sample
The job factors used in this survey instrument were
measured on a 3-point scale (1 = not important to 3 = very
important). Table 16 shows that males and females who
taught one year after graduation differed significantly

102
from their male and female counterparts who did not go
into teaching. Women and men who taught tended to rate
the importance of success in work, lots of money, steady
work and correcting inequities significantly lower than
men and women who had non-teaching positions. The
importance of leisure time was rated significantly higher
by males who taught than males who did not teach after*
graduation. The females had a significant but identical
mean rating of the importance of leisure time. Inspection
of the interaction among these factors revealed three
factors affected males and females differently. The
importance of success in work, correcting inequities and
leisure time were rated significantly higher by the
females in the groups. A level of .001 was maintained for
all main effects in the analysis of variance. Hypothesis
5 was, therefore, rejected.
Hypothesis 6
Hypothesis 6 states that there is no significant
difference between the high school activities of those
students who teach one year after graduation and those who
do not. For analysis purposes, the high school
extracurricular activities in both samples have been
grouped into four categories: 1) athletics; 2) subject

103
matter; 3) honorary; and 4) other. The activities that
made up the four categories for each sample are listed in
Table 17a. The results of the chi-square used to test the
hypothesis in both samples are included in Tables 17 and
1 8 .
Results of the Iowa State sample
As indicated, for the purpose of this hypothesis,
four subgroups were established. Table 17 shows that
within each subgroup there was little variation between
the teaching and non-teaching samples. The chi-square
statistic for each subgroup was not found to be
significant. The number of students who participated or
did not participate in high school extracurricular
activities by teaching status was fairly even across the
four categories. Hypothesis 6 was, therefore, supported.
Results of the High School and Beyond sample
Table 18 shows the results of the analysis of the
High School and Beyond data. The significant chi-square
allows for the rejection of Hypothesis 6.
Hypothesis 7
Hypothesis 7 states that the decision to "do it over"
if you could choose a career again is independent of
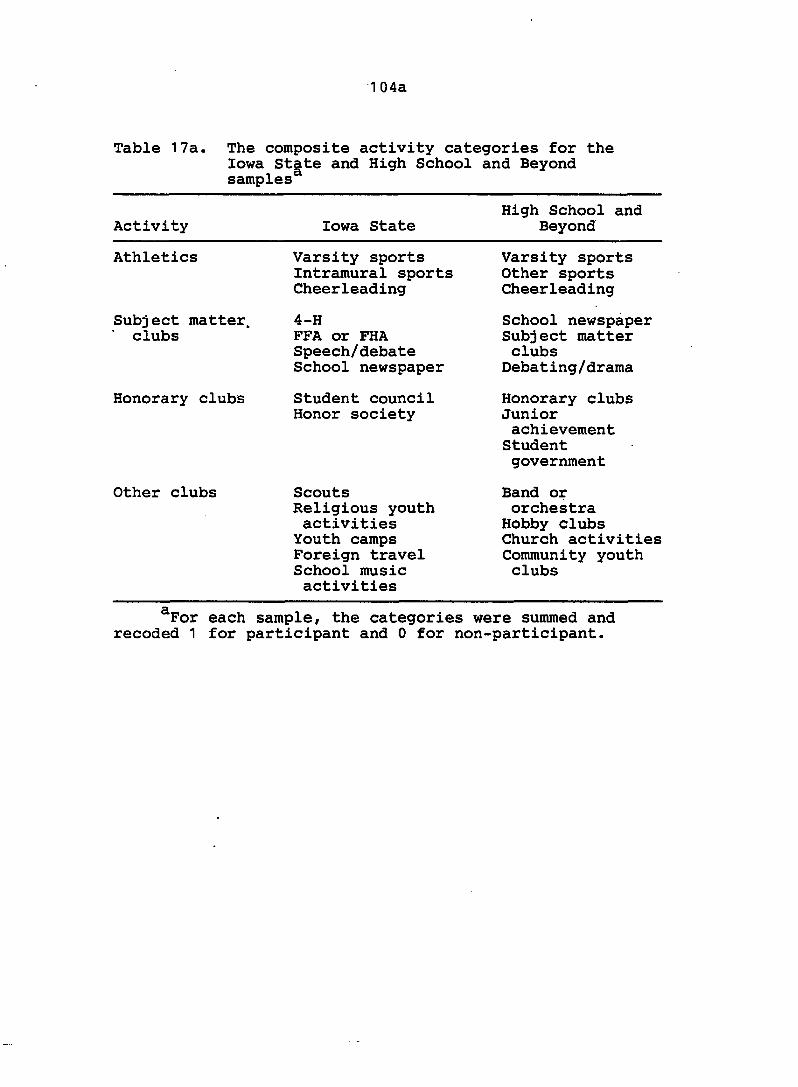
1 04a
Table 17a. The composite activity categories for the Iowa State and High School and Beyond samples
Activity Iowa State High School and
Beyond
Athletics Varsity sports Intramural sports Cheerleading
Varsity sports Other sports Cheerleading
Subject matter, clubs
4-H FFA or FHA Speech/debate School newspaper
School newspaper Subject matter clubs Debating/drama
Honorary clubs Student council Honor society
Honorary clubs Junior achievement Student government
Other clubs Scouts Religious youth activities Youth camps Foreign travel School music activities
Band or orchestra Hobby clubs Church activities Community youth clubs
^For each sample, the categories were summed and recoded 1 for participant and 0 for non-participant.

104b
Table 17. Results of the chi-square testing the independence of participation in high school extracurricular activities and teaching after graduation (Iowa State sample)
Activity Categories
Teaching Non-teaching Observed Expected Observed Expected
Athletics
Participant 112 Non-participant 28
110.1 29.9
54 17
55.9 15.1
Subject matter clubs
Chi-square = .233
Participant 96 Non-participant 44
96.9 43.1
50 21
49.1 21.9
Honor clubs
Chi-square = .013
Participant 80 Non-participant 60
77 63
36 35
39 32
Other clubs
Chi-square = .550
Participant 135 Non-participant 5
136 4
70 1
69 2
Chi-square = .206
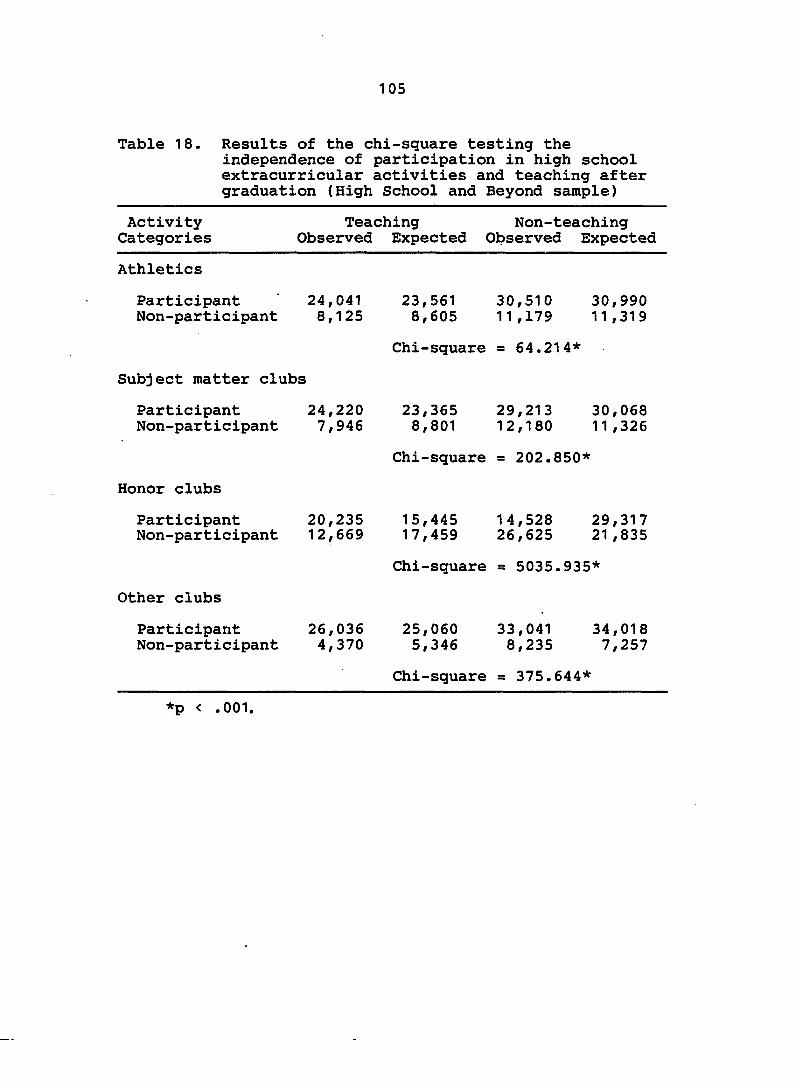
105
Table 18. Results of the chi-square testing the independence of participation in high school extracurricular activities and teaching after graduation (High School and Beyond sample)
Activity Categories
Teaching Non-teaching Observed Expected Observed Expected
Athletics
Participant 24,041 23,561 30,510 30,990 Non-participant 8,125 8,605 11,179 11,319
Chi-square = 64.214*
Subject matter clubs
Participant 24,220 23,365 29,213 30,068 Non-participant 7,946 8,801 12,180 11,326
Chi-square = 202.850*
Honor clubs
Participant 20,235 15,445 14,528 29,317 Non-participant 12,669 17,459 26,625 21,835
Chi-square = 5035.935*
Other clubs
Participant 26,036 25,060 33,041 34,018 Non-participant 4,370 5,346 8,235 7,257
Chi-square = 375.644*
*p < .001.

106
teaching level. For the Iowa State sample, "do over
again" was coded 1 = yes; 2 = no; and 3 = undecided. The
same item in High School and Beyond was coded as 1 = yes
and 2 = no. A significantly large number of students who
taught participated in the four activity categories.
There was a significantly smaller number of non-teaching
students who participated in the four activity groups.
Among the non-participating students, le.ss teachers were
observed among the four categories; more non-teachers did
not participate in each of the groupings. The calculated
chi-square was significant beyond the .001 level for each
subgroup. A chi-square will be used to test this
hypothesis. The results are presented in Tables 19 and
20.
Results of the Iowa State sample
The chi-square results presented in Table 19 indicate
that the decision to "do it over" if you could choose a
teaching career again is not independent of teaching
level. The levels that contribute the most to the
chi-square statistic were the elementary and secondary
levels. More students at the elementary level indicated
they would choose teaching again. Less students than
expected indicated no or they were undecided about a

107
Table 19. Results of the chi-square testing the independence of decision to prepare to teach again and teaching level (Iowa State sample)
Do over? Observed Expected Residual
Elementary
Yes 76
No 4
Undecided 19
Secondary
Yes 37
No 20
Undecided 25
Elementary/Secondary
Yes 13
No 4
Undecided 9
60
13
25
50
11
21
1 6
3
7
15
-9
—6
-13
9
4
-3
1
2
chi-square - 29.94*
*p < .001 .

108
teaching career. At the secondary level, less students
than expected indicated they would choose teaching again.
More students than expected responded "no" or were
undecided about whether they would choose teaching again.
Among the students with elementary and secondary
certification, less students indicated they would choose
teaching again. More of these students indicated no or
were undecided than was expected. The chi-square
statistic (29.94) was found to be highly significant.
Hypothesis 7 was not supported.
Results of the High School and Beyond sample
Table 20 summarizes the data obtained from the
computation of the chi-square statistic. The results show
that the decision to choose teaching again is not
independent of teaching level. Further analysis of the
residuals between the observed and expected values show
that secondary teaching level is contributing the most to
the chi-square followed by elementary and kindergarten
levels. There was a smaller number of students who were
willing to teach again if they could "do it over" at both
the kindergarten and elementary levels. The largest
difference between the observed and expected values for
this sample was found among the secondary schoolteachers.
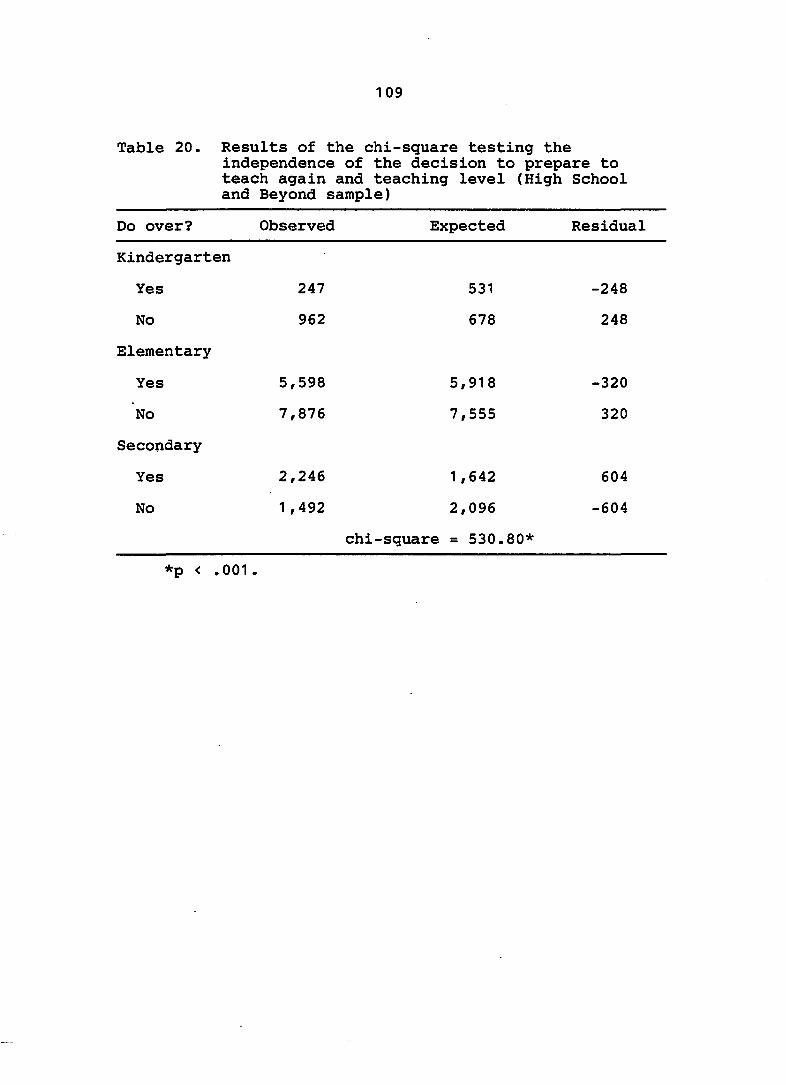
109
Table 20. Results of the chi-square testing the independence of the decision to prepare to teach again and teaching level (High School and Beyond sample)
Do over? Observed Expected Residual
Kindergarten
Yes
No
Elementary
Yes
No
Secondary
Yes
No
247 531
962 678
5,598 5,918
7,876 7,555
2,246 1,642
1,492 2,096
chi-square = 530.80*
-248
248
-320
320
604
-604
*p < .001.
1 1 0
with a larger number than expected responding
affirmatively that they would choose teaching again.
Hypothesis 7 was, therefore, rejected.
Hypothesis 8
Hypothesis 8 states that there is no significant
relationship between teaching or not teaching the first
year after graduation and a combination of independent
variables. Regression analyses will be computed to test
this hypothesis.
Iowa State sample
The independent variables for the Iowa State sample
will include: 1) gender; 2) composite job factors (4
items); 3) decision to do over again; 4) composite
adequacy of teacher preparation areas (4 items); 5) high
school rank; 6) plans to teach; and 7) participation in
high school extracurricular activities. The adequacy of
teacher preparation items were:
1) Planning and delivering instruction;
2) Student motivation and discipline;
3) Monitoring student achievement;
4) Assessing and dealing with learning problems; and
5) Interpersonal relationships (see Appendix for
calculated means by gender and teaching status.
I l l
The dependent variable will be teaching/non-teaching the
first year after graduation.
The results of the regression analysis in Table 21
revealed that plans to teach had a positive effect on
teaching accounting for more than 10 percent of the
variance in teaching or not teaching as indicated by the
column labeled R-square. Helping and serving others
accounted for another 5% of the variance. Helping and
serving others and money, prestige, and advancement were
found to be positively related to teaching, each
accounting for an additional five percent of the variance.
Three and two percent of the variance was explained by
planning units of instruction and gender, respectively.
The final R-square indicates that the five variables in
the equation accounted for 25% of the variance in the
decision to teach or not to teach. The F-value of 10.5819
was significant beyond the p.001 level of significance.
Hypothesis 8 was not supported.
The High School and Beyond sample
The independent variables to be used as predictors
of whether students teach are 1) gender; 2) job factors;
3) high school grades; 4) satisfaction with teacher
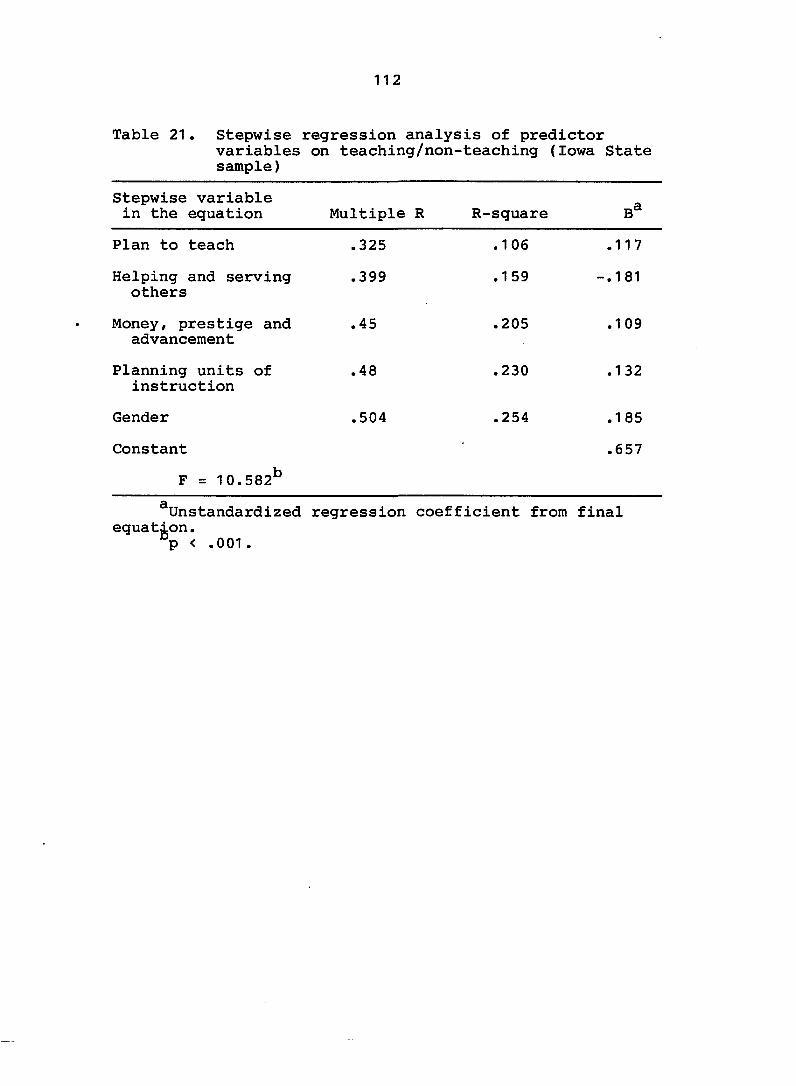
1 1 2
Table 21. Stepwise variables sample)
regression analysis of predictor on teaching/non-teaching (Iowa State
Stepwise variable in the equation Multiple R R-square
Plan to teach .325 .106 .117
Helping and serving others
.399 .159 .1 81
Money, prestige and advancement
.45 .205 .109
Planning units of instruction
CO
.230 .132
Gender .504 .254 .185
Constant .657
F = 10.582^
^Unstandard!zed regress!on coefficient from final equation.
p < .001.

1 1 3
preparation areas; 5) plans to teach; 6) the decision to
"do it over"; and 7) adequacy of the teacher preparation
program. The dependent variables will be teaching/non-
teaching. The results of the multiple regression equation
for the national sample of teacher education students, in
Table 22, contained 18 predictor variables. Together,
these variables explained 54% of the variance in deciding
to become a teacher. The unstandardized regression
coefficients revealed that desire to teach in the public
schools was positively related to the decision to teach.
Thirty-four percent of the variance was explained by this
variable alone.
The next largest contributor to the variance was
needing more training accounting for an additional 4% of
the variance. Three percent of the variance was explained
by learning teaching skills in school and college grades.
The additional variables that entered the equation but
predicted less than 2% of the variance to the equation
were: 1) satisfaction with instruction; 2) satisfaction
with teacher ability; 3) job different from training; 4)
importance of being a community leader; 5) courses not
helpful; 6) student sex; 7) satisfaction with intellectual
growth; 8) importance of success in work; 9) importance
of lots of money; 10) activity; 11) applied the training.
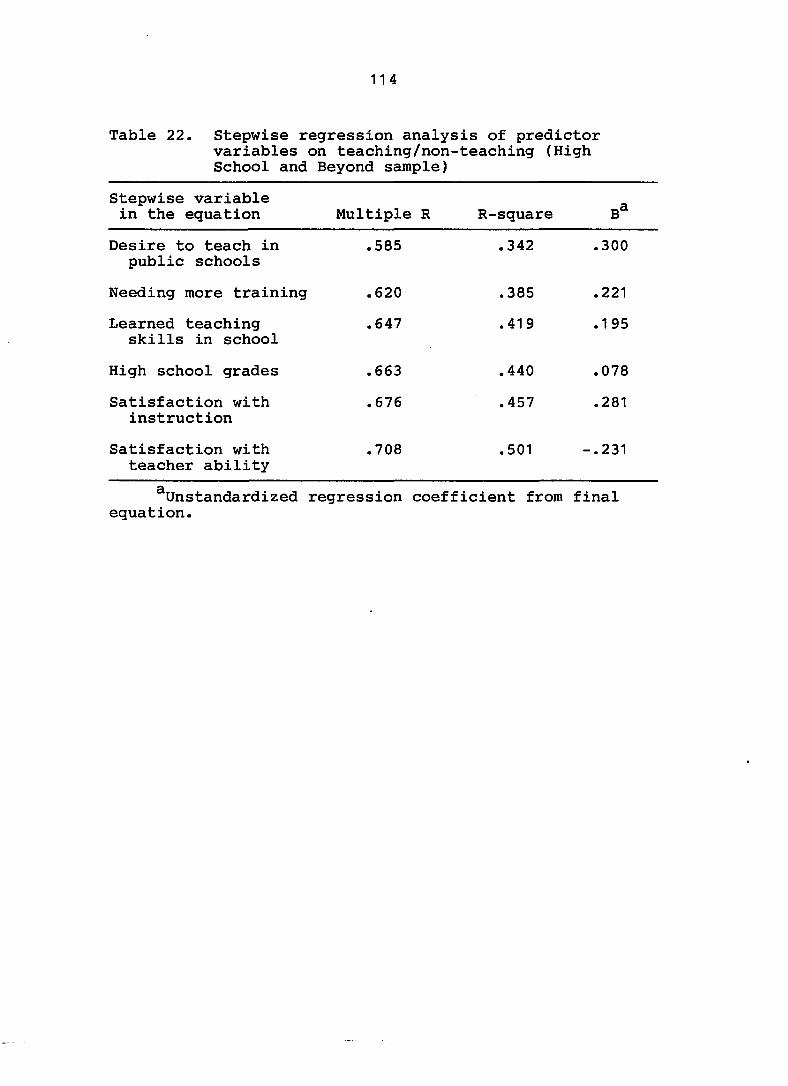
1 1 4
Table 22. Stepwise regression analysis of predictor variables on teaching/non-teaching (High School and Beyond sample)
Stepwise variable in the equation Multiple R R-square B*
Desire to teach in public schools
.585 .342 .300
Needing more training .620 .385 .221
Learned teaching skills in school
.647 .419 .195
High school grades .663 .440 .078
Satisfaction with instruction
.676 .457 .281
Satisfaction with teacher ability
.708 .501 -.231
^Unstandardized regression coefficient from final equation.

1 1 5
12); satisfaction with development of work skills; 13)
satisfaction with course curriculum; and 14) importance
of correcting inequities. The F-value of 2,347.08 was
significant beyond the .001 level. Hypothesis 8 was,
therefore, rejected.

1 1 6
CHAPTER V
Summary, Discussion and Recommendation
for Future Research
The purpose of this study was to conduct a causal
comparative investigation of some of the differences in
selected background factors between students who prepare
to become teachers and teach the first year after
graduation and those who prepare to become teachers but
do not enter the teaching profession after graduation.
The data for this study were obtained from two
sources. The first source was the Research Institute for
Studies in Education (RISE) which conducts longitudinal
studies of prospective teacher education students,
beginning when they were sophomores in college. The total
population for this sample was 829. The analyses for this
study included the 211 respondents who answered all
questionnaires. The second data source was High School
and Beyond, a national data base containing background
Information on students when they were sophomores in high
school (1980). The data base is a national sample of
3,000,000 students, however, 70,057 of these students were
found to be teacher eduation majors who answered all the
questionnaires. The results of the High School and Beyond

1 1 7
data represent a national sample and can, therefore, be
generalized to the national population of students who
major in teacher education.
The two data bases were similar in content in some
aspects and were only slightly comparable in others,
therefore, the results of each sample should be compared
to each other with caution.
Research has shown that teacher education students
who go into teaching are less capable academically than
students who did not teach (Chapman & Hutcheson, 1982;
Vance & Schlecty, 1982; Weaver, 1981). The secondary
results of this study did not support that observation.
Although the academic measurement instrument for the Iowa
State (high school rank) and High School and Beyond (high
school grades) samples were different, students, males and
females, who prepared to be teachers had higher mean
academic scores than those teachers who did not. The mean
differences for the Iowa State sample were not found to
be significant while the mean differences in the national
High School and Beyond sample were found to be highly
significant. The females, as a group, differed from the
males. The females had higher mean academic indicators
than the males across the two data sets.
1 1 8
Keith (1980) used factor analysis to determine the
importance of eleven job characteristics in choosing the
present occupation of 487 men and women. The resulting
factors were a) opportunity for advancement; b)
opportunity to use special abilities and aptitudes; c)
opportunity to be creative; d) opportunity to exercise
leadership; and e) opportunity to help and serve others.
It was found that women did not emphasize extrinsic
rewards and potential to exercise leadership. Men were
found to value opportunity to use special abilities,
advancement, and self-expression.
The results of this investigation do not entirely
support this observation. The females in the Iowa State
sample rated helping and serving others higher than the
males, as was found in the Keith (1980) study. The
females in this study, however, rated leadership higher
than the males, on the average. The males in this study
responded similarly by placing more importance on money
and prestige and the opportunity to use special abilities.
The only mean difference found to be significant was
"helping and serving others." The teachers had a similar
pattern to their responses by rating leadership and
responsibility and helping and serving others higher than
non-teachers. Consistent with research, the non-teachers

1 1 9
rated the opportunity to use special abilities and money
and prestige higher than teachers. The difference between
the teachers and non-teachers on the importance of helping
and serving others was significant.
All job factors in the High School and Beyond survey
were found to be highly significant. The results of the
rating of the importance of money, nationally, was similar
to the results of the Iowa State sample. Males rated this
factor significantly higher than females and non-teachers
rated it higher than teachers. Nationally, females rate
the importance of steady work lower than the males. The
males rate the importance of correcting inequities and
leisure time lower than females. These results are
consistent with research (Chapman, 1984; and Roberson et
al., 1983) on teacher attrition.
Additional results of the national sample indicate
that teachers rate success in work, lots of money, steady
work and correcting inequities lower in importance than
non-teachers. This is consistent with the research on
teacher attrition. The variables for measuring the
differences in job orientation were different but the
results of the two analyses do support the research
contending that males and females and teachers and
non-teachers have differing orientations within each
group.

120
Spady (1971) postulated that there is a positive
relationship between participation in extracurricular
activities and educational attainment. This study sought
to expand this observation by attempting to distinguish
teachers from non-teachers. The Iowa State sample
provided no basis for hypothesizing that the decision to
teach is dependent upon this participation. •The High
School and Beyond results, however, revealed that the two
were not mutually exclusive in the population. More
teachers than expected participated in high school
extracurricular activities, nationally.
The decision to choose teaching again if you could
re-evaluate your career choice has been examined in
relation to teacher preparation. More teachers than in
the past have been responding negatively to choosing a
teaching career again (Harris and Harris, 1988; National
Education Association, 1981). The present study examines
this question in relation to the teaching levels taught.
The results of the Iowa State sample showed that more
elementary teachers were willing to do it over; more
elementary students in the national sample were not
willing to do it over. Fewer secondary teachers than
expected said they would choose teaching again in the Iowa

121
State sample; more secondary teachers in the national
sample indicated they would choose teaching again. The
findings were different for the two samples.
The results of the regression analysis for the Iowa
State sample resulted in five variables. Plans to teach,
helping and serving others, money, prestige, and
advancement, planning units of instruction and gender were
significant predictor variables in decisions to teach the
first year. The R-square shows that plans to teach was
the first variable to be entered into the analysis. This
variable accounted for 10% of the variance, followed by
helping and serving others; which accounted for an
additional 5% of the total variance. Planning and
delivering instruction was entered and added 3% to the
variance. Gender was the final variable entered, adding
2% of the variance. The total equation predicted 25% of
the variance in the decision to become a teacher.
Positive predictors of entering teaching were 1)
pians to teach; 2) helping and serving others, 3) planning
units of instruction; and 4) gender. A negative
predictor of entering teaching was money, prestige, and
advancement. This was consistent with research and the
initial analysis of the job factors by teaching and
non-teaching.

122
For the national sample, results of the multiple
regression revealed that the following variables were
positively related to teaching after graduation: 1) plans
to teach, which accounted, for 34 percent of the variance;
2) learning teaching skills in school; 3) college grades;
4) satisfaction with instruction; 5) satisfaction with
teacher training; 6) application of teacher education
training; 7) development of work skills; and 8)
satisfaction with the course curriculum.
The variables found to be negatively related to
teaching the first year were: 1) dissatisfaction with
abilities of teachers; 2) the lack of desire to become a
community leader; 3) lack of satisfaction with
intellectual growth, 4) money; 5) participation in high
school extracurricular activities; and 6) need to correct
inequities. The findings regarding plans to teach and
money were similar for the Iowa State sample.
The results indicated that grades positively
influenced the decision to teach. This is in contrast to
the findings of researchers who found that the academic
ability of students who teach is lower than those who do
not teach (Vance & Schlecty, 1982; Chapman & Hutcheson,
1982).
123
The relationship between participation in high school
extracurricular activities and teaching was supportive of
the initial data analyses using High School and Beyond
data. These activities were found to be related to
teaching. Participation in high school extracurricular
activities was not found to be a significant contributor
in either multiple regression equation. The discrepancy
in these findings may be due to the fact that the Iowa
State sample was too small and the High School and Beyond
sample was too large. Each type of sample tends to
increase the probability of making either a Type I or Type
II error. The small sample may have failed to reveal
large differences in participation, while the large sample
may be revealing minute significant differences.
This study was not designed to be purely satistical
but to examine the differences and similarities of teacher
education students across two samples. The data show that
nationally, today's teacher education students who teach
do not appear to be less academically capable, as measured
by college grades, than teacher education students who do
not teach. This result is similar to the findings from
Iowa State that indicated no significant difference
between the high school ranking of students who teach and
those who do not. The fact that no significant difference
124
in high school rank and teaching or not teaching indicates
that, for Iowa State teacher education students, the more
academically capable students do appear to be attracted
to teaching. Nationally, the results seem to indicate
a similar trend, with those students with higher grades
being more likely to teach, while those students with
lower grades are less likely to teach.
Recommendations for Further Research
The findings of this study uncovers the need to do
additional research in this area. The seemingly
inconsistent finding that refutes academic deterioration
among teacher education students should be examined by
incorporating more than one indicator of academic
achievement. The large discrepancy in the sample sizes
for the present study suggests that a larger Iowa State
sample could be used for comparison with the national
sample.
This study investigated the characteristics of
teacher education students only. Future studies could
make comparisons among students who do not major in
teacher education, those students who major in teacher
education but do not teach, and those students who major
in teacher education and go on to teach.

125
The results of the role of participation In high
school extracurricular activities were Inconsistent
between samples, therefore, college participation could
be Incorporated with the high school activities and
compared among students.
Finally, this study predicted entry Into teaching by
multiple regression analysis. This study could be
replicated using discriminant analysis and path analysis.
When different measures reveal the same results, only then
can generalizations be made.
126
BIBLIOGRAPHY
A nation at risk. The imperative for educational reform. (1983). A report to the Nation and the Secretary of Education. Washington, DC: United States Department of Education, National Commission on Excellence in Education.
Akin, J. N. (1982). Teacher supply and demand 1982; A report based upon an opinion survey of teacher placement officers. Madison, WI: Association for School, College, and University Staffing.
Aldrich. H. (1983). Teacher shortage; Likely to get worse before it gets better. Education Week 4(6), 1, 12.
Astin, A. W. (1982). The American freshman: National norms for fall 1981. Washington, D.C.: American Council on Education and University of California at Los Angeles.
Astin, A., Green, K. C., Korn, W. S., & Schalit, M. (1987). The American freshman; National norms for 1987. Los Angeles, CA: ACE/Cooperative Institutional Research Program.
Bartol, K. (1974). Sex difference in job orientation: A reexamination. Proceedings of National Academy of Management, Seattle, WA.
Berryman, S. (1985). Knowledge about the nation's teachers. Washington, D.C.; Ford Foundation.
Bloland, P. A., & Selby, T. J. (1980). Factors associated with career change among secondary school teachers; A review of the literature. Educational Research Quarterly, 5(3), 13-24.
Boatwright, M. A. (1988). A factor analysis approach to job characteristic items of Iowa State teacher education students and graduates using selected variables. Unpublished doctoral dissertation, Iowa State University, Ames, lA.
127
Borg, G. W. & Gall, M. (1983). Educational Research: An Introduction (4th ed.) New York; Longman, Inc.
Brayfield, A., Wells, R., & Strate, R. (1957). Interrelationships among measures of job satisfaction and general satisfaction. Journal of Applied Psychology, il, 201-205.
Brenner, 0. C., & Tomkiewicz, J. (1979). Job orientation of males and females: Are sex differences declining? Personnel Psychology, 32, 741-750.
Carnegie Forum.on Education and the Economy. (1986). A nation prepared: Teachers for the 21st century. New York: The Report of the Task Force on Teaching as a Profession.
Centers, R., & Bugental, D. E. (19866). Intrinsic and extrinsic job motivations among different segments of the working population. Journal of Applied Psychology, 50, 193-197.
Chapman, D. W. (1983). A model of the influences on teacher retention. Journal of Teacher Education, 35(5), 43-49.
Chapman, D. W. (1984). Teacher retention: The test of a model. American Educational Research Journal, 21(3), 645-658.
Chapman, D. W., & Green, M. S. (1986). Teacher retention: A further examination. Journal of Education Research, 79, 273-279.
Chapman, D. W., & Hutcheson, S. M. (1982). Attrition from teaching careers: A discriminant analysis. American Educational Research Journal, 19(1), 93-105.
Charters, W. W. (1970). Some factors affecting teacher survival in school districts. American Educational Research Journal, 2(1)' 1-27.
Coleman, J. (1961). The adolescent society. Glencoe: The Free Press.
Darling-Hammond, L. (1984). Beyond the commission reports: The coming crisis in teaching. Santa Monica; The Rand Corporation.

128
Darling-Hammond, L.; Wise, A. E.; & Pease, S. R. (1983). Teacher evaluation in the organizational context: A review of the literature. Review of Educational Research, ̂ (3), 285-328.
Dewey, J. (1904). The relation of theory to practice in education. Bloomington, IL: Public School Publishing Company, 13.
Dravland, V., & Greene, M. (1980). Development of a model for the evaluation of teacher education programs. Paper presented at the Annual Meeting of the American Educational Research Association, Boston, MA.
Edismore, R. M. (1963, November). High school athletes are brighter. School Activities, 35, 75-77.
Elliot, P., & Steinkellner, L. (1979). Weaknesses in inservice and preservice teacher training. The Clearinghouse, 52, 421-423.
Feistritzer, C. E. (1983). The condition of teaching: A state by state analysis. New York: The Carnegie Foundation for the Advancement of Teaching.
Feistritzer, C. E. (1986). Teacher crisis, myth or reality? Washington, D.C.: National Center for Education Information.
Feldvebel, A. (1968). Teacher satisfaction. The Clearing House, 63, 44-48.
Gaede, 0. F. (1978). Reality shock: A problem among first-year teachers. The Clearing House, 51, 405-409.
Gallup, A. (1984). The Gallup Poll of teachers' attitudes toward the public schools. Phi Delta Kappan, 66_(2), 97-107.
Gallup, G. H. (1984). The 16th Annual Gallup Poll of the public's attitudes toward the public schools. Phi Delta Kappan, ̂ (1 ), 23-38.
Graybeal, W. S. (1981). Teacher supply and demand in public schools, 1980-81. Washington, D.C.: National Education Association.
129
Guthrie, J. W., & Zusman, A. (1982). Teacher supply and demand in mathematics and science. Phi Delta Kappan, 64(1), 28-32.
Hafner, A. L., & Owings, J. A. (1988). Careers in teaching; Following members of the high school class of 1972 in and out of teaching. Paper presented at the annual meeting of the American Educational Research Association, New Orleans, LA.
Hanks, M. P., & Eckland, B. K. (1976, October). Athletics and social participation in the educational attainment process. Sociology of Education, 49# 271-294.
Harris, S., & Harris, L. (1988). The teacher's almanac 1987-88. New York: Facts on File Publications.
Haubrich, V. F. (1960). The motive of prospective teachers. Journal of Teacher Education, 11, 3381-3386.
Herzberg, F.; Mausner, B.; Peterson, R. O.; & Capwell, D. F. (1957). Job attitudes; Review of research and opinion. Pittsburgh, PA: Psychological Service of Pittsburgh.
Heyns, B. (1972). Down the up staircase: Sex roles, professionalization, and the status of teachers. In S. Anderson (Ed.), Sex Differences and Discrimination in Education. New York: Charles Jones..
Heyns, B. (1988). Educational defectors; A first look at teacher attrition in the NLS-72. Educational Researcher, V7(3), 24-32.
Higher Education Research Institute. (1966). The American freshman: National norms for fall 1986. Los Angeles, CA: Graduate School of Education, University of California.
Hilton, T. L.; Levin, H.; & Leidderman, G. F. (1957). Studies of teacher behavior. Journal of Experimental Education, 26, 81-91.
Holland, J. I. (1973). Making vocational choices: A theory of careers. Englewood Cliffs, NJ: Prentice Hall.

130
Hyman, H. H., & Wright, C. R. (1971, April). Trends in voluntary association memberships of American adults: Replication based on secondary analysis of national sample surveys. American Sociological Review, 36, 191-206.
Keith, P. M. (1980). Sex, occupation, year of graduation and perceptions of job factors. Journal of Employment Counseling, 1_7(3), 180-187.
Keith, P. M.; Warren R. D.; & Dilts, H. E. (1983). Sex, career plans, and preferences for job factors. Urban Education, 1_8(3), 361-375.
Kerckhoff, A. C. (1974). Ambition and attainment; A study of four samples of American boys. The Arnold and Caroline Rose Monograph Series in Sociology. Washington, D.C.: American Sociological Association.
Krumboltz, J. D. (1979). A social learning theory of career decision making. In A. M. Mitchel, G. B. Jones, and J. L. Krumboltz (eds.) Social learning theory and career decision making. Rhode Island; Carroll Press.
Langway, L. (1980). The superwomen squeeze. Newsweek, 95(2), 72-79.
Lindsay, P. (1984). High school size, participation in activities, and young adult social participation: Some enduring effects of schooling. Educational Evaluation and Policy Analysis, 6/1), 73-83.
Lortie, D. C. (1975). Schoolteacher; A sociological study. Chicago; University of Chicago Press.
Manhardt, P. J. (1972). Job orientation of male and female college graduates in business. Personnel Psychology, 25, 361-368.
Mark, J., & Anderson, B. (1978). Teacher survival rates: A current look. American Educational Research Journal, 15, 379-383.
Mark, J., & Anderson, B. (1985). Teacher survival rates in St. Louis, 1969-1982. American Educational Research Journal, 22, 413-421.

131
Mason, W. (1966). The beginning teacher; Status and career orientations. Washington, D.C.: U.S. Office of Education.
Moracco, J. C., D'Arienzo, R. V.; & Danford, D. (1983). Comparison of perceived occupational stress between teachers who are contented and discontented in their career choices. The Vocational Guidance Quarterly, i, 44-51.
Mueller, D. (1976). Where the graduates are. St. Louis: Harris Teachers College. (ERIC ED 115 631).
Murnane, R. J., & Olsen, R. J. (1987). How long teachers stay in teaching depends on salaries and opportunity costs. Unpublished paper.
Murray, F. B. (1986). Goals of the reform of teacher education: An executive summary of the Holmes Group report. Phi Delta Kappan, ̂ (1), 28-31.
Musemeche, R., & Adams, S. (1978). The coming teacher shortage. Phi Delta Kappan, ̂ (1 0), 691-693.
National Center for Education Statistics. (1983). National longitudinal study: Base year (1972) through fourth follow-up (1979). Data File Users Manual. Vol. I-III, including Appendices A through P. Washington, D.C.; Author.
National Education Association. (1981). Proiections of education statistics to 1988-89. Washington, D.C.: National Center for Education Statistics.
National Education Association. (1980). Estimates of school statistics, 1979-80. Washington, D.C.: Author.
National Education Association. (1982). Teacher Supply and demand in public schools. Washington, DC: Author.
Norusis, M. J. (1987). SPSS Guide to Data Analysis. Chicago, Illinois: SPSS Inc.
Otto, L. B. (1976). Extracurricular activities in the educational attainment process. Rural Sociology, 40, 162-176.

132
Otto, L. B., & Alwin, D. F. (1977, April). Athletics, aspirations, and attainments. Sociology of Education, 42, 102-113.
Page, J.; Page, F.; & Million, S. (1983, April). Teacher education curricula; Perceptions of first-year teachers. Paper presented at the annual meeting of the American Educational Research Association, Montreal, Canada. (ERIC ED 229 364).
Pavalko, R. H. (1970). Recruitment to teaching: Patterns of selection and retention. Sociology of Education, 340-355.
Pelavin, S. H.; Reisner, E. R.; & Hendrickson, G. (1984). Analysis of the national availability of mathematics and science teachers. Washington, D.C.: Education Analysis Center for Educational Quality and Equality.
Peng, S. S. (1982). Education attracts fewer academically high achieving young women. National Center for Education Statistics Bulletin 82-249b.
Pleck, J., & Sawyer, J. (1974). Men and masculinity. Englewood Cliffs, NJ: Prentice Hall.
Plisko, v., & Stern, J. (1985). The condition of education, 1985-1986. Washington, D.C.: Center for Education Statistics.
Redesigning America's schools; The public speaks. (1986). A report of a survey by Louis Harris and Associates for the Carnegie Forum on Education and the Economy. New York; Carnegie Forum on Education and the Economy.
Rehberg, R. A. (1969, Spring). Behavioral and attitudinal consequences of high school , interscholastic sports; A speculative consideration. Adolescence, 69-88.
Rehberg, R. A., & Schafer, W. E. (1968). Participation in interscholastic athletics and college expectations. American Journal of Sociology, 73, 732-740.

133
Roberson, S. D.; Keith, T. Z.; & Page, E. B. (1983). Now who aspires to teach? Educational Researcher, 12(6), 13-21.
Rosenberg, M. (1957). Occupations and values. New York: Random House.
Ryan, K.; Applegate, J.; Flora, V.; Johnston, J.; Lasley, T.; Mager, G.; & Newman, K. (1979). "My teacher education program...": First year teachers reflect and react. Peabody Journal of Education, 56, 267-271.
Salzillo, F., & Van Fleet, A. (1977). Student teaching and teacher education: A sociological model for change. Journal of Teacher Education, 2^(1), 27-31.
Sardis, W. E., & Stronkhorst, L. H. (1984). Causal modelling in nonexperimental research. Amsterdam, Netherlands: Sociometric Research Foundation.
Schafer, W. E., & Armer, M. J. (1968, November). Athletes are not inferior students. Transaction, 5, 21-26 , 61-62 .
Schalock, D. (1979). Research on teacher selection. Review of Research on Education, 7_, 364-417.
Schlechty, P. C., & Vance, V. S. (1981). Do academically able teachers leave education? The North Carolina case. Phi Delta Kappan, ̂ (2), 106-112.
Schlecty, P. C., & Vance, V. S. (1982). Recruitment, selection and retention: The shape of the teaching force. Washington, D.C.: National Institute of Education.
Sebring, P. (1987). The national longitudinal study of the high school class of 1972 (NLS-72) fifth follow-up (1986) teaching supplement. Data File Users Manual. Chicago: National Opinion Research Center.
Singer, S. L., & Stefflre, B. (1954). Sex differences in job value and desires. Personnel and Guidance Journal, 32, 483-584.

134
Snyder, D. E. (1969). A longitudinal analysis of the relationship between high school student values, social participation, and educational-occupational achievement. Sociology of Education, 42, 261-270.
Spady, W. G. (1970). Lament for the letterman; Effects of peer status and extracurricular activities on goals and achievement. American Journal of Sociology, 75, 680-702.
Spady, W. G. (1971). Status, achievement, and motivation in the American high school. School Review, 79, 379-403.
Spreitzer, E., & Pugh, M. (1973, Spring). Inter-scholastic athletics and educational expectations. Sociology of Education, 46, 171-182.
Status of the American public school teacher. (1981). Washington, D.C.: National Education Association.
Stein, J. D. & Williams, M. F. (Eds.). (1986). The condition of education, 1986-1987. Washington, D.C.: Center for Education Statistics.
Super, D. E. (1980). A life-span, life-space approach to career development. Journal of Vocational Behavior, 16, 282-298.
Super, D. E., & Hall, D. J. (1978). Career Development: Exploration and planning. Annual Review of Psychology, 29, 333-372.
Sweeney, J. C. (1987). Development and testing of a longitudinal model designed to examine the factors that influence the career paths of Iowa State University teacher education graduates. Unpublished doctoral dissertation, Iowa State University, Ames, lA.
Testimony to subcommittee on HUD-independent agencies of the House Appropriations Committee of the U.S. House of Representatives in regard to 1983 appropriations for the science education component of the National Science Foundation. Washington, D.C.: Government Printing Office. (18 May 1982).

135
U.S. Department of Education. Center for Education Statistics. (1983, 1984, 1986, 1987). Digest of Education Statistics. Washington, D.C.; U.S. Department of Education.
Tucker, M., & Mandel, D. (1986). The Carnegie Report --A call for redesigning the schools. Phi Delta Kappan, ̂ (1 ), 24-27.
Tyack, D. B., & Strober, M. H. (1981). Jobs and gender: A history of the structuring of educational employment by sex. In P. A. Schmuck, Charters, W. W., & Carlson, R. O. (Eds.). Educational policy and management; Sex differentials. New York; Academic Press.
Vance, V., & Schlechty, P. (1982). The distribution of academic ability in the teaching force; Policy implications. Phi Delta Kappan, 64, 22-27.
Veenman, S. (1984). Perceived problems of beginning teachers. Review of Educational Research, 54(2), 143-178.
Villeme, M. G., & Hall, B. (1983-84, Winter). Higher ability graduates; Do they enter and plan to stay in teaching? The Teacher Education, 1_9(3), 11-15.
Wangberg, E. G.; Metzger, D. J.; & Levitov, J. E. (1982). Working conditions and career options lead to female elementary teacher job dissatisfaction. Journal of Teacher Education, 3^(5), 37-40.
Warren, R. D., Dilts, H. E., Thompson, A. D., & Blaustein, M. H. (1982). Follow-up study of teacher education graduates. General frequency report. Report No. 2 in the Iowa State University teacher evaluation project. Iowa State University, Ames, lA. (ERIC ED 270-436).
Weaver, W. T. (1978). Educators in supply and demand: Effects on quality. School Review, ̂ (4), 522-593.
Weaver, W. T. (1979). In search of quality: The need for talent in teaching. Phi Delta Kappan, £1_(1), 29-32.

136
Weaver, W. T. (1981). Demography, quality and decline; The challenge for education in the eighties. Policy for the education of educators; Issues and implications. Washington, D.C.; American Association of Colleges for Teacher Education.
Weaver. W. T. (1984). Solving the problem of teacher quality, part 1. Phi Delta Kappan, £6(2), 108-115.
Wood, K. E. (1978). What motivates students to teach? Journal of Teacher Education, 29, 48-50.
137
ACKNOWLEDGMENTS
I would like to thank my major professors, Drs. Larry
Ebbers and Daniel Robinson, for their support and guidance
during the writing of this thesis.
I also would like to extend a special thanks to Dr.
Richard Warren for his kindness, understanding and
guidance during this process.
Thanks are extended to my other committee members,
Drs. George Kizer and Sally Williams. Also I would like
to thank Dr. Judy Osborne, Dr. Michael Nettles, and others
who have helped and supported the writing of this thesis.
A special thanks goes to my mother, sisters and
brothers, who allowed me to call when I was really
stressed out.
I owe all of this to my typist, Jean Strong, who was
so patient and kind throughout the writing of this thesis.
I'd like to dedicate this thesis to the memory of my
father and brother.
Finally, thanks to God who made this all possible.

138
APPENDIX
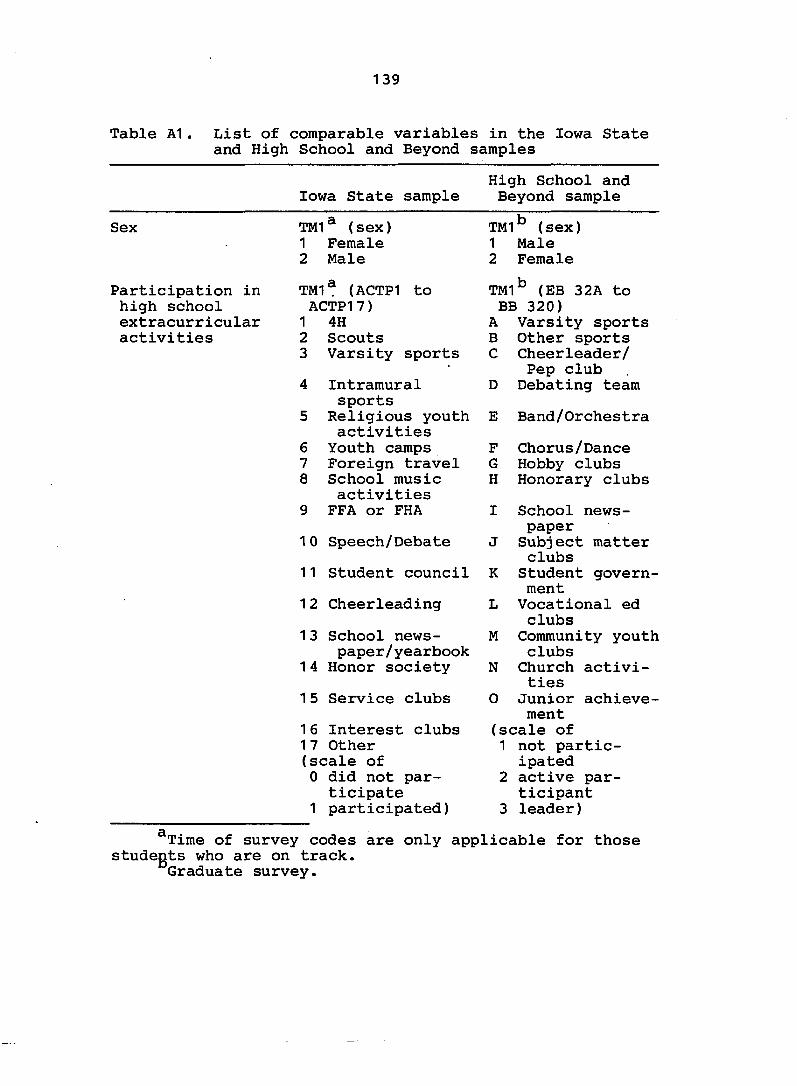
139
Table Al. List of comparable variables in the Iowa State and High School and Beyond samples
Iowa State sample High School and Beyond sample
Sex
Participation in high school extracurricular activities
TM1 (sex) 1 Female 2 Male
TMI^ (ACTP1 to ACTP17)
1 4H 2 Scouts 3 Varsity sports
4 Intramural sports
5 Religious youth activities
6 Youth camps 7 Foreign travel 8 School music
activities 9 FFA or FHA
10 Speech/Debate
11 Student council
12 Cheerleading
13 School newspaper/yearbook
14 Honor society
15 Service clubs
16 Interest clubs 17 Other (scale of 0 did not participate
1 participated)
TMl" (sex) 1 Male 2 Female
TMI^ (EB 32A to BB 320) A Varsity sports B Other sports C Cheerleader/
Pep club D Debating team
E Band/Orchestra
F Chorus/Dance G Hobby clubs H Honorary clubs
I School newspaper
J Subject matter clubs
K Student government
L Vocational ed clubs
M Community youth clubs
N Church activities
O Junior achievement
(scale of 1 not participated
2 active participant
3 leader)
Time of survey codes are only applicable for those students who are on track.
Graduate survey.
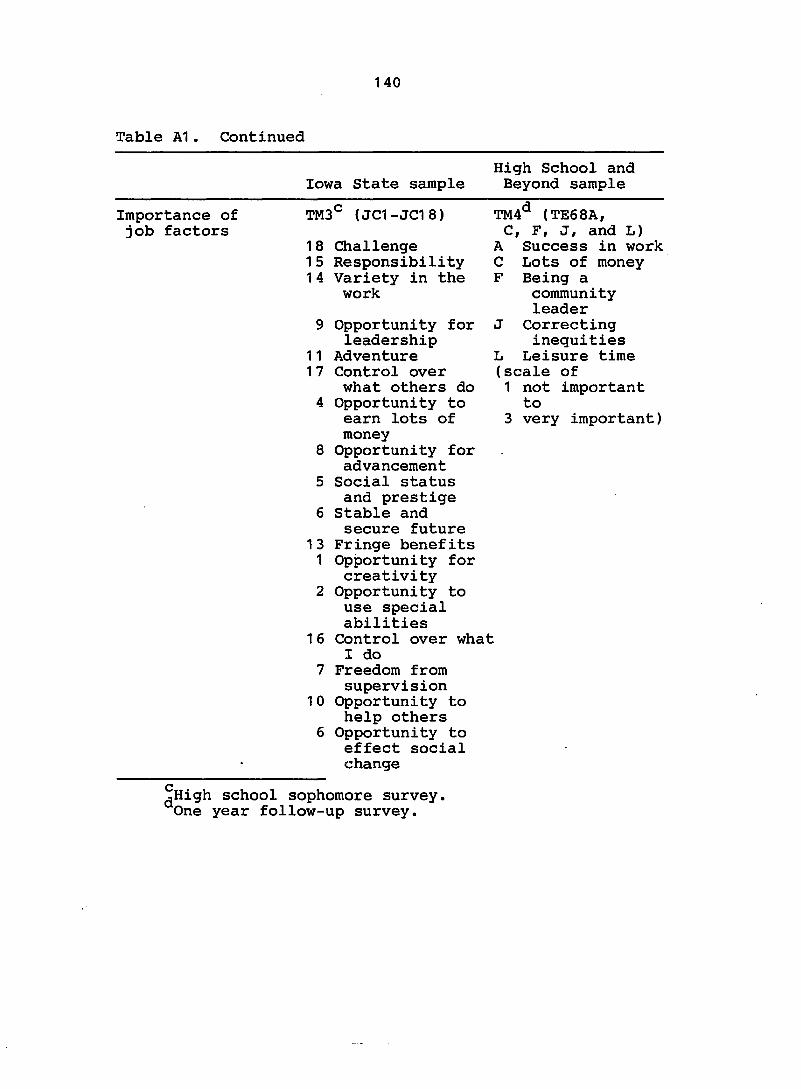
140
Table Al. Continued
Iowa State sample High School and Beyond sample
Importance of job factors
TM3 {JC1-JC18)
18 Challenge 15 Responsibility 14 Variety in the
work
9 Opportunity for leadership
11 Adventure 17 Control over
what others do 4 Opportunity to
earn lots of money
8 Opportunity for advancement
5 Social status and prestige
6 Stable and secure future
13 Fringe benefits 1 Opportunity for
creativity 2 Opportunity to
use special abilities
16 Control over what I do
7 Freedom from supervision
10 Opportunity to help others
6 Opportunity to effect social change
TM4" (TE68A, C , F , J, and L) A Success in work C Lots of money F Being a
community leader
J Correcting inequities
L Leisure time (scale of 1 not important to
3 very important)
jHigh school sophomore survey, One year follow-up survey.

141
Table Al. Continued
Iowa State sample High School and Beyond sample
Long-range career plans
Satisfaction with preparation
Do over again
3 Opportunity to work with people
(scale of 1 very unimportant to 5 very important)
Tm3 (FYLRP) 1 2 Teaching Education-not teaching Outside education Other Undecided
TM3 (QT) 0 Poor 10 Very high
TM3° (DOA) 1 No 2 Undecided 3 Yes
TM4 (TE15A) 1 Clerical 2 Craftsman
1 0
11 1 2
13 1 4 1 5 1 6 1 7
Farmer/Farm manager Housewife Laborer Manager/ admin. Military Operative Professional nurse/engineer Professional dentist/ physician Proprietor Protective Service Sales Teacher Service Technical Not working
TM4 (TE12BA) 1 Yes 2 No
TM4^ (TE12BI) 1 Yes 2 No

142
Table Al. Continued
Iowa State sample High School and Beyond sample
Plan to teach
Grade point average
Teach/non-teaching 1 year
Adequacy of teacher preparation
TM2 (EMPNY) 1 Obtained teach
ing position 2 Seeking teach
ing position 3 Seeking non-
teaching position
4 Graduate study 5 Other
TM3^ 1-85
TM3 (CEM)
1 Teaching 2 Non-teaching 3 Both
TM3° (0AI1 to NNNAI70)
0AI1 Planning instruction 0AI3 Knowledge of resources 0AI31 Evaluating instruction OAI33 Individualizing instruction
TM3 (SE54F) 1 Definitely
2 Probably
3 Probably not
4 Definitely not 5 Don't know
TM3^ (SE23) 1 Mostly A 2 Half A/Half B 3 Mostly B 4 Half B/Half C 5 Mostly C 6 Half C/Half D 7 Mostly D 8 Below D
TM4^ (TE8A) Recoded to Jobone 1 Teaching 2 Non-teaching
TM4" (TE28A, C, D,I, J) A Teacher ability
C Work skills
D Intellectual growth
I Course curriculum
^Education 204 Survey. College Senior Survey.

143
Table Al. Continued
Iowa State sample High School and Beyond sample
Satisfaction with preparation
OAI35 Selecting/ organizing material 0A137 Variety of teaching techniques OAI39 Understanding teacher's role
0A141 Skill working with parent 0A143 Skill working with teachers 0AI5 Maintaining student interest 0AI7 Managing behavior problems OAI27 Relating class to students
0AI11 Dealing with learning problems
0AI13 Assessing learning problems
0AI15 Skills developing tests 0AI17 Interpreting tests OAI25 Evaluating student achievement
(Scale of 5 very adequate to 1 very inadequate
J Quality of instruction
(scale of 1 very satisfied to
2 very dissatisfied)
TM4 TE12BA Applied training TE12BB Need more training TE12BC Job different/train TE12BF Courses not helpful

144
Table Al . Continued
High School and Iowa State sample Beyond sample
TE12BG Learned in school TE12BI School wise choice

145
Table A2. The mean ratings of preparation adequacy areas of students who teach and those who do not by gender (Iowa State sample)
Content area Teaching Non-M N M
•teaching N
F-ratio
Planning and ' delivering instruction
Males Females
3.29 24 3.94 3,88 109 3.94
16 42 10.717*
Student motivation and discipline
Males Females
2.48 24 2.97 3.32 109 3.11
16 42 8.425**
Monitoring student achievement
Males Females
3.22 24 3.92 3.69 109 3.55
16 42 1 .531
Assessing and dealing with learning problems
Males Females
2.48 24 2.97 3.32 109 3.11
16 42 12.298*
Interpersonal relationships
Males Females
2.49 24 2.47 3.51 109 3.48
16 42 7.453*
*p < .05. **p < .001.