
A comparative analysis of seven world leading …...A comparative analysis of seven world leading...
13
1 June 2017 A comparative analysis of seven world leading biotech clusters English summary
Transcript of A comparative analysis of seven world leading …...A comparative analysis of seven world leading...

1
June 2017
A comparative analysis of seven world leading biotech clusters English summary
A comparative analysis of seven world leading biotech clusters
1
Content
1. Background and approach ......................... 2
1.1. Background ................................................. 2
1.2. Methodological approach ........................... 2
1.3. Contributors ................................................ 2
2. Performance ............................................. 3
2.1. Research production ................................... 3
2.2. Research quality .......................................... 4
2.3. Spinouts from public research .................... 5
2.4. Red biotech companies............................... 6
2.5. Venture investments .................................. 7
3. Framework conditions ............................... 8
3.1. Proof of concept ......................................... 8
3.2. Access to seed capital ................................. 8
3.3. Support schemes for R&D ........................... 9
3.4. Technology transfer at the universities ...... 9
3.5. Ecosystems ................................................ 10
Appendix ....................................................... 12
Definitions and delimitations .............................. 12
Data sources ........................................................ 12

A comparative analysis of seven world leading biotech clusters
2
1. Background and approach
1.1. Background
The biotech sector is unique in many ways. First,
many biotechnological inventions de rive
from research at universities and university hospi-
tals, and the biotech sector depends on highly
qualified employees educated in strong research
environments.
Second, drug development is extremely expensive
and the risk of failure is high. Private investors are
unlikely to invest in the early phases of drug devel-
opment. Thus, public funds are often necessary to
test ideas, proof of concepts and early innova-
tions. However, a solid investment environment
that can carry start-ups from idea to market is es-
sential to establish a diverse and strong biotech
cluster.
Third, it is important to create a strong and cohe-
rent ecosystem for biotech innovation with the
right mix of entrepreneurs, pharma companies,
skilled technology transfer offices, entrepreneurial
universities, advisors and mentors, investors and
incubators.
This short paper presents key findings from a
benchmarking analysis of seven world leading bio-
tech clusters – Basel, Boston, Cambridge, Copen-
hagen, Munich, Paris, and Stockholm-Uppsala.
The focus is on so-called “red biotech” (see defini-
tion in appendix).
The paper is a summary in English of a comprehen-
sive study that IRIS Group completed and pub-
lished early 2017. The aim was to compare the Co-
penhagen biotech sector with other leading bio-
tech clusters – focusing on the entire value chain
from research to growth in existing biotech com-
panies.
The entire analysis is available in Danish at
www.irisgroup.dk.
1.2. Methodological approach
First, we did a bibliometric analysis in which we
compared research production and quality. More-
over, we developed a model to identify and bench-
mark research strengths.
Second, we gathered key information from univer-
sities, hospitals, and cluster organisations in each
region. We asked for hard data such as number of
spinouts, but also detailed information on the
functioning of the regional biotech ecosystem,
framework conditions etc. We also used the BCIQ
BioCentury Online Intelligence database to collect
data on venture investments in the regions. Valid
data was not available for all variables in all re-
gions. For specifications on our methodological ap-
proach, please see appendix.
Finally, we studied national and regional frame-
work conditions relevant to the biotech sector in
each region/country, such as proof of concept
grants, seed investments, resources at technology
transfer offices and national funding opportuni-
ties.
1.3. Contributors
The analysis was financed by a group of stakehold-
ers including the Novo Nordisk Foundation, the
Danish Growth Fund, the Danish Ministry of Busi-
ness and Growth, the Danish Ministry for Higher
Education and Science, the Capital Region of Den-
mark, and the City of Copenhagen.

A comparative analysis of seven world leading biotech clusters
3
2. Performance
2.1. Research production
To make a solid comparison of biotech clusters, a
first step is to compare the production of biotech
related university research in each region.
In Scopus – the world’s largest database for inter-
national research articles – all biotech related sub-
fields were identified and included in a biblio-
metric analysis1.
Figure 2.1. Number of biotech publications per
million population (country based)
Source: IRIS Group based on Scival/Scopus.
1 In Scopus research production is divided into 334 scientific subfields. 95 subfields were identified as biotech related.
Based on the bibliometric analysis, figure 2.1-2.3
present three different indicators of biotech re-
search performance. Figure 2.1 shows the number
of biotech research articles at national level rela-
tive to population size in the seven countries. The
smaller countries (Switzerland, Denmark, and
Sweden) have the largest production of biotech
publications per million population.
In figure 2.2, the number of biotech research arti-
cles at regional level is calculated relative to popu-
lation size in the seven regions, which paints a dif-
ferent picture with Cambridge in top.
Figure 2.2. Number of biotech publications per
million population (region based)
Source: IRIS Group based on Scival/Scopus.
If we look at the total number of articles produced
(not taking population size into consideration),
Boston and Paris are the leading regions. See fig-
ure 2.3.
In absolute numbers Cambridge, Copenhagen,
Munich, and Stockholm-Uppsala have approx. the
same scientific foundation to create new biotech
companies – in quantitative terms.
Figure 2.3. Total number of biotech publications
(region based)
Source: IRIS Group based on Scival/Scopus.
- 5,000 10,000 15,000 20,000
Sweden
France
Germany
Denmark
UK
USA
Switzerland
- 50,000 100,000 150,000
Stockholm-Uppsala
Paris
Munich
Copenhagen
Cambridge
Boston
Basel
- 25,000 50,000 75,000
Stockholm-Uppsala
Paris
Munich
Copenhagen
Cambridge
Boston
Basel

A comparative analysis of seven world leading biotech clusters
4
2.2. Research quality
The quality of the research is, of course, also im-
portant for the development of a strong biotech
cluster. Top quality, groundbreaking research is
likely to pave the way for new drugs, technologies
etc. Research quality also affects talents – the bet-
ter research quality in a region, the better students
and PhDs are available for biotech companies.
Bibliometrically, research quality can be measured
in several ways. We have used different indicators
all showing a similar picture: Boston and Cam-
bridge are the two regions with the best biotech-
nological research.
Table 2.1 compares the regions on one of the key
indicators, namely the amount of scientific papers
that globally are among the 10 per cent most cited
within their field of biotech research. Underscored
numbers in bold indicate top-2 for each research
area.
Cambridge is ranked in top-2 in all six research ar-
eas, while Boston is in top-2 in five areas. Basel
shares top-2 with Cambridge when it comes to re-
search in pharmacology, toxicology, and pharma-
ceutics.
The four remaining regions are not ranked in top-
2. However, the total scores for Copenhagen and
Munich are a bit higher than for Paris and Stock-
holm-Uppsala.
To get an overall picture of research strongholds,
we conducted a model combining measures for re-
search production and quality. The model enabled
us to estimate strongholds in each region among
the 95 biotech-related subfields that we identified
in Scopus.
The number of strongholds depends on the criteria
applied. We did four different calculations with di-
verse threshold values to determine which re-
search areas to include as regional strongholds.
In table 2.2 on the next page, the numbers of
strongholds are listed for each of the seven re-
gions.

A comparative analysis of seven world leading biotech clusters
5
Table 2.2. Calculated number of scientific strong-
holds
Region Number of strongholds
(min-max value)
Basel 0-3
Boston 17-48
Cambridge 8-19
Copenhagen 8-16
Munich 1-3
Paris 1-5
Stockholm-Uppsala 2-9
Source: IRIS Group based on Scival/Scopus
Boston has between 17-48 scientific strongholds
(depending on the criteria applied) followed by
Cambridge and Copenhagen.
It should be emphasised that the model includes
both quantitative and qualitative measures to cal-
culate the number of scientific strongholds in each
region.
2 We define spinouts as: a registered company that has re-ceived initial funding for the development of a new prod-uct or service based on technology developed at a univer-sity or a university hospital.
2.3. Spinouts from public research
Figure 2.4 shows the total number of red biotech
spinouts from universities and university hospi-
tals2 between 2009-2015.
In Boston, universities and hospitals spun out al-
most twice as many red biotech companies as in
Paris, which is the second largest producer of spin-
outs.
The number of spinouts in Stockholm-Uppsala is
estimated. In Sweden, researchers own IPR from
their research, and are thus not obligated to make
use of technology transfer offices (TTOs) at the
universities when creating new companies. Only
data on companies created in collaboration with
TTOs was available. The estimated number of spin-
outs in Stockholm-Uppsala is based on interviews
with key stakeholders in the region3.
Unfortunately, data on spinouts in Cambridge was
not available.
3 The TTOs in Stockholm-Uppsala reported 19 spinouts between 2009-2015. The key stakeholders, whom we interviewed, estimated that only about half of the spinouts in the region were created in collaboration
Figure 2.4. Number of red biotech spinouts from
universities and university hospitals (2009-2015)
Source: Data is collected from universities and university hos-
pitals in each region. *The number for Stockholm-Uppsala is
estimated.
If we look at spinout production relative to re-
search production, a different picture appears.
In figure 2.5 on the next page, the number of red
biotech spinouts is shown relative to published sci-
entific articles within biotech research.
with a TTO. Thus, we have doubled the number of spinouts reported by the TTOs.
N/A
0 20 40 60 80 100 120
Stockholm-Uppsala*
Paris
Munich
Copenhagen
Cambridge
Boston
Basel

A comparative analysis of seven world leading biotech clusters
6
Figure 2.5. Number of red biotech spinouts per
100,000 scientific article (2009-2015)
Source: IRIS Group based on Scival/Scopus. Spinout data is col-
lected from universities and university hospitals in each re-
gion. *The number for Stockholm-Uppsala is estimated.
The figure reveals that Basel spun out most com-
panies from 2009-2015 compared to research out-
put, followed by Boston. As shown in section 2.2,
the research quality in these regions is high making
up favourable conditions for spinouts.
2.4. Red biotech companies
To get a picture of the size of the biotech clusters,
table 2.3 provides the number of red biotech com-
panies in five of the seven regions, including
growth in numbers from 2005-2015.
The total number of red biotech companies has in-
creased in all regions. The most prominent in-
crease has taken place in Stockholm-Uppsala. Two
of Sweden’s largest life science companies Phar-
macia and Astra merged with international part-
ners in the late 1990’s and moved their activities
out of the region. New biotech
companies were established
and many of the lost life sci-
ence jobs were recreated.
Thus, many red biotech com-
panies in Stockholm-Uppsala
are relatively young and small.
Table 2.4 shows the number of
full time employees (FTE) in
red biotech companies and bio
pharma, respectively. Bio
pharma includes the big
N/A
0 20 40 60 80
Stockholm-Uppsala*
Paris
Munich
Copenhagen
Cambridge
Boston
Basel

A comparative analysis of seven world leading biotech clusters
7
pharma companies like GlaxoSmithKline, Roche,
and Novo Nordisk. The last column shows the pop-
ulation size in each region.
The two largest biotech clusters are found in Bos-
ton and Cambridge. The high number of compa-
nies and spinouts in Boston are, of course, a main
explanation for the many biotech jobs in the re-
gion, but the biotech cluster in Boston is also older
than the other clusters making it home for bigger
and more market-ready companies.
Copenhagen and Munich are characterised by a
strong position within big pharma.
2.5. Venture investments
The number and size of venture investments in
each region are indicators of the amount of growth
companies and their market potentials.
Figure 2.6 shows number of early and later stage
venture investments registered in the interna-
tional database Pitchbook between 2006-2015.
Boston attracted most venture investments fol-
lowed by Cambridge. Counting both early and later
stage investments, Copenhagen attracted more
venture investments than Munich and Stockholm-
Uppsala.
Figure 2.6. Number of early and later stage ven-
ture investments in biotech companies (2006-
2015)
Source: IRIS Group and The Danish Growth Fund based on
Pitchbook.
Table 2.5 presents the 50 largest venture invest-
ments in European life science companies in two
periods of time, based on the international data-
base BioCentury.
The table shows that most of the investments was
placed in one of the six European countries in-
cluded in this analysis. Only 25 of 100 investments
were placed in other parts of Europe. When we
zoom in on regions, the table reveals that many in-
vestments are placed in companies located out-
side of the regional clusters (Denmark is the excep-
tion). The trend between the two periods of time
indicates that the six regions are getting stronger
as they attracted 12 of the 50 largest investments
in 2013-2016 compared to just five in 2009-2012.
On the regional level, life
science companies in Ba-
sel, Cambridge and Copen-
hagen attracted most of
the largest venture invest-
ments.
0 50 100 150
Stockholm-Uppsala
Munich
Copenhagen
Cambridge
Boston
Early Stage VC Later Stage VC

A comparative analysis of seven world leading biotech clusters
8
3. Framework conditions
Outstanding research in itself does not alone make
an outstanding biotech cluster. A number of criti-
cal framework conditions are essential to foster
birth of, and growth in, biotech companies.
First, a vibrant biotech cluster is characterised by a
sufficient influx of capital from investors to place
both seed and later stage investments in biotech
companies. Second, government support (through
grants and tax credits) for R&D is important for
many companies. Finally, well-functioning tech-
nology transfer units and a vibrant ecosystem that
is able to connect new companies with established
companies, investors, and specialised service pro-
viders are important.
In the benchmarking analysis, we compared a
number of these factors in the seven regions.
In this summary, we present some of the findings.
3.1. Proof of concept
Proof of concept (PoC) funding is grants dedicated
to initial tests of technological or commercial per-
spectives for new research outcomes. Researchers
can apply for PoC grants, and the grants are nor-
mally managed by the universities.
For biotech research in particular, PoC grants are
an important first step towards seed investments.
We have compared availability and size of PoC
funding at the largest life science university in each
of the following regions: Boston, Cambridge, Co-
penhagen, Paris, and Stockholm-Uppsala.
At Massachusetts Institute of Technology (MIT) in
Boston, the Deshpande Center runs the so-called
“Ignition Grants” and “Innovation Grants”. “Igni-
tion Grants” are an initial €45,000 grant provided
for the financing of preliminary technological
tests. If the early tests look promising, an “Innova-
tion Grants” of up to €138,000 can be granted as
follow-up funding.
University of Cambridge and Uppsala University
provide a two-phased PoC funding as well. At Uni-
versity of Cambridge, researchers can apply for an
initial PoC grant called “Path Finder” up to €22,500
and following PoC funding up to €56,000. In Upp-
sala, researchers have access to the government
funded “Early Verification Programme” that pro-
vides PoC grants up to €30,000. In some cases, the
cluster organisation in Uppsala (Uppsala Bio) pro-
vides a €200,000 grant for promising project under
the so-called “Bio-X program”.
At the University of Copenhagen, PoC grants are
not divided into an early and later stage of PoC.
Grants up to €67,000 can be awarded for all kinds
of PoC-projects.
In France, PoC grants are managed by the SATT
units covering all government funding to early
stage business development (see section 3.2). PoC
grants up to €500,000 are available.
In addition to PoC grants managed by the univer-
sities, several private funds provide grants for
early verification of new research. In Denmark and
Sweden, Novo Seeds provides “Pre-seed Grants”
and “Explorative Pre-seed Grants” to researchers
at universities and university hospitals in Scandina-
via.
In Cambridge, the collaborative venture “Apollo
Therapeutics” provides translational funding and
drug discovery expertise for therapeutics. The ven-
ture is established between three global pharma-
ceutical companies (AstraZeneca, GlaxoSmithKline
and Johnson & Johnson) and the TTOs at Imperial
College London, University College London, and
University of Cambridge.
PoC grants are available in all regions included in
this analysis. However, budgets available for PoC
differs with the most favourable conditions in
France/Paris where researchers can receive up to
€500,000 in PoC funding.
3.2. Access to seed capital
Access to seed capital is important in order to fi-
nance new development projects (including pre-
clinical studies) in new and young biotech compa-
nies.
The analysis shows that early stage investments
are structured in different ways in the seven re-
gions regarding the balance between: 1) soft
money; 2) loans; 3) seed investors; 4) venture

A comparative analysis of seven world leading biotech clusters
9
funds that also place investments in new biotech
companies.
The different structures make it difficult to com-
pare the regions on meaningful indicators. But
conditions in Paris and Boston seem to be the most
favourable among the regions analysed in this
study.
In Paris, the Societes d'Acceleration du Transfert
de Technologies (SATT) units cover all early stage
investments including PoC grants (as noted above)
and seed investments. 14 SATT units are spread
across France– with an annual budget of €85 mil-
lion. Besides that, the government has established
a dedicated biotech fund (InnoBio) eligible to in-
vest up to €10 million in biotech start-ups making
Paris a biotech region with favourable conditions
for start-ups.
Boston is home to many venture funds that also
place early investments during the seed phase.
A number of seed investors exist in all regions –
typically investing up to Euro 1 mio. in the initial
phase.
3.3. Support schemes for R&D
In most countries, government funded schemes
exist to fuel research and development (R&D) in
small and medium sized enterprises (SMEs). Some
4 Small Business Innovation and Research (SBIR) Small Business Technology Transfer (STTR).
schemes are intended to increase research pro-
jects within the companies, other schemes aim to
foster cooperation between businesses and re-
search institutions.
In France, biotech companies have access to the
most attractive support schemes.
In France, young research based SMEs can obtain
up to €2 million to internal R&D and up to €3 mil-
lion to partnerships including a research institu-
tion. The national fund BPI France has a total an-
nual budget of €1 billion.
In USA, the SBIR and STTR programmes4 congres-
sionally require eligible governmental agencies to
set aside a percentage of their extramural budget
so that domestic small businesses can engage in
R&D-projects based on university research. SMEs
can obtain up to €1 million per project. The Na-
tional Institutes of Health (NIH) set aside €720 mil-
lion every year to R&D in life science companies.
Government funded schemes in the other coun-
tries included in this analysis provide somewhat
smaller grants, and the annual budgets relative to
GDP are smaller than in France.
3.4. Technology transfer at the universities
Qualified technology transfer offices (TTOs) at uni-
versities and university hospitals are an important
part of a well-functioning biotech ecosystem. TTOs
manage a broad scope of tasks including scouting
for new research with commercial potential, sup-
porting entrepreneurship, developing networks to
the life science industry, and the management of
patents and license agreements.
Thus, resources available to TTOs are critical to the
amount of completed licence agreements and
spinout creation. Qualified TTO-officers are, of
course, essential. Officers should both have a deep
insight in science and have commercial experi-
ence. Regarding biotechnological commercialisa-
tion, officers specialised in life science are im-
portant.
We have compared TTO resources available at the
main universities and university hospitals in Bos-
ton, Cambridge, Copenhagen, Munich and Stock-
holm-Uppsala. Our analysis shows that TTOs at the
selected universities in Boston, Cambridge, and
Munich have most personnel employed when the
size of research production is taken into consider-
ation.
The ratio between officers dedicated to life sci-
ence and other scientific fields of research are
about the same across the TTOs included in this
analysis. A bit more than half of the TTO officers in
Copenhagen are dedicated to life science, while it
is a bit less at TTOs in the other regions.

A comparative analysis of seven world leading biotech clusters
10
Initiatives to accelerate spinout production exists
in all the regions.
In Boston, The Deshpande Center operates a wide
range of supportive mechanisms including educa-
tion in entrepreneurship and PoC funding (see sec-
tion 3.1). Furthermore, “Lab Central” offers all
types of relevant equipment and lab facilities to
test research inventions in a commercial environ-
ment.
Cambridge is home to “Judge Business School”
where research and education in entrepreneur-
ship have taken place since 1990. Also,
“ideaSpace” at University of Cambridge provides
office space and resources for anyone looking to
start a new company in Cambridge.
3.5. Ecosystems
Companies established in strong ecosystems are
more likely to grow than companies established in
areas without a strong support infrastructure. Eco-
systems for biotech innovation cannot be bench-
marked easily, since they rest on different cul-
tures, connections and in terms of public versus
private leaderships. The framework conditions an-
alysed above are all important parts of the ecosys-
tem. However, the way that framework conditions
and stakeholders work together is also important
for the development of a cluster. Thus, it is im-
portant to consider the cohesion of the entire eco-
system.
A healthy biotech ecosystem can be characterised
as a place where:
1. Researchers and start-ups have easy ac-
cess to capital, advisors, incubator,
knowledge, and talents.
2. Ideas and people flows easily between
companies and sectors.
3. Entrepreneurs are met with the right ad-
vises and matched with the right inves-
tors.
4. There is a flourishing culture of entrepre-
neurship in the research environments.
Based on desk research and interviews with key
stakeholders in Cambridge, Copenhagen, Munich,
and Stockholm-Uppsala, our analysis furthermore,
points to the following conditions essential for a
thriving biotech ecosystem:
• A strong cluster organisation able to con-
nect and lead the cluster, or other mecha-
nisms fostering cohesion and cluster de-
velopment.
• Availability and quality of physical facilities
for stakeholders to meet.
• Physical concentration of the cluster, es-
pecially proximity between large and new
companies.
• A strong network of advisors and mentors
capable of guiding start-ups and match
them with relevant investors.
• Big pharma engagement in the cluster.
The analysis shows that these points are essential
to foster new biotech start-ups, and to stimulate
growth in the existing life science sector.
All regions included in this analysis have a well-de-
veloped ecosystem. However, none of the ecosys-
tems are similar in the way the points above are
balanced.
Munich has an influential cluster organisation
called “BioM” with 15 employees dedicated to cre-
ate and enhance networks for researchers and
companies in the life science sector, and to help
and guide emerging companies. The cluster organ-
isations “One Nucleus” in Cambridge and “Uppsala
BIO” in Uppsala are also characterised as agenda
setting and unifying organisations. Both have ap-
prox. 10 employees.
In Copenhagen, smaller cluster organisations exist.
Moreover, the universities coordinate a network
(“Copenhagen Spinout”) with the industry and the
investment environment that cooperates on is-
sues related to fostering spinouts in the life sci-
ence area (including a mentor network).
The physical concentration of the clusters in Cam-
bridge and Munich is another positive factor. In
Munich, 80 life science companies employ 50 per
cent of the cluster, and are located no longer than
A comparative analysis of seven world leading biotech clusters
11
2 km from “Campus Grosshadern” that houses
Ludwig Maximillian University (LMU), an innova-
tion park, incubators, and the Max Planch Insti-
tutes for Biochemistry and Neurobiology. Tech-
nical University of Munich (TUM) and the hospital
are located close too.
Big pharma companies’ engagement in the cluster
is particularly dedicated in Cambridge, Copenha-
gen and Basel. Cambridge is home to global enter-
prises like Astra Zeneca, Pfizer, Roche, Upjohn, and
Eli Lilly. In Denmark, Novo Nordisk, Lundbeck, and
Leo Pharma are leading and have established pri-
vate funds (Novo Seeds and Lundbeck Emerge) to
support young life science companies.
A comparative analysis of seven world leading biotech clusters
12
Appendix
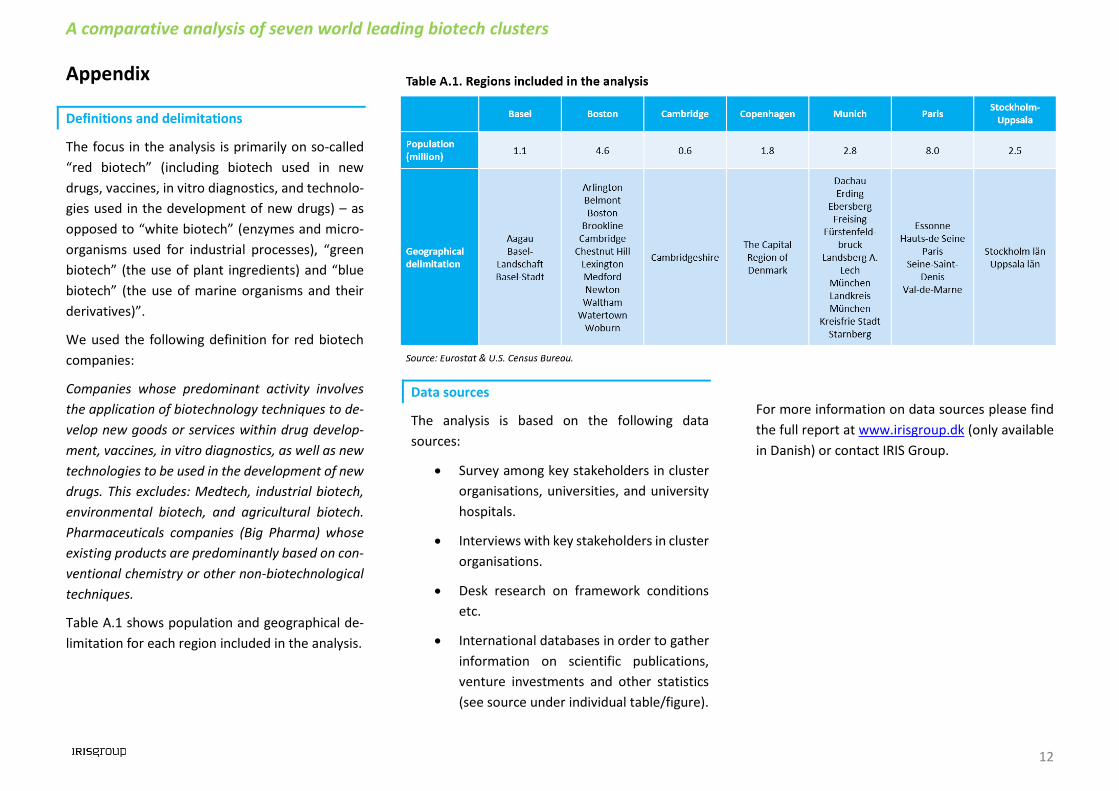
Definitions and delimitations
The focus in the analysis is primarily on so-called
“red biotech” (including biotech used in new
drugs, vaccines, in vitro diagnostics, and technolo-
gies used in the development of new drugs) – as
opposed to “white biotech” (enzymes and micro-
organisms used for industrial processes), “green
biotech” (the use of plant ingredients) and “blue
biotech” (the use of marine organisms and their
derivatives)”.
We used the following definition for red biotech
companies:
Companies whose predominant activity involves
the application of biotechnology techniques to de-
velop new goods or services within drug develop-
ment, vaccines, in vitro diagnostics, as well as new
technologies to be used in the development of new
drugs. This excludes: Medtech, industrial biotech,
environmental biotech, and agricultural biotech.
Pharmaceuticals companies (Big Pharma) whose
existing products are predominantly based on con-
ventional chemistry or other non-biotechnological
techniques.
Table A.1 shows population and geographical de-
limitation for each region included in the analysis.
Data sources
The analysis is based on the following data
sources:
• Survey among key stakeholders in cluster
organisations, universities, and university
hospitals.
• Interviews with key stakeholders in cluster
organisations.
• Desk research on framework conditions
etc.
• International databases in order to gather
information on scientific publications,
venture investments and other statistics
(see source under individual table/figure).
For more information on data sources please find
the full report at www.irisgroup.dk (only available
in Danish) or contact IRIS Group.