A Closer Look at the Iraqi Banking Sector - Iraq Business...
64
Sansar Capital Management, LLC, 2013, Copyright © All Rights Reserved 1 May/June 2013 A Closer Look at the Iraqi Banking Sector 16 RAFFLES QUAY #40-02A HONG LEONG BUILDING SINGAPORE 048581 TEL: +65 6372 7580 http://www.sansarcapital.com To request additional information, please contact: [email protected]
Transcript of A Closer Look at the Iraqi Banking Sector - Iraq Business...

Sansar Capital Management, LLC, 2013, Copyright © All Rights Reserved
1
May/June 2013
A Closer Look at the Iraqi Banking Sector
16 RAFFLES QUAY #40-02A HONG LEONG BUILDING SINGAPORE 048581 TEL: +65 6372 7580 http://www.sansarcapital.com To request additional information, please contact: [email protected]

Sansar Capital Management, LLC, 2013, Copyright © All Rights Reserved
2
Table of Contents Executive Summary 3
Methodology 4
Iraq: A Quick Glance 5
Banking Sector Overview 6
The State Owned Banks 8
How Iraqi Banks Make Money 10
Risk Analysis: CAMEL 16
ROE: Adjusting the reported numbers 19
Capital Issuance: What comes next? 22
Valuation: The Traditional Approach 24
Laws and Regulations 26
Company Overview: North Bank (BNOR) 27
Bank of Baghdad (BBOB) 34
Iraqi Middle East Bank Investment Bank (BIME) 41
Kurdistan International Bank (BKUI) 50
Dar Es Salaam Investment Bank (BDSI) 55
Important Disclosures: 60
Sources: 62

Sansar Capital Management, LLC, 2013, Copyright © All Rights Reserved
3
Executive Summary
The Iraqi banking sector is poised for significant earnings and asset growth over the next decade driven by a strong macro environment, increasing credit penetration and an improving security situation. The IMF forecasts Iraqi GDP to grow at a rate of 9.0% in 2013 on the back of 8.4% growth in 2012 placing Iraq solidly in the category of one of the fastest growing economies in the world.1 The IEA in its World Energy Outlook report stated that Iraq is expected to contribute 45% of the global incremental oil supply over this decade.2 As a result, the IEA central scenario forecast predicts Iraq GDP to grow 151% between 2011 to 2020.2
Rising credit penetration is likely to further fuel banking sector growth. According to the World Bank, Iraqi domestic credit to GDP stood at a mere 9 percent of GDP at the end of 2011 as compared to a 55 percent of GDP average for the Middle East North Africa (MENA) region.3
Domestic credit to GDP grew at a clip of 89 percent CAGR between 2009-2011. 3
Buoyed by strong economic growth and rising credit penetration, the 5 largest private Iraqi banks grew aggregate net income by 207% between 2010-2012. Dilution driven by increases in equity capital resulted in earnings-per-share growth to be lower but still impressive with aggregate EPS growth of 111% from 2010-2012.4
The growth in GDP and banking sector earnings go hand-in-hand with the improving security situation. As violence declined by over 80% between 2006-2012, Iraqis in many parts of the country enjoyed relative calm and stability.5 In 2012, large U.S. cities like Chicago and New Orleans had higher violence related deaths per capita when compared to Iraq. 6 That is not to say all areas in Iraq are safe. Violence in Iraq remains highly localized with 91% of the violence related deaths occurring in 7 of the 18 provinces and 2/3 of the violence being inflicted on 1/3 of the population.5 The remaining 11 provinces, including the southern oil-rich provinces, have had relative security and stability.
While the mix of an improving macro environment and security situation offer attractive investment ingredients, many challenges remain for those interested in participating through public markets. Iraq continues to be ranked as one of the most difficult places to conduct business and is often ranked high on corruption indices. 7 Corporate governance at most publicly traded companies is poor and regulatory oversight weak; anecdotal examples of management teams serving their own self-interest at the expense of other stakeholders remain abundant. In such an environment, investors are cautioned to carry out extensive due-diligence including having on the ground presence in Iraq.

Sansar Capital Management, LLC, 2013, Copyright © All Rights Reserved
4
Methodology
In this paper we examine the Iraqi private bank sector through the lens of the five largest private banks by deposits. These banks in order are North Bank (BNOR), Bank of Baghdad (BBOB), Iraqi Middle East Investment Bank (BIME), Kurdistan International Bank (BKUI) and Dar Es Salaam Investment Bank (BDSI).
We note that Kurdistan International Bank is an Islamic bank and as such we have excluded it from most charts as we do not believe the numbers for Kurdistan International Bank are comparable on an apples-to-apples basis with the other four banks.
We also note that we have used the latest available data wherever possible. Hence while some charts and tables will have data from 2012 others will go back to 2010. This inconsistency in dates was inevitable given a lack of more updated data in many cases.
We also note that Investment Funds advised by Sansar Capital may hold positions in banks or their competitors discussed herein. Readers should therefore beware of potential conflicts and also refer to the Important Disclaimers section of this paper.
Acknowledgments
This report would not have been possible without the input and support of many of our friends and colleagues. In particular we want to thank Wassim Al Jzrawy at Karmal Brokerage who was tremendously helpful in providing keen insights into individual Iraqi companies and facilitating access to information that has been used throughout this report. Taimur Baig at Deutsche Bank provided us with valuable input on macro-economic drivers and their impact on the overall economy. Finally, Timothy Moe at Goldman Sachs provided critical eyes to our analysis and assumptions.
This report is prepared and published by Sansar Capital Asia Pte. Ltd. and Sansar Capital Management, LLC (together, “Sansar Capital”), an investment adviser advising clients with diversified global holdings, for informational and educational purposes only and is not intended to be relied upon as a forecast or as investment advice. Nothing contained herein constitutes a solicitation, recommendation, endorsement, or offer by Sansar Capital to buy, sell or hold any securities or other financial instruments or to pursue any investment style or strategy. All investments involve risks which are not discussed here. The opinions expressed herein are as of the date of the publication and may change as subsequent conditions vary. Therefore, Sansar Capital makes no representations that any information provided herein is accurate, current, or complete. Please refer to the important information disclosures and qualifications at the end of this material.

Sansar Capital Management, LLC, 2013, Copyright © All Rights Reserved
5
Iraq: A Quick Glance
Accelerating GDP Growth: The IMF forecasts Iraq’s GDP to grow by 9% in 2013 on the back of 8.4% growth in 2012. The forecast for the medium-term anticipates Iraqi GDP to grow at a CAGR of 8.3% through 2018 placing Iraq solidly in the category of one of the fastest growing economies in the world.1
Higher Oil Production: Underlying the economic growth forecast is a large increase in oil production. The IEA forecasts Iraq to provide 45% of the global incremental oil supply in this decade. In its central case, the IEA estimates that by the 2030s, Iraq will be the second-largest oil exporter in the world.2
Improving Security: Violence in Iraq has significantly declined over the last several years. In 2012, large US cities like New Orleans and Chicago had higher violence related deaths per capita when compared to Iraq. Violence in Iraq remains highly localized however with 91% of deaths occurring in 7 out of the 18 provinces. 5, 6
Corruption: Despite all the improvements in security and GDP, Iraq struggles with a high level of systemic corruption and is often ranked as one of the most corrupt countries in the world. 7
0.0%2.0%4.0%6.0%8.0%
10.0%
2006
2007
2008
2009
2010
2011
2012
2013
2014
2006
-10
2011
-18
Iraq Real GDP growth

Sansar Capital Management, LLC, 2013, Copyright © All Rights Reserved
6
Overview of the Banking Sector
Iraq remains one of the most under-banked countries in the Middle East North Africa (MENA) region and by some estimates over 80% of Iraqis do not have a bank account.8 Credit to GDP remains one of the lowest in the region and the world with domestic-credit to private sector at 9 percent of GDP as compared to a 55 percent of GDP average for the MENA region.9 As relative stability and calm have returned to Iraq, the commercial banks have seen a significant growth in their businesses. According to Central Bank of Iraq data, cash credit, such as loans and overdraft facilities, have grown at an impressive CAGR of 50% from 2006-2011.
Sources: World Bank9, Central Bank of Iraq10
Despite the impressive growth, Iraqi private banks will have to overcome some important challenges if they are to continue their growth at the impressive pace witnessed over the last five years. We believe some of those factors include: accessibility, an uneven playing field and trust.
I. Accessibility – Access to bank branches or ATM machines remains highly limited to the general Iraqi population. There are approximately 900 bank branches covering a population of 33 million Iraqis equating to just one branch serving 36 thousand individuals.10 ATM machines are also highly limited with World Bank data indicating that there is only one ATM machine for every 100,000 inhabitants.9 The MENA region has on average 32-times more ATM machines per inhabitant. 10 The true comparison is even starker when one takes into account that most ATM machines are not connected to the national switch and as such customers of one bank cannot access their funds from ATM machines of another bank. 8 There are two important developments on the horizon that we believe could significantly improve access. The first is the implementation of the National Switch and the second is the establishment of the Iraq Interoperable Mobile Payment System (IIMPS) - both with the help of the USAID’s Iraq Financial Development Project.
0%20%40%60%80%
100%120%140%160%
Mal
taIs
rael
Leba
non
Tuni
siaJo
rdan
Mor
occo
UAE
Kuw
aitSa
udi A
rabi
aQ
atar
Om
anEg
ypt
Alg
eria
Iraq
Yem
en
MENA Region 2011 Domestic credit to private sector (% of GDP)
-
5,000
10,000
15,000
20,000
25,000
2006
2007
2008
2009
2010
2011
Iraq cash-credit by commercial banks (IQD billion)

Sansar Capital Management, LLC, 2013, Copyright © All Rights Reserved
7
The National Switch would connect all the existing ATM machines, bank branches and point of sale terminals to one central communication network. This would allow customers of one bank to use the ATM network and branches of another bank.
The idea behind the Interoperable Mobile Payment System (IIMPS) is to leverage the strength of high cellular phone penetration rates to make banking easier. Customers wishing to make payments at retail stores would be able to transfer money from their bank account to the retailers simply by the use of phones. Furthermore, banks would assign certain retailers as agents where customers can go to deposit and/or withdraw money with confirmations sent straight to their phone. With mobile penetration rates hovering around 78%11, the successful implementation of this initiative would allow banks to skip the costly and time consuming process of building out a vast network of ATM machines. According to USAID8, the IIMPS will be operational by 2013; industry insiders, however, have told us that they believe usage of the technology is likely at least five years away.
II. Uneven playing field – State-owned banks maintain approximately 91% of the deposit and asset market share in addition to enjoying several perceived or actual benefits. Some of the important benefits include: a) prohibition of government agencies and state-owned enterprises from placing deposits with private banks, b) prohibition of payments to the government (taxes, etc.) by checks drawn on private banks, c) perceived implicit government guarantee on state-owned bank deposits, and d) a bigger branch network for state-owned banks as compared to the private banks.
III. Trust – We believe another important factor that has resulted in the low usage of banks has been a general mistrust of the banking system. This problem is further exasperated by the lack of any deposit insurance institutions that would guarantee customers their deposits back in the event of a bank failure. This problem was brought to the forefront recently with the widely publicized bankruptcy of Warka bank.
We believe that all of the above challenges can be overcome. A speedy resolution of these problems, however, will require both government and private sector efforts. In particular, we believe the private sector can help improve accessibility to branch networks and services while the government can help level the playing field between the state-owned and private sector banks. Finally, gaining the trust of the population would require efforts from both sides.

Sansar Capital Management, LLC, 2013, Copyright © All Rights Reserved
8
0
200
400
2010 2011 World BankEst. (2010)
Rafidain and Rasheed Bank Assets (IQD, trillion)
Rafidain Bank Rasheed Bank
91%
9%
2011 Asset market-share
State-owned Private-sector
67%
33%
2011 share of cash-credit to private sector
State-owned banks Private-sector banks
2011 share of cash-credit to central government and related entities
State-owned banks Private-sector banks
The State-owned Banks
There are seven state-owned banks in Iraq which together account for 91% and 89% of the banking sector assets and deposits, respectively.12 Of the seven state-owned banks, three banks account for the vast majority of all assets and deposits. Two of those banks, Rafidain Bank and Rasheed Bank, are a legacy of the old regime and sit on very large sums of losses. The third bank is the Trade Bank of Iraq (TBI) which was established to deal with trade related credit activities. Both Rafidain and Rasheed bank are currently undergoing restructuring by the Iraqi government with the help of The World Bank. The two banks sit on large sums of valuation losses on borrowing and lending activities that were structured under the previous regime when 1 USD was equivalent to 0.33 IQD as compared to the current official rate of 1 USD to 1,179 IQD. To put this in context, the World Bank estimated that in 2010, Rafidain Bank had 257 trillion IQD of valuation related losses on an asset base of 302 trillion IQD.13 The Iraqi government has been slow to recognize these losses. We, however, have seen some progress as total assets for the two state-owned banks declined by 68% from 2010 to 2011. 12 We believe there may still be room for a further write-down of those assets. In 2010, the World Bank estimated the fair market-value of the assets for the two banks at 39.4 trillion IQD as compared to the 103.9 trillion IQD reported in 2011.13 It is worth noting that even after the write-down, the state-banks still have significantly more assets than the private sector banks.
Source: The World Bank13, Central Bank of Iraq12 The state-owned banks play a less dominant role when it comes to private-sector lending. In 2011, the state-owned banks had a 67% share of cash-credit to the private-sector. Their share of cash-credit to government remained 100% as state-owned enterprises and government institutions can only borrow from state-owned banks.
Source: Central Bank of Iraq12
Sansar Capital Management, LLC, 2013, Copyright © All Rights Reserved
9
100%
0%2011 share of public sector deposits
(total deposits 26.2t)
State-owned banks Private-sector banks
63%
37%
2011 share of private sector deposits(total deposits IQD 15.6t)
State-owned banks Private-sector banks
Source: Central Bank of Iraq 12 Even before recognizing valuation related losses, Rafidain and Rasheed are significantly undercapitalized. As a result, the Iraqi authorities laid out a plan to recapitalize Rafidain banks with 400 billion IQD and Rasheed bank with 300 billion IQD.12 The plans for this recapitalization have been in place for several years now and the Ministry of Finance has been slow to implement this. We believe, even after this round of capital injection, the two banks will remain undercapitalized with a limited ability to compete, on a relative basis with private banks, in extending credit.(a)
Turning our attention to deposits, the state-owned banks control 89% of total deposits and 63% of private sector deposits. We believe much of this can be attributed to the uneven playing field between state and private sector banks. The state-owned banks enjoy implicit government guarantee on deposits and state-owned enterprises are required to maintain their deposits with state-owned banks.
Source: Central Bank of Iraq 12 The other state-owned bank of significance is the Trade bank of Iraq (TBI). The bank was established in 2004 to carry out trade financing activities as Rasheed and Rafidain banks were prohibited from participating in those activities. The operations of TBI are generally viewed as opaque and there is a general lack of information about the bank. For the remainder of this paper we will focus our attention on private Iraqi banks as the state-owned banks are not publicly traded and do not offer investors a way to participate in the macro growth story. Furthermore, given the limited lending capacity of the state-owned banks, we believe that, going forward, the private-sector banks will play an increasingly bigger role.
2011 (IQD, trillions) Total Assets
Cash-credit Deposits Equity
Rafidain Bank 86.1 8.9 26.4 0.19 Rasheed Bank 17.8 2.7 14.9 0.22 Trade Bank of Iraq 21.8 2.9 6.3 1.62 Other State-owned 5.6 2.1 2.2 0.27
Total State-owned Banks 131.3 16.6 49.8 2.3
Total Private Banks 12.5 3.8 5.9 3.5
Total 143.8 20.4 55.7 5.8
(a) With total 700b of equity capital the two banks could extend maximum credit of 5.6t IQD (700b x 8). In 2011 total credit for the two banks was 11.6t IQD or double the lending capacity available to the banks after the capital injection

Sansar Capital Management, LLC, 2013, Copyright © All Rights Reserved
10
How Iraqi Banks Make Money Iraqi banks generate the majority of their revenue and profits, from one of the following sources:
a. Trade-related activities b. Traditional lending activities c. Treasury and CBI deposits
Up until the year 2008, many banks earned the majority of their revenue from deposits with the central bank or through treasury holdings. Interest rates that hovered over 16% provided little incentive for banks to lend or carry out any of the traditional banking activities seen in other countries. As inflation was brought under control in 2009, interest rates began declining and at the end of 2012, the CBI prime rate stood at 6%.14 At the same time that rates declined, Iraqi banks were also required by the Central Bank of Iraq to raise equity capital (more on this later in the report). With low rates and large amounts of excess capital, banks looked at other venues for generating revenue including more lending activities.
For the year 2011, commissions driven by trade-related activities (wire transfers, letters of credit, FX spreads) accounted for a range of 28% to 83% of net revenues for the four largest ‘traditional’ banks. North Bank (BNOR) had the highest percentage contribution from these activities at 83% of net revenues while Dar-Es-Salaam Investment Bank (BDSI) had the lowest contribution at 28% of net revenues.
Traditional lending activities such as net interest income on loans became the second largest contributor of revenue with the four largest banks by deposits generating 13% to 49% of net revenues from these activities. A mirror image of the above, Dar Es Salaam Investment Bank (BDSI) had the highest contribution from net interest income at 49% of revenues while North Bank (BNOR) had the lowest with 13% of revenue.
Source: Company Reports15
0%10%20%30%40%50%60%70%80%90%
100%
BDSI BBOB BIME BNOR
2011 Breakdown of net revenue by source
Net Interest Income Trade-related Other
0%10%20%30%40%50%60%70%80%90%
100%
BDSI BBOB BNOR BIME
2011 Breakdown "trade-related" activities
FX spread Wire transfer commission LC/LG commission

Sansar Capital Management, LLC, 2013, Copyright © All Rights Reserved
11
050
100150200250300
Jan
10M
ar 1
0M
ay 1
0Ju
l 10
Sep
10N
ov 1
0Ja
n 11
Mar
11
May
11
Jul 1
1Se
p 11
Nov
11
Jan
12M
ar 1
2M
ay 1
2Ju
l 12
Sep
12N
ov 1
2Ja
n 13
Average daily auction volume (US$m)
Avg. Daily Auction volume (US$M)
1,100 1,120 1,140 1,160 1,180 1,200 1,220 1,240 1,260 1,280
Jan
08M
ay 0
8Se
p 08
Jan
09M
ay 0
9Se
p 09
Jan
10M
ay 1
0Se
p 10
Jan
11M
ay 1
1Se
p 11
Jan
12M
ay 1
2Se
p 12
Jan
13
IQD/USD exchange rate
Market Rate Official rate
It is worth noting that contribution from net interest income is likely understated for most banks as loans/deposit ratios tend to be low; while not all deposits are used for loan purposes, all the interest expense is netted out against interest income. In the case of Dar Es Salaam Investment Bank, the source for net interest income is treasury holdings rather than interest from traditional lending activities such as loans. 15
a. Trade-related activities
General business trading activities of importing and exporting goods generate revenue for Iraqi banks through a number of sources. These can be primarily broken down into two major buckets:
Commissions Income: Banks charge a commission to customers who are interested in making payments for goods they have imported. The payment can be in the form of a wire-transfer to the supplier or it could be in the form of a letter of credit:
a) Wire-transfer: Banks typically charge a flat fee per wire and/or a percentage based on the amount of wire transferred. At the time of this writing, Bank of Baghdad for example charged a fee of $10.00 or 0.1% of the transfer amount whichever is higher. Iraq Middle East Investment Bank on the other hand charged a $3 fee + 0.1-0.2% of the transfer amount.
b) Letter of credit: letter of credit (LC) transactions generate commissions and interest income on the amount of “credit” outstanding.
FX Spread: In addition to charging commissions on the fund transfer, banks make money on the currency spread between the IQD/Dollar rate they receive from the central bank and the rate they charge the customers. Most banks realize these gains through wire-transfer activities, but letter-of-credit activities also generate some of this spread revenue.
The Iraqi banks purchase the USD from the Central Bank at a fixed rate. This rate is the official exchange rate, currently at IQD 1,166, plus IQD 13 commission charged by the Central Bank for a total purchase price of IQD 1,179. The banks then turn-around and sell the currency at a profit. As we discuss in more detail later, Iraqi Central Bank regulations have vacillated between a market based approach and a regulated approach on the amount of FX spread that banks can earn on the transfers.
Source: Central Bank of Iraq16

Sansar Capital Management, LLC, 2013, Copyright © All Rights Reserved
12
As the chart above highlights, the spread between the official rate and market rate started to widen in 2011 and reached its peak in April 2012 at 1,263 IQD/USD. Many observers attributed this phenomenon to increased international isolation of Iran and Syria which resulted in increased outflow of U.S dollars from Iraq to neighboring countries. By some estimates from the Supreme Audit Board and later published by the Inspector General, over 80% of the dollar outflows from Iraq were for non-commercial reasons.17
According to the Central Bank of Iraq, the following banks were the largest participants of daily auctions in 2012 which is used by banks to purchase dollars for the purpose of wire-transfers. The five largest participating banks accounted for 34% of the total volume for the entire year.
Source: Central Bank of Iraq 18
In order to reign in the exchange rate, the Central Bank of Iraq under the leadership of Dr. Sinan Shabibi passed a number of rulings to curb the weakening of the dinar. Some of these policies were later viewed as misguided and it is believed that they ultimately resulted in the downfall of the Central Bank governor. Below are some polices that were passed at various points of 2012.
Instruction # 17 June 27, 2012
In an instruction from the Central Bank of Iraq in June 2012, the Central Bank set a daily limit on volume of dollars banks could purchase at the currency auctions. The daily limit for currency exchange from cash was set at $1.25m/week for each bank. The daily limit on currency used for wire transfers were set as follows:
• Group 1 (capital of IQD >150b) - $10m daily limit • Group 2 (capital of IQD 150b) - $8m daily limit • Group 3 (capital of IQD <150b) - $5m daily limit • Group 4 (branches of foreign banks) - $3m daily limit
The above policy was ineffective in strengthening the dinar and resulted in more of the FX business going to smaller banks as large banks reached their daily limits quickly. It also limited the amount of dollars available in the market and caused the dinar to start weakening again. As a result, the Central Bank was forced to come up with new instructions less than two weeks later.
Bank FX volume ($mm) % of total volume
Iraqi Middle East Investment Bank 3,761 8%
North Bank 3,560 8%
Irbil Bank 3,138 6%
United Bank 3,107 6%
Commercial Bank 2,726 6%

Sansar Capital Management, LLC, 2013, Copyright © All Rights Reserved
13
Instruction # 18 July 10, 2012
The Central Bank realized that daily caps set on previous instructions were too rigid and thus increased the daily limit for wire-transfers based on the schedule below. These instructions also increased the limit on cash transactions from $1.25m/week to $2.0m/week and set a cap/person of $5k. The CBI also noted that a cap of IQD 1,189 selling price limit set in a previous instruction was to be applied to both cash transactions as well as wire-transfers. This clarification was necessary as certain banks had understood the IQD 1,189 limit to be applicable to just the cash based transactions.
• Group 1 (capital of IQD >150b) - $15m daily limit • Group 2 (capital of IQD 150b) - $12m daily limit • Group 3 (capital of IQD <150b) - $8m daily limit • Group 4 (branches of foreign banks) - $5m daily limit
The increased supply of dollars after the July instructions began to show some results as the dinar strengthened from an average of 1,254 IQD/$ to an average of 1,228 IQD/$ between July 2012 to Sep 2012.
Instruction # 19 October 1, 2012
Less than three months after its revised instructions, the CBI came back with yet another set of regulations. This time the CBI removed the daily trading volume limits on banks and also removed the selling price cap that was previously set at IQD 1,189. The CBI still maintained the cash exchange cap at $5 thousand per person.
The Era of Abdul-Basit Al-Turki
The result of removing the daily caps and progressively increasing the supply of dollars to the market had the intended consequence of strengthening the currency but also the unintended consequence of allowing large sums of money to flow out of the country for non-commercial purposes. 17
In October 2012, Dr. Sinan Shabibi was removed from his post and replaced with chairman of the Board of Supreme Audit Dr. Abdul Basit Al-Turki. Under the new leadership, the Central Bank of Iraq started to once again tighten the supply of dollars and began investigations into several banks and money exchange companies. The CBI also demanded more scrutiny of the required documents.
As a result of the above policies, the trailing 3-month average daily volume of dollars purchased in the auction market declined from 268m/day in October 2012 to 190m/day in February 2013, a decline of almost 30%. This also resulted in the dinar once again weakening and it stood at IQD 1,270 as of April 17, 2013.

Sansar Capital Management, LLC, 2013, Copyright © All Rights Reserved
14
-
1,000,000
2,000,000
3,000,000
4,000,000
5,000,000
6,000,000
Letters ofGurantee
Letters ofCredit
Loans &advances
Overdrafts
Private bank credit outstanding (IQD mm)
0%10%20%30%40%50%60%70%
BNOR BIME BDSI BBOB
Off-balance sheet assets (% of total assets)
Instructions dated March 24, 2013
On the 24th of March 2013 the CBI passed a new set of instructions that go into effect on April 15, 2013. With the new regulations, banks have a limit of $500k/day of currency per customer when purchasing dollars for purpose of wire-transfer. The banks have no such limits on payments made via letters of credit. Furthermore banks are required to sell the currency to end customers who are importing goods to the country at a rate of 10 dinars above the price at which the Central Bank sells the currency to banks.
By limiting the amount of dollars available for wire-transfers, the new regulation is intended to move business away from wire-transfers to letters-of-credit. The Central Bank views the latter as less prone to corruption and makes it more difficult to smuggle money out of the country.
We note that Iraqi banks are already fairly active with letters-of-credit. In 2011, private bank letters of credit and letters of guarantee (pledged credit) accounted for 6.9 trillion Iraqi Dinars in 2011 as compared to loans, advances and overdrafts (cash credit) which were less than half that at 3.3 trillion Iraq Dinars. We also note that the former “pledged” credit is reported off-balance sheet and therefore understates the amount of true leverage at many banks.
It is important to understand the credit policies of each bank around the type of collateral obtained against both cash as well as pledged credit. In order to evaluate the risk profile of a bank, we conservatively capitalize these off balance sheet assets in our analysis explained later in this paper.
b. Traditional lending activities
Lending remains a small business for many banks in Iraq with cash credit-to-GDP at a mere 9 percent as compared to 55% on average for the MENA region. 9 Put another way, neighboring Jordan with a GDP that is a quarter that of Iraq and a population that is one-fifth of Iraq’s population has domestic credit lending to the private sector at around $21b as compared to $10b for Iraq while its other neighbor, Saudi Arabia, with a similar population size to Iraq, has over $230b outstanding.9
Source: Central Bank of Iraq10, Company Reports15

Sansar Capital Management, LLC, 2013, Copyright © All Rights Reserved
15
0.0%2.0%4.0%6.0%8.0%
10.0%12.0%14.0%16.0%18.0%
2008 2009 2010 2011
CBI Policy Rate
Policy Rate Inflation rate
Interest income from cash & equivalents (% of total revenue)
0%10%20%30%40%50%60%70%
BBOB BIME
2008 2011
0%2%4%6%8%
10%12%14%16%18%20%
Core-inflation Interest rates (IDBank Loans, 1-5 yrs)
Real interest rates
2008 vs. 2012 Real and Nominal Interest rates
2008 2012
2010 spread between lending and borrowing rates
0.00%1.00%2.00%3.00%4.00%5.00%6.00%7.00%8.00%9.00%
Iraq
Alg
eria
Bahr
ain
Jord
an
Yem
en
MEN
A a
vg
Egyp
t
Qat
ar
Syria
Liby
a
Om
an
Kuw
ait
Many factors have limited growth of lending activities in Iraq. First, lending criteria tends to be highly stringent with many banks demanding collateral equivalent to over 200% of the loan value. Furthermore, despite the fact that official interest rates and inflation rates have declined significantly, banks continue to require very high interest rates on lending activities, with average medium-term lending rates of 12.0% as of December 2012. 19 As a result, inflation-adjusted real interest rates have gone up since 2008 despite the improving security and political situation. Iraq today has one of the highest spreads between borrowing and lending rates in the MENA region.
Sources: Central Bank of Iraq14 , World Bank 20
c. Treasury and CBI Deposits
Keeping deposits at the Central Bank and earning the policy rate was one of the primary income sources for many banks until 2008. As the rate of inflation declined, the CBI actively reduced the policy rate from over 16% in 2008 down to 6% in 2011.14 This caused many banks to look at other ways of generating income and hence pushed them towards increasing traditional lending activities. The chart below compares interest income from cash holdings as a percentage of total revenue for Bank of Baghdad and Iraq Middle East Bank. We did not have sufficient data to make the same comparison for Dar Es Salaam and North Bank.
Source: Company Reports 21, Central Bank of Iraq 14

Sansar Capital Management, LLC, 2013, Copyright © All Rights Reserved
16
0%
10%
20%
30%
40%
50%
60%
70%
Dar EsSalaam
Iraq MiddleEast
Bank ofBaghdad
North Bank Citi Bank ofAmerica
JP Morgan Wells Fargo
2011 Capital Adequacy Ratio (CAR) Iraqi banks vs. select US Banks
Risk Analysis – CAMEL framework
A common framework to analyze risk is the widely employed CAMEL framework. Developed by bank examiners in the United States, the system has been adopted internationally to evaluate credit worthiness. The acronym CAMEL stands for Capital, Asset quality, Management, Earnings, and Liquidity. Except for Management, each metric can be analyzed using quantitative methods. After analyzing these attributes, composite ratings are given from 1 to 5, with 1 being strongest and 5 being weakest. Furthermore, each category is then also subdivided by alphabetical letters with “A” being strongest and “C” weakest. Below, we take a closer look at the quantifiable aspects of the rating system.
Capital adequacy:
The goal of analyzing capital adequacy is to determine the sufficiency in which equity and other accounts can absorb shocks from losses or deterioration of assets. We look at how much equity a bank has relative to its risk weighted assets as defined by Basel II standards. Banks with high equity as a percentage of assets have lower leverage and are therefore better able to withstand losses from underperforming loans.
As the below chart depicts, the four largest Iraqi banks by deposits had Capital Adequacy Ratios that were significantly higher than banks in other parts of the world. Given Iraqi banks are in the process of increasing their equity capital from 100b IQD in 2011 to 250b in 2013 the actual current capital adequacy ratios are likely to be multiple times greater than the data in the chart below.
Source: Central Bank of Iraq10, Capital IQ22
Asset quality
Asset quality not only affects profitability, but also the ability of banks to maintain capital adequacy. While it is not always easy to get a good view on asset quality from the outside-in,
Sansar Capital Management, LLC, 2013, Copyright © All Rights Reserved
17
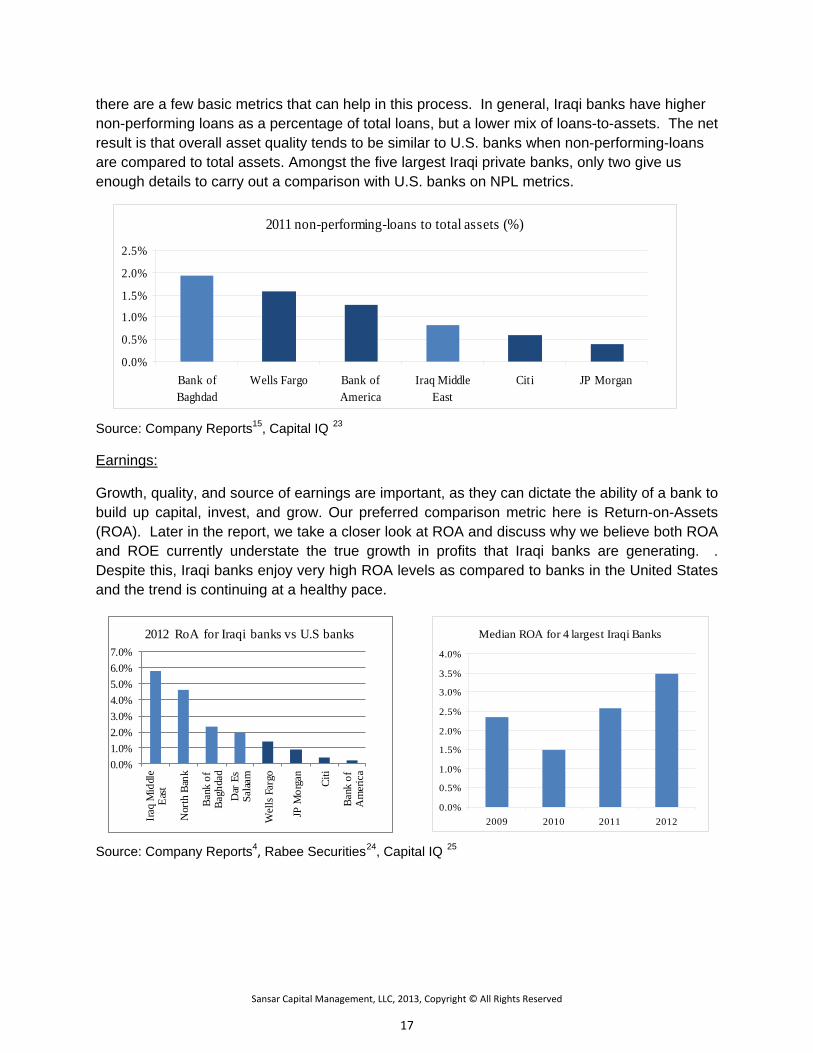
there are a few basic metrics that can help in this process. In general, Iraqi banks have higher non-performing loans as a percentage of total loans, but a lower mix of loans-to-assets. The net result is that overall asset quality tends to be similar to U.S. banks when non-performing-loans are compared to total assets. Amongst the five largest Iraqi private banks, only two give us enough details to carry out a comparison with U.S. banks on NPL metrics.
Source: Company Reports15, Capital IQ 23
Earnings:
Growth, quality, and source of earnings are important, as they can dictate the ability of a bank to build up capital, invest, and grow. Our preferred comparison metric here is Return-on-Assets (ROA). Later in the report, we take a closer look at ROA and discuss why we believe both ROA and ROE currently understate the true growth in profits that Iraqi banks are generating. . Despite this, Iraqi banks enjoy very high ROA levels as compared to banks in the United States and the trend is continuing at a healthy pace.
Source: Company Reports4, Rabee Securities24, Capital IQ 25
2011 non-performing-loans to total assets (%)
0.0%
0.5%
1.0%
1.5%
2.0%
2.5%
Bank ofBaghdad
Wells Fargo Bank ofAmerica
Iraq MiddleEast
Citi JP Morgan
0.0%1.0%2.0%3.0%4.0%5.0%6.0%7.0%
Iraq
Mid
dle
East
Nor
th B
ank
Bank
of
Bagh
dad
Dar
Es
Salaa
m
Wel
ls Fa
rgo
JP M
orga
n
Citi
Bank
of
Am
eric
a
2012 RoA for Iraqi banks vs U.S banks Median ROA for 4 largest Iraqi Banks
0.0%
0.5%
1.0%
1.5%
2.0%
2.5%
3.0%
3.5%
4.0%
2009 2010 2011 2012

Sansar Capital Management, LLC, 2013, Copyright © All Rights Reserved
18
Liquidity:
Liquidity assesses the banks’ ability to access capital to meet acute needs. Common ratios include loans/deposit and cash/total liabilities. As the chart below highlights, Iraqi banks are highly liquid and in many respects this results in underutilized balance sheets.
Source: Company Reports 4
CAMEL rating scores by Central Bank of Iraq for select publicly traded banks on the Iraqi stock exchange
Ticker 2010 Rating
2010 Score
Ticker
2010 Rating
2010 Score
Iraqi Middle East Excellent 1C Investment Bank Good 3A Kurdistan International Excellent 1C Summer Commercial Good 3A United Bank Very good 2A Iraq Islamic Bank Good 3B Gulf Commercial Bank Very good 2B Economy Bank Good 3B Credit Bank Very good 2C Dar Es Salaam Bank Good 3B Ashur Bank Very good 2C Bank of Baghdad Good 3C Babylon Bank Good 3 Commercial Bank Good 3C North Bank Good 3A National Bank Good 3C Mansour Bank Good 3A Union Bank Fair 4A
Source: Central Bank of Iraq 26
0.0%
10.0%
20.0%
30.0%
40.0%
50.0%
60.0%
70.0%
80.0%
90.0%
100.0%
North Bank Dar Es Salaam Bank Iraq Middle East Bank of Baghdad
2011 Cash-to-total liabilities (%)

Sansar Capital Management, LLC, 2013, Copyright © All Rights Reserved
19
Return on Equity – adjusting the reported numbers
The top 4 Iraqi banks by deposits reported a median Return-on-Equity (ROE) of 18.7% in 2012. We, however, believe the reported numbers understate the true earnings power. The Central Bank of Iraq imposed arbitrary capital rules requiring all banks in Iraq to have a minimum of 250b IQD equity capital by June 2013. For many banks this resulted in book value growing by a factor of over 3x between 2009 – 2013. This massive capital increase caused most Iraqi banks to become significantly overcapitalized during the last few years and to currently sit on large sums of underutilized cash. Thus in order to understand the true earning power of banks, we look at them on an “adjusted ROE” basis.
Source: Sansar Capital, Company Reports 4, Rabee Securities24
The process of calculating “adjusted ROE” involves two steps: the first is to adjust the Return-on-Assets to reflect a normalized productive asset utilization rate. The second is to adjust the overall leverage and capital structure of the balance sheet. These two factors can be summarized with the equation below.
ROE (Net income/Assets) = ROA (Net Income/Assets) x Leverage (Assets/Equity)
Source: Company Reports4, Rabee Securities24, Capital IQ 27
0.0x
2.0x
4.0x
6.0x
8.0x
10.0x
12.0x
14.0x
JPM C BAC WFC BBOB BNOR BDSI BIME
2012 Leverage ratios at Iraqi Banks vs. US Banks
0.0%
1.0%
2.0%
3.0%
4.0%
5.0%
6.0%
7.0%
BIME BNOR BBOB BDSI WFC JPM C BAC
2012E RoA for Iraqi banks vs U.S banks
0%
10%
20%
30%
40%
50%
60%
70%
Middle East Bank Dar Es Salaam Bank of Baghdad North Bank
2012 Adjusted ROE for Iraqi Banks
Reported ROE
Adjusted ROE

Sansar Capital Management, LLC, 2013, Copyright © All Rights Reserved
20
Return-on-Asset (ROA): The forced capital issuances and significantly underutilized balance sheets also have an impact on ROA. At the end of 2012, cash represented circa 50%-70% of total assets for the top 4 Iraqi banks. Thus, in order to adjust for this distortion, we must adjust cash holdings to a normalized level.
The task of figuring out a ‘target cash level’ is not straight-forward. In 2008, for example, the Bank of Baghdad cash asset mix was approximately 37% and in 2012 it grew to 62% of the assets due to the forced issuance of new capital. However, when trying to determine the target cash-mix, it would be wrong to assume that pre-capital raise cash mix is the optimal mix. This is because in 2008 the interest rates on central bank deposits were high and banks could earn high rates of return by just holding cash on balance sheet. Over the past few years, just as banks were forced to raise equity and their cash balances ballooned, the interest rates declined significantly thus the same economic rationale for holding cash no longer applies today as it did in 2008.
With no clear historical or peer data to rely on, we have assumed a target cash balance of 35%. We note this is likely to be conservative as certain banks like Bank of Baghdad and Iraq Middle East Bank maintained around that level of cash balance in an environment where interest rates on cash deposits were higher and the security situation was much worse – both of which provided a strong incentive to keep high cash balances. After having set the target cash mix, we can determine the incremental income as follows:
2012 IQD, billions Bank of Baghdad
Middle East Bank
North Bank
Dar Es Salaam
(1) Total Assets 1,292 857 1,605 695 (2) Cash mix 63% 54% 48% 72% (3) Target cash mix 35% 35% 35% 35% (4) “Excess cash” [1 x (2-3)] 362 163 209 257 (5) Interest income/avg. interest bearing assets (2011) 7.5% 10.7% 7.6% 8.8%
(6) Interest rate on cash deposits (estimated) 4.0% 4.0% 4.0% 4.0% (7) Spread 3.5% 6.7% 3.6% 4.8% Incremental income [4 x 7] 12.7 10.9 7.5 12.3 Less taxes (@15%) (1.9) (1.6) (1.1) (1.8) Incremental Net Income from cash 10.8 9.3 6.4 10.5
Source: Sansar Capital, Rabee Securities 24, Company Reports4
Leverage Adjustment: Another consequence of the capital-issuance rules set by the Central Bank of Iraq has been a decline in overall leverage as bank equity capital grew much faster than the banks’ ability to deploy this capital. Thus in order to adjust for this distortion, we must assume a steady-state capital structure when trying to determine the underlying return-on-equity potential.

Sansar Capital Management, LLC, 2013, Copyright © All Rights Reserved
21
The Central Bank dictates that Iraqi banks must maintain a minimum Tier 1 capital ratio of 12% and that loans/equity should not exceed 8x. 12 As long as the incremental return on those deposits exceeds the incremental costs, profit driven institutions will try increase leverage until they reach the maximum amount allowed by regulators.
Given the spread between lending and borrowing is high, banks in Iraq will be driven to come as close to the 12% Tier 1 capital ratio as possible. Converting the Tier 1 capital ratio to a simple leverage ratio (assets/equity) is, however, fairly nuanced. For sake of simplicity in this paper we will assume that this translates to a simple 8x leverage ratio (1/0.12). In reality this is likely to be conservative as banks with Tier 1 ratio of 12% would typically have a leverage ratio that is greater than 8x. The impact on net income from this adjustment is shown in the table below. We note that we have not assumed 35% cash on incremental assets as the risk-weight given to cash is 0 and therefore it does not count towards the 8x leverage target.
2012E IQD, billions Bank of Baghdad
Middle East Bank
North Bank
Dar Es Salaam
(1) Total equity (2012E) 212 216 275 128 (2) Target leverage ratio (asset/equity) 8.0x 8.0x 8.0x 8.0x (3) Implied total assets [2x1] 1,696 1,728 2,200 1,024 (4) Balance sheet assets reported 1,292 857 1,605 695 (5) Off-balance sheet assets, last (2011) 125 165 588 157 (6) Total assets 1,417 1,022 2,193 852 (7) Incremental assets capacity [3-6] 279 706 7 172 (8) Interest inc./interest bearing assets (2011) 7.5% 10.7% 7.6% 8.8% (9) Interest exp./interest bearing liabilities (2011) 1.0% 2.1% 3.5% 0.5%
(10) Spread [8-9] 6.5% 8.6% 4.1% 8.3% (11) Incremental income [7x10] 18.1 60.7 0.3 14.3 Less: cost of holding additional cash (1.5) (7.9) (0.1) (0.5) Less taxes (@15%) (2.7) (9.1) (0.0) (2.1) Incremental Net Income from leverage 13.9 43.7 0.2 11.7
Source: Sansar Capital, Rabee Securities 24, Company Reports4
2012 IQD, billions Bank of Baghdad
Middle East Bank
North Bank
Dar Es Salaam
Estimated FY’12 Net Income 25.2 44.2 58.5 14.5 Incremental Net Income from cash 10.8 9.3 6.4 10.5 Incremental Net Income from leverage 13.9 43.7 0.2 11.7 Total Net Income 49.9 97.2 65.1 36.7

Sansar Capital Management, LLC, 2013, Copyright © All Rights Reserved
22
Capital Issuances – What Comes Next?
As previously mentioned, the Iraqi banking sector has been forced to raise significant amounts of capital over the last few years due to the equity capital rules set by the Central Bank of Iraq. As we approach the end of this process we believe the Iraqi banks are well equipped to grow over the next decade without the need to raise additional capital. Furthermore, we suspect that Iraqi banks may even look to return some of the cash back to shareholders in the form of dividends as they sit on large piles of unutilized cash and overcapitalized balance sheets. The return of profits to shareholders may also serve as an important catalyst that could attract yield hungry investors.
As a reminder, the Central Bank of Iraq requires all private banks to have a minimum equity capital of 250 billion IQD. The deadline for this target was set as June 2013 with two intermediate goals of 100b IQD by June 2011 and 150b IQD by June 2012. As of April 2013, 19 out of the 21 listed banks had reached the second intermediate with 5 of those banks having already reached the 250b IQD milestone.
Bank Ticker Paid-up Capital
2010 2011 2012
Kurdistan International
BKUI 100,000 150,000 300,000 Mansour Bank BMNS 75,000 100,000 250,000 United Bank BUND 150,000 200,000 250,000 North Bank BNOR 100,000 175,000 210,000 Mosul Bank BMFI 50,000 75,000 202,000 Bank of Baghdad BBOB 100,000 112,900 175,000 Investment Bank of Iraq BIBI 75,020 100,000 155,000 Elaf Islamic Bank BELF 50,000 100,000 152,000 Iraqi Islamic Bank BIIB 51,192 102,384 152,000 National Bank of Iraq BNOI 50,000 100,000 152,000 Union Bank of Iraq BUOI 50,000 59,800 152,000 Summer Commercial Bank BSUC 70,000 70,000 151,000 Ashur Bank BASH 66,700 66,700 150,000 Babylon Bank BBAY 50,000 100,000 150,000 Commercial Bank of Iraq BCOI 60,000 100,000 150,000 Credit Bank of Iraq BROI 100,000 100,000 150,000 Economy Bank BEFI 76,000 100,000 150,000 Iraqi Middle East inv. Bank BIME 66,000 100,000 150,000 Gulf Commercial Bank BGUC 56,990 103,950 125,000 Dar Es Salaam Investment
BDSI 72,000 105,800 105,800
Dijlah & Furat Bank BDFD 50,000 50,000 50,000 Total 652,632 1,310,266 1,818,200
Source: Rabee Securities 24

Sansar Capital Management, LLC, 2013, Copyright © All Rights Reserved
23
We believe once the private sector banks reach the final milestone of having 250b IQD of capital they will be able to support the fast-growing Iraqi economy without the need to raise additional capital. To understand why this is the case, we need to walk through some math.
There are currently 43 private sector banks in Iraq of which 21 are listed banks. The Central Bank requires all private sector banks to have 250b IQD of capital by June 2013. Most of the listed banks are on-track to meet the required targets while the non-listed banks are likely to struggle. Furthermore, the two large state-owned banks are also required to raise their capital levels to 0.7t IQD. Hence if all banks reached this target, Iraqi banks would have a total lending capacity of 92 trillion IQD or approximately 58% of total 2013 GDP. This compares to the MENA unweighted average of 55% credit-to-GDP ratio in 2011(a)
Even if we assume that many of the unlisted banks do not reach the capital target ratios, we believe the listed banks alone will have sufficient balance sheet fire-power to support lending activities for many years to come. Furthermore, the high ROE ratios for Iraqi banks suggest banks can continue to support a very high level of growth rate well into the future. This relationship can be summarized as follows:
Growth (g) = Return-on-Equity (ROE) x Reinvestment Rate (RR)
As we highlighted earlier, the median reported ROE for the four largest Iraqi banks was 18.7%. Once we adjust for various distortions (b) the adjusted ROE we calculated is closer to 30.1%. Taking an average of the two numbers yields a ROE of 24.4%. Assuming an 88% reinvestment rate(c) banks in Iraq could maintain a steady-state growth rate of over 21% per year without having to raise additional capital. This equates to 2x the projected growth in GDP. Put another way, even if Return-on-Equity was cut by half, banks would still be able to grow at the rate of GDP without having to raise any additional capital.
Given Iraqi banks are significantly over-capitalized and sit on large sums of underutilized cash, management teams may look to return some capital back to shareholders in form of dividends. Should this happen, we believe Iraqi banks could see significant amount of interest from yield-driven investors.
(a) 43 private banks x 250b IQD of capital = 10.8t equity capital +0.7t of state owned banks capital = 11.5t x leverage of 8x = 91.6t IQD of lending capacity. Estimate 2013 GDP is US$135b (2011 GDP of 115b from world bank grown by IMF estimates of GDP growth of8.4% in 2012 and 9% in 2013 ) (b) See section titled ROE –Adjusting the reported number (c) 88% is a simplified calculation assuming 12% of equity capital must be maintained for regulatory purposes

Sansar Capital Management, LLC, 2013, Copyright © All Rights Reserved
24
Valuation – The Traditional Approach
When looking at the banking sector in Iraq, we find no positive correlation, or surprisingly, even a negative correlation, between valuation multiples and traditional value drivers such as growth and return-on-equity. Using non-traditional metrics, such as comparing banks based on type of bank (Islamic vs. non-Islamic) and type of ownership (strategic foreign owners vs. no strategic foreign owner), we find a clear divergence in valuation premiums. Curiously, even if we separate out the camps of banks into distinct pools and run correlations of each camp, we still find no relationship between valuation multiples and economic returns.
We believe the above analysis is an indication of market inefficiency. While the market is able to distinguish the banks based on non-financial metrics, we believe the market as yet does not reward banks based on delivering economic value. This phenomenon can be partly attributed to the lack of fundamental analysis of companies. We believe as the Iraqi market grows and matures this inefficiency will likely go away as well.
Traditional Value Drivers
As the two charts below exhibit, Iraqi companies show a negative correlation to traditional value drivers. On one extreme, Iraqi Middle East Investment Bank (BIME) had both the highest ROE and growth rate amongst the large-cap banks and yet trades at the lowest multiple. On the other end of the spectrum, Dar-Es-Salaam Investment Bank (BDSI) had one of the lowest ROE ratios in the sector and yet trades at the highest valuation multiple. The conclusion is the same even if the analysis is run on the entire banking sector.
Source: Sansar Capital, Iraqi Stock Exchange, Rabee Securities24

Sansar Capital Management, LLC, 2013, Copyright © All Rights Reserved
25
P/E Ratio by ownership
0x5x
10x15x20x
No strategicforeign owner (a)
With strategicforeign owner (b)
P/E Ratio by type of bank
0x5x
10x15x20x
Non-Islamicbanks (c)
Islmaicbanks (d)
Separating out the banks into two distinct camps of those with a large strategic foreign owner and those without one, we find a clear divergence in the traded P/E multiple. Despite having a lower median ROE, banks with foreign strategic owners trade at a 71% P/E multiple premium to the other Iraqi banks. We see a similar divergence between banks that are “Islamic” and thus trade at a premium vs. “non-Islamic” banks that trade at a discount.
While Iraqi investors seem to clearly make a distinction in valuation premium given to banks with a strategic owner to those without a strategic owner, we see no positive correlation between economic value drivers and trading multiples. Instead, we see a negative correlation between economic return and valuation multiple.
Perhaps the negative correlation seen in the market is associated with investor psychology which focuses on nominal share-price rather than P/E multiples. Hence investors view a bank trading at 2 dinars to be more expensive than a bank trading at 1 dinar irrespective of P/E multiple of the two banks. Therefore, banks that earn high returns do not necessarily see their share price move up; this in turn depresses the P/E multiple for those companies.
Source: Sansar Capital, Rabee Securities 24
Source: Sansar Capital, Rabee Securities 24
(a) Banks with no strategic foreign owner: North Bank, Iraqi Middle East Inv. Bank, Kurdistan Intl. Bank, United Bank, Union Bank, Economy Bank, Investment Bank, Gulf
Commercial, Mousil Bank, Babylon Bank, Elaf Bank, Iraqi Islamic Bank, Summer Commercial, Ashur Bank (b) Banks with strategic foreign owners: Bank of Baghdad, Dar Es Salaam Bank, Credit Bank, Bank Mansour, Dijlah & Furat Bank, National Bank, Commercial Bank (c) Non-Islamic Banks: Iraq Middle East Inv. Bank, Gulf Commercial, North Bank, Bank of Baghdad, National Bank, Mansour Bank, Dar Es Salaam, Credit Bank, United Bank,
Mousil Bank, Babylon Bank, Economy Bank, Summer Commercial, Ashur Bank, Union Bank, Investment Bank, Commercial (d) Islamic Banks: Iraq Islamic Bank, Elaf Bank, Kurdistan Bank, Dijla & Furat bank

Sansar Capital Management, LLC, 2013, Copyright © All Rights Reserved
26
Laws and Regulations
The following are some of the most important laws surrounding Iraqi Banks. Full English versions of these laws can be found online at various Iraqi broker sites:
(1) Iraqi Central Banking Law No. 56 of 2004 (2) Banking Act of 2004 (3) Money Laundering Act of 2004 (4) Company Act for government banks and law firms
Central Bank Regulations
Capital Requirements: The Central Bank passed various minimum capital requirement regulations bringing consolidation to the banking sector and growing the size of banks to minimum equity capital of 250b IQD (US$ 214m) by June 2013 with two interim targets of 100b IQD by June 2011 and 150b IQD by June 2012.
Reserve Requirements: 5% of deposits must be kept as cash in vaults and 10% with CBI
Risk Management: Banks are required to abide by the following minimum risk management guidelines:
• Minimum capital adequacy ratio of 12% at all times • Ratio of all credit granted may not exceed 8x the banks’ capital • Lending to any one customer may not exceed 10% of the banks’ capital • Lending to any one customer along with related parties as defined by companies he or
she owns or his or her relatives of first degree may not exceed 15% of the banks’ capital • Minimum liquidity ratio of 30% (defined as liquid liabilities / liquid assets) • Fixed assets to equity capital may not exceed 40% • Provisions may not be less than 2% or greater than 5% • Investments may not exceed 20% of equity capital
Provisions: Banks are required to set-aside provisions based on aging of the loan using the following schedule of loan classifications.
Classification Days past due Amount of reserve
Current 0 2% Past-due <90 days 10% Substandard 90-180 days 25% Doubtful 180 – 360 days 50% Loss 360 days + 100% Source: Central Bank of Iraq 27F
28

Sansar Capital Management, LLC, 2013, Copyright © All Rights Reserved
27
Profit before taxes (IQD B)
0.0
10.0
20.0
30.0
40.0
50.0
60.0
70.0
2008
2009
2010
2011
0.0
10.0
20.0
30.0
40.0
50.0
60.0
70.0
2008
2009
2010
2011
FX related Net Interest Income
North Bank (BNOR)
Overview
North Bank is the largest publicly traded bank as ranked by size of deposits. The bank has one of the highest mixes of non-strategic foreign shareholders with over 15% of the capital being held by this group. We believe much of the excitement stems from strong earnings and deposit growth over the last few years. Yet despite those positives, we have several points of concern as it relates to the bank:
• A large percentage of earnings are derived from foreign-exchange activities that are likely to shrink significantly going forward
• Risk of significant amount of loan-losses from over-draft facilities • High level of off-balance sheet leverage • Questionable inconsistencies in translating annual reports to English
Net Income: Easy come, easy go
We believe the recent tightening of foreign-exchange transactions by the Central Bank of Iraq will adversely impact North Bank with the potential to cause a material decline in the profits generated by the bank. To understand why this is the case lets breakdown the net-income picture more closely.
In 2011, Foreign exchange revenue accounted for approximately 67% of net revenue for North Bank and 120% of its net income. As the chart below highlights, almost all the growth we have seen in net income between 2008-2011 was driven by FX-related activities
Source: Company Reports 29
Since the beginning of the year, under the leadership of the new governor, the Central Bank of Iraq has significantly increased scrutiny on dollar demand through the foreign-exchange auction. As a result, several banks have seen their average-daily-volume of dollar transactions drop materially.

Sansar Capital Management, LLC, 2013, Copyright © All Rights Reserved
28
In order to quantify the exact magnitude of this impact, we took a sample of seven days’ worth of data for each of the first three months of this year (for a total of twenty-one days of data) to show how these changes have impacted individual banks. As we show in the chart below, North Bank has seen its average daily volume shrink materially through the first quarter of 2013 with March 2013 volume being down over 95% from 2012 daily volume.
Source: Central Bank of Iraq 30
While the first quarter volumes were materially lower, the weaker dinar exchange rate meant the bank was able to offset some of the headwinds from lower-volume through higher spreads on the exchange rate. Going forward, new CBI regulations that go into effect on April 15, 2013, are supposed to limit the spread on sale to 10 dinars. The combination of lower volume and lower spread will likely impact the FX and wire-transfer revenue in a materially negative manner.
Lending activities: What lies beneath?
Over the last several years North Bank has grown its loan book primarily through overdraft facilities and as of the end of 2011 overdraft facilities accounted for 82% of the loan book. In general we find that Iraqi banks with a heavy concentration of overdraft facilities tend to also have very high default rates. We believe this goes back to riskier nature of these loans as most banks typically do not have collateral requirements against overdrafts. Furthermore, given the revolving nature of these loans, it can take a long time for banks to realize and recognize defaulting loans.
The Credit Bank of Iraq reported in 2011, for example, 60% loan-loss provisions on a loan book that was primarily composed of over-draft facilities while Dar Es Salaam bank reported 31% loan-loss provision on a loan book with a 54% mix of over-draft facilities. In both of those cases the damage was contained as total value of those loans was small. In the case of North Bank, however, over-draft facilities account for over 100% of equity book value and could pose a systemic risk to the bank.

Sansar Capital Management, LLC, 2013, Copyright © All Rights Reserved
29
2008 2009 2010 2011
North Bank Loan Breakdown (IQD B)
LT Loans ST Loans Overdrafts Other 101%
33%
13.4%
1.5%
BNOR BIME BDSI BBOB
2011 Overdraft facilities as % of total equity value
0%
20%
40%
60%
80%
100%
120%
140%
160%
BNOR BIME BBOB BDSI
2011 Loans/Deposits (%)
0%20%40%60%80%
100%120%140%160%
BNOR BIME BBOB BDSI
2011 Loans/Deposits (LC/LG Capitalized)
Source: Company Reports 29, 15
Off-balance sheet risk
North Bank has significant amount of off-balance sheet leverage in the form of letters-of-credit (“LC”) and letters-of-guarantee (“LG”). The auditors of the bank in their annual review point out that many of these facilities at North Bank are given out in a concentrated manner and with insufficient collateral. As such, we believe it is important for investors to take a closer look at the amount of risk these facilities pose to the bank.
In 2011, North Bank had a loans/deposit ratio of 40% when only cash-credit is taken into account. However, when we capitalize the off-balance sheet loans such as letters-of-credit and letters-of-guarantee we find that total loans (cash and pledged) to deposit ratio is actually significantly higher for North Bank. This ratio jumps from 40% of loans/deposits to over 140%. We find this to be particularly concerning given the potential reduced collateral requirements and concentrated nature of these loans.
Source: Company Reports 4

Sansar Capital Management, LLC, 2013, Copyright © All Rights Reserved
30
Selective mistranslation
In the 2011 annual report published in Arabic, the auditor reprimand North Bank on a number of material issues. Curiously, however, the English translated annual reports provided by the bank have no mention of any of these issues or concerns. We find such inconsistencies in the translation to be questionable.
Below we have provided a translation of the auditors section that was removed from the English translation along with a snap-shot of the actual wording in Arabic as provided by the auditors. We note the particular concerns are issues raised around lack of compliance on loan-loss provisioning and high value LC granted without appropriate collaterals.
English Translation
1. Cash and Pledged Credit: • Cash-credit balanced was (268,516) billion dinar compared to (223,799) billion dinar in
the previous year. Pledged credit balance was (437,622) billion dinar net of the deposits received for pledged credit compared to (291,228) billion dinar in the previous year
• In certain cases large sums of credit was extended without sufficient collateral or without any collateral whatsoever. Those credits were extended with high degree of concentration. We recommend avoiding such activities to protect bank from credit related losses
• We remind the bank of the importance of following-up and reviewing documents related to import of good
2. Provisions for doubtful loans: • Loan provision in 2011 was (3,299) billion dinar bringing the total balance for provisions
at December 31, 2011 at (15,295) billion dinar. We recommend determining the appropriate amount of provisions based on instructions provided by the Central Bank of Iraq

Sansar Capital Management, LLC, 2013, Copyright © All Rights Reserved
31
5
11
11111
11
11
1 1
2011 Branch Distribution BaghdadNinawaErbilDuhokKikukBasraSulyamaniaBabilNajafWasitAnbarMaysanDhi Qar
67%
19%
11%
1% 2%
2011 Revenue by branch
Baghdad
Sulyamania
Erbil
Duhok
Other
Branch Network
As of December 2011, North Bank had 15 branches of which 5 were in Baghdad. The Baghdad branches constituted 28% of the branch network and 67% of revenue. While 31% of the revenue was generated by branches in the Northern Kurdish areas (Erbil, Sulyamania and Duhok).
Source: Company Reports 29

Sansar Capital Management, LLC, 2013, Copyright © All Rights Reserved
32
Large Bank Price-to-Earnings ratio (March 2013)
0
5
10
15
20
25
BDSI BBOB BNOR BIME
Profit Before Taxes (IQD billions)
-
20,000
40,000
60,000
80,000
2009 2010 2011 2012
Earnings-per-share
0.00
0.05
0.10
0.15
0.20
0.25
0.30
2009 2010 2011 2012
P/E Multiple for banks with strategic ownership interests
0
5
10
15
Bankingsector all
banks
Banks withno strategic
owners
North Bank
Valuation and Earnings growth
As of March 31, 2013, North Bank was trading at 9.7x price-to-earnings multiple which is in-line with the 9.8x median P/E multiple for banks that do not have a foreign-strategic investor and below the13.4x median P/E multiple for the overall banking sector.
Since 2009, North Bank has grown profit before taxes by 220%, a CAGR of 47% per year. As result of dilution from new share issuances, EPS has grown by 170% at circa 39% CAGR. The bank has primarily grown its earnings through the wire-transfer business and from an earnings spread on the currency. We believe this business could come under significant pressure going forward as a result of new policies and regulations introduced by the Central Bank of Iraq.
Source: Sansar Capital, Rabee Securities 4
Source: Sansar Capital, Company reports 29

Sansar Capital Management, LLC, 2013, Copyright © All Rights Reserved
33
Our Recommendations to the bank
North Bank has delivered strong profit and earnings-per-share growth over the last several years. We are concerned, however, about the future profitability of the bank given stricter Central Bank of Iraq regulations on foreign-exchange activities. We believe the bank needs to re-focus its attention to the following key challenges in order to position itself for long-term growth:
• Focus on quality deposits – we believe the bank needs to focus on creating quality deposits and not quantity of deposits. With a 7% interest rate paid on saving deposits, the bank has the highest cost of funding amongst the five largest private Iraqi banks. Furthermore, with 24% of deposits coming from letter of credit type activities, the bank has been unable to attract quality deposits despite the very high interest rate offered.
• Focus on quality lending – similar to the story of deposits, we believe the bank needs to focus on providing quality loans backed by quality collateral; we do not view growth via over-draft facilities as a way to sustainable business development. Furthermore, we believe the bank has maximized its leverage capacity through off-balance sheet letter-of-credit facilities which will limit its ability to maximize return on equity in the future.
• Improve transparency – We found little disclosure in North Bank financial statements around collateral value against overdraft facilities. We also could not find a detail breakdown of its loan provisioning schedule as is provided by other banks. We believe investors will need more information to make a fully informed decision on the bank.

Sansar Capital Management, LLC, 2013, Copyright © All Rights Reserved
34
Bank of Baghdad (BBOB)
Overview Bank of Baghdad is the second largest publicly traded Iraqi bank as ranked by size of deposits. The bank was established in 1992 and is one of the oldest private sector banks in Iraq. The bank, with over 39 branches across 17 provinces, also has one of the widest and broadest branch networks amongst the private banks.
Bank of Baghdad is 52% owned by Burgan Bank of Kuwait, a subsidiary of the $22 Billion KIPO group holdings. As such, the bank enjoys strong corporate governance and access to the management experience of some of the leading Middle Eastern banks. The bank was selected as one of three banks, along with Credit Bank of Iraq and Mansour Bank, whose letters of credit will be guaranteed by the Central Bank of Iraq (CBI). We believe this was a big vote of confidence by the CBI in the bank and will provide the bank with a strong competitive advantage over its competitors.
Bank Operating Activities Compared to other large Iraqi banks, Bank of Baghdad has one of the highest revenue contributions from net interest income and the lowest contribution from foreign-exchange activities. As such, the bank is most leveraged to the credit-growth story and will be amongst the least impacted by the recent tightening of Central Bank of Iraq regulations on the foreign exchange market. Bank of Baghdad could potentially be a net winner from the stricter foreign-exchange regulations imposed by the Central Bank as it is likely to drive more business towards letters of credit and letters of guarantee – something that plays to the advantage of Bank of Baghdad due its CBI guarantee.
Lending and borrowing activities
0%
20%
40%
60%
80%
100%
BNOR BIME BBOB BDSI
2011 Breakdown of net revenue by source
Wire transfer / FX gains Net Interest Income
LCs, LGs, Drafts Other
0%10%20%30%40%50%60%70%80%90%
100%
BNOR BIME BBOB BDSI
2011 Breakdown of gross revenue by source
OtherLCs, LGs, DraftsGross Interest Income
Source: Company Reports15

Sansar Capital Management, LLC, 2013, Copyright © All Rights Reserved
35
Bank of Bagdhad Loans Book (IQD B)
-20,00040,00060,00080,000
100,000120,000140,000160,000180,000200,000
Q42010
Q12011
Q22011
Q32011
Q42011
Q12012
Q22012
Q32012
Q42012
Provisions for non-performing loans (IQD B)
-
2,000
4,000
6,000
8,000
10,000
12,000
14,000
16,000
18,000
2008 2009 2010 2011 2012E
0% 1% 2% 3% 4%
BNOR
BIME
BBOB
BDSI
2011 Interest expense / interest bearing liabilities
5.0% 7.0% 9.0% 11.0%
BBOB
BNOR
BDSI
BIME
2011 Interest income/ avg interest bearing assets
0.0% 2.0% 4.0% 6.0% 8.0%
BNOR
BBOB
BIME
BDSI
2011 Net Interest Margin
Between 2008-2010 Bank of Baghdad grew its loan book aggressively, perhaps too aggressively, and in 2011 the bank started to experience high delinquency rates on its loans. The board took decisive actions by replacing the management team and freezing loan growth. As a result, its loan book declined by almost half from 181 billion dinars in Q4 2010 to 99 billion dinars in Q2 2012.
According to the company, the old management team extended loans based primarily on collateral value with little consideration to the cash-flow profile of the borrower. Hence, many borrowers were unable to meet the payments on their due dates. However, despite the high delinquency rate, the ultimate losses on those loans were small due to the high value of collateral that was associated with them. Under the new management team, the bank shifted its lending policies to focus on the cash-flow profile of the borrower in addition to the collateral value of the asset. The bank resumed its lending activities in 2012 under the new credit guidelines and has grown its loan book from a trough of 99 billion IQD at end of Q2 2012 to 147b by the end of 2012.
Source: Company Reports 31 Bank of Baghdad also has the lowest lending rate amongst the large cap banks. The bank uses these competitive rates to attract high-quality lenders while still managing to maintain a reasonable Net Interest Margin from its low funding cost.
Source: Company Reports 4

Sansar Capital Management, LLC, 2013, Copyright © All Rights Reserved
36
0%
20%
40%
60%
80%
100%
BDSI BIME BBOB BNOR
2011 Funding mix by type of deposit
LCs
Current
Savings
Fixed
0.0%
1.0%
2.0%
3.0%
4.0%
BNOR BIME BBOB BDSI
2011 Interest expense / interest bearing liabilities
Strong Franchise Value:
Bank of Baghdad has also been successful in building the 2nd largest deposit base while maintaining one of the lowest interest rates on deposit in the sector. While North Bank has a larger deposit base than Bank of Baghdad, we note that it comes at a much higher interest rate and lower quality mix.
Bank 2012 Deposit
(IDQ billions)
Rank Interest on saving
account
Rank
North Bank 1,262 1 7.00% 10 Bank of Baghdad 1,047 2 4.00% 3 Iraq Middle East Inv. Bank 616 3 4.00% 3 Kurdistan Bank 580 4 N/A n/a Dar Es Salam Bank 534 5 1.00% 1 Credit Bank of Iraq 355 6 3.30% 2 Investment Bank of Iraq 282 7 6.00% 8 Gulf Commercial Bank 261 8 5.50% 7 United Bank 247 9 6.00% 8 Mosul Bank 242 10 5.00% 5 Al-Mansour Bank 136 11 5.00% 5 Source: Central Bank of Iraq 32, Rabee Securities4
Low cost of funding
Bank of Baghdad has one of the lowest interest expense/interest bearing liabilities amongst the banks in this report. In large part, this is driven by both a low cost of funding as well as a deposit mix that has a higher mix of checking accounts. Banks in Iraq pay relatively little, if any, interest on checking accounts and, as such, the ability to attract large quantities of this low-cost deposit base is a significant competitive advantage for Bank of Baghdad. We believe few banks in Iraq have the ability to replicate this advantage.
Source: Sansar Capital, Company Reports 4

Sansar Capital Management, LLC, 2013, Copyright © All Rights Reserved
37
38%
3%8%5%
3%3%
8%3%3%
3%3%3% 5%
3%0% 5%
3%3%
3%
2011 Branch Distribution BaghdadNinawaErbilDuhokSalah El DeenKikukBasraSulyamaniaBabilNajafWasitAl-QadisiyyahAnbarDiyalaMaysan
Number of Branches by Bank, 2011
010
203040
5060
BEFI BBOB BIME BIIB BNOR BGUC BROI BMNS
2011 Profits by branch (IQD B)
0.01.02.03.04.05.06.07.08.09.0
Man
sour
Bagh
dad
Sula
iman
iya
Hill
ah
Kar
bala
Oth
ers
Branch Network
Bank of Baghdad has one of the largest branch networks of any bank in Iraq. As of the end of 2011, the bank had 39 branches - 15 in Baghdad and 24 in other governorates – the highest number of branches outside of Baghdad amongst the publicly listed banks.
Bank of Baghdad also has one of the most diverse geographic dispersions of any bank in Iraq. Currently the bank network of branches covers 17 out of the 18 provinces with plans to continue to expand branch network aggressively over the coming years. We note while the bank has 39 branches, the lions share of the profits are generated by five branches as shown below.
Source: Company reports 31
Source: Central Bank of Iraq 10

Sansar Capital Management, LLC, 2013, Copyright © All Rights Reserved
38
52%
0%
48%
Major Shareholders
Burgan Bank
Gulf United Bank
Others
52%
10%
38%
Type of Shareholders
Strategic
Foreigners
Locals
Shareholder Structure
As of the end of 2011, Burgan Bank owned approximately 52% of Bank of Baghdad. Burgan Bank operates as a subsidiary of Kuwait Projects Company Holding (KIPCO) group which is one of the largest and most diversified holding companies in the Middle East and North Africa with consolidated assets of $25.6 billion USD. The presence of a large strategic shareholder such as KIPCO group has been a strong vote of confidence in Bank of Baghdad and a source of healthy corporate governance and oversight.
As of July 2012, foreigners owned 62% of Bank of Baghdad. Excluding the stake owned by Burgan Bank, approximately 10% of the shares were held by ‘non-strategic’ foreign investors.
Sansar Capital
Sansar Capital, the author of this report, is a Singapore-based investment adviser whose clients hold diversified global holdings. As of the date of this report, Sansar Capital holds an interest in Bank of Baghdad on behalf of an advisory client.
Source: Company Reports (31), Iraq Depository Center

Sansar Capital Management, LLC, 2013, Copyright © All Rights Reserved
39
Large Bank Price-to-Earnings ratio (March 2013)
0
5
10
15
20
25
BDSI BBOB BNOR BIME
Profit Before Taxes (IQD billions)
05,000
10,00015,00020,00025,00030,00035,000
2009 2010 2011 2012
Earnings-per-share
0.00
0.05
0.10
0.15
0.20
2009 2010 2011 2012
P/E Multiple for banks with strategic ownership interests
0X
5X
10X
15X
20X
Banks with strategicowners
Bank of Baghdad
Valuation and Earnings growth
As of March 31, 2013, Bank of Baghdad was trading at 12.7x price-to-earnings multiple which is slightly below the13.4x multiple for the overall Iraqi banking sector and an approximate 20% discount to the 16.8x median P/E multiple for other Iraqi banks who also have large strategic ownership interests.a This is despite the fact that Bank of Baghdad has a higher ROE as compared to the median of the banking sector as well as other banks with strategic foreign ownership interests.
Since 2009, Bank of Baghdad has grown profit before taxes by a CAGR of 16.4% per year. As a result of dilution from new share issuances, EPS has grown at circa 10.8% CAGR. The bank has been focused on growing its lending business and for the most part has avoided participating in the lucrative business of wire transfers. Going forward, we believe Bank of Baghdad will benefit at the expense of other banks from the new regulations introduced by the Central Bank of Iraq which may move business from wire-transfers to letters of credit.
Source: Sansar Capital, Rabee Securities4
Source: Sansar Capital, Company reports 31
a. See “valuation: traditional approach” section where we show that Iraqi banks with strategic foreign ownership trade at a premium to rest of the banking
sector.

Sansar Capital Management, LLC, 2013, Copyright © All Rights Reserved
40
Our Recommendations to the bank
The bank has successfully grown its earnings at a steady pace by building out its lending capabilities and working to win the trust of its customers. As such the bank has one of the lowest funding costs and highest CASA ratios on deposits. We believe the bank to be a top tier bank that can further strengthen its capabilities by focusing on the following factors:
• Improve asset utilization – Bank of Baghdad sits on significant amount of liquid assets that are currently underutilized. Cash & Equivalents accounted for 63% of total assets – a measure that is high by any historical or peer group comparison standards. While we understand the bank has had its share of loan-losses from growing lending activities in the past we believe the bank could grow its loan book more aggressively through project finance loans syndicated in conjunction with other banks.
• Improve capital structure – In a somewhat related point to above, the bank should look at expanding its deposit base to improve leverage ratios. This would only be possible if it was able to productively deploy this incremental capital.
• Improve investor communication– We find that Bank of Baghdad does an adequate job with investor communication. Given its access to Burgan Bank we believe Bank of Baghdad has the potential to significantly improve investor communication and investor relations.

Sansar Capital Management, LLC, 2013, Copyright © All Rights Reserved
41
0% 1% 2% 3% 4%
BNOR
BIME
BBOB
BDSI
2011 Interest expense / interest bearing liabilities
5.0% 7.0% 9.0% 11.0%
BBOB
BNOR
BDSI
BIME
2011 Interest income/ avg interest bearing assets
0.0% 2.0% 4.0% 6.0% 8.0%
BNOR
BBOB
BIME
BDSI
2011 Net Interest Margin
Iraqi Middle East Investment Bank (BIME)
Overview
Iraq Middle East Investment Bank is the third largest publicly traded bank as ranked by deposits. The bank has a long-track record of operating in Iraq and has built a very strong franchise over the years. The bank maintains one of the highest net interest margins and highest quality of deposits. Iraqi Middle East Investment Bank has, arguably, one of the most conservative lending policies and as a result has seen significantly lower non-performing loans as compared to its peer group. The bank has also consistently been ranked #1 under the CAMEL rating system by the Central Bank of Iraq. Recently the bank landed in some hot-waters with the Central Bank of Iraq as it relates to its participation in the foreign-exchange market. The bank was the largest participant in the FX market in 2012. The CBI started an investigation at the conclusion of which it determined that some of the bank’s clients had not provided all the documentation required by law and as such imposed a small financial penalty on the bank and barred it from entering the FX market for most of the first two months of 2013. The bank has since provided the required documentation to CBI and has been allowed to participate in the FX market once again.
Lending-and-Borrowing Activities
Iraq Middle East Investment Bank has one of the highest Net Interest Margins amongst the five largest Iraqi banks driven primarily by higher than average lending rates. While the bank has one of the lowest interest rates on deposits, the longer-duration nature of BIME’s deposit mix drive up its overall borrowing costs.
We believe the banks’ ability to achieve these spreads while maintaining a conservative lending policy in the sector reflects strongly on the management team and the banks’ ability to leverage its years of experience operating in the Iraqi market.
Source: Company Reports 4

Sansar Capital Management, LLC, 2013, Copyright © All Rights Reserved
42
Loan-to-value
-50,000
100,000150,000200,000250,000300,000350,000
Value of Collateral Loans outstanding
Performing loans
< 90 days
90-180 days
180-360 days
> 1 year
Provisions aging schedule
Conservative lending policies:
Iraq Middle East bank has one of the most conservative lending standards across the Iraqi banking sector. This has resulted in the bank experiencing the lowest non-performing loan ratios in our coverage universe. We also highlight that circa 42% of the provisions were categorized as “general provisions” and were not linked to any non-performing loans.
Based on our conversation with the management as well as reported figures, we estimated that average loan-to-value for BIME is in the 50-60% range. The bank uses a range of different collaterals against its loans including real estate, stock portfolio, and gold and cash deposits. We note that BIME demands collateral on all types of loans including over-draft facilities which lowers the risk of default for the bank.
Source: Company Reports 33
0%
5%
10%
15%
20%
25%
30%
BDSI BBOB BNOR BIME
2011 Loan Loss Provisions (% of loans outstanding)
Source: Company Reports (46) Source: Company Reports 4

Sansar Capital Management, LLC, 2013, Copyright © All Rights Reserved
43
80%
6%
6%
0%
0%2%
3%
1%
1%
0%0%0%0%0%0%0%0%0%
Deposit distribution BaghdadNinawaErbilDuhokSalah El DeenKikukBasraSulyamaniaBabilNajafWasitAl-QadisiyyahAnbarDiyala
48%
4%
24%
5%3%
1%4%
4%7%
0%
0%
0%0%0%0%0%0%0%
Credit distribution BaghdadNinawaErbilDuhokSalah El DeenKikukBasraSulyamaniaBabilNajafWasitAl-QadisiyyahAnbarDiyala
Diverse loan book:
While Iraq Middle East Investment Bank receives 80% of its deposits from Baghdad, its lending activities are much more distributed geographically with a much smaller 48% of credit activities concentrated in the capital city. As the bank continues to grow its branch network, we believe Baghdad will become even a smaller portion of total over the coming years.
Strong Franchise Value:
Iraq Middle East Investment Bank has also been successful in building the 3rd largest deposit base while maintaining one of the lowest deposit rates in the sector. Only Bank of Baghdad has a larger deposit base with similar interest rate on deposit levels. While North Bank has the largest deposit base, we note that it comes at a much higher cost.
Bank 2012 Deposit
(IDQ billions)
Rank Interest on saving
account
Rank
North Bank 1,262 1 7.00% 10 Bank of Baghdad 1,047 2 4.00% 3 Iraq Middle East Inv. Bank 616 3 4.00% 3 Kurdistan Bank 580 4 N/A n/a Dar Es Salam Bank 534 5 1.00% 1 Credit Bank of Iraq 355 6 3.30% 2 Investment Bank of Iraq 282 7 6.00% 8 Gulf Commercial Bank 261 8 5.50% 7 United Bank 247 9 6.00% 8 Mosul Bank 242 10 5.00% 5 Al-Mansour Bank 136 11 5.00% 5 Source: Central Bank of Iraq32, Rabee Securities 4
Source: Company Reports 33

Sansar Capital Management, LLC, 2013, Copyright © All Rights Reserved
44
-
5,000
10,000
15,000
20,000
2008 2009 2010 2011
Commission FX Spread
0.0%
1.0%
2.0%
3.0%
4.0%
BNOR BIME BBOB BDSI
2011 Interest expense / interest bearing liabilities
High Quality Deposits
Iraq Middle East Investment Bank has one of the longest-duration deposit mixes in the sector. Over 58% of deposits are classified as either saving or fixed-term deposits as compared to 31% for Bank of Baghdad and 40% for North Bank. The greater weight towards longer duration deposit results in slightly higher funding costs for the bank, however, we believe the marginal increase in this cost is well worth the reduced risk it brings to the overall franchise.
Foreign-Exchange Activities
Income earned from wire transfers (commissions and gains on Fx spread) contributed 48% of Iraq Middle East Investment Bank’s (BIME) net revenues in 2011 and has grown at a 29% CAGR since 2008. The recent controversy surrounding the dismissal of the Central Bank governor is likely to impact profits earned from this business.
At the time of writing this report Iraq Middle East Investment Bank had seen material decline in its daily auction participation. The bank was barred from entering the auction market for the month of January and much of February 2013 and only resumed participation in the auction markets during the last week of March 2013.
0%
20%
40%
60%
80%
100%
BDSI BIME BBOB BNOR
Funding mix by type of deposit
LCs
Curent
Savings
Fixed
Source: Company Reports 4
Source: Company Reports 33

Sansar Capital Management, LLC, 2013, Copyright © All Rights Reserved
45
11
2
432
12
1
111
12
11 1 1 1
2014 Branch Distribution BaghdadNinawaErbilDuhokSalah El DeenKikukBasraSulyamaniaBabilNajafWasitAl-QadisiyyahAnbarDiyalaMaysanDhi QarAl-Muthanna
8
22
2
1
1
11
11
2011 Branch Distribution Baghdad
Ninawa
Erbil
Duhok
Salah El Deen
Kikuk
Basra
Sulyamania
Babil
Najaf
Iraq Middle East Bank Branch Growth
0
10
20
30
40
2009 2010 2011 2012 2013 2014+
Number of Branches by Bank, 2011
010
203040
5060
BEFI BBOB BIME BIIB BNOR BGUC BROI BMNS
Branch Network
Iraq Middle East Investment Bank has one of the largest branch networks of any bank in Iraq. As of the end of 2011, the bank had 20 branches - 8 of which were in Baghdad and 12 in other governorates. The bank has an aggressive plan to continue to grow its branch network with plans in place to open 10 to 12 new branches over the next two years and a total of 17 new branches within the next several years. Currently the bank’s network of branches covers 10 governorates with plans to open up branches in each of the 18 governorates over the next few years.
We believe the upcoming acceleration in new branch growth will help Iraq Middle East Bank grow its deposit base in an aggressive manner. Given the bank’s low leverage, we believe a growth in deposits could drive significant improvement in ROE for the bank.
It is worth noting that growth in the number of branches in 2012 did not drive deposit growth during the year as new branch openings for FY 2012 were back-end loaded. We expect to see the full impact of new branches during the FY 2013.
Source: Company Reports33, Central Bank of Iraq10
Source: Company Reports 33

Sansar Capital Management, LLC, 2013, Copyright © All Rights Reserved
46
24%
10%
7%
59%
Major Shareholders
Al-Ghulamfamily
Majeed Hafidh
Sansar Capital
Others
19%
81%
Type of Shareholders
Foreigners
Locals
Shareholder Structure
There have been a number of changes in shareholder structure for Iraqi Middle East Investment Bank since the company last reported its numbers in 2011. We have taken the reported figures along with our own knowledge of some major block trades to reflect below our best estimate of the shareholder structure.
Majeed Al-Hafidh
Mr. Majeed is the Chairman of the board and largest single shareholder of the bank. He is based in Dubai, UAE and overseas all strategic and management decisions. The Hafidh group are industrialists with number of group companies within Iraq.
Sansar Capital
Sansar Capital, the author of this report, is a Singapore-based investment adviser whose clients hold diversified global holdings. As of the date of this report, Sansar Capital holds an interest in Iraqi Middle East Bank on behalf of an advisory client.
Source: Sansar Estimates, Iraqi Depository Center

Sansar Capital Management, LLC, 2013, Copyright © All Rights Reserved
47
Investments
Iraq Middle East Investment Bank has holdings in the following list of companies that were established by the bank. In total the equity investments account for 4.4b IQD or 0.8% of 2011 asset value. The loan exposure to these projects is not specifically disclosed, however, we note that Iraqi law prohibits a company from having more than 300 percent of paid-up capital in the form of loans. Assuming those companies are leveraged to the maximum allowed value, the total loan exposure would be limited to 38.5b IQD, or 5.7% of the total assets.
Company Year Est.
% owned
Paid-up capital (mm)
BIME project
Cost basis (IQDmm)
Market-value
(IQD mm)
Max Loan
allowed Middle East for fish production 1994 29% 300 Yes 741 1,392 900 Middle East software and IT 2007 26% 550 Yes 143 n/a 1,650 Middle East for Real Estate 2007 20% 3,000 Yes 600 n/a 9,000 Aramk for travel & tourism 2007 20% 3,000 Yes 585 n/a 9,000 United Middle East contracting co. 2007 25% 3,000 Yes 750 n/a 9,000 Bara’am brokerage 2008 100% 100 Yes 100 n/a - Finance company for SME lending 2009 11% 2,352 No 269 n/a - Iraqi bank guarantee company 2006 11% 7,877 No 841 n/a - Amwal for electronic banking 2007 10% 3000 n/a 30 n/a 9,000 Rebas – poultry project 2012 n/a Yes n/a n/a Other 351 Total Long-term investments 4,409 38,550 Publicly-traded holdings Total Investments 5,258
In a typical model, the bank seeds the “BIME project” businesses with an equity stake to help establish it. Once the business is established, the bank converts the business into a joint-stock company, sells the stake to other shareholders and retains 10-30% equity interest along with a loan to the business. The loan is provided at an arms-length interest rate.
The bank believes these projects give it an attractive growth opportunity for lending activities. With board seat, they feel they understand the businesses well and that assets are adequately safe-guarded. While we think this strategy would be inappropriate for most global markets due to inherent conflicts of interest, we believe the lack of transparency for lending activities in Iraq makes this a relatively lower risk lending activity for the bank.
Understanding that equity stakes in these projects could eventually be worth significant amounts in the future, some view these interests as an opportunity to indirectly participate in those projects through an ownership stake in the bank.
Source: Company reports 33

Sansar Capital Management, LLC, 2013, Copyright © All Rights Reserved
48
Price-to-Earnings ratio (March 2013)
0
5
10
15
20
25
BDSI BBOB BNOR BIME
Profit Before Taxes (IQD billions)
0
10,000
20,000
30,000
40,000
50,000
60,000
2009 2010 2011 2012
Earnings-per-share
0.000.050.100.150.200.250.300.35
2009 2010 2011 2012
Valuation and Earnings growth
In 2012, Iraqi Middle East Investment Bank (BIME) had the highest return-on-equity and the highest operating profits growth among the large Iraqi banks. Curiously, the bank has the lowest valuation multiple among the banks discussed with a price-to-earnings ratio of 5.0x as of March 31, 2013 as compared to a median price-to-earnings ratio of 12.7x for the five largest banks by deposit and 13.4x for the listed banks sector.
Since 2009, Iraqi Middle East Investment Bank has grown profit before taxes by 330% a CAGR of 63%. Using 2012 as base year for share-count and adjusting for splits, we estimate a pro-forma earnings-per-share growth of 184% a CAGR of 41.6%. The difference in EPS growth and its operating profit growth is due to dilution from new share issuances forced upon the banking sector by the Central Bank of Iraq minimum capital requirement rules
Source: Sansar Capital, Iraq Stock Exchange, Company Reports (15)
Source: Sansar Capital, Company reports 33

Sansar Capital Management, LLC, 2013, Copyright © All Rights Reserved
49
Our Recommendations to the bank
We think highly of Iraqi Middle East Investment Bank and currently view it as one of the highest quality banks in Iraq. The bank is able to attract large sums of quality deposits at very low interest rates. Furthermore, we believe the bank has done a good job of growing its loan book in a responsible manner which has led to very low losses on loans. We believe the bank can further strengthen its capabilities by focusing on the following factors:
• Improve Capital Structure– With assets/equity ratio of just 3.5x Iraqi Middle East Investment Bank is one of the most underleveraged private bank in Iraq. We believe the bank should look at ways to improve its capital structure through better management of leverage
• Improve Customer Screening– We believe the bank needs to do a better job on screening its customers as it relates to foreign-exchange transactions. The bank was barred from participating in daily auctions by the Central Bank when some of its customers initially presenting incomplete documents.
• Improve Investor Communication–Iraqi Middle East Investment Bank could do a better job with its investor relations department. Lack of investor communication has caused the banks share price to lag and it currently, as of the date of this report, trades at one of the lowest multiples in the banking sector

Sansar Capital Management, LLC, 2013, Copyright © All Rights Reserved
50
Kurdistan International Bank (BKUI)
Overview
Kurdistan International Bank (BKUI) is the 4th largest bank in terms of deposits and the largest bank by market-cap. It is also the only bank among the five largest banks that is an Islamic Bank. Foreign-exchange transactions and commissions on fund transfers together accounted for 47% of gross revenue for the bank while revenue from Murabaha, Mudharaba and Musharaka activities accounted for 43% of the total.
It is beyond the scope of this paper to delve into the differences between traditional banks and Islamic banks however we will briefly discuss some of the main activities of Islamic banking as it relates to Kurdistan International Bank.
• Murabaha: The bank finances the asset by buying it and then re-selling the asset to the end-customer at a higher price with a deferred payment plan. Hence, the ‘interest’ component is tapped on in form of higher selling price of the goods or service. The bank takes on ownership of the property for a short time period between the purchase and re-sale
• Mudharaba: Mudharaba arrangements are more akin to asset management than they are to traditional lending activities. The customer deposits cash in the bank account which the bank invests in various assets. The profits and losses are then split between the bank and the customers
• Musharaka: In Musharaka transactions the bank acts like a private equity player. The bank finances the venture and takes an equity stake. In return, the banks’ losses are limited to amount of capital it has invested while its profits are determined on a pre-set ratio
Lending-and-borrowing activities
Kurdistan International Bank generated 22 billion IQD in 2011 from its ‘lending’ activities. This amount was generated on a 77.5b IQD average ‘loan’ for the year – an impressive 28% return on investment. Yet without having the full detail behind every investment and the structure in which it was carried out, it is impossible for us to determine what ‘steady-state’ profits would or should look like.
It is important to note that both the return and risk profile differ drastically from traditional banks and thus it would be wrong to compare these returns with the interest generated by traditional bank. Further, the revenue could be highly volatile and move drastically from one year to the next as we show in the table below.

Sansar Capital Management, LLC, 2013, Copyright © All Rights Reserved
51
Source: Company reports 34
The Central Bank of Iraq does not report data on Kurdistan International Bank deposit interest rate. We suspect this too is likely to be volatile given part of the return to depositors would be a percentage of profit split from the income stream.
We also note that the bank has one of highest deposits per branch ratios with just four branches across Iraq – three of which are in the Kurdistan region.
Source: Company reports 15
Projects
While we do not have details around revenue source and structure by project, the bank has provided basic disclosures around some of those activities.
Kurdistan Taxi Project – KIB started the taxi loan program in 2008 along with two local car companies. The financing is based on Murabaha and financing is provided for 12, 24, and 36 months. KIB has financed 16,000 taxis since the start of this project.
We estimate that this project accounts for the majority of the balance under the “loans” category. A quick math example can better demonstrate this reasoning. If we assume that 16,000 taxis were given out equally over the four-year period (2008-2011) with an average financing period of 24-months and average purchase price of car at USD 12,000 (approximate price for Nissan Sunny vehicles used) then we get to 112.3b IQD of loan value. If we assume a 12-month average financing period, the loan value from this project would drop to 56.1b IQD. At the end of 2011 the total loans outstanding was 61.9b IQD.
BKUI (IQD mm) 2009 2010 2011
Murabaha and Mudharaba “loans” (EOY) 11,504 93,218 61,898
Average for the period 5,752 52,361 77,558
Murbaha and Mudharaba revenue 5,194 2,444 22,062
020406080
100120140160
Kurdistan Bank North Bank Dar Es Salaam Iraqi Middle East Bank of Baghdad
Deposits Per Branch (IQD billions)

Sansar Capital Management, LLC, 2013, Copyright © All Rights Reserved
52
Other Projects – The bank has also disclosed a number of other projects in Hotels, office & apartment buildings, electric power plants, and hospitals sectors but has not provided any additional disclosure around those projects and how they are financed. As mentioned before, the total value of loans outstanding can be fully explained by just the Taxi project and therefore we do not fully understand how those projects are reported.

Sansar Capital Management, LLC, 2013, Copyright © All Rights Reserved
53
0%
5%
10%
15%
KurdistanBank
All Banks Islamic Banks
2012E Return-on-equity comparison
-
10,000
20,000
30,000
40,000
2009 2010 2011 2012
Profit Before Taxes (IQD billions)
0.00
0.05
0.10
0.15
0.20
0.25
2009 2010 2011 2012
Earnings-per-share
0X
5X
10X
15X
20X
25X
Islamic Banks Kurdistan Intl. Bank
P/E Multiple comparison to Islamic Banks
Valuation and Earnings growth
As of March 31, 2013, Kurdistan International Bank traded at P/E multiple of 19.8x which is 30% premium to the 15.2x median P/E multiple for the Islamic banks in Iraq and 50% premium to the banking sector median P/E multiple of 13.4x. The bank reported a 13.7% ROE, which is slightly higher than the 11.1% median ROE for Islamic banks and in-line with 13.2% ROE for the banking sector overall.
Since 2009, Kurdistan International Bank has grown profit before taxes by 119% at CAGR of 29.8%. EPS over the same period grew by 4.9% CAGR as large sums of new rights issue resulted in dilution of earnings.
Source: Sansar Capital, Rabee Securities4
Source: Sansar Capital, Company reports 34

Sansar Capital Management, LLC, 2013, Copyright © All Rights Reserved
54
Our Recommendations to the bank
We believe that Kurdistan International Bank has one of the best investor relations departments amongst the large Iraqi private banks. Yet despite this we find ourselves at a loss in understanding the real drivers of profits and performance at the bank as such we recommend the bank:
• Improve transparency – While Kurdistan International bank has gone well beyond other Iraqi private banks in its communication with investors, we find that the financial statements of the bank still lack enough details around its various projects to help investors make an informed decision about the steady-state profit potential of the bank
• Improve ROE– Kuridstan International Bank has one of the lowest Returns-on-Equity amongst the large Iraqi private banks. In large part this can be attributed to an underleveraged balance sheet and undertuilized assets. The bank earns a high return on its Murabaha and Mudharaba loan books and thus we hope to see the bank continue to grow those activities in a managed way

Sansar Capital Management, LLC, 2013, Copyright © All Rights Reserved
55
0% 1% 2% 3% 4%
BNOR
BIME
BBOB
BDSI
2011 Interest expense / interest bearing liabilities
5.0% 7.0% 9.0% 11.0%
BBOB
BNOR
BDSI
BIME
2011 Interest income/ avg interest bearing assets
0.0% 2.0% 4.0% 6.0% 8.0%
BNOR
BBOB
BIME
BDSI
2011 Net Interest Margin (Net interest income / interest bearing asset)
Dar Es Salaam Investment Bank (BDSI)
Overview
Dar Es Salaam bank is the fifth largest bank as ranked by deposits. Among the 10-largest Iraqi banks, Dar Es Salaam has historically maintained the lowest funding cost with an interest rate on deposits of just 1%. We believe much of this can be attributed to its affiliation with HSBC Asia Holdings which owns 70% of the Bank. Despite having the lowest funding cost, however, BDSI has the lowest ROA among the four largest ‘traditional’ banks as the balance sheet is significantly underutilized with approximately 74% of assets being held as cash.
At the time of writing of this report, it has been widely rumored that HSBC is looking to exit from its stake in Dar Es Salaam Investment Bank. Should HSBC dispose its stake in the bank, we believe the bank is likely to lose the low funding cost advantage it has thus-far enjoyed. It is less likely that depositors would be willing to accept a 1% rate when other banks offer much higher rates and thus the bank would be forced to either raise the interest rates on deposits or lose the customers to other banks. We are perhaps already seeing this play out as Q4 2012 deposits were 11% lower than Q3 2012 and 20% lower than Q4 2011 as compared to a growth of 70% between 2010 and 2011.
Lending-and-Borrowing Activities
According to the Central Bank of Iraq table of interest rates data, Dar Es Salaam Bank had the highest interest rate spread among the four largest ‘traditional’ banks. This stems from Dar Es Salaam having both the highest loan interest-rate as well as the lowest deposit rate among the largest banks.
Source: Company reports 15

Sansar Capital Management, LLC, 2013, Copyright © All Rights Reserved
56
At first glance this spread may seem impressive, however, the bank has carried out little lending activities and has experienced large losses on those loans. As we highlight in the charts below, loans represent only 2.6% of the total assets for BDSI. Furthermore, the bank has the highest provisions for loan-losses amongst the large banks with whopping 27% loan-loss provision in 2011.
As a result of these factors the ROA and ROE for BDSI has actually been lower than the other large Iraqi banks despite the high spread it earns between its lending rate and borrowing rate.
Earnings and Revenue growth
Dar Es Salaam Bank has reported an impressive growth in earnings and revenue over the last couple of years. The bank reported profit before taxes of 17b IQD in 2012, up from 12b IQD in 2011 and 1.2b IQD in 2010 – At the time of writing of this report, we did not yet have the annual report for 2012 and thus cannot parse out the exact source of the earnings growth in 2012 over 2011. However, as the chart below depicts, much of the growth between 2010 and 2011 was driven by big growth in deposit base which allowed the bank to earn a spread margin by simply holding treasuries. As we highlighted before, the deposit base actually shrunk in 2012 and thus this source of profitability is likely to come under pressure going forward.
0%20%40%60%80%
100%
BDSI BBOB BIME BNOR
Asset mix as reported in Q4 2012
Loans Investments Cash Other 0%
5%
10%
15%
20%
25%
30%
BDSI BBOB BNOR BIME
2011 Loan Loss Provisions (% of loans outstanding)
0%5%
10%15%20%25%30%
Middle EastBank
North Bank Bank ofBaghdad
Dar ESSalaam
2012 ROE for Iraqi Banks
Source: Company reports 15
Source: Sansar Capital, Company reports15

Sansar Capital Management, LLC, 2013, Copyright © All Rights Reserved
57
(2,000) -
2,000 4,000 6,000 8,000
10,000 12,000
Cor
pora
te
Mai
n
Irbi
l
Rab
iyee
Kar
bala
Ram
adi
Naf
q A
l-…
Duh
uk
Mos
ul
Bas
ra
Diw
aniy
a
2011 Profit contribution by branch
Source: Company reports 35
Paid-up Capital Rule – didn’t receive the memo?
We note that among the five largest Iraqi banks by deposits, Dar Es Salaam Bank is the only bank that has not reached the minimum equity capital threshold set by the Central Bank of Iraq. As a reminder to the reader, the Central Bank of Iraq established rules requiring all banks to have a minimum equity capital of 250b IQD by June 2013. The bank set two interim targets of 100b IQD by June 2011 and 150b IQD by June 2012.
As of March 2013, Dar Es Salaam Bank (BDSI) was the only bank that had paid-up capital below 150b IQD. As per the Q4 2012 filings, Dar Es Salaam had 105b IQD of paid-up capital. We estimate the bank generated circa 14.5b IQD in Net Income for the year. If the bank is able to transfer that entire amount to paid-up capital it would still be at circa 120b IQD of paid-up capital. Hence investors in Dar Es Salaam Bank are likely to see a large right issuance equivalent to 108% of the amount currently invested.
Branch Network
Dar Es Salaam bank had 11 bank branches at the end of 2011. The vast majority of the revenue and profits however were attributed to corporate-office operations with remaining branches having negative profit attribution.
- 2,000 4,000 6,000 8,000
10,000 12,000 14,000 16,000
Interest ontreasury
Loaninterest
FX revenueComissions
Dar Es Salaam Revenue 2010 vs. 2011
2010
2011
- 100 200 300 400 500 600 700
2009 2010 2011 2012
Dar Es Salaam Deposits (IQD B)
Source: Company reports 35

Sansar Capital Management, LLC, 2013, Copyright © All Rights Reserved
58
Large Bank Price-to-Earnings ratio (March 2013)
0
5
10
15
20
25
BDSI BBOB BNOR BIME
Profit Before Taxes (IQD billions)
-
5,000
10,000
15,000
20,000
2009 2010 2011 2012
Earnings-per-share
0.00
0.05
0.10
0.15
0.20
2009 2010 2011 2012
P/E Multiple for banks with strategic ownership interests
0X5X
10X15X20X25X
Banks with strategicowners
Dar Es Salaam
Valuation and Earnings growth
As of March 31, 2013 Dar Es Salaam Investment Bank was trading at 20.6x price-to-earnings multiple making it the most expensive bank among the four largest “traditional” Iraqi banks. The bank also trades at a 22% premium to other banks with large strategic foreign ownership interests. We believe this premium is driven by the banks’ association with HSBC and could come under threat should HSBC complete its exit as some sources have speculated.
Since 2009, Dar Es Salaam bank has grown profit before taxes by 58%, a CAGR of 16.5%. EPS over the same period has declined by 7.6% as the bank has mostly grown equity capital through new share issuances. The bank has seen a dramatic turnaround in profit-before taxes since 2010 as it was able to attract large sums of deposits at relatively no cost. This helped the bank earn a spread between its deposit rate and the interest on treasury investments.
Source: Sansar Capital, Rabee Securities 4
Source: Sansar Capital, Company reports 35

Sansar Capital Management, LLC, 2013, Copyright © All Rights Reserved
59
Our Recommendations to the bank
Dar Es Salaam Investment Bank has the unique advantage of having the lowest funding cost in the sector. However, this has proven to be a ‘curse’ rather than a ‘blessing’ as the bank simply earned profit by re-depositing the cash at higher interest rates. This arbitrage helped the bank earn handsome profits in the short-term at expense of long-term growth. With HSBC potentially exiting Dar Es Salaam we see substantial risk in this business model as the cost of funding could increase significantly. We encourage the bank to refocus its efforts on the following activities:
• Build-out Lending Capabilities – Loans and advances represented just 2.7% of total assets in 2011. In the past the low funding cost for the bank allowed it to earn a reasonable spread without carrying out any lending activities. We believe the bank needs to re-focus its efforts on improving its lending department if it is to stay competitive long-term and grow with the Iraqi economy
• Improve Investor Communication – Despite being majority owned by HSBC Asia we found that Dar Es Salaam Investment Bank has one of the weakest investor relations departments as representatives of the bank have repeatedly failed to attend investor events even if they were being held in Iraq

Sansar Capital Management, LLC, 2013, Copyright © All Rights Reserved
60
IMPORTANT DISCLOSURES
This report has been prepared and published by Sansar Capital Asia Pte. and Sansar Capital Management, LLC (together, “Sansar Capital”) for informational and education purposes only and is not intended to be relied upon as a forecast or investment advice. This report is based on public information and proprietary research of Sansar Capital as of the specified date and may be stale thereafter. Sansar Capital has no obligation to update this information and makes no representations or warranties with respect to the accuracy or completeness of the information herein. Information contained herein has been obtained from third party sources and Sansar Capital has not undertaken to independently verify all such sources and there is no guarantee that such sources are accurate or reliable.
No Investment Advice. The information provided herein is for your informational and educational purposes only and no investment advice is provided hereby. Nothing contained herein constitutes a solicitation, recommendation, endorsement, or offer by Sansar Capital to buy, sell or hold any securities or other financial instruments or to pursue any investment style or strategy. The securities, instruments, companies and/or strategies discussed herein may not be suitable or appropriate for all investors. The appropriateness of a particular investment or strategy will depend on an investor’s individual circumstances and objective. All investments involve risks which are not discussed here. Furthermore, investing in non-U.S. markets, and particularly in frontier markets such as Iraq, generally entails greater risk than those normally associated with U.S. markets, such as political, currency, economic and market risks.
Forward-Looking Statements and Opinions. Certain information contained herein constitutes forward-looking statements, which can be identified by the use of terms such as “may”, “will”, “should”, “expect”, “anticipate”, “project”, “estimate”, “intend”, “continue” or “believe” (or negatives thereof) or other variations thereof. Due to various risks and uncertainties, actual events or results or actual performance may differ materially from those reflected or contemplated in such forward-looking statements, and there can be no assurance that actual events will be consistent with any such statements. Additionally, other events not taken into account may occur and may significantly impact any projections or forward-looking statements. As a result, investors should not rely on such forward-looking statements. Certain statements herein reflect opinions, views or analysis of Sansar Capital or its employees. There is no guarantee that such opinions, views or analysis will ultimately prove to be accurate.
Conflicts of Interest. Sansar Capital may hold a financial interest in one or more of the securities, instruments or companies discussed herein, or a competitor of such companies, or pursue a strategy substantially similar to a strategy described herein on behalf of one or more of its investment advisory clients.
The information provided here does not constitute tax or legal advice. Investors should speak to their tax professional for specific information regarding their tax situation and any potential tax or other implications that may result from pursuing a particular investment or strategy.

Sansar Capital Management, LLC, 2013, Copyright © All Rights Reserved
61
None of the information contained herein has been filed with the Securities and Exchange Commission, any securities administrator under any state securities laws or any other governmental or self-regulatory authority. No governmental authority has passed on the merits or the adequacy of the information contained herein. Any representation to the contrary is unlawful.
No part of this material may be reproduced in any form, or referred to in any other publication, without express written permission from Sansar Capital.

Sansar Capital Management, LLC, 2013, Copyright © All Rights Reserved
62
SOURCES
1 International Monetary Fund. “World Economic Outlook April 2013.” International Monetary Fund. Web. http://www.imf.org/external/pubs/ft/weo/2013/01/pdf/text.pdf 2 International Energy Agency. “Iraq Energy Outlook.” November 12, 2012. International Energy Agency. Web. http://www.worldenergyoutlook.org/media/weowebsite/2012/iraqenergyoutlook/Fullreport.pdf 3 World Bank. “Open Data Catalog.” January 18, 2013. World Bank. Web. https://www.google.com.om/publicdata/explore?ds=d5bncppjof8f9_&met_y=ny_gdp_mktp_cd&idim=country:IRQ&dl=en&hl=en&q=iraq%20gdp 4 Bank of Baghdad. “Annual Financial Report 2010.” “Annual Financial Report 2011.” North Bank. “Annual Financial Report 2010.” “Annual Financial Report 2011.” Iraqi Middle East Investment Bank. “Annual Financial Report 2010.” “Annual Financial Report 2011.” Dar Es Salaam Investment Bank. “Annual Financial Report 2010.” “Annual Financial Report 2011.” Kurdistan International Bank. “Annual Financial Report 2010.” “Annual Financial Report 2011.” Rabee Securities. “Rabee Securities Bank Reports: December 2012, February 2013, March 2013” 5 Iraq Body Count. “Documented Civilian Deaths from Violence.” Iraq Body Count. February 28, 2013. Web. www.iraqbodycount.org 6 New York Daily News. “Chicago observes a grim milestone: the 500th murder of 2012.” New York Daily News. Web. http://www.nydailynews.com/news/national/chicago-grim-milestone-500-murders-2012-article-1.1229420 7 Transparency International. “Corruption Perceptions Index 2012.” Transaparency International. Web. http://cpi.transparency.org/cpi2012/results/ 8 U.S. Agency for International Development. “Iraqi Banking’s Great Leap Forward.” U.S. Agency for International Development. Web. http://iraq.usaid.gov/node/349 9 World Bank. “Open Data Catalog, Domestic Credit provided by banking sector (% of GDP).” January 18, 2013. World Bank. Web. https://www.google.com.om/publicdata/explore?ds=d5bncppjof8f9_&met_y=ny_gdp_mktp_cd&idim=country:IRQ&dl=en&hl=en&q=iraq%20gdp#!ctype=l&strail=false&bcs=d&nselm=h&met_y=fs_ast_doms_gd_zs&scale_y=lin&ind_y=false&rdim=region&idim=country:IRQ&idim=region:MNA&ifdim=region&hl=en_US&dl=en&ind=false 10 Central Bank of Iraq. “Annual Statistical Bulletin 2011.” Central Bank of Iraq http://www.cbi.iq/documents/Annual_2011f.pdf 11 Rabee Securities. “Initial Listing Report: Asiacell Communication PJSC: January 2013” 12 Central Bank of Iraq. “Annual Report for Financial Stability in Iraq.” Central Bank of Iraq. http://www.cbi.iq/documents/Financial%20Stability%20Report%202011.pdf

Sansar Capital Management, LLC, 2013, Copyright © All Rights Reserved
63
13 The World Bank. “Republic of Iraq Financial Sector Review” 2011. The World Bank
14 Central Bank of Iraq. “Key Financial Indicators.” Central Bank of Iraq. Web. http://www.cbi.iq/documents/key%20financial.xls 15 North Bank. “Annual Financial Report 2011.”, Bank of Baghdad. “Annual Financial Report 2011.” , Middle East Investment Bank. “Annual Financial Report 2011.”, Dar Es Salaam Investment Bank. “Annual Financial Report 2011.”, Kurdistan International Bank. Annual Financial Report 2011.” 16 Central Bank of Iraq. “Foreign Exchange Actions.” Central Bank of Iraq. Web. http://www.cbi.iq/documents/CBI_FOREIGN_EXCHANGE_AUCTIONS.pdf 17 Special Inspector General for Iraq Reconstruction. “Quarterly Report to the United States Congress.” October 30, 2012. Special Inspector General for Iraq Reconsruction. Web. http://www.sigir.mil/publications/quarterlyreports/index.html
18 Central Bank of Iraq. “Press release dated 22/2/2013” Central Bank of Iraq. Web. http://www.cbi.iq/documents/press%20for%2022-2-2013.pdf 19 Central Bank of Iraq. “Table of Interest Rates.” Central Bank of Iraq. Web. Page 24. http://www.cbi.iq/documents/Table%20of%20interest%20rates.pdf 20 World Bank. “Open Data Catalog, Interest Rate Spread (lending Rate minus deposit rate).” January 18, 2013. World Bank. Web.https://www.google.com.om/publicdata/explore?ds=d5bncppjof8f9_&met_y=ny_gdp_mktp_cd&idim=country:IRQ&dl=en&hl=en&q=iraq%20gdp#!ctype=l&strail=false&bcs=d&nselm=h&met_y=fr_inr_lndp&scale_y=lin&ind_y=false&rdim=region&idim=country:IRQ&idim=region:MNA&ifdim=region&hl=en_US&dl=en&ind=false 21 Bank of Baghdad. “Annual Financial Report 2011.”, Middle East Investment Bank. “Annual Financial Report 2011.” 22 S&P Capital IQ. Capital Adequacy for US Banks 23 S&P Capital IQ. Non-Performing Loan Ratios for US banks 24 Rabee Securities. “Rabee Securities Bank Reports: December 2012, February 2013, March 2013”
25 S&P Capital IQ. Return On Assets for US banks 26 Central Bank of Iraq. “CBI Annual report for financial stability” page 34 link: http://www.cbi.iq/documents/Financial%20Stability%20Report%202010.pdf 27 S&P Capital IQ. Return on Assets and Leverage Ratios for US Banks 28 Central Bank of Iraq. “Central Bank Annual Report for Financial Stability (2010)” Web. http://www.cbi.iq/documents/Financial%20Stability%20Report%202010.pdf
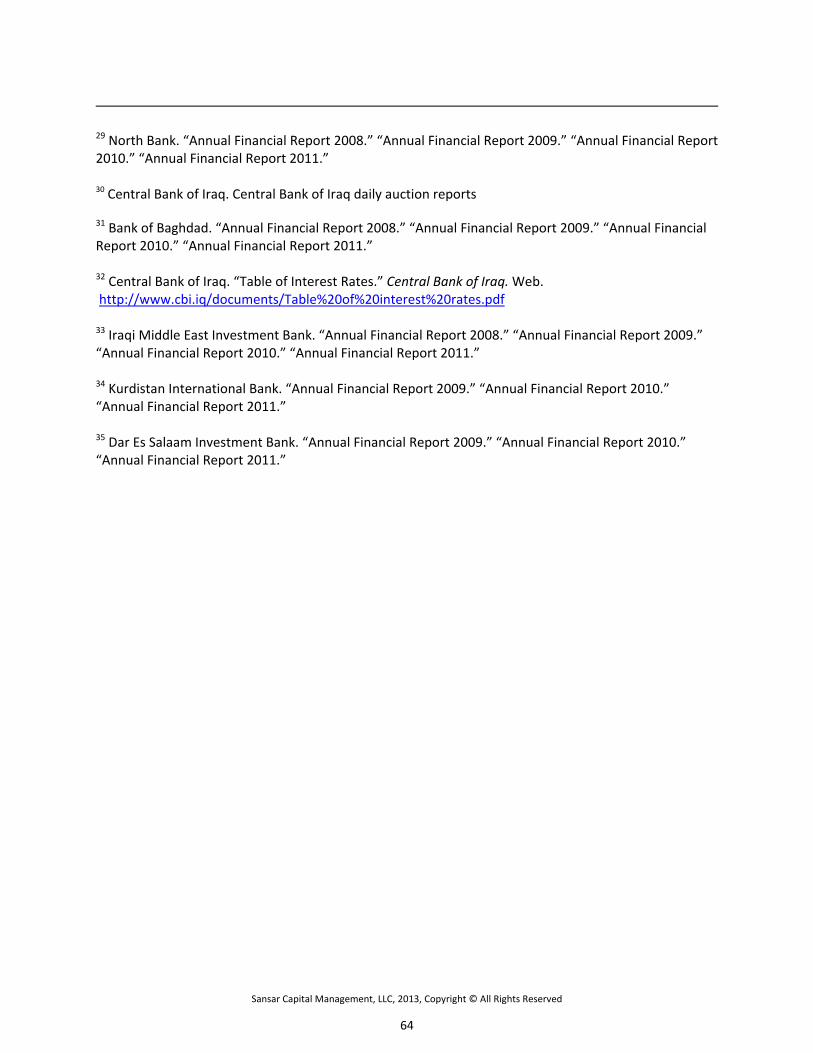
Sansar Capital Management, LLC, 2013, Copyright © All Rights Reserved
64
29 North Bank. “Annual Financial Report 2008.” “Annual Financial Report 2009.” “Annual Financial Report 2010.” “Annual Financial Report 2011.” 30 Central Bank of Iraq. Central Bank of Iraq daily auction reports
31 Bank of Baghdad. “Annual Financial Report 2008.” “Annual Financial Report 2009.” “Annual Financial Report 2010.” “Annual Financial Report 2011.” 32 Central Bank of Iraq. “Table of Interest Rates.” Central Bank of Iraq. Web. http://www.cbi.iq/documents/Table%20of%20interest%20rates.pdf 33 Iraqi Middle East Investment Bank. “Annual Financial Report 2008.” “Annual Financial Report 2009.” “Annual Financial Report 2010.” “Annual Financial Report 2011.” 34 Kurdistan International Bank. “Annual Financial Report 2009.” “Annual Financial Report 2010.” “Annual Financial Report 2011.” 35 Dar Es Salaam Investment Bank. “Annual Financial Report 2009.” “Annual Financial Report 2010.” “Annual Financial Report 2011.”