A Circuit-Based Approach for Electro-Thermal Modeling …mbahrami/pdf/2016/A Circuit-Based Approach...
15
A Circuit-Based Approach for Electro-Thermal Modeling of Lithium-Ion Batteries Maryam Yazdanpour 1 , Peyman Taheri 1 , Abraham Mansouri 2 , Ben Schweitzer 3 1 Laboratory for Alternative Energy Conversion (LAEC), School of Mechatronic Systems Engineering, Simon Fraser University, Surrey, BC V3T 0A3, Canada 2 Department of Mechanical Engineering, American University in Dubai, Dubai, 28282, UAE 3 AllCell Technologies, Chicago, Illinois 60609, USA 1 E-mail: [email protected] Abstract—A two-dimensional electro-thermal model has been developed to provide a tool that can be used to gain a better understanding of dynamic behaviour of lithium- ion (Li-ion) batteries. The model incorporates an equivalent circuit model (ECM) and a coupled electro-thermal model to simulate the non-uniform heat generation rate, the temperature distribution, and the voltage response of the Li-ion cell across variety of operating conditions. The ECM is comprised of two resistance-capacitance (RC) networks, one sires resistor, and one voltage source that are all function of state-of-charge (SOC) and temperature (T ). Hybrid pulse power characterization (HPPC) test is applied to extract the ECM parameters at different ambient temperature. The simulations results of the cell model under constant current discharge tests show a good agreement with the experimental data at different environ- mental temperature. The developed model can be employed for battery thermal management system (BTMS) and battery management system (BMS) design with a light computational demand. Battery thermal modelling, Lithium-ion battery, Electro- thermal model, Equivalent-circuit-model I. Introduction Li-ion batteries have been identified as a promising solu- tion to meet the increasing demands for alternative energy in electric and hybrid electric vehicles (EVs and HEVs) (1). Among various types of energy storage solutions, Li- ion batteries feature relatively high power and high specific energy, high operating voltage, longevity, and low self- discharge rates (2). Safety issues and cost (related to cycle and calendar life) are the main obstacles to the development of large fleets of vehicles on public roads equipped with Li-ion batteries. Li-ion batteries can generate a large amount of heat while in use especially at severe discharge rates and high temperature which involve high rate of exothermic electrochemical reactions and Joule heating. Such excessive heat, if not removed appropriately from the battery pack, can cause shortened battery life, thermal runaway, electrolyte fire, and in extreme cases explosions. Moreover,eexposure of Li-ion batteries to sub-freezing environment drastically reduces their energy and power delivery. Hence, for optimal performance, the battery pack should operate within a controlled temperature range, ideally 20 ◦ C - 40 ◦ C, and temperature distribution along the cells and across the module should be as uniform as possible. Hence, the development and implementation of Li-ion batteries, particularly in automotive applications, requires a substantial diagnostic and practical modeling efforts to fully understand the thermal characteristics in the batteries across various operating conditions (3; 4; 5). Thermal modeling prompts an 978-1-5090-2336-3/16/$31.00 ©2016 IEEE 113 32nd SEMI-THERM Symposium
Transcript of A Circuit-Based Approach for Electro-Thermal Modeling …mbahrami/pdf/2016/A Circuit-Based Approach...

A Circuit-Based Approach for Electro-Thermal
Modeling of Lithium-Ion BatteriesMaryam Yazdanpour 1 , Peyman Taheri 1 , Abraham Mansouri 2 , Ben Schweitzer 3
1 Laboratory for Alternative Energy Conversion (LAEC), School of Mechatronic Systems Engineering,
Simon Fraser University, Surrey, BC V3T 0A3, Canada2 Department of Mechanical Engineering, American University in Dubai, Dubai, 28282, UAE
3 AllCell Technologies, Chicago, Illinois 60609, USA1E-mail: [email protected]
Abstract—A two-dimensional electro-thermal model hasbeen developed to provide a tool that can be used to gaina better understanding of dynamic behaviour of lithium-ion (Li-ion) batteries. The model incorporates an equivalentcircuit model (ECM) and a coupled electro-thermal model tosimulate the non-uniform heat generation rate, the temperaturedistribution, and the voltage response of the Li-ion cell acrossvariety of operating conditions. The ECM is comprised of tworesistance-capacitance (RC) networks, one sires resistor, andone voltage source that are all function of state-of-charge (SOC)and temperature (T ). Hybrid pulse power characterization(HPPC) test is applied to extract the ECM parameters atdifferent ambient temperature. The simulations results of thecell model under constant current discharge tests show a goodagreement with the experimental data at different environ-mental temperature. The developed model can be employedfor battery thermal management system (BTMS) and batterymanagement system (BMS) design with a light computationaldemand.
Battery thermal modelling, Lithium-ion battery, Electro-
thermal model, Equivalent-circuit-model
I. Introduction
Li-ion batteries have been identified as a promising solu-
tion to meet the increasing demands for alternative energy
in electric and hybrid electric vehicles (EVs and HEVs)
(1). Among various types of energy storage solutions, Li-
ion batteries feature relatively high power and high specific
energy, high operating voltage, longevity, and low self-
discharge rates (2).
Safety issues and cost (related to cycle and calendar
life) are the main obstacles to the development of large
fleets of vehicles on public roads equipped with Li-ion
batteries. Li-ion batteries can generate a large amount of
heat while in use especially at severe discharge rates and
high temperature which involve high rate of exothermic
electrochemical reactions and Joule heating. Such excessive
heat, if not removed appropriately from the battery pack, can
cause shortened battery life, thermal runaway, electrolyte
fire, and in extreme cases explosions. Moreover,eexposure
of Li-ion batteries to sub-freezing environment drastically
reduces their energy and power delivery.
Hence, for optimal performance, the battery pack should
operate within a controlled temperature range, ideally 20 �C
- 40�C, and temperature distribution along the cells and
across the module should be as uniform as possible. Hence,
the development and implementation of Li-ion batteries,
particularly in automotive applications, requires a substantial
diagnostic and practical modeling efforts to fully understand
the thermal characteristics in the batteries across various
operating conditions (3; 4; 5). Thermal modeling prompts an
978-1-5090-2336-3/16/$31.00 ©2016 IEEE 113 32nd SEMI-THERM Symposium

understanding of the battery thermal behaviour beyond what
is possible from the experiments and it can provide a basis
for exploring thermal management strategies for batteries in
hybrid electric vehicles (HEVs) and electric vehicles (EVs)
(6).
To accurately predict the thermal response of the Li-ion
batteries across variety of operating conditions, it is essential
to evaluate the pattern and magnitude of heat generation and
heat diffusion inside the cell. This can be done through a
physics-based thermo-electrochemical models; nonetheless,
such detailed models are mostly recommended for cell
design and optimization purposes due to their high fidelity,
and they are not practical for real-time applications due to
their high order of complexity. Alternatively, when a battery
exists and the lab-generated data for the battery is available,
empirical-based models which mimic the electrochemical
performance of the battery can be developed. The simplicity
of robustness of such models enables them to be applied
in real-time embedded systems. Equivalent circuit models
(ECMs) (7; 8), and fitting function models (9), which is a
simplified version of ECMs, are common methodologies in
this categories. In our previous works (10; 11; 12) the fitting
function approach was applied to develop analytical tools
for thermal simulation of Li-ion batteries. This paper that
forms a sequel to our previous works, the ECM approach
is employed to provide a comprehensive model for simu-
lating the distributed electro-thermal response of the Li-ion
batteries across variety of operating conditions.
II. FORMULATION OF THE PROBLEM
Figure 1a schematically shows the core of a pouch-type
lithium-ion battery that is constructed of several cell assem-
blies, also known as electrode assemblies. In Fig. 1b, a single
cell assembly is depicted. For better illustration, different
layers in the cell assembly are shown separated while in
the actual battery these layers are compressed; see Fig. 1b.
Each cell assembly includes a negative electrode, two layers
of separator sheets, and a positive electrode. The electrodes
include active materials, required in the battery chemistry,
coated on both sides of current collector foils. In most Li-
ion batteries, the current collector in positive and negative
electrodes are foils of aluminum and copper, respectively.
The separator sheet is an electrically inert membrane for
transportation of cations (Li+) between the electrodes. All
layers, except current collectors, are porous and are soaked
in a concentrated electrolyte liquid. The electrode tabs are
the current collector foils extending outside the electrode
plates for the purpose of electrical connection, and they are
not covered by active materials. Arrows in Fig. 1b present
current streamlines during discharge processes. The through-
plane straight arrows represent the transport of Li+ between
the electrodes, i.e., transfer current. The in-plane arrows
in x-y plane represent the transport of charges (e�), i.e.,
the electrical current, on the electrode layers. The direction
of transfer and electric currents is reversed for a charging
process. As shown in the Fig. 1b, electrical constriction
occur at the tabs of positive and negative electrodes. For
the sake of convenience, the transfer current on both sides
of each electrode can be considered to occur on one side of
the electrodes. This approach is common in the literature.
A. Electrical model
A dimensional analysis can be performed to show that
owing to the small thickness of layers in the cell assembly,
compared to their dimensions in x- and y-directions, the
distribution of potential in the electrodes is two-dimensional
in x-y plane (13). Accordingly, the governing differential
equation for the charge balance in each electrodes reads
�— · ij
+J ·n
j
delec, j= 0 ( j = p,n) (1)
where ij
= {i
x
, iy
,0}j
is the in-plane current density vector
on each electrode (A m�2). The subscript j corresponds
to domains of the positive electrode Wp
and the negative
electrode Wn
. The reaction current density vector on the elec-
trodes is J = {J
x
,Jy
,J} in (A m�2), where J
x
and J
y
are side
reactions and are considered to be negligible. The through-
plane component of the reaction current, J, referred to as
transfer current, corresponds to the intercalation of lithium

ActiveMaterial
(+)
SeparatorSheet
ActiveMaterial
(-)
x
y
z
CurrentCollector
(Al)
CurrentCollector
(Cu)
Tab
J/2
J/2
ActiveMaterial
(-)
ActiveMaterial
(+)Separator
Sheet
Current, Icell
Current, Icell
a b
BatteryTabs
a
c
J/2
Tab
Fig. 1. a) Core (electrode-separator stack) of a pouch-type lithium-ion battery is shown. b) Schematic of a single cell assembly in the battery is shown. The
battery core is constructed by repeating the cell assembly. Different layers of the cell are separated for the sake of presentation. The arrows in z-direction
correspond to transfer current, the transport of Li+ from the negative electrode to the positive electrode during a discharge process. The arrows in x-y plane
represent current streamlines on electrodes.
ions in active materials on both sides of the electrodes. The
electrode thickness in z-direction is delec, j in (m), and nj
is
the unit normal vector on each electrode surface pointing
outward; np
= {0,0,�1} and nn
= {0,0,+1}.
According to the Ohm’s law, components of ij
are related
to the potential distribution via
i
x, j =�seff, j∂F
j
∂x
and i
y, j =�seff, j∂F
j
∂y
( j = p,n) (2)
where x and y indicate the spatial position (m), and Fj
=
Fj
(x,y) is the two-dimensional potential distribution in the
electrode (V).
The quantity seff, j is the effective electrical conductivity
(S m�1), that for each electrode is
seff, j =1
delec, j(dcc, j scc, j +2dam, j sam, j) ( j = p,n)
where
delec, j = dcc, j +2dam, j ( j = p,n)
and dcc, j and dam, j are thicknesses of current collector and
active material layers, respectively. Electrical conductivity
of the current collector and the active material are denoted
by scc, j and sam, j. As depicted in Fig. 2, each electrode
x
y
a
c
e
Ω j
b
j
Fig. 2. Two-dimensional schematic of electrodes in x-y plane. Width and
height of electrodes and width of the electrode tab are the same for both
positive and negative electrodes. The distance of the tab centre from y-axis,
denoted by e
j
, differs between the electrodes.
can be considered as a rectangular domain in x-y plane of
width a and height c. The through-plane current enters (or
exits) the domain through its surface in x-y plane, whereas
the in-plane current is allowed to exit (or enter) the domain

through the tab constriction of width b on the boundary at
y = c. The distance between the centre of the tab and y-axis
is denoted by e
j
.
With reference to Fig. 2, the relevant boundary conditions
for Eq. (1) at the positive domain are
�seff,p∂F
p
∂x
= 0 at x = 0 (3a)
�seff,p∂F
p
∂x
= 0 at x = a (3b)
�seff,p∂F
p
∂y
= 0 at y = 0 (3c)
�seff,p∂F
p
∂y
= itab,p at e
p
� b
2< x < e
p
+b
2, y = c
(3d)
�seff,p∂F
p
∂y
= 0 at e
p
+b
2< x < e
p
� b
2, y = c (3e)
Similarly, for the negative domain
�seff,n∂F
n
∂x
= 0 at x = 0 (4a)
�seff,n∂F
n
∂x
= 0 at x = a (4b)
�seff,n∂F
n
∂y
= 0 at y = 0 (4c)
Fn
= 0 at e
n
� b
2< x < e
n
+b
2, y = c (4d)
�seff,n∂F
n
∂y
= 0 at e
n
+b
2< x < e
n
� b
2, y = c (4e)
The above boundary conditions imply that no current
passes through boundaries of Wp
and Wn
except for the tab
boundaries. In Eq. (3d), itab,p is the in-plane current density
(A m�2) at the tab of positive electrode
itab,p =Icell
bdelec,p(5)
where Icell is the applied discharge current (A) for a single
cell (electrode) assembly, and bdelec,p is the cross-sectional
area of the positive tab. In Eq. (4d), potential at the tab
boundary of the negative electrode is set to zero in order to
provide a reference for voltage distribution (14).
B. Equivalent circuit model
Distribution of the transfer current density, J, which
appears in the electrical model [cf. Eq. (1)], is dictated by
the local rate of electrochemical reactions in electrodes. For
an accurate description of J a distributed electrochemical
model (6; 13) is preferred. In this study, instead of us-
ing an electrochemical model, an equivalent circuit model
(15; 16; 17; 18) is employed to predict the time dependent
distribution of J in the experimental battery during different
operating conditions.
ECMs are the lumped models that utilize the electrical
circuit elements to simulate the current-voltage characteri-
zations of the cell with the modest computational effort. A
typical circuit is composed of a voltage source representing
open-circuit-voltage (OCV), an internal resistance account-
ing for the ohmic losses, and parallel resistance-capacitor
(RC) pairs accounting for activation and concentration po-
larization of the cell during the operation. The number of
RC networks in the equivalent circuit is an important factor
that determines the accuracy and complexity of the model.
The sufficient number of RC branches in the ECM can be
defined from the transient response of the cell voltage during
the relaxation phase when the pulse is removed. Normally,
the experimental data is fitted to a few equivalent circuits
with different number of RC branches and the one that can
provide the best match to the experimental data is often
selected. The parameters of the ECM are a function of T
and SOC of the cell and should be identified from a set of
characterization tests conducted at different T and SOC.
Equivalent circuit model development: The cell is charac-
terized by HPPC (19) tests over a range of T and SOCs. In
fact the HPPC profile incorporates both charge and discharge
pulses to derive the internal resistance and polarization
resistances of the cell as a function of SOC with sufficient
resolution to reliably establish cell voltage response time
constant during discharge, rest, and charge (regen) operating
regimes.
The sufficient number of RC-network in the model is
determined by fitting the ECM to the transient response
of the cell voltage during relaxation phase when the pulse
current is halted. The data is separately fitted to three
different models: 1) one RC-network pair (first-order ECM),
2) two pairs of RC-network (second-order ECM), and 3)
three pairs of RC-network (third-order ECM), the results

are presented in Fig. 3. The R-squared values for fitted
model with one, two, and three pairs of RC networks are
0.907, 0.9912, and 0.995, respectively. The results show
that one RC-network loop may not produce a satisfactory
match to the experimental data. Whereas, the second-order
ECM can fit the experimental data with a R-squared value
comparable with that of third-order model but with a lower
computational cost. Thus, as a compromise between the
accuracy and complexity, the model with two pairs of RC-
network is selected for this study; the schematic of the
considered model is presented in Fig.4.
As shown in Fig. 4, the selected model consists of six
components: Voc as cell OCV, an internal resistance, R0,
and two parallel RC-network each consists of one resistance
(R1,R2) and one capacitor (C1,C2), each representing dif-
ferent aspects of the cell. Voc represents the battery open
circuit voltage and R0 is the ohmic or internal resistance
of the cell assembly responsible for the immediate voltage
drop or rise when the battery is being discharged or charged.
Two parallel pairs of RC are responsible for the transient
response of the cell. R1 and C1 describe the fast dynamics of
the cell, depicting the reaction kinetics. R2 and C2 represent
the slower dynamics of the cell, in the order of hours and
are more representative of the diffusion processes in the
electrolyte and active material.
The electrical response of the presented circuit can be
formulated as:
V =VOC �V0 �V1 �V2 (6)
where Voc is a function of SOC that is calculated as;
SOC = SOC0 �1
capbatt·Z
t
0|I (t)| ·dt (7)
where Qbatt is the nominal capacity of the battery and the
constant 3600 has the unit of second/hour. From Kirchhoff’s
law, three voltage losses terms (V1, V2, V3) can be found as
follow:
V0 = I ·R0 (8a)V1
Req,1+Ceq,1
dV1
dt
= Ibatt (8b)
V2
Req,2+Ceq,2
dV2
dt
= Ibatt (8c)
The parameter estimation consists of two main steps: i)
cycling the battery with a standard characterization test,
HPPC profile in this study, at different operating temper-
atures, ii) extracting the parameters from collected experi-
ments. The main goal of the parameter estimation process
is to find best possible parameter values to make the model
match the experimental data. By iteratively comparing the
simulation result against experiment data, the model param-
eters for the specific operating condition can be found as an
optimal fit. The fitting process is performed at each particular
SOC and T . Figure. 5 shows a sample of fitting procedure
performed at 50% of SOC and 0�C. As reported in Fig. 5, the
match between the fitted and measured voltage is excellent
with a maximum relative difference (%) between the fitted
and measured voltage of 1%.
The results of the parameter estimation are plotted in
Fig. 6, which shows the estimated parameters as function
of SOC and T . Note that the battery consists of 42 cell
assembly units all connected in parallel, while estimated
parameters are related to the battery itself, representing
the equivalent resistors and capacitors of all 42 units. The
resistances and capacitors for each individual cell assembly
unit can be calculate based on the equivalent network rule.
The equivalent capacitance of the parallel capacitors inside
the battery is the sum of the individual capacitance.
Ceq,i =Ncell
Ân=1
C
n,i (i = 1,2) (9)
The equivalent resistance of resistances connected in parallel
is reciprocals of the individual resistances;
1Req,i
=Ncell
Ân=1
1R
n,i(i = 0,1,2) (10)
In above equations, it is assumed that the resistance and
capacitance of individual cell are identical. By assuming that

Fig. 3. Fitting the measured voltage (symbols) during relaxation phase (when HPPC pulse is removed) to first-order (blue line), second-order (green line), and
third-order (black line) ECM, to determine the optimum number of RC pairs that can accurately describe the voltage behaviour of the experimental battery
with the modest computational effort.
1R
0R
ovV V
1C
V1
2R
2C
V2
V0
Fig. 4. Schematic of the selected equivalent circuit with two RC-pairs representing a single cell (electrode) assembly.
each cell assembly unit has an identical capacity, the nominal
capacity for each unit can be define as;
Qcell =Qbatt
Ncell(11)
Similarly, the current passing through each unit cell is;
Icell =Ibatt
Ncell(12)
In Eqs. (9)-(12), Ncell denotes the number of cell assembly
units inside the battery.
In the electrode where the electrochemical reaction oc-
curs, local cell voltage from Eq. (6) is the same as the poten-
tial difference calculated from the charge balance equations
[cf. Eqs. (1) and (2)] (17);
V =Voc (x,y)�V0 (x,y)�V1 (x,y)�V2 (x,y)=Fp
(x,y)�Fn
(x,y)
(13)
From Eq. (13), V0 can be defined as:
V0 =Voc (x,y)� [Fp
(x,y)�Fn
(x,y)]�V1 (x,y)�V2 (x,y)
(14)
from which the reaction current density, J, can be defined
as follow;
J =V0
R0 ac
(15)
As depicted in Fig. 2, a and b represent the width and the
height of the cell, respectively.
C. Thermal model
In the electrical model it was assumed that potential
distribution is independent of z-direction. This assumption
can be extended to the thermal model as well; since thick-
ness of electrodes in z-direction is very small compared to
their dimensions in x- and y-directions, heat will conduct

Measured voltage
Calculated voltage
Fig. 5. Results of the parameter estimation process performed at 50% of SOC and 0�C. a) fitted voltage against the measured voltage and b) the relative
difference (%) between the measured and fitted data.
b
eq
,1R
[m]
Ω
eq,2
C[k
F]
oc
V[V
]
T = 45°CT = 0°C
T = 25°C T = 55°C
eq
,1C
[kF
]
SOC [%]SOC [%]
SOC [%]
eq,2
R[m
]Ω
SOC [%]
SOC [%]
2
4
6
8
10
12
SOC [%]
eq
,0R
[m]
Ω
a c
d e f
Fig. 6. Results of the parameter estimation process performed at 50% of SOC and 0�C. a) Plotted the fitted voltage against the measured voltage and b) the
relative difference (%) between the measured and fitted data.
quickly across the thin direction and the temperature will
become, to a good approximation, uniform across z-direction
(20; 21). Accordingly, the transient temperature field in the
cell assembly is described by a two-dimensional energy
equation
�— ·q+ g = rc
p
∂T
∂ t
(16)
where q = {q
x
,qy
,0} is the in-plane heat flux vector on
each electrode (W m�2 K�1), g is the net rate of volumetric
heating inside the battery (W m�3), r is the density of
cell assembly (kg m�3), c
p
is its specific heat capacity
(J kg�1 K�1), t is the time (s), and T = T (x,y) is the two-
dimensional temperature distribution in the cell (K).
According to the Fourier’s law for heat conduction, com-
ponents of q are related to the temperature distribution via
q
x
=�keff∂T
∂x
and q
y
=�keff∂T
∂y
(17)
The quantity keff is the effective in-plane thermal conduc-
tivity of the cell assembly (W m�1 K�1), calculated from
keff =1
dcell(dcc,p kcc,p +dcc,n kcc,n +2dam,p kam,p +2dam,n kam,n +2dss kss)
where
dcell = dcc,p +dcc,n +2dam,p +2dam,n +2dss
with dss as the thickness of separator sheet. Thermal con-
ductivities of current collector foils, active materials, and
separator sheet are denoted by kcc, kam, and kss, respectively.
The net rate of volumetric heating inside the battery is
the difference between heat generation and heat dissipation
rates
g = nec gec +nelec,p gohm,p +nelec,n gohm,n �qdiss
dcell(18)
where gec and gohm, j are the electrochemical and ohmic heat
generation rates per unit volume. The coefficients nec and
nelec, j are volume ratios for electrochemical and ohmic heat
generation rates (22)
nec =Vec
Vcell=
2dam,p +2dam,n +2dss
dcell
nelec, j =Velec, j
Vcell=
2dam, j +2dcc, j
dcell( j = p,n)
The quantities Vcell, Velec, j, and Vec denote the total volume
of the cell assembly, volume of each electrode, and volume
of the cell which participates in electrochemical reactions.
The electrochemical heat in each electrode is calculated
from (23)
gec =Icell
Vcell
(V
p
�V
n
)�Voc +T
dVoc
dT
�(19)
where Icell is positive/negative for charge/discharge pro-
cesses. The last term in Eq. (19) is the reversible heat of
electrochemical reactions, while the rest is the irreversible
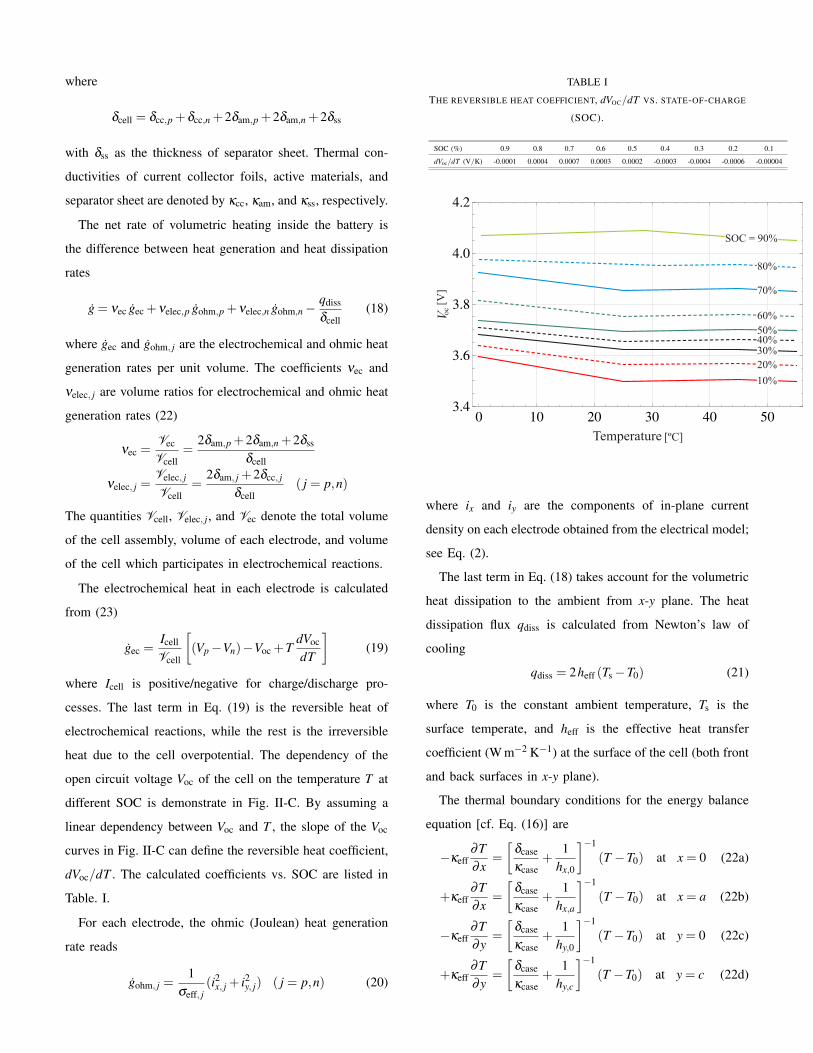
heat due to the cell overpotential. The dependency of the
open circuit voltage Voc of the cell on the temperature T at
different SOC is demonstrate in Fig. II-C. By assuming a
linear dependency between Voc and T , the slope of the Voc
curves in Fig. II-C can define the reversible heat coefficient,
dVoc/dT . The calculated coefficients vs. SOC are listed in
Table. I.
For each electrode, the ohmic (Joulean) heat generation
rate reads
gohm, j =1
seff, j(i2
x, j + i
2y, j) ( j = p,n) (20)
TABLE I
THE REVERSIBLE HEAT COEFFICIENT, dVOC/dT VS. STATE-OF-CHARGE
(SOC).
SOC (%) 0.9 0.8 0.7 0.6 0.5 0.4 0.3 0.2 0.1
dVoc/dT (V/K) -0.0001 0.0004 0.0007 0.0003 0.0002 -0.0003 -0.0004 -0.0006 -0.00004
10%
20%
30%
60%
40%50%
70%
80%
SOC = 90%
oc
V[V
]Temperature [ºC]
where i
x
and i
y
are the components of in-plane current
density on each electrode obtained from the electrical model;
see Eq. (2).
The last term in Eq. (18) takes account for the volumetric
heat dissipation to the ambient from x-y plane. The heat
dissipation flux qdiss is calculated from Newton’s law of
cooling
qdiss = 2heff (Ts �T0) (21)
where T0 is the constant ambient temperature, Ts is the
surface temperate, and heff is the effective heat transfer
coefficient (W m�2 K�1) at the surface of the cell (both front
and back surfaces in x-y plane).
The thermal boundary conditions for the energy balance
equation [cf. Eq. (16)] are
�keff∂T
∂x
=
dcase
kcase+
1h
x,0
��1(T �T0) at x = 0 (22a)
+keff∂T
∂x
=
dcase
kcase+
1h
x,a
��1(T �T0) at x = a (22b)
�keff∂T
∂y
=
dcase
kcase+
1h
y,0
��1(T �T0) at y = 0 (22c)
+keff∂T
∂y
=
dcase
kcase+
1h
y,c
��1(T �T0) at y = c (22d)

where dcase and kcase are the thickness and the thermal
conductivity of the battery case; see Table II. The convective
heat transfer coefficients are denoted by h (W m�2 K�1)
with relevant subscripts which indicate the location of the
boundary. The initial temperature of the battery is assumed
TABLE II
THICKNESS, THERMAL CONDUCTIVITY, AND ELECTRICAL
CONDUCTIVITY OF BATTERY COMPONENTS.
Material/Layer Thickness, d Thermal conductivity, k Electrical conductivity, s(m) (W m�1 K�1) (S m�1)
Aluminum current collector 20⇥10�6 238 37.8⇥106
Copper current collector 14⇥10�6 398 59.6⇥106
Separator sheet 25⇥10�6 0.34 (wet) -
Positive active material 106⇥10�6 1.58 (wet) 13.9 (wet)
Negative active material 111⇥10�6 1.04 (wet) 100 (wet)
Pouch (case) 162⇥10�6 0.16 -
to be the ambient temperature
T = T0 at t = 0 (23)
III. EXPERIMENTAL
We use a high-power prismatic Li-ion battery (AllCell
Technologies, USA) as the experimental battery, with the
nominal capacity of 75 Ah. With reference to Fig. 1, dimen-
sions of current collectors in the battery and their electri-
cal conductivity are given in Table. III. The battery core
(electrode stack) contains 42 pairs of positive and negative
electrodes connected in parallel; nickel-cobalt-manganese
cathode and graphite anode. With reference to Fig. 2,
electrode dimension in x� y plane are listed in Table III.
TABLE III
DIMENSIONS OF ELECTRODE DOMAINS Wp
AND Wn
IN x-y PLANE,
CORRESPONDING TO FIG. 2.
Electrode a b c e
(m) (m) (m) (m)
Positive 248⇥10�3 80⇥10�3 229⇥10�3 60⇥10�3
Negative 248⇥10�3 80⇥10�3 229⇥10�3 188⇥10�3
Constant-current discharge rates at 1C-rate (75 A), 2C-
rate (150 A), 3C-rate (225 A), and 4C-rate (300 A) were
performed to measure the battery voltage, V during dis-
charge processes at different environmental temperature of
-10, 0, 25, 40, and 55 �C. Each discharge test was performed
with the battery uninsulated, lying flat on a perforated
plastic rack in an environmental chamber (Envirotronics,
ST-27) set at the targeted temperature. Before discharging,
in order to establish a 100% state-of-charge, the battery
was charged following the constant-current and constant-
voltage (CC-CV) protocol, i.e., it was charged at 37.5 A
until reaching 4.2 V, then held at 4.2 V until the charging
current decreased to 3.75 A. The fully charged cell was then
allowed to rest for an hour before a discharging test begins.
Voltage data were recorded at a rate of 1 S s�1 over the
duration of the tests. The cutoff voltage for discharge tests
set to 2.7 V. To allow a discharged battery to return to the
desired ambient temperature and reach its electrochemical
equilibrium, a minimum of four hours elapsed between the
end of a discharge cycle and the beginning of the charge
cycle.
Additionally, the HPPC test was performed at four differ-
ent temperature of 0, 25, 45, and 55�C inside the environ-
mental chamber. All discharge tests were performed with a
multi-channel power cycler (Arbin Instruments, BT-2000).
IV. RESULTS AND DISCUSSION
Equations in Section II which govern the electro-thermal
performance of the cell, form a nonlinear system and
must be solved numerically. A finite element PDE solver,
COMSOL MULTIPHYSICS (Version 4.3a) (24), is used
to simultaneously solve the governing equations over two
separated domains, Wp
and Wn
, to obtain: i) the transient
fields of potential on each electrode and ii) temperature
profile in the cell assembly. The developed ECM as a
zero-dimensional model is applied to each grid element of
the Wp
and Wn
domain to account for the effect of the
local temperature variation on the ECM parameters and
consequently on the voltage and heat distributions. The ECM
parameters, see Fig. (? ), are implemented as look-up tables
and the bilinear interpolation technique is applied to find out
the value of the ECM parameters at a point (T , SOC) where
the experiment data does not exit,
Once the potential distribution on positive and negative
electrodes is obtained, the voltage, V , can be calculated from
Eq. (6). In Fig. 7, voltage response of the battery at different
discharge rates (1 C, 2 C, 3 C, 4 C) and temperature (-10�C,
0�C, 25�C, 40�C, 55�C) is compared to experimental voltage
values. The experimental discharge curves agree well with
those obtained from the modeling at different environmental
temperatures. The discharge curves in Fig. 7 show that the
discharge capacity of the cell drops significantly as the
temperature decreases below 0�C. At low temperature the
activation energy needed for chemical reactions to occur
is higher. The intercalation and deintercalation mechanism
at the electrodes need more energy, therefore fewer lithium
ions can participate in the active cell process. This leads to
a temporary capacity loss. Moreover, low intercalation and
deintercalation means a lower cell voltage, which influences
the deliverable power from the battery. Nonetheless, the
above-mentioned effects are temporary; when the tempera-
ture is restored to the desirable level, the capacity and power
capabilities are recovered (25).
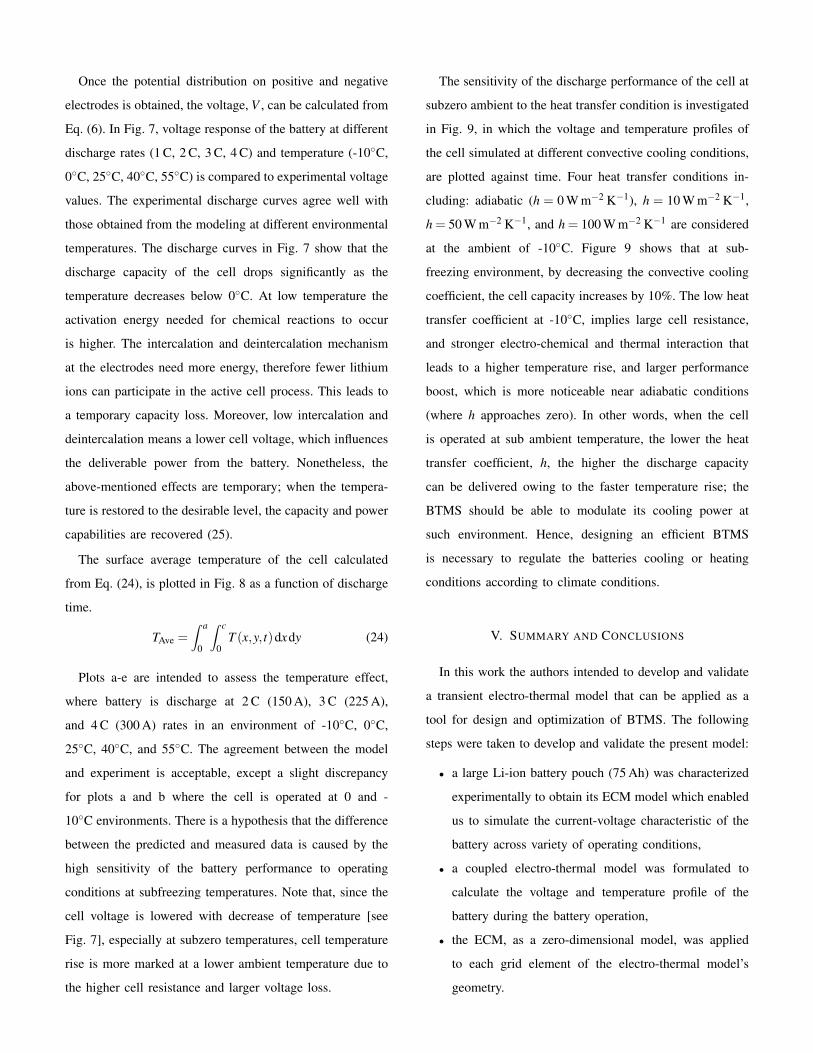
The surface average temperature of the cell calculated
from Eq. (24), is plotted in Fig. 8 as a function of discharge
time.
TAve =Z
a
0
Zc
0T (x,y, t)dxdy (24)
Plots a-e are intended to assess the temperature effect,
where battery is discharge at 2 C (150 A), 3 C (225 A),
and 4 C (300 A) rates in an environment of -10�C, 0�C,
25�C, 40�C, and 55�C. The agreement between the model
and experiment is acceptable, except a slight discrepancy
for plots a and b where the cell is operated at 0 and -
10�C environments. There is a hypothesis that the difference
between the predicted and measured data is caused by the
high sensitivity of the battery performance to operating
conditions at subfreezing temperatures. Note that, since the
cell voltage is lowered with decrease of temperature [see
Fig. 7], especially at subzero temperatures, cell temperature
rise is more marked at a lower ambient temperature due to
the higher cell resistance and larger voltage loss.
The sensitivity of the discharge performance of the cell at
subzero ambient to the heat transfer condition is investigated
in Fig. 9, in which the voltage and temperature profiles of
the cell simulated at different convective cooling conditions,
are plotted against time. Four heat transfer conditions in-
cluding: adiabatic (h = 0 W m�2 K�1), h = 10 W m�2 K�1,
h = 50 W m�2 K�1, and h = 100 W m�2 K�1 are considered
at the ambient of -10�C. Figure 9 shows that at sub-
freezing environment, by decreasing the convective cooling
coefficient, the cell capacity increases by 10%. The low heat
transfer coefficient at -10�C, implies large cell resistance,
and stronger electro-chemical and thermal interaction that
leads to a higher temperature rise, and larger performance
boost, which is more noticeable near adiabatic conditions
(where h approaches zero). In other words, when the cell
is operated at sub ambient temperature, the lower the heat
transfer coefficient, h, the higher the discharge capacity
can be delivered owing to the faster temperature rise; the
BTMS should be able to modulate its cooling power at
such environment. Hence, designing an efficient BTMS
is necessary to regulate the batteries cooling or heating
conditions according to climate conditions.
V. SUMMARY AND CONCLUSIONS
In this work the authors intended to develop and validate
a transient electro-thermal model that can be applied as a
tool for design and optimization of BTMS. The following
steps were taken to develop and validate the present model:
• a large Li-ion battery pouch (75 Ah) was characterized
experimentally to obtain its ECM model which enabled
us to simulate the current-voltage characteristic of the
battery across variety of operating conditions,
• a coupled electro-thermal model was formulated to
calculate the voltage and temperature profile of the
battery during the battery operation,
• the ECM, as a zero-dimensional model, was applied
to each grid element of the electro-thermal model’s
geometry.

[ ]sTime
[V]
Volt
age
a b
c d
e[V
]V
olt
age
Model results
Measured data
[V]
Volt
age
Tamb
= -10°C Tamb
= 0°C
2C4C 3C 1C
4C 3C 2C 1C
[ ]sTime [ ]sTime
[V]
Volt
age
4C 3C 2C 1C
[ ]sTime
Tamb
= 55°C
3C 1C2C4C
[V]
Volt
age
[ ]sTime
3C 2C3C4C 1C
Tamb
= 25°C Tamb
= 40°C
Fig. 7. The variation of battery voltage vs. time at discharge rates of 1 C (75 A), 2 C (150 A), 3 C (225 A), 4 C (300 A) at a) -10�C, b) 0�C, c) 25�C, d) 40�C,
and e) 55�C. Symbols correspond to measured values and lines represent calculated values.
• developed model was validated through comparison
with the experimental studies.
The validated model was applied to investigate the effect
of convective cooling coefficient on the transient thermal
response of the battery operating at sub-ambient tempera-
ture. Since the working temperature range of the most of the
commercial Li-ion battery is between �10�C to 50�C, the
simulation was conducted at an ambient of �10�C , as the
lower limit. The results show that at such ambient condition,
the lower the heat transfer coefficient, h, the higher the
discharge capacity can be delivered, owing to the faster
temperature rise. This implies that the design of an adap-
tive BTMS that is capable of regulating its cooling power
according to the ambient condition is essential, especially
for large scale application of Li-ion batteries.
The presented model can be extended to transient CFD
analysis of a large-scale battery pack, which is necessary for
designing battery cooling system. In addition, this multi-
physics model it has potential to be extended to various
applications such as external shorts or nail-penetration.
ACKNOWLEDGMENT
This research was financially supported by the Automotive
Partnership Canada (APC), Grant No. APCPJ 401826-10.
BATTERY GLOSSARY
• C-rate: The charge and discharge current of a battery
is measured in C-rate. Most portable batteries are rated
Model results
Measured data
Tamb
= 55°C
a b
d
55
60
65
70
75
[]
°CT
em
pera
ture
[ ]sTime
e
-10
-5
0
5
10
15
25
0 300 1500 2100600 900 1200 1800
[ ]sTime
[]
°CT
em
pera
ture
2C
3C
4C
[ ]sTime
[]
°CT
em
pera
ture
c
[ ]sTime
[]
°CT
em
pera
ture
[ ]sTime
[]
°CT
em
pera
ture
3C
4C
2C
Tamb
= -10°C
25
30
35
40
45
50
0 300 1500 2100600 900 1200 1800
Tamb
= 25°C
3C
4C
2C
40
45
50
55
3C
4C
2C
0 300 1500 2100600 900 1200 1800
Tamb
= 40°C
0 300 1500 2100600 900 1200 1800
20
30
0
5
10
15
25
2C
3C
4C Tamb
= 0°C
0 300 1500 2100600 900 1200 1800
Fig. 8. The variation of battery voltage vs. time at discharge rates of 1 C (75 A), 2 C (150 A), 3 C (225 A), 4 C (300 A) at a) -10�C, b) 0�C, c) 25�C, d) 40�C,
and e) 55�C. Symbols correspond to measured values and lines represent calculated values.
at 1 C. This means that a 20 Ah battery would provide
20A for 1 hour if discharged at 1 C rate. The same
battery discharged at 0.5 C (1/2 C) would provide 10 A
(20⇥0.5 = 10) for 2 hours. 1 C is often referred to as
a 1 hour discharge,
• State-of-charge (SOC): The state of charge refers to the
amount of charge in a battery relative to its predefined
full and empty states i.e. the amount of charge in Amp-
hours left in the battery. Manufacturers typically pro-
vide voltages that represent when the battery is empty
(0% SOC) and full (100% SOC). SOC is generally
calculated using current integration to determine the
change in battery capacity over time,
• Open circuit voltage (OCV): The open circuit voltage
(OCV) is the voltage when no current is flowing in or
out of the battery, and, hence no reactions occur inside
the battery. OCV is a function of state-of-charge and is
expected to remain the same during the life-time of the
battery. However, other battery characteristics change
with time, e.g. capacity is gradually decreasing as a
function of the number of charge-discharge cycles,
• Nominal capacity: The coulometric capacity, the total
Amp-hours available when battery is discharged at a
certain discharge current (specified as a C-rate) from
100% SOC to the cut-off voltage. Capacity is calculated
by multiplying the discharge current (in Amps) by the
discharge time (in hours) and decreases with increasing
C-rate,

0 200 400 600 800 10001.5
2.0
2.5
3.0
3.5
!20
0
20
40
60
Time [s]
Vo
ltag
e [V
]
Tem
per
ature
[°C
]h=0 (adiabatic)
h=10h=50
h=100
h, heat transfer coefficient (W/m K)2
◄
►
4.0 80
h=100
Fig. 9. Effect of heat transfer coefficient on the temperature and voltage profiles of the cell operates at 3 C discharge process and -10�C. The battery
performance is simulated at four different heat transfer conditions, including: adiabatic (h = 0 W m�2 K�1), h = 10 W m�2 K�1, h = 50 W m�2 K�1, and
h = 100 W m�2 K�1.
• Cut-off voltage: The minimum allowable voltage. It is
this voltage that generally defines the empty state of
the battery.
NOMENCLATURE
a width of electrode (m)
b width of tab (m)
C capacitance (F)
c height of electrode (m)
c
p
specific heat capacity (J kg�1 K�1)
e distance of tab centre from y-axis (m)
g heat generation rate (W m�3)
gohmic ohmic heat generation rate (W m�3)
h heat transfer coefficient (W m�2 K�1)
i in-plane current density (A m�2)
I applied discharge current (A)
J reaction current density (A m�2)
n unit normal vector on electrode
N number of cell assemblies inside the battery core
q in-plane heat flux (W m�2 K�1)
qdiss heat dissipation flux (W m�2)
Q capacity (A h)
R resistance (W)
t time (s)
T temperature (�C)
T0 ambient and initial temperature (�C)
V potential (V)
Voc open-circuit potential (V)
V volume of battery core (m3)
x horizontal position (m)
y vertical position (m)
BTMS battery thermal management system
Li-ion lithium-ion battery

Greekd thickness (m)
k thermal conductivity (W m�1 K�1)
n volume ratio
r density of cell assembly (kg m�3)
F voltage (V)
s electrical conductivity (S m�1)
Subscriptam related to active material
batt related to battery
case related to battery case
cc related to current collector
cell related to cell (electrode pair)
ec related to electrochemical reaction
eff related to current collector
elec related to electrode
n related to the negative domain
p related to the positive domain
ss related to separator sheet
x related to x-direction
y related to y-direction
REFERENCES
[1] F. He, H. Wang, L. Ma, Experimental demonstration of active
thermal control of a battery module consisting of multiple li-
ion cells, International Journal of Heat and Mass Transfer 91
(2015) 630 – 639.
[2] C. Zhang, S. Santhanagopalan, M. A. Sprague, A. A. Pesaran,
Coupled mechanical-electrical-thermal modeling for short-
circuit prediction in a lithium-ion cell under mechanical abuse,
Journal of Power Sources 290 (2015) 102 – 113.
[3] Temperature-dependent electrochemical heat generation in a
commercial lithium-ion battery, Journal of Power Sources 247
(2014) 618 – 628.
[4] J. Yi, U. S. Kim, C. B. Shin, T. Han, S. Park, Three-
dimensional thermal modeling of a lithium-ion battery consid-
ering the combined effects of the electrical and thermal contact
resistances between current collecting tab and lead wire, J.
Electroche. Soc. 160 (2013) A437–A443.
[5] W. Fang, O. J. Kwon, C.-Y. Wang, Electrochemicalthermal
modeling of automotive li-ion batteries and experimental val-
idation using a three-electrode cell, International Journal of
Energy Research 34 (2010) 107–115.
[6] G. H. Kim, K. Smith, K. J. Lee, S. Santhanagopalan, A. Pe-
saran, Multi-domain modeling of lithium-ion batteries encom-
passing multi-physics in varied length scales, J. Electrochem.
Soc. 158 (2011) A955–A969.
[7] M. W. Verbrugge, R. S. Conell, Electrochemical and thermal
characterization of battery modules commensurate with electric
vehicle integration, J. Electrochem. Soc. 149 (2002) A45–A53.
[8] Y. G. B. Y. Y. Hu, S. Yurkovich, Electro-thermal battery model
identification for automotive applications, J. Power Sources
196 (2011) 449–457.
[9] H. Gu, Mathematical analysis of a Zn/NiOOH cell, J. Elec-
trochem. Soc. 130 (1983) 1459–1464.
[10] P. Taheri, A. Mansouri, M. Yazdanpour, M. Bahrami, Theo-
retical analysis of potential and current distributions in planar
electrodes of lithium-ion batteries, Electrochimica Acta 133
(2014) 197 – 208.
[11] P. Taheri, S. Hsieh, M. Bahrami, Investigating electrical
contact resistance losses in lithium-ion battery assemblies for
hybrid and electric vehicles, J. Power Sources 196 (2011)
6525–6533.
[12] M. Yazdanpour, P. Taheri, A. Mansouri, M. Bahrami, A
distributed analytical electro-thermal model for pouch-type
lithium-ion batteries, Journal of The Electrochemical Society
161 (2014) A1953–A1963.
[13] M. Guo, R. E. White, A distributed thermal model for a li-ion
electrode plate pair, J. Power Sources 221 (2013) 334 – 344.
[14] J. Newman, W. Tiedemann, Potential and current distribution
in electrochemical cells: Interpretation of the half-cell voltage
measurements as a function of reference-electrode location, J.
Electrochem. Soc. 140 (1993) 1961–1968.
[15] Y. Hu, S. Yurkovich, Y. Guezennec, B. Yurkovich, Electro-
thermal battery model identification for automotive applica-
tions, Journal of Power Sources 196 (2011) 449 – 457.
[16] X. Hu, S. Li, H. Peng, A comparative study of equivalent
circuit models for li-ion batteries, Journal of Power Sources
198 (2012) 359 – 367.
[17] D. K. S. Jung, Multi-dimensional modeling of large-scale
lithium-ion batteries, Journal of Power Sources 248 (2014)
498–509.
[18] L. Saw, Y. Ye, A. Tay, Electro-thermal characterization of
lithium iron phosphate cell with equivalent circuit modeling,
Energy Conversion and Management 87 (2014) 367 – 377.
[19] The Idaho National Laboratory is a U.S. Department of
Energy National Laboratory, Idaho Operations Office: Idaho
Falls, ID, USA; 2010, Battery Test Manual For Plug-In Hybrid
Electric Vehicles (2008).
[20] D. R. Baker, M. W. Verbrugge, Temperature and current
distribution in thin film batteries, J. Electrochem. Soc. 146

(1999) 2413–2424.
[21] Y. Ye, L. H. Saw, Y. Shi, K. Somasundaram, A. A. Tay, Effect
of thermal contact resistances on fast charging of large format
lithium ion batteries, Electrochimica Acta 134 (2014) 327 –
337.
[22] M. DOYLE, J. NEWMAN, Analysis of capacityrate data
for lithium batteries using simplified models of the discharge
process, Journal of Applied Electrochemistry 27 (1997) 846–
856.
[23] D. Bernardi, E. Pawlikowski, J. Newman, A general energy
balance for battery systems, J. Electrochem. Soc. 132 (1985)
5–12.
[24] COMSOL Multiphysics, www.comsol.com, Stockholm, Swe-
den.
[25] Y. Ji, Y. Zhang, C.-Y. Wang, Li-ion cell operation at low
temperatures, Journal of The Electrochemical Society 160
(2013) A636–A649.