A Brief Survery of Linux Performance Engineeringmucci/latest/pubs/LinuxPerfEngPDC04.pdf · A Brief...
34
A Brief Survery of Linux Performance Engineering Philip J. Mucci University of Tennessee, Knoxville [email protected]
Transcript of A Brief Survery of Linux Performance Engineeringmucci/latest/pubs/LinuxPerfEngPDC04.pdf · A Brief...

A Brief Survery of Linux Performance Engineering
Philip J. MucciUniversity of Tennessee, Knoxville

Overview
● Onchip Hardware Performance Counters● Linux Performance Counter Infrastructure● The PAPI Library● Performance Tools● Ongoing work at PDC● Sample Tools for your use on Lucidor

Performance
“The single most important impediment to good parallel performance is still poor singlenode performance.”
William GroppArgonne National Lab

The Fallacy of Reported Linear Scalability
● But what about per/PE performance?● With a slow code, overall performance of the
code is not vulnerable to other system parameters like communication bandwidth, latency.
● Very common on tightly integrated systems where you can simple add PE's for performance.
● The question is: “ How Fast is Fast?”● The answer can be found in the hardware.
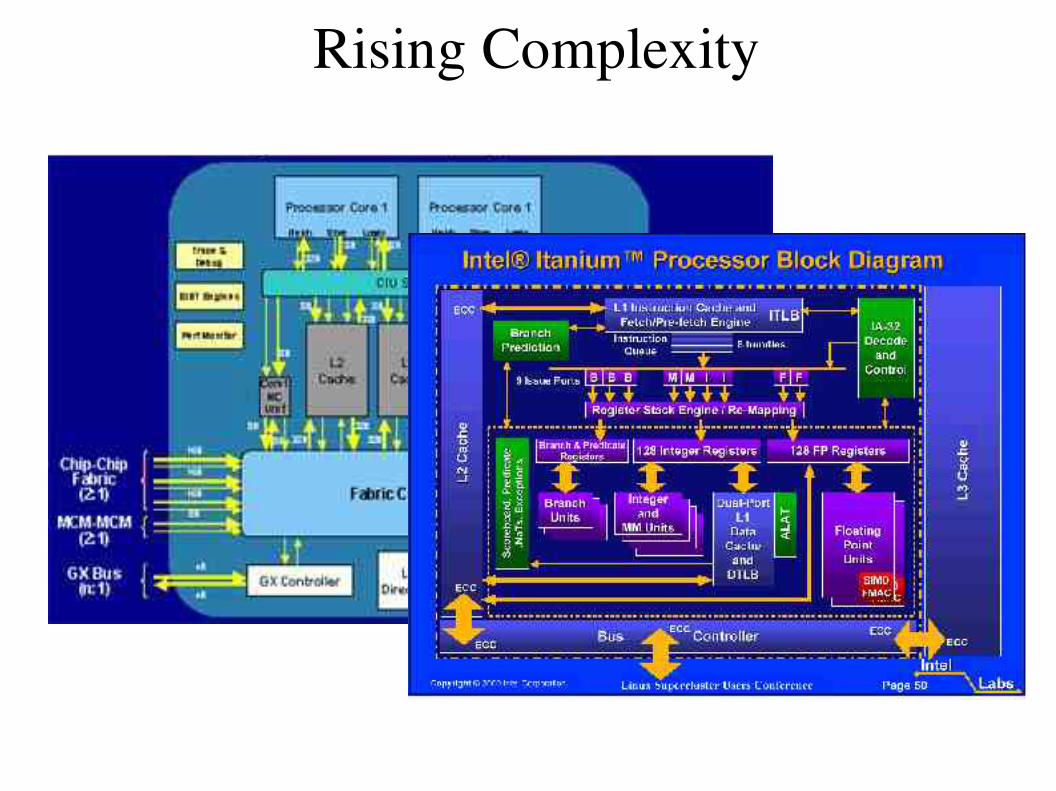
Rising Complexity

Performance Counters
• Today most high performance processors include hardware performance counters.
• Some are easy to access, others not available to users.• On most platforms the APIs, if they exist, are not
appropriate for the end user or well documented.• Existing performance counter APIs
– Compaq Alpha EV 6 & 6/7– SGI MIPS R1x000– IBM Power & PPC Series– CRAY T3E, X1– Sun UltraSparc– Pentiums, AMD
– IA64– HPPA RISC– Hitachi– Fujitsu– NEC

Linux Performance Infrastructure
● Contrary to popular belief, the Linux infrastructure is well established.
● PAPI is +7 years old.● Wide complement of tools from which to
choose.● Some are production quality.● Sun, IBM and HP are now focusing on
Linux/HPC which means a focus on performance.

Modify the Linux Kernel?● Linux currently does not have an infrastructure
for x86/x86_64 or PPC in the mainline kernel● Measurements (aggregate and statistical) are
needed for each process and thread.● Thus context switch routines need to be
modified.● No overhead when not used, similar to lazy FPU
state switching.● http://user.it.uu.se/~mikpe/linux/perfctr/2.6/

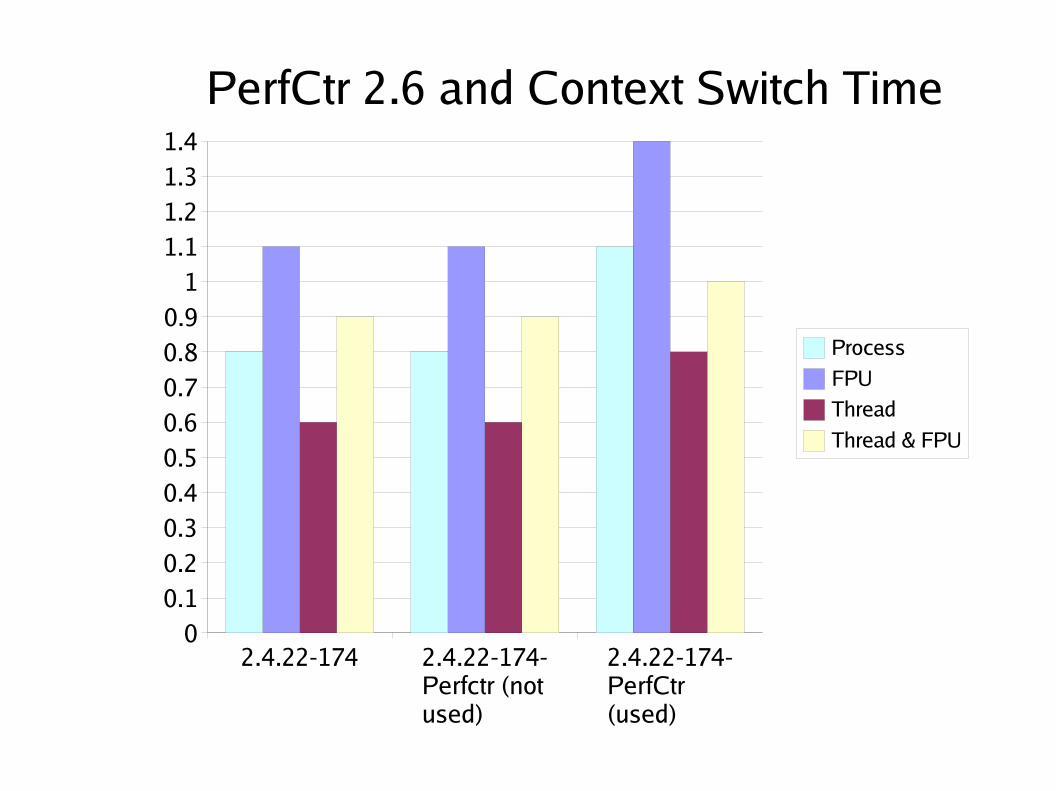
PerfCtr Patch for x86/x86_64/PPC
● System/CPU/process/thread level counting● Programmable interrupt on overflow● High resolution, per thread/process virtualized cycle
counter● User space shared library● RPM components● Unofficial: included in next SUSE & we are very close to
being included in the mainline 2.6.x Linux kernel from OSDL.
● Soon to be installed on Linux Labs cluster and some of the SweGrid machines.
2.4.22-174 2.4.22-174-Perfctr (not used)
2.4.22-174-PerfCtr (used)
00.10.20.30.40.50.60.70.80.9
11.11.21.31.4
PerfCtr 2.6 and Context Switch Time
Process
FPU
Thread
Thread & FPU
PFM for IA64
● Developed by HP, included in the mainline kernel and installed on Lucidor.
● Makes full use of IA64 monitoring.● Not nearly as fast as PerfCtr, approximately 10x
slower.● http://www.hpl.hp.com/research/linux/perfmon

PAPI• Performance Application Programming Interface
• The purpose of PAPI is to implement a standardized portable and efficient API to access the hardware performance monitor counters found on most modern microprocessors.
• The goal of PAPI is to facilitate the optimization of parallel and serial code performance by encouraging the development of crossplatform optimization tools.

• Cycle count• Instruction count
– All instructions– Floating point– Integer– Load/store
• Branches– Taken / not taken – Mispredictions
• Pipeline stalls due to– Memory subsystem
– Resource conflicts
• Cache– I/D cache misses for different
levels – Invalidations
• TLB – Misses– Invalidations
Available Performance Data

Parallel Ocean Program PerformanceRun: x1 Data Set, 2x2 Procs, 10 Steps
Raw Data Debug Optimized Metric Debug Optimized
PAPI_LD_INS 1.21E+011 2.104E+10 % Ld Ins 36.86 33.63PAPI_SR_INS 2.02E+010 7.783E+09 % Sr Ins 6.17 12.44PAPI_BR_INS 8.64E+009 5.043E+09 % Br Ins 2.63 8.06PAPI_FP_INS 2.21E+010 2.251E+10 % FP Ins 6.75 35.98PAPI_FMA_INS 1.04E+010 1.007E+10 % FMA Ins 3.16 16.09PAPI_FPU_FDIV 2.551E+08 % FP Divide 0.41PAPI_FPU_FSQRT 1.317E+08 % FP SQRT 0.21PAPI_TOT_INS 3.28E+011 6.257E+10PAPI_TOT_CYC 3.63E+011 6.226E+10 MFLIPS 12.19 72.31
% MFLIPS Peak 3.05 18.08IPC 0.90 1.00Mem Opts/FLIP 6.38 1.28
PAPI_L1_LDM 1.03E+009 1.011E+09 % L1 Ld HR 99.15 95.19PAPI_L1_STM 3.54E+008 3.475E+08 % L1 Sr HR 98.25 95.54PAPI_L2_LDM 6.94E+008 6.894E+08 % L2 Ld HR 99.43 96.72PAPI_FPU_IDL 1.66E+011 1.411E+10 % FPU Idle Cyc 45.77 22.66PAPI_LSU_IDL 4.06E+010 1.483E+10 % LSU Idle Cyc 11.17 23.82PAPI_MEM_RCY 1.03E+011 1.368E+10 % Ld Stall Cyc 28.28 21.97PAPI_MEM_SCY 1.26E+011 2.413E+10 % Sr Stall Cyc 34.59 38.76PAPI_STL_CCY 2.01E+011 3.367E+10 % No Ins. Cyc 55.25 54.08

Highlevel Interface
● Meant for application programmers wanting coarsegrained measurements
● Requires little or no setup code, anyone can use it.
● Restrictions:– Allows only PAPI presets– Only aggregate counting, no statistical profiling.

Lowlevel Interface
● Increased efficiency and functionality over the high level PAPI interface
● Approximately 60 functions (http://icl.cs.utk.edu/projects/papi/files/html_man/papi.html#4)
● Threadsafe (SMP, OpenMP, Pthreads)● Supports both presets and native events

Lowlevel Functionality
• Counter multiplexing
• Callbacks on user defined overflow value
• SVR4 compatible profiling
• Processor information
• Address space information
• Static and dynamic memory information
• Accurate and low latency timing functions
• Hardware event inquiry functions
• Eventset management functions
• Locking and thread specific data operators

PAPI and Multiplexing
● Multiplexing allows simultaneous use of more counters than are supported by the hardware.– This is accomplished through timesharing the counter
hardware and extrapolating the results.● Users can enable multiplexing with one API call
and then use PAPI normally.

Hardware Profiling
● On overflow of hardware counter, dispatch a signal/interrupt.
● Get the address at which the code was interrupted.
● Store counts of interrupts for each address.● Vendor/GNU prof and gprof (pg and –p
compiler options) use interval timers.
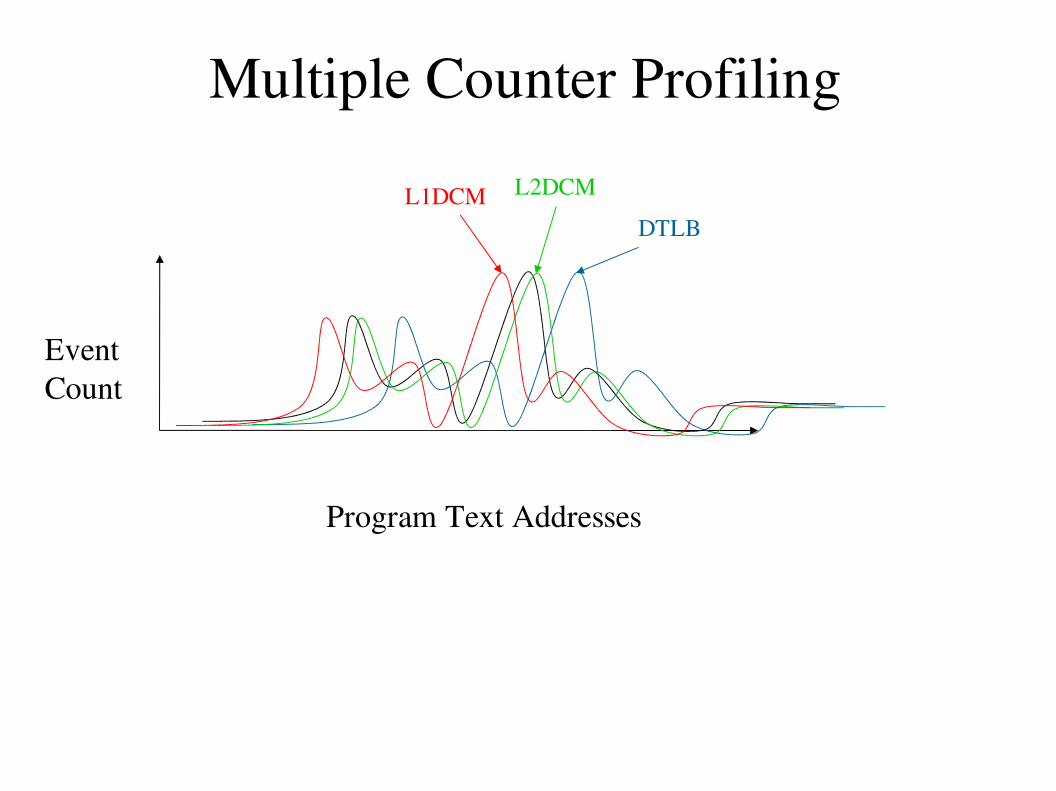
Multiple Counter Profiling
Program Text Addresses
EventCount
DTLB
L2DCML1DCM

New in PAPI 3.0
• Lower Measurement Overheads• Overflow and Profiling on Multiple
Simultaneous Events• Easy Access to PlatformSpecific Metrics• High level API is now thread safe• Internal timer/signal/thread abstractions

For More Information
● http://icl.cs.utk.edu/projects/papi/– Software and documentation– Reference materials– Papers and presentations– Thirdparty tools– Mailing lists

Performance Work at PDC
● Beginning to install an infrastructure on Lucidor and the grid.
● Working towards a comprehensive and orthogonal tool suite that makes sense for the user community.– MPI, IO, Performance Counter, Statistical
● Feedback is welcome!● Problem apps? Let us know.

Papiex: PAPI Execute on Lucidor
● Currently installed modules include:● PAPI 2.3.4.3, 3.0.3beta● PAPIEX v0.9● Per Ekman's monitoring scripts.
● Want to get started on Lucidor?
$ module load papi/3.0.3beta
$ module load perftools/1.1
$ papiex h
● Send [email protected] your feedback.

New Projects
● IOTrack: (Per Ekman, Nils Smeds and myself)– Passive system to generate statistics (and traces) of IO
activity for the purposes of optimization.
● DynaProf/IA64: (me)– A system to dynamically instrument binary code while
in memory. Recent release of the instrumentation infrastructure makes this possible. Extending to include:
● Loops, Breakpoints, Lines, Arbitrary start stop points

Which Tool?

The Right Performance Tool
● User Interface– Complex Suite
– Quick and Dirty
● Data Collection Mechanism– Statistical (low to medium overhead)
– Aggregate (low to medium overhead)
– Trace based (high overhead)

The Right Performance Tool 2
● Instrumentation Mechanism– Source– Binary (DPCL/DynInst)– Library interposition
● Data Management– Performance Database– User (Flat file)
● Data Visualization– Run Time– Post Mortem– Serial/Parallel Display– ASCII
Oprofile and Linux
● Oprofile is a statistical profiler put into RedHat kernels and adopted by other Linux vendors.
● Implementation is good for overall system tuning, but useless for production environments.– No aggregate counter support
– Must be configured by root
– Nonexistant API
● A case where mature support existed in the community, but was overlooked or ignored.

● TAU (U. Oregon)– Source/dynamic instrumentation and tracing system
– http://www.cs.uoregon.edu/research/paracomp/tau/
● HPCToolkit (Rice U.)– Command line statistical profiling (including shlibs)
– http://hipersoft.cs.rice.edu/hpctoolkit/
● PerfSuite and PSRUN (NCSA)– Command line aggegate and statistical profiling
– http://perfsuite.ncsa.uiuc.edu
Some Tools that use PAPI

● KOJAK (Juelich, UTK)– Instrumentation, tracing and analysis system for MPI,
OpenMP and Performanc Counters.
– http://www.fzjuelich.de/zam/kojak/
● SvPablo (UIUC)– Instrumentation system for Performance Counters
– http://wwwpablo.cs.uiuc.edu/Project/SVPablo
● QTools (HP) (nonPAPI)– Statistical profiling of system and user processes
– http://www.hpl.hp.com/research/linux/qtools
Some Tools that use PAPI 2

Some Tools that use PAPI 3
● PapiEx: PAPI Execute– Passive aggregate counter measurement tool.
– http://www.cs.utk.edu/~mucci/papiex
● DynaProf (P. Mucci, U Tenn)– Dynamic instrumentation tool.
– http://www.cs.utk.edu/~mucci/dynaprof

Non Open Source Tools (Why?)
● SCALEA (U Innsbruck)
– Instrumentation system for MPI, OpenMP and Performance Counters
– http://www.par.univie.ac.at/project/scalea/● ParaVer (CEPBA)
– Performance tracing for MPI, OpenMP and Performance Counters
– http://www.cepba.upc.es/paraver● VAMPIR (Pallas)
– Trace visualizer for MPI and Performance Counters (when used with TAU and other systems)
– http://www.pallas.com/e/products/vampir/index.htm

Questions?
● This talk:– http://www.cs.utk.edu/~mucci/latest/mucci_talks.html
● PAPI Homepage:– http://icl.cs.utk.edu/papi
● How to reach me:– [email protected]
● Thanks for staying!