a bInstitute of Chemical and Engineering Sciences...
39
Page 1 of 39 Accepted Manuscript 1 Quantifying the Effectiveness of an Alarm Management System through Human Factors Studies Arief Adhitya b , Siew Fun Cheng a , Zongda Lee a and Rajagopalan Srinivasan a,+, * a Department of Chemical and Biomolecular Engineering, National University of Singapore, 4 Engineering Drive 4, Singapore 117576, Singapore b Institute of Chemical and Engineering Sciences, A*STAR (Agency for Science, Technology and Research), 1 Pesek Road, Jurong Island, Singapore 627833, Singapore + Current Affiliation: Indian Institute of Technology Gandhinagar, Chandkheda, Visat-Gandhinagar Highway, Ahmedabad, Gujarat 382424, India *E-mail: [email protected]; Tel: (91); Fax: (91) 79 23972586 Highlights !! Alarm systems are critical to ensuring safety in chemical plants !! Real benefit of alarm systems can only be identified through human factors experiments that evaluate how operators utilize the decision support systems !! In this paper, we experimentally quantify the benefits of early warning !! Our results indicate that Early Warning is helpful in reaching a diagnosis more quickly !! However it does not improve the accuracy of correctly diagnosing the root cause Abstract Alarm systems in chemical plants alert process operators to deviations in process variables beyond predetermined limits. Despite more than 30 years of research in developing various methods and tools for better alarm management, the human aspect has received relatively less attention. The real benefit of such systems can only be identified through human factors experiments that evaluate how the operators interact with these decision support systems. In this paper, we report on a study that quantifies the benefits of a decision support scheme called Early Warning, which predicts the time of occurrence of critical alarms before they are actually triggered. Results indicate that Early Warning is helpful in reaching a diagnosis more quickly; however
Transcript of a bInstitute of Chemical and Engineering Sciences...

Page 1 of 39
Accep
ted
Man
uscr
ipt
1
Quantifying the Effectiveness of an Alarm Management System through Human Factors Studies
Arief Adhityab, Siew Fun Chenga, Zongda Leea and Rajagopalan Srinivasana,+,*
aDepartment of Chemical and Biomolecular Engineering, National University of Singapore,4 Engineering Drive 4, Singapore 117576, Singapore
bInstitute of Chemical and Engineering Sciences,A*STAR (Agency for Science, Technology and Research),1 Pesek Road, Jurong Island, Singapore 627833, Singapore
+Current Affiliation: Indian Institute of Technology Gandhinagar,Chandkheda, Visat-Gandhinagar Highway, Ahmedabad, Gujarat 382424, India
*E-mail: [email protected]; Tel: (91); Fax: (91) 79 23972586
Highlights! ! Alarm systems are critical to ensuring safety in chemical plants
! ! Real benefit of alarm systems can only be identified through human factors
experiments that evaluate how operators utilize the decision support systems
! ! In this paper, we experimentally quantify the benefits of early warning
! ! Our results indicate that Early Warning is helpful in reaching a diagnosis more
quickly
! ! However it does not improve the accuracy of correctly diagnosing the root cause
Abstract
Alarm systems in chemical plants alert process operators to deviations in process
variables beyond predetermined limits. Despite more than 30 years of research in
developing various methods and tools for better alarm management, the human aspect
has received relatively less attention. The real benefit of such systems can only be
identified through human factors experiments that evaluate how the operators interact
with these decision support systems. In this paper, we report on a study that quantifies
the benefits of a decision support scheme called Early Warning, which predicts the
time of occurrence of critical alarms before they are actually triggered. Results
indicate that Early Warning is helpful in reaching a diagnosis more quickly; however

Page 2 of 39
Accep
ted
Man
uscr
ipt
2
it does not improve the accuracy of correctly diagnosing the root cause. Implications
of these findings for human factors in process control and monitoring are discussed.
Keywords: Alarm Management, Process Monitoring, Prediction, Process Operators

Page 3 of 39
Accep
ted
Man
uscr
ipt
3
1. Introduction
Modern chemical plants consist of a large number of integrated and
interlinked process units. To optimize production, process operators and engineers
depend on automation systems to extract information (e.g. through thousands of
sensors) and to assist them in the management of operations (e.g. through built-in
controllers). Abnormal situations result in process variables moving away from their
desired ranges and potentially lead to undesired outcomes. Automation systems will
alert the operators of such occurrences through alarms. As process units are highly
interlinked, deviations due to an abnormal situation could propagate through various
process units and numerous variables. This may lead to many alarms occurring at the
same time (Liu et al., 2003; 2004). The operators have to make sense of the barrage of
alarms, quickly and accurately identify the root cause of the abnormal situation, and
take corrective actions to rectify the root cause and bring the process back under
control.
An abnormal situation can sometimes have serious repercussions, including
considerable economic impact on plant profitability due to unacceptable product
quality, plant downtime, or even the loss of life. Thus, there is a need to develop a
dependable system that enables the operators to quickly and correctly diagnose the
root cause of the abnormal situation and design and implement suitable corrective
action. With early intervention, losses resulting from abnormal situations can be
minimized by avoiding the worst case scenario of a catastrophic loss (Burns, 2006). A
number of decision support systems have been developed to enable the operators to
diagnose the root cause of the abnormal situation.
In order to ensure that the potential offered by such tools are in fact translated
to operational benefits, one needs to consider the complementary aspect of human
factors. Human factors is the scientific discipline concerned with the understanding of
interactions among humans and other elements of a system in order to optimize
overall system performance (International Ergonomics Association, 2014). Process
control typically entails working in a complex, interactive system involving hardware,
software, and humans. The human aspect is widely considered to be very important
but paradoxically has received significantly less attention, especially in the process
systems engineering (PSE) community. We seek to address this issue in this paper.
Specifically, we seek to understand how operators would interact with decision

Page 4 of 39
Accep
ted
Man
uscr
ipt
4
support systems for alarm management and quantify the real benefits through human
factors experiments. Section 2 presents a review of alarm management systems and
the pivotal role of operators in chemical plants. This is followed in Section 3 by the
human factors experimental methodology adopted in this research. Results of the
human factors study are presented in Section 4. Section 5 concludes with suggestions
on future research work.
2. Literature Review
Complexity has been increasing as a result of increased sophistication in
chemical processes to allow for larger amounts of material and energy integration,
environmental regulation, and the greater need for optimization and efficiency (Chu et
al., 1994; Wall, 2009). With this increased pressure to ‘do more with less’ (Jamieson
and Vicente, 2001), effective process control systems are all the more critical to
ensure safe and smooth operations. This is often achieved by the application of
modern digital technology and increasing automation. However, an unintended
consequence of increased sophistication is the greater challenges faced by operators,
especially when managing abnormal situations (Chu et al., 1994).
During abnormal situations, there are real risks of operators not receiving
important alarm information to take corrective actions in time, which could have
potentially serious repercussions. One such incident occurred at Texaco’s Oil
Refinery, Milford Haven, United Kingdom (UK) and led to the explosion that took
place on 24 July 1994, in which 26 people sustained minor injuries. Financial losses
resulting from this explosion included 48 million pounds in reparation and substantial
losses in production (Bransby and Jenkinson, 1998). It has been reported that in the
10.7 minutes prior to the explosion, the two operators on duty were flooded by 275
alarms. Apart from this alarm barrage, the UK Health and Safety Executive (HSE)
cited poorly designed control display and inefficient alarm prioritization as two of the
main contributing factors for this incident. The UK HSE has estimated that a typical
oil refinery can avoid three to ten million pounds losses per year through proficient
alarm management and better operator support system (Bransby and Jenkinson,
1998).
A number of guidelines have been developed to improve alarm management
systems, e.g. by International Society of Automation (2009) and the ASM consortium
(2009). Various algorithms and techniques have been developed to reduce the total

Page 5 of 39
Accep
ted
Man
uscr
ipt
5
number of alarms that will be activated (Liu et al., 2003; 2004). Foong et al. (2009)
developed a fuzzy-logic based alarm prioritization (ALAP) system to prioritize alarms
during alarm floods so as to reduce the burden of operators from meaningless or false
alarms. A novel alarm reduction method that involves data-mining to spot the
statistical similarities among operations and alarms has been reported by Higuchi et
al. (2009). Brooks et al. (2004) deemed the root cause of poor performance of alarm
systems to be the single-variable and empirical methods of setting alarm limits. They
examined multi-variable alarms and proposed a geometric process control method.
These demonstrated a substantial reduction in false alarms in field trials conducted in
chemical plants in the UK. Cheng et al. (2012) identified similarities between alarm
flooding situations by employing a modified Smith-Waterman algorithm to analyze
the alarm flood pattern and cluster similar ones.
Even with automation and improved alarm management systems, human
operators still remain irreplaceable in the control of chemical plants, especially during
abnormal situations (Parasuraman and Wickens, 2008). The human operator has
different roles and responsibilities in the chemical plant that is largely dependent on
the plant states (Brown and O'Donnell, 1997; Emigholz, 1996). Under normal
operating conditions, the operator is able to assume a relatively passive role in
supervising the unit operation with a focus on maximizing efficiency of the process
unit by making minor adjustments to the process variables. However, when an
abnormality occurs, the operator would need to proactively manage the situation by
taking corrective actions to manipulate the process unit back to the normal operating
conditions. Automation is less error-prone and can be relied on to produce repeatable
actions, but generally fails to address abnormal situations which are likely to be
unforeseeable. Nachtwei (2011) noted that in contrast with automated systems,
humans have the ability to be flexible and to produce creative solutions in response to
unanticipated situations. This ability of the operators to effectively devise solutions
for abnormal situations is contingent on their situation awareness.
Situation awareness and human factors have been widely studied in a variety
of domains including process control (Endsley, 1988; Endsley, 1995; Stanton et al.,
2001), plant design (Kariuki et al., 2007; Widiputri et al., 2009; Cullen, 2007), and
process risk analysis (Kariuki and Lowe, 2006). The key steps in situation awareness
are perception of the environment, comprehension of the current situation, and
prediction of future status. To support situation awareness, the human factors

Page 6 of 39
Accep
ted
Man
uscr
ipt
6
community has developed experimental techniques for user interface design and
evaluation (Kontogiannis and Embrey, 1997; Spenkelink, 1990; Tharanathan et al.,
2012; Nishitani et al., 2000). In this paper, we adopt such experimental techniques to
study the human factors that affect alarm management. Specifically, we seek to
understand and quantify the benefits of decision support tools and evaluate their
effectiveness. Although a variety of alarm management tools and techniques have
been proposed in literature, their effectiveness has not been systematically studied.
The interaction between operators and a decision support tool can only be closely
examined through experiments involving human participation as described next.
3. Experimental Methods to Study Human Factors
The cognitive tasks performed by an operator during abnormal situations
generally follow three steps: orientation, diagnosis and execution (Chu et al., 1994).
When faced with an abnormal situation, the operator would first need to orient
himself and focus on understanding the particular situation through the search for
relevant information. The next step involves diagnosing and evaluating the situation
by interpreting the information and relating the data to possible causes of abnormality.
This may result in one or many postulated root causes. The execution step refers to
the actions taken to verify the malfunction postulations, as well as the corrective
actions taken in the attempt to bring the process back to normal. An alarm
management system could make the operators more effective in the orientation and
diagnosis tasks. We have developed an experimental scheme to evaluate if a decision
support tool is effective in improving operators’ performance in these tasks. Although
the general strategy is broadly applicable to any process monitoring and diagnosis
decision support system, we have applied it in the context of early alarm warnings.
Early Warning predicts the time of occurrence of critical alarms before they
are actually triggered (Xu et al., 2012). Predictive aids that help users anticipate future
system states have been widely used in various domains, e.g. the cockpit display in
modern aircrafts that predicts the trajectories of other aircrafts in the proximity and
alerts the pilots of any potential conflicts, or hurricane forecast that predicts where an
oncoming hurricane will and will not strike. However, predictive aid is still not
practiced in the area of alarm management in chemical plants. Early Warning
provides control room operators with anticipatory information on incipient alarms that
could happen within a certain time window (e.g. the next 60 seconds). This allows the

Page 7 of 39
Accep
ted
Man
uscr
ipt
7
operators to be more proactive as they are alerted early on potential problems so that
they can anticipate, evaluate, and start taking corrective actions even before alarm
thresholds are breached.
Our current work focuses on quantifying the benefits of Early Warning in
supporting operators, specifically the extent of time advantage gained by operators
and the resulting improvement in diagnosis accuracy. We have designed an
experimental scheme to address this primary research question. The study compares
the performance of participants in the supported case with Early Warning to the
unguided case where the operator has no decision support tools and relies solely on
the alarm system to detect and diagnose abnormalities. Performance is measured
based on their diagnosis of the root cause of a given abnormal situation scenario.
More specifically, there are two performance measures: diagnosis lag and diagnosis
accuracy. Since Early Warning provides the same type of alarm information to the
participants, only earlier, it is not expected to change their cognitive processes. Any
change in participants’ performance can thus be attributed to Early Warning.
3.1 Case Study
The case study considers the simulation of a depropanizer unit motivated by a
real refinery (Xu et al., 2012), a schematic of which is shown in Figure 1. The
depropanizer unit serves to separate the feed mixture, consisting primarily of C3 and
C4 hydrocarbons, into two product streams. The lighter product from the top of the
unit consists primarily of C3s while the heavier product from the bottom of the unit
consists of C4s and heavier hydrocarbons. There are three main sections, i.e.
distillation tower, reboiler, and condenser. The depropanizer unit has 23 measured
process variables, out of which eight are important process variables that have alarms
configured (Table 1). Information on past and current values of process variables and
triggered alarms is conveyed to the participants through displays.
3.2 Diagnosis Tasks
In this study, the main activity of participants from which performance
measures are derived is the diagnosis task. Participants are asked to monitor the
depropanizer unit and different scenarios are simulated. Each scenario involves a
particular fault resulting in a sequence of alarms. The participants’ task is to diagnose
the root cause of the fault.

Page 8 of 39
Accep
ted
Man
uscr
ipt
8
A total of six fault scenarios are used in the study. They are: (1) Reflux pump
degradation, (2) Loss of cooling water at condenser, (3) Loss of hot oil at reboiler, (4)
Loss of feed, (5) Reboiler fouling, and (6) Condenser fouling. Each fault will cause
different alarms to be triggered at different times. The sequence of alarms that are
triggered in each fault scenario is shown in Table 2. For example, in the first scenario,
the reflux pump (P11A in Figure 1) degrades. Consequently, the reflux flow into the
distillation tower decreases and temperature of the top tray, TI17, increases due to less
cooling. Hence, the high-limit alarm TI17 HI is eventually triggered. Also, since less
reflux is being pumped back from the reflux drum, the liquid level in the reflux drum,
LC12, starts to increase and LC12 HI alarm is triggered. Subsequently, temperatures
in the lower trays of the distillation tower are also affected by the reduced cooling and
the high-limit alarms of TI16, TI14, TC11, and TI13 are triggered. Due to less
condensation, liquid level in the bottom hold-up, LC11, decreases and LC11 LO
alarm is triggered. Vapor continues to build up in the distillation tower and eventually
the column pressure PC11 high-limit alarm is triggered.
In each scenario, participants will see a sequence of alarms in real-time. The
participant is free to submit his diagnosis at any point during the scenario, even before
the scenario ends. The duration of each scenario is limited and participants are clearly
informed when the scenario has come to an end and no additional process
measurements or alarms will be provided. Based on the alarms and the information on
the 23 measured variables available through the Schematic Display (including current
value and trend, see below), they have to diagnose the root cause of the fault and
submit their diagnosis by selecting from a dropdown list, which includes all the six
faults as well as the null choice “None of the above” (Table 3). From Table 2, it can
be seen that scenarios 1 and 4 each have a unique alarm sequence. However, scenarios
3 and 5 have the same alarm sequence and so do scenarios 2 and 6. The former pair
can still be differentiated since the hot oil flow (FI16 in Figure 1) will be zero in
scenario 3 (loss of hot oil). On the other hand, cooling water flow is not a measured
variable in this process, so scenario 2 (loss of cooling water) and scenario 6
(condenser fouling) are not differentiable. Either of the two answers is therefore
accepted as correct in these two scenarios.
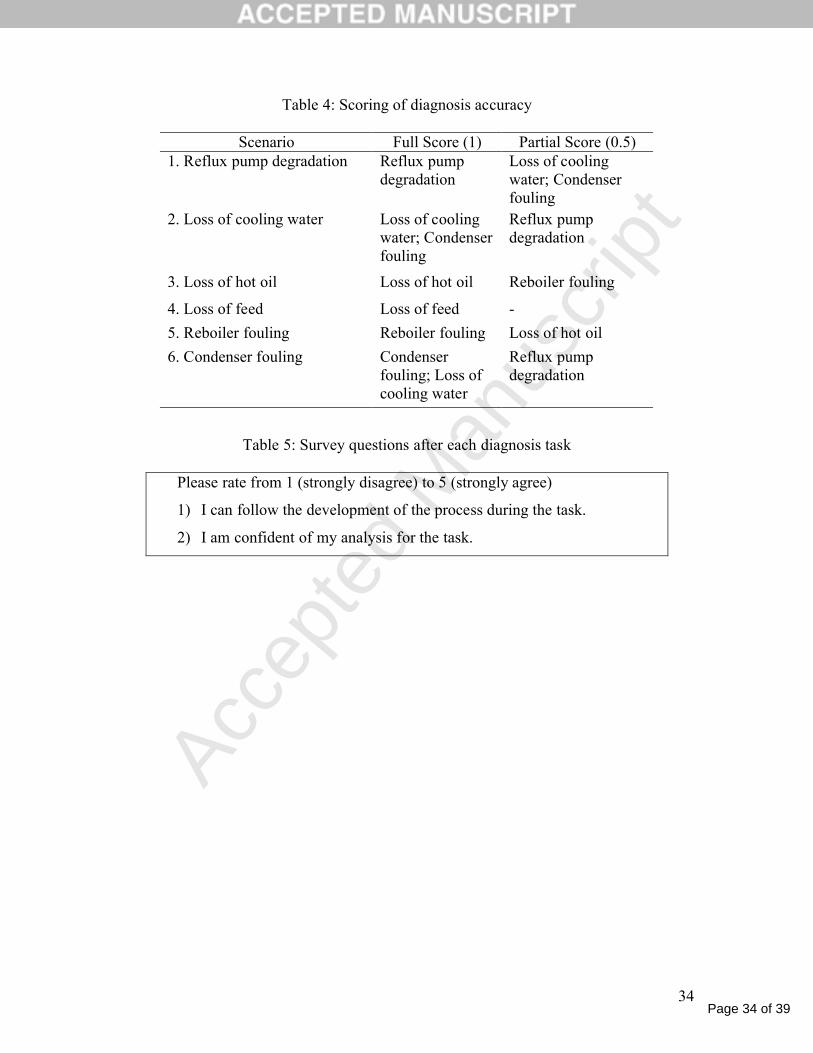
Participants’ performance is scored in each scenario using two performance
measures: diagnosis accuracy and diagnosis lag. Participants may obtain a diagnosis
accuracy score of 0, 0.5 or 1, depending on their choice for a scenario. A full score of

Page 9 of 39
Accep
ted
Man
uscr
ipt
9
1 is given for correct identification of the root cause. Among the six scenarios, some
have similar symptoms as they originate from the same area. The fault in scenario 1
(reflux pump degradation), scenario 2 (loss of cooling water), and scenario 6
(condenser fouling) all originate in the condenser area, while the fault in scenario 3
(loss of hot oil) and scenario 5 (reboiler fouling) originate in the reboiler area. A
partial score of 0.5 is given if a participant selects a wrong diagnosis but from the
same area. All other diagnosis choices are given a 0 score. This diagnosis accuracy
scoring scheme is summarized in Table 4. Diagnosis lag is the time taken to
formulate the diagnosis, which is taken to be the interval between the start of the
scenario and the submission of the diagnosis.
3.3 Displays
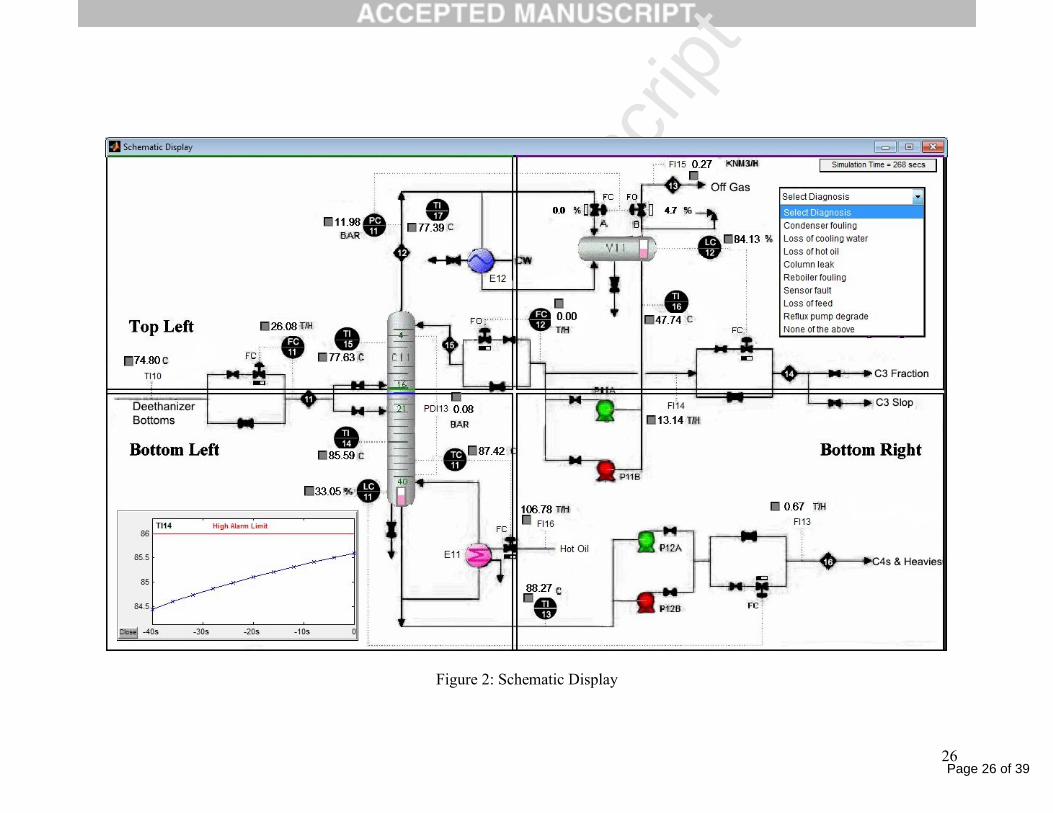
Information about the status of the process is provided in real-time to the
participants via two displays, namely the Schematic Display (Figure 2) and the
Alarms Display (Figure 3). The Schematic Display provides an overview of the
different components within the depropanizer unit. The current (real-time) value of
each of the 23 variables is shown adjacent to the variable name. Historical trend of
each variable can also be viewed by clicking on the small grey box near the variable,
which will bring out the Trend Display in a small inset at the bottom left of the
Schematic Display, showing the variable trend line based on the last 10 samples (20
seconds) as well as the high/low alarm limits. For example, Figure 2 shows the Trend
Display of variable TI14. When a variable with a configured alarm goes outside its
normal operating range, the trend will cross the alarm limit line and the color of the
variable value in the Schematic Display will turn from green to red. In addition, an
alarm will sound and the details of the variable will be shown in the Alarms Display
(bottom of Figure 3).
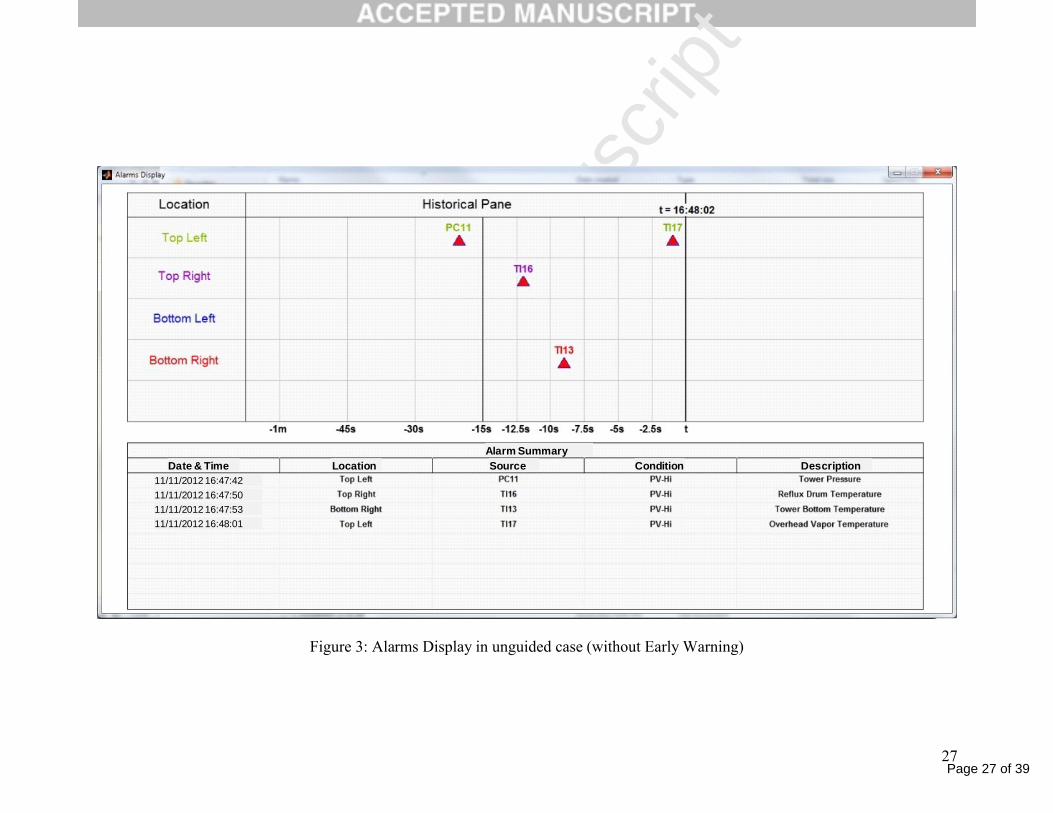
The alarm information is traditionally presented in a list form like the Alarm
Summary table, shown in the bottom part of Figure 3. In our Alarms Display, we
additionally show alarm information graphically through the Alarm Pane (see top part
of Figure 3). The Historical Pane within the Alarm Pane shows temporal trends of
alarms that have occurred in the recent past, e.g. last one minute. Alarms are grouped
into four quadrants, based on their location in the Schematic Display. Each alarm is
depicted as a triangle that either points upwards to represent a high-limit alarm or
downwards to represent a low-limit alarm. For example, Figure 3 shows four alarms

Page 10 of 39
Accep
ted
Man
uscr
ipt
10
that have occurred in the last one minute, i.e. PC11 HI (20 seconds ago), TI16 HI (12
seconds ago), TI13 HI (nine seconds ago), and TI17 HI (one second ago).
The Alarm display is augmented in the Early Warning decision support case.
In this case, there is an additional pane called the Prediction Pane, located right of the
Historical Pane. This pane shows early warnings of alarms that are predicted to
happen within the prediction window, e.g. in the next 15 seconds (Figure 4). Early
warnings are also included in the Alarm Summary table. For example, Figure 4 shows
that TI13 HI is predicted to occur in the next one second and TI17 HI within the next
12 seconds. When TI17 HI actually occurs, this early warning is removed from the
alarm list and replaced by the actual alarm information.
Both the Schematic Display and the Alarms Display were developed in
MATLAB (Mathworks, 2013). Each fault scenario was simulated beforehand in an
operator training simulator (Helander, 2011) to generate the process variable values.
This data is then read into MATLAB at regular intervals (one sample every two
seconds) and presented to the participants through the displays. Due to the large sizes
of the displays, two monitors are used. The Schematic Display is shown in the left
monitor and the Alarms Display in the right monitor. The dropdown list of diagnosis
options is located at the top right part of the Schematic Display (Figure 2).
Participants can select their diagnosis from this list and submit anytime during the
scenario.
3.4 Key Human Factors Principles
The study was conducted in a controlled laboratory environment that
simulated the real-life setting in a chemical plant control room. The simulated
experiments may differ from the environment in the plant due to simplifications in the
nature and manner that information is conveyed to the participants. However, the
laboratory setting enabled us to ensure that there is no impact on actual operations in a
real plant, eliminating any concomitant risks to process operations and safety. Some
key features of the experimental scheme are discussed below.
Deceptive Experimental Technique
Withholding information regarding the true objective of the study from
participants is a common experimental technique in psychology studies (Hertwig and
Ortmann, 2001). There are several justifications for this, including the concern that

Page 11 of 39
Accep
ted
Man
uscr
ipt
11
participants’ behavior could be affected by the knowledge of the study objective and
result in participants forming biased opinions and attitudes towards the study
objective, which would likely be reflected in the results they produce. It might also
lead to participants responding strategically during the experiment in an attempt to
assist or ruin the experimenters’ hypotheses (Walster et al., 1967).
In this research, a general term, “Process Analysis Study”, was adopted as the
study title. Prior to the studies, participants were not explicitly informed that the
underlying objective was to evaluate the Early Warning decision support system.
They were only told that their role was to monitor the system and provide an analysis
to the engineer on duty. This prevented any instances of participants deliberately
altering their behavior in accordance to the type of display they were shown. In this
way, we ensured that the experimental results are reliable and not biased. However, it
is also important to note that this might result in participants second-guessing the
actual purpose of the experiment. This issue could be overcome by providing
participants with clear instructions, as elaborated in the next section.
Role Playing
Participants could form diverse interpretations of the experimental situation
and react differently even when given the exact same experimental setup (Hertwig
and Ortmann, 2001). This emphasizes the importance of providing precise
experimental specifications in an attempt to lessen participants’ uncertainty. A good
way to do so is to clearly define the role that participants are to assume during the
experiment. Clearly informing the participants of the role they play prevents them
from forming their own expectations of what the experimenters are testing for. Task
instructions that are explicitly provided serve to focus the participant’s attention on
the experimental expectations, thus removing any ambiguity of the experimental
situation. This improves the experimenters’ control over participants’ possible
interpretations of the experiment and enhances reproducibility of the study results.
In the context of this research, participants were assigned the role of chemical
plant operators, where they were asked to monitor the process plant and diagnose
abnormal situations. This instruction was clearly provided to all participants at the
start of the studies. This reduced the necessity of participants having to infer the
meaning of the experiment.

Page 12 of 39
Accep
ted
Man
uscr
ipt
12
Providing Learning Opportunity
By exposing participants to more than one diagnosis task, the experimental
setup provides them with learning opportunities as the participants can gain
experience through increased familiarity with the experimental setup. Hertwig and
Ortmann (2001) identified two types of learning that occurs during human
experiments. The first type is related to adaptation to the experimental environment,
where participants should be given the chance to familiarize themselves with the
experimental procedures and clear any doubts regarding the laboratory set-up and task
expectations. The second learning involves gaining a better understanding of the task
situations and recognizing any possible strategic aspects in handling the situation. A
high variability in study results is likely to be observed if data is obtained from a task
that is performed only once, as there is less consistency in performance level. The
more often the participants are given a similar task, the more consistent are their
resulting behavior and thus the results obtained.
In the studies that were conducted, familiarization activities were present in
the form of detailed instructions on handouts and video walkthroughs. The study had
a total of six diagnosis tasks. The first task (for both the supported case and the
unguided case) was not included in the result analysis. This is to account for
participants who might still be unfamiliar with the experimental set-up, which could
lead to the results in these initial tasks not being a true reflection of the required
cognitive processes.
3.5 Experimental Design
The whole study is designed around the diagnosis task. There is one
independent variable and two dependent variables (performance measures) in the
study. The independent variable is the type of case: supported (with Early Warning)
or unguided (without Early Warning). The dependent variables are diagnosis lag and
diagnosis accuracy as described above.
In this study, we adopted a within-subjects, repeated-measures experimental
design. Each participant participated in both the supported case and the unguided
case. There are two key advantages to this design: (1) more observations, and (2)
reduction in error variance associated with individual differences (Hall, 1998). For the
same number of participants, a within-subjects design will result in twice as many
observations as a between-subjects design. For example, if we have 20 participants, a

Page 13 of 39
Accep
ted
Man
uscr
ipt
13
between-subjects design will split them into equal size groups: one group of ten will
do the supported case and the other group of ten will do the unguided case, resulting
in 10 observations each for the supported case and the unguided case. Using the
within-subjects design, all 20 participants will do both the supported case and the
unguided case resulting in 20 observations for each. As the number of observations
increases, the probability of beta error (i.e., not finding an effect when one exists)
decreases. The second advantage of a within-subjects design is that variance due to
individual difference factors are minimized since the participants are the same for
both the supported case and the unguided case. Factors such as individual background
knowledge, intelligence, and deductive capability will be exactly the same for the two
cases because they are the exact same group of people.
On the other hand, a fundamental disadvantage of the within-subjects design is
the “carryover effect”, which means participation in the earlier case may affect
performance in the later one. Two possible carryover effects are practice and fatigue.
While a participant is doing the first case, e.g. an unguided case, he is also becoming
more familiar with the system and the diagnosis task, so that by the time he is about to
do the supported case, he has more understanding of the process. This practice effect
may cause a bias where performance in later tasks tends to be better due to practice
and increased familiarity. On the other hand, the fatigue effect is where the participant
gets more tired or mentally fatigued in the later part of the experiment, thus negatively
affecting his performance in the later tasks.
To minimize the practice effect, we provided participants with video
walkthroughs and an opportunity to familiarize with the system in their first task. The
first task in each case is a dummy task, which is not taken into account in the result
analysis. It serves as an opportunity for the participant to familiarize themselves with
the displays and the diagnosis task. The participants are not informed of this as they
might not take the task seriously if they know that it would not be counted. Fatigue
effect is minimized by designing the study to take no more than 30 minutes in total.
The overall carryover effect is also minimized by randomizing the order of cases
(supported and unguided) and scenarios for the participants so that there is no bias
resulting from order position for any particular case or scenario.

Page 14 of 39
Accep
ted
Man
uscr
ipt
14
3.6 Experimental Procedure
Based on the above principles, the following experimental procedure was
devised. There are two main cases in the study: supported and unguided. Each case
consists of three diagnosis tasks; in total each participant performs six diagnosis tasks,
corresponding to the six fault scenarios described in Section 3.2. Scenario 2 is
selected to be the first task (dummy) for the unguided case and scenario 5 for the
supported case. The remaining four scenarios can be grouped based on the number of
alarms; scenarios 3 and 4 have fewer alarms and are of low-intensity than scenarios 1
and 6 (Table 2) which are of high-intensity. Thus, for a fair comparison between the
two cases, each case consisted of one task from the low-intensity group (scenarios 3
or 4) and one task from the high-intensity group (scenarios 1 or 6) in addition to the
dummy task. The scenarios from the two groups are assigned to the two cases
randomly in equal proportion. Participant A might get Scenarios 3 and 1 in the
supported case and 4 and 6 in the unguided case, while Participant B gets scenarios 3
and 6 in the supported case and 4 and 1 in the unguided case. But in total, the number
of scenario 1 tasks in the supported case and the unguided case from the whole study
will be comparable.
A flow diagram illustrating the study procedure is shown in Figure 5. At the
start of the study, participants are briefed using three handouts:
1) Overview handout, describing their role as plant operator who is monitoring
the process unit and required to provide both correct and timely fault diagnosis
2) Technical handout, describing the depropanizer unit
3) Display handout, describing the Schematic Display and the Alarms Display
and how the information can be accessed and interpreted
They then proceed to do the tasks in the first case, which has been randomly assigned
to be either supported or unguided. Before starting the tasks in each case, participants
are shown a training video to help them familiarize with the system and ensure that
they are clear of what they are expected to do during the tasks. The video is a
walkthrough guide of an actual fault scenario with a narrator saying aloud her/his
thinking process as (s)he sees the alarms until the time (s)he concludes her/his
diagnosis and submits it. The participants then proceed to the first diagnosis task in
the case. At the end of the diagnosis task, a task-survey containing two questions
(shown in Table 5) is conducted to get the participants’ subjective assessment about

Page 15 of 39
Accep
ted
Man
uscr
ipt
15
the task. Then the participants proceed to the second task. Once the participants have
completed all the three tasks in the first case, they move on to the second case.
Similarly, the second case also starts with a video walkthrough of the new display
type followed by three sets of diagnosis tasks and survey questions. After all the three
tasks in the second case are completed, a final survey containing six questions (shown
in Table 6) is conducted to get the participants’ overall subjective assessment of the
displays.
The whole study procedure is implemented and managed using the Morae
software from TechSmith Corporation (Morae, 2012). Instructions are shown on-
screen and participants move forward from one part to the next as prompted and
guided by Morae. The following data from the study is recorded using Morae
Recorder: participants’ mouse movements, mouse clicks, diagnosis choice, diagnosis
time, and survey answers. The recorded data can then be evaluated using Morae
Manager for result analysis.
4. Results
The setup for the study is portrayed in Figure 6. A total of 61 chemical
engineering students comprising 44 males and 17 females participated in the study.
Fifty six were 3rd year (Junior) or 4th year (Senior) undergraduate students and five
were postgraduate students. Thus, even though they had little or no prior industrial
experience, they can be reasonably assumed to have the background knowledge of
fundamental chemical engineering principles and specifically distillation units. This is
confirmed by their task survey response (Table 7). Only 7.5% feel that they cannot
follow the development of the process during the task and less than 20% are not
confident of their analysis. The majority of the participants can be considered to have
sufficient background knowledge and therefore suitable for the study.
The human factors study aims to evaluate the effectiveness of Early Warning
in a simulated environment, measured in terms of diagnosis lag and diagnosis
accuracy. The study therefore focuses on two hypotheses in quantifying the advantage
of offering decision support to operators, specifically through Early Warning, in the
supported case over the unguided case.
H1: Participants require shorter diagnosis lag in the supported case with Early
Warning as compared to the unguided case.

Page 16 of 39
Accep
ted
Man
uscr
ipt
16
H2: Participants have better diagnosis accuracy in the supported case with Early
Warning as compared to the unguided case.
In addition, a subjective assessment through survey was also conducted. Each of these
is described next.
4.1 Diagnosis lag
Diagnosis lag is measured as the time from the start of the scenario until the
participants submit their diagnosis. Each of the 61 participants did two actual tasks in
the supported case and two in the unguided case, resulting in a total of 122 supported
tasks and 122 unguided tasks. In this work, any data point that is more than 1.5 inter-
quartile ranges below the first quartile or above the third quartile is considered as an
outlier and excluded from the analysis (Moore and McCabe, 1999). Four supported
samples and two unguided samples with significantly longer lag than the rest were
therefore excluded. The detailed results are shown in Table 8. The mean diagnosis lag
is 124 seconds in the supported case and 144 seconds in the unguided case. The
median is 101 seconds in the supported case and 126 seconds in the unguided case.
Thus, both mean and median statistics suggest that the supported case results in
shorter diagnosis lag than the unguided case by about 20 seconds. The non-parametric
Mann-Whitney U test (Mann and Whitney, 1947) is used to compare the two sets of
data and the difference is found to be statistically significant at the 95% confidence
level (p-value = 0.033 < α = 0.050). Thus, the hypothesis H1 that participants require
shorter diagnosis lag in the supported case with Early Warning is validated.
This improvement in lag is expected as Early Warning provides participants
with a time advantage, as illustrated in a simple single alarm case in Figure 7. In the
unguided case (Figure 7a), participants are first alerted of the alarm at time TAU. After
being alerted of the alarm, they take (TEU – TA
U) seconds to diagnose the fault before
they submit their diagnosis, which signals the end of the scenario at time TEU. In the
supported case with Early Warning (Figure 7b), they are notified in advance about the
potential alarm at time TEWS, before the alarm is activated at time TA
S (= TAU). Thus,
they gain a time advantage of tEWS = (TA
S – TEWS) seconds. This time advantage means
that they could start their diagnosis process earlier by tEWS seconds and potentially
complete their diagnosis earlier too at TES < TE
U.
From the mouse click data, we can analyze the participants’ actions to check if
and how the time advantage is actually utilized. In particular, the time of the clicks on

Page 17 of 39
Accep
ted
Man
uscr
ipt
17
the alarm variable trend display relative to the time when the alarm is shown on the
Alarms Display window could provide an indication regarding participants’ usage of
the information. A mouse click to open the corresponding alarm variable trend display
within 30 seconds after the alarm is shown is considered to be a consequence of the
participant seeing the alarm information. With Early Warning, the participants are
alerted to potential alarms and they are able to click on the relevant trend displays for
further information before actual activation of the alarms. For example, in scenario 1
(reflux pump degradation), the first alarm TI17 HI occurred at time TAU = TA
S = 24
seconds. In the unguided case, after this alarm was activated, 17 out of 30 participants
proceeded to open the Trend Display of TI17, on average 9 seconds later. Other
variables also entered alarm status and based on this information, the participants
diagnosed the root cause and submitted their diagnosis on average at TEU = 174
seconds. In the supported case, a similar number, 17 out of 31 participants, opened the
Trend Display of TI17. However, in this case there was Early Warning for TI17 HI at
time TEWS = 10 seconds, resulting in a time advantage of tEW
S = 14 seconds. Eight out
of the 17 who opened the Trend Display of TI17 did so on average 5 seconds before
the alarm is activated at TAS = 24 seconds. Early warnings for the subsequent alarms
were also given and the participants eventually submitted their diagnosis on average
at TES = 153 seconds. Hence, the use of Early Warning in Scenario 1 resulted in a time
benefit of TES – TE
U = 21 seconds. Similar behaviour was observed in the other
scenarios as well.
The alarm time, Early Warning time, and time advantage of each alarm in the
four actual task scenarios are shown in Table 9. For these four tasks, there were a total
of 19 alarm predictions and the average early warning notification time (tEWS) was
approximately 28 seconds. This was the average time advantage that Early Warning
provided to the participants. Among the participants who utilized the time advantage
across all four actual tasks, it was found that on average, they opened the
corresponding trend display 14 seconds before the activation of the alarm. The time
advantage that was utilized averaged to 46%, with the maximum utilization being
82%. This shows that participants are indeed utilizing the time advantage provided to
them. With Early Warning, the participants received information about the state of the
plant earlier and they utilized the information earlier as well, thus resulting in the
ability to formulate a diagnosis with a shorter lag.

Page 18 of 39
Accep
ted
Man
uscr
ipt
18
4.2 Diagnosis Accuracy
The second performance measure is diagnosis accuracy, where participants’
diagnosis in each actual task is given a score of 0, 0.5, or 1. In this case, there are no
outliers as all data points are bounded between 0 and 1. The non-parametric Mann-
Whitney U test is used to compare the two sets of data in each scenario. The results
for each scenario are shown in Figure 8, where each error bar shows the 95%
confidence interval. In all four scenarios, the difference between the supported case
and the unguided case is not statistically significant at the 95% confidence level.
Scenario 1 has the largest difference, where the mean score for the supported case
(0.597) is lower than the unguided case (0.733), with p-value = 0.071. In the other
three scenarios, the mean scores from the two cases are comparable with no
statistically significant difference (p-value = 0.425, 0.548, and 0.286 for scenarios 3,
4, and 6, respectively). The overall results combining all four scenarios are shown in
Table 10. The mean score for the supported case (0.648) is slightly lower than the
unguided case (0.701), but this difference is not statistically significant at the 95%
confidence level (p-value = 0.174 > α = 0.050). Thus, the hypothesis H2 that
participants have better diagnosis accuracy in the supported case with Early Warning
is not validated. This could be because the information provided to the participants is
actually the same; Early Warning only shows this information earlier. The thought
processes after receiving the information would be the same and thus the same
diagnosis would be reached, only earlier. Hence, Early Warning does not seem to
improve diagnosis accuracy.
4.3 Differences between High and Low Scorers
It is also interesting to analyze if there are any differences between
participants who did well in the study and those who did not. For this, the participants
were ranked according to their total score from the four actual tasks. We found that
they could be divided into three groups of comparable size: 21 participants had scores
between 4.0 and 3.5, 20 participants between 3.0 and 2.5, and 20 participants between
2.0 and 0.0. We call the first group as “High Scorers” and the last group as “Low
Scorers” and compare these two groups to identify any patterns in behavior that could
distinguish them. The supported case and the unguided case are separated to see how
the two groups perform in each case. The difference in behavior was analyzed based
on diagnosis lag and mouse click patterns, as shown in Table 11.

Page 19 of 39
Accep
ted
Man
uscr
ipt
19
High Scorers generally perform better than Low Scorers in both diagnosis
accuracy and lag. Looking into each group, the earlier finding that Early Warning
leads to shorter diagnosis lag holds true for both High Scorers (116 s vs. 131 s) and
Low Scorers (143 s vs. 155 s). It can be seen that Early Warning reduces the average
number of clicks for both groups (4.48 to 3.81 for High Scorers and 5.75 to 3.80 for
Low Scorers), but increases the percentage of clicks on alarm and related variables,
especially for Low Scorers (clicks on alarm variables increased from 56% to 70%,
while clicks on related variables increased from 78% to 89%). An alarm variable is a
variable that has breached its alarm limit and trigger alarm. Here, ‘related’ variables
refers to those variables that contain important information specific to the abnormal
situation. This shows that Early Warning helps to focus the participants’ attention to
the relevant variables. However, this does not necessarily translate to higher diagnosis
accuracy. High Scorers are able to maintain their diagnosis accuracy at a high level
(0.94) regardless of early warning of alarms. Providing them with Early Warning
leads to faster diagnosis with no loss of accuracy. In contrast, the diagnosis accuracy
of the Low Scorers decreases (from 0.46 to 0.29) when they are provided with Early
Warning. In this case, providing early warning of alarms did not really help and could
even have the opposite effect of reducing accuracy.
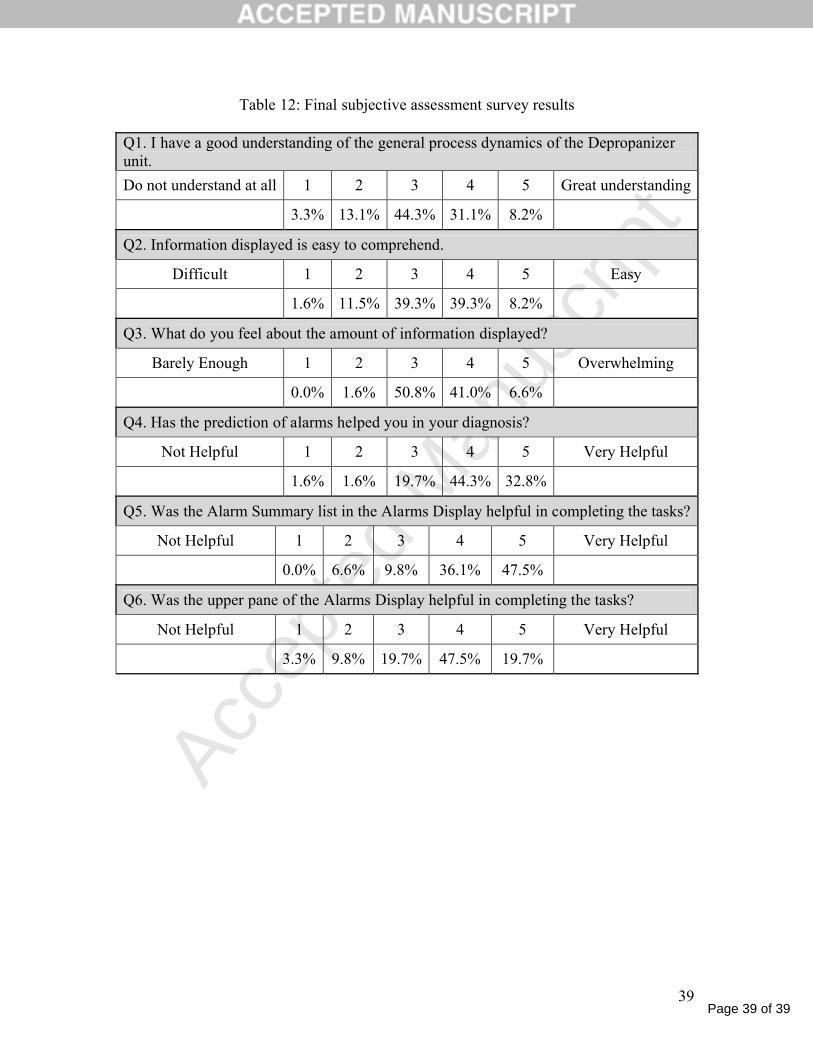
4.4 Subjective Assessment through Survey
A tabulation of the final subjective assessment survey data is shown in Table
12. This provides insights into participants’ views on their comprehension of the
displayed information and the different aspects of the displays. More than 83% have
at least a sufficient understanding of the process (Q1). Almost 87% feel that the
information displayed is sufficiently easy to comprehend (Q2). Both these statistics
suggest once again that the participants have sufficient background knowledge and
thus are suitable for the study, just as we would expect real operators to be familiar
with their process units. About 51% feel that the amount of information displayed is
just nice while 41% feel that it is slightly overwhelming (Q3). Over 77% of the
participants subjectively feel that the early warning of alarms provided are helpful
(Q4), which further emphasizes the effectiveness of Early Warning for decision
support. Both the Alarm Summary List (Q5) and the upper pane of the Alarms
Display (Q6) are found to be helpful, with the former rated higher than the latter.

Page 20 of 39
Accep
ted
Man
uscr
ipt
20
5. Conclusions and Discussion
Process monitoring and alarm management have seen more than 30 years of
research in developing various methods and tools for decision support.
Complementary to these is the human factors aspect, which is widely considered to be
very important but has received significantly less attention in the PSE community. In
this paper, we propose a generic experimental scheme to study the effectiveness of
decision support tools from a human factors perspective. Such studies can only be
achieved through experiments involving human participation. As an illustration, we
have conducted a human factors experiment to evaluate the effectiveness of Early
Warning of alarms. The results show that while Early Warning is effective in
improving diagnosis lag and subjectively found to be helpful by the participants, it
does not improve diagnosis accuracy.
There are several directions that can be explored further. The speed-accuracy
trade-off is a well-known phenomenon. Humans inevitably face a trade-off between
speed and accuracy when completing a task (Aperjis et al., 2011). This trade-off also
seems to apply here; while diagnosis lag or speed improves with Early Warning,
accuracy is slightly decreased (although not statistically significant). In this study, the
participants are instructed that both speed and accuracy are important, so one is not
emphasized over the other. Some participants may be naturally more inclined towards
speed while others towards accuracy, which might have an effect on the study results.
One way to circumvent this natural trade-off is to design a study that focuses only on
one objective. For example, we could design a closed-loop study where participants
can take actions based on their diagnosis to rectify the root-cause of the abnormality.
In this case, the performance measure could be the duration that the plant is in the
abnormal state. Both speed and accuracy are thus factored into a single performance
measure.
In this study, we have assumed that the cognitive behaviors of students match
those of operators. Since students may not be as experienced as operators, we have
used a relatively simple case study with one process unit. The process monitoring
scope of operators in the industry could be orders of magnitude larger with
concomitant complexities. Performing the study on operators would thus require
appropriate adjustment of the scale of the case study. This would be more challenging
but would also provide stronger validation of the results. Finally, this work provides a

Page 21 of 39
Accep
ted
Man
uscr
ipt
21
platform for further human factors studies within PSE to balance the emphasis that
has so far been on the methodology, algorithms, and the modeling aspect of decision
support tools. When effectiveness of decision support is demonstrated through human
factors studies, it would provide a strong selling point for industrial adoption of these
tools.
Acknowledgement
This work is funded by the Science and Engineering Research Council
(SERC), A*STAR, under the Human Factors Engineering (HFE) Thematic Strategic
Research Programme. Valuable discussions with Dr. Krishna Prasad and Dr. Meera
Sunny of Indian Institute of Technology Gandhinagar are also acknowledged.
References
[1] Andow, P. (1997). Abnormal situation management: a major US programme
to improve management of abnormal situations. In IEE Colloquium: Stemming
the Alarm Flood. London: Institute of Electrical Engineers, 3/1-3/4.
[2] Aperjis, C., Huberman, B. A., & Wu, F. (2011). Human Speed-Accuracy
Tradeoffs in Search. In Proceedings of the 44th Hawaii International
Conference on System Sciences (HICSS) Hawaii, 1-10.
[3] ASM Consortium. (2009). Effective alarm management practices.
[4] Bransby, M. L., & Jenkinson, J. (1998). Alarm management in the chemical
and power industries: Results of a survey for the HSE. In IEE Colloquium:
Best Practices in Alarm Management. London: Institute of Electrical
Engineers, 5/1-5/10.
[5] Brooks, R., Thorpe, R., & Wilson, J. (2004). A new method for defining and
managing process alarms and for correcting process operation when an alarm
occurs. Journal of Hazardous Materials, 115, 169-174.
[6] Brown, D. C., & O'Donnell, M. (1997). Too much of a good thing? Alarm
management experience in BP oil, Part 1: Alarm management experience in
BP oil. In IEE Colloquium: Stemming the Alarm Flood. London: Institution of
Electrical Engineers, 5/1-5/6.
[7] Burns, C. M. (2006). Towards proactive monitoring in the petrochemical
industry. Safety Science, 44, 27-36.

Page 22 of 39
Accep
ted
Man
uscr
ipt
22
[8] Cheng, Y., Izadi, I., & Chen, T. (2013). Pattern matching of alarm flood
sequences by a modified Smith-Waterman algorithm. Chemical Engineering
Research and Design, 91(6), 1085-1094.
[9] Chu, R., Bullemer, P. T., Harp, S., Ramanathan, P., & Spoor, D. (1994).
Qualitative user aiding for alarm management (QUALM): An integrated
demonstration of emerging technologies for aiding process control operators.
In Proceedings of the 1994 IEEE International Conference on Systems, Man,
and Cybernetics.
[10] Cullen, L. (2007). Human factors integration – Bridging the gap between
system designers and end-users: A case study. Safety Science, 45, 621-629.
[11] Emigholz, K. F. (1996). Improving the operator’s capabilities during abnormal
operations; Observations from the control house. Process Safety Progress,
15(3), 154-158.
[12] Endsley, M. (1988). Design and evaluation for situational awareness
enhancement. In Proceedings of the Human Factors Society 32nd Annual
Meeting Santa Monica, 97-101.
[13] Endsley, M. R. (1995). Toward a theory of situation awareness in dynamic-
systems. Human Factors, 37(1), 32-64.
[14] Foong, O. M., Sulaiman, S. B., Rambli, D. R. B. A., & Abdullah, N. S. B.
(2009). ALAP: Alarm prioritization system for oil refinery. In Proceedings of
the World Congress on Engineering and Computer Science San Francisco.
[15] Hall, R. (1998). Psychology World, http://web.mst.edu/~psyworld/index.htm,
retrieved on 25 Jul 2013.
[16] Helander, M. (2006). A guide to human factors and ergonomics. Boca Raton:
Taylor & Francis.
[17] Helander, M. (2011). Personal Communication.
[18] Hertwig, R., & Ortmann, A. (2001). Experimental practices in economics: A
methodological challenge for psychologists?. Behavioral and Brain Sciences,
24, 383-451.
[19] Higuchi, F., Yamamoto, I., Takai, T., Noda, M., & Nishitani, H. (2009). Use
of event correlation analysis to reduce number of alarms. In Proceedings of
the 10th International Symposium on Process Systems Engineering Salvador,
Bahia, Brazil, 1521-1526.

Page 23 of 39
Accep
ted
Man
uscr
ipt
23
[20] International Ergonomics Association. (2014). Definition and Domains of
Ergonomics. http://www.iea.cc/whats/index.html, retrieved on 11 Mar 2014.
[21] International Society of Automation. (2009). Management of alarm systems
for the process industries.•Technical report.
[22] Jamieson, G. A., & Vicente, K. J. (2001). Ecological interface design for
petrochemical applications: Supporting operator adaption, continuous
learning, and distributed, collaborative work. Computers and Chemical
Engineering, 25(7-8), 1055-1074.
[23] Kariuki, S. G., & Lowe, K. (2006). Increasing human reliability in the
chemical process industry using human factors techniques. Process Safety and
Environmental Protection, 84(B3), 200-207.
[24] Kariuki, S. G., Vadillo, E. M., & Lowe, K. (2007). Human Factors
Assessment Technique for the Chemical Process Industry. Chemical
Engineering Technology, 30(10), 1319-1327.
[25] Kontogiannis, T., & Embrey, D. (1997). A user-centred design approach for
introducing computer-based process information systems. Applied
Ergonomics, 28(2), 109-119.
[26] Liu, J., Lim, K. W., Ho, W. K., Tan, K. C., Srinivasan, R., & Tay, A. (2003).
The intelligent alarm management system. IEEE Software, 20(2), 66-71.
[27] Mann, H. B., & Whitney, D. R. (1947). On a Test of Whether One of Two
Random Variables is Stochastically Larger than the Other. Annals of
Mathematical Statistics, 18(1), 50-60.
[28] MathWorks. (2013). MATLAB Online Documentation,
http://www.mathworks.com, retrieved on 25 Jul 2013.
[29] Moore, D. S., & McCabe, G. P. (1999). Introduction to the Practice of
Statistics, 3rd ed. New York: W. H. Freeman.
[30] Morae. (2012). Retrieved from Morae usability testing software from
TechSmith: http://www.techsmith.com/morae.html
[31] Nachtwei, J. (2011). The many faces of human operators in process control: a
framework of analogies. Thereotical Issues in Ergonomics Science, 12(4),
297-317.
[32] Nishitani, H., Kawamura, T., & Suzuki, G. (2000). University-industry
cooperative study on plant operations. Computers and Chemical Engineering,
24, 557-567.

Page 24 of 39
Accep
ted
Man
uscr
ipt
24
[33] Parasuraman, R., & Wickens, C. D. (2008). Humans: still vital after all these
years of automation. Human Factors, 50(3), 511-520.
[34] Spenkelink, G. P. J. (1990). Aiding the operator’s anticipatory behavior: The
design of process state information. Applied Ergonomics, 21(3), 199-206.
[35] Srinivasan, R., Liu, J., Lim, K. W., Tan, K. C., & Ho, W. K. (2004).
Intelligent alarm management in a petroleum refinery: Plant safety and
environment. Hydrocarbon Processing, 47-53.
[36] Stanton, N. A., Chambers, P. R. G., & Piggott, J. (2001). Situational
awareness and safety. Safety Science, 39, 189-204.
[37] Tharanathan, A., Bullemer, P., Laberge, J., Reising, D. V., & Mclain, R.
(2012). Impact of Functional and Schematic Overview Displays on Console
Operators’ Situation Awareness. Journal of Cognitive Engineering and
Decision Making, 6(2), 141-164.
[38] Wall, K. (2009). Complexity of chemical products, plants, processes and
control systems. Chemical Engineering Research and Design, 87, 1430-1437.
[39] Walster, E., Berscheid, E., Abrahams, D., & Aronson, V. (1967).
Effectiveness of debriefing following deceptive experiments. Journal of
Personality and Social Psychology, 6, 371-380.
[40] Widiputri, D. I., Lowe, K., & Loher, H.-J. (2009). Systematic Approach to
Incorporate Human Factors Into a Process Plant Design. Process Safety
Progress, 28(4), 347-355.
[41] Xu, S., Yin, S., Srinivasan, R., & Helander, M. (2012). Proactive alarms
monitoring using predictive technologies. In Proceedings of the 11th
International Symposium on Process Systems Engineering Singapore, 1447-
1451.
[42] Yin, S. (2011). Proactive monitoring in process control using predictive trend
display. PhD Thesis, Nanyang Technological University, Singapore.

Page 25 of 39
Accep
ted
Man
uscr
ipt
25
Figure 1: Schematic of the depropanizer unit (Xu et al., 2012)
Page 26 of 39
Accep
ted
Man
uscr
ipt
26
Figure 2: Schematic Display
Page 27 of 39
Accep
ted
Man
uscr
ipt
27
11/11/2012 16:47:42
Location Source Condition DescriptionAlarm Summary
Date & Time
11/11/2012 16:47:50
11/11/2012 16:47:53
11/11/2012 16:48:01
Figure 3: Alarms Display in unguided case (without Early Warning)

Page 28 of 39
Accep
ted
Man
uscr
ipt
28
11/11/2012 16:46:01
Location Source Condition DescriptionAlarm Summary
Date & Time
11/11/2012 16:46:09
Figure 4: Alarms Display in supported case (with Early Warning)

Page 29 of 39
Accep
ted
Man
uscr
ipt
29
Start Read Handouts Video Walkthrough
Diagnosis Task
Survey
All tasks done?
Case 1: Supported or Unguided
No
Nex
t Tas
k
Video Walkthrough
Diagnosis Task
Survey
All tasks done?
Case 2: Unguided or Supported
NoYes
Nex
t Tas
k
Final Survey End
Yes
Figure 5: Study procedure

Page 30 of 39
Accep
ted
Man
uscr
ipt
30
Figure 6: Participant in the midst of the study

Page 31 of 39
Accep
ted
Man
uscr
ipt
31
Scenario progression with timeUser
submits diagnosis. End of Scenario.
Start of Scenario
TAU
Fault introduced Alarm limit of process variable breached. User alerted by alarm.
TEU
(a) Unguided case (without Early Warning)
User alerted by Early Warning of alarm
Scenario progression with timeUser
submits diagnosis. End of Scenario.
Start of Scenario
tEWS
Fault introduced Alarm limit of process variable breached. User alerted by alarm.
TES
TASTEW
S
(b) Supported case (with Early Warning)
Figure 7: Breakdown of scenario progression

Page 32 of 39
Accep
ted
Man
uscr
ipt
32
0.597
0.733
0
0.1
0.2
0.3
0.4
0.5
0.6
0.7
0.8
0.9
Diagnosis Accuracy (0-1)
Supported (n=31)Unguided (n=30)
p = 0.071
0.667 0.645
0
0.1
0.2
0.3
0.4
0.5
0.6
0.7
0.8
0.9
Diagnosis Accuracy (0-1)
Supported (n=30)
Unguided (n=31)
p = 0.425
(a) Scenario 1 (b) Scenario 3
0.516 0.533
0
0.1
0.2
0.3
0.4
0.5
0.6
0.7
0.8
Diagnosis Accuracy (0-1)
Supported (n=31)
Unguided (n=30)
p = 0.548
0.8170.887
0
0.1
0.2
0.3
0.4
0.5
0.6
0.7
0.8
0.9
1
Diagnosis Accuracy (0-1)
Supported (n=30)
Unguided (n=31)
p = 0.286
(c) Scenario 4 (d) Scenario 6
Figure 8: Diagnosis accuracy in four scenarios

Page 33 of 39
Accep
ted
Man
uscr
ipt
33
Table 1: Eight alarm variables in the case study
Alarm Variable DescriptionTI13 Temperature of bottom product
TI14 Temperature of tray 26 in distillation tower
TI16 Temperature of reflux flow
TI17 Temperature of top tray in distillation tower
TC11 Temperature of tray 34 in distillation tower
LC11 Liquid level in bottom hold-up of distillation tower
LC12 Liquid level in reflux drum
PC11 Pressure of distillation tower
Table 2: Sequence of alarms in the six scenarios
Scenario Description Alarms1 Reflux pump
degradationTI17 HI , LC12 HI, TI16 HI, TI14 HI, LC11 LO, TC11 HI, TI13 HI, PC11 HI
2 Loss of cooling water
PC11 HI, TI16 HI, TI13 HI, TI17 HI, LC12 LO
3 Loss of hot oil TC11 LO, LC11 HI, LC12 LO
4 Loss of feed LC11 LO, TI14 HI, TC11 HI
5 Reboiler fouling TC11 LO, LC11 HI, LC12 LO
6 Condenser fouling
PC11 HI, TI16 HI, TI13 HI, TI17 HI, LC12 LO
Table 3: Diagnosis Options
No Diagnosis Option1 Condenser fouling2 Loss of cooling water3 Loss of hot oil4 Column leak5 Reboiler fouling6 Sensor fault7 Loss of feed8 Reflux pump degradation9 None of the above
Page 34 of 39
Accep
ted
Man
uscr
ipt
34
Table 4: Scoring of diagnosis accuracy
Scenario Full Score (1) Partial Score (0.5)1. Reflux pump degradation Reflux pump
degradationLoss of cooling water; Condenser fouling
2. Loss of cooling water Loss of cooling water; Condenser fouling
Reflux pump degradation
3. Loss of hot oil Loss of hot oil Reboiler fouling
4. Loss of feed Loss of feed -
5. Reboiler fouling Reboiler fouling Loss of hot oil
6. Condenser fouling Condenser fouling; Loss of cooling water
Reflux pump degradation
Table 5: Survey questions after each diagnosis task
Please rate from 1 (strongly disagree) to 5 (strongly agree)
1) I can follow the development of the process during the task.
2) I am confident of my analysis for the task.

Page 35 of 39
Accep
ted
Man
uscr
ipt
35
Table 6: Final survey at the end of the study
Please rate from 1 to 5
1) I have a good understanding of the general process dynamics of the
depropanizer unit.
(1 = Do not understand at all; 5 = Great understanding)
2) Information displayed is easy to comprehend.
(1 = Difficult; 5 = Easy)
3) What do you feel about the amount of information displayed?
(1 = Barely enough; 5 = Overwhelming)
4) Has the prediction of alarms helped you in your diagnosis?
(1 = Not helpful; 5 = Very helpful)
5) Was the upper pane of the Alarms Display helpful in completing the
tasks?
(1 = Not helpful; 5 = Very helpful)
6) Was the alarm summary list helpful in your diagnosis during the tasks?
(1 = Not helpful; 5 = Very helpful)
Table 7: Task survey response
Q1. I can follow the development of the process during the task.
Strongly disagree 1 2 3 4 5 Strongly agree
2% 5.5% 28.5% 45% 19%
Q2. I am confident of my analysis for the task.
Strongly disagree 1 2 3 4 5 Strongly agree
3.5% 16% 34% 34.5% 12%

Page 36 of 39
Accep
ted
Man
uscr
ipt
36
Table 8: Statistics for diagnosis lag in seconds
Statistics Supported UnguidedNumber of Samples 118 120Mean 123.96 143.97Median 101.49 125.74Standard Deviation 74.97 85.52Range 307.55 360.32Minimum 27.31 24.14Maximum 334.86 384.46Confidence Level (95%) 13.67 15.46
Table 9: Time advantage provided by Early Warning in the four actual scenarios
Scenario Alarms Alarm Time (s)
Early WarningTime (s)
Time Advantage (s)
1. Reflux pump degradation
TI17 HILC12 HITI16 HITI14 HILC11 LOTC11 HITI13 HIPC11 HI
248088143145176249253
10727498106139229239
148144539372014
3. Loss of hot oil TC11 LOLC11 HILC12 LO
255180
132645
122535
4. Loss of feed LC11 LOTI14 HITC11 HI
6988104
384363
314541
6. Condenser fouling PC11 HITI16 HITI13 HITI17 HILC12 LO
296389127141
14354592108
1528443533

Page 37 of 39
Accep
ted
Man
uscr
ipt
37
Table 10: Statistics for diagnosis accuracy
Statistics Supported UnguidedNumber of Samples 122 122Mean 0.648 0.701Median 1.000 1.000Standard Deviation 0.425 0.400Range 1.000 1.000Minimum 0.000 0.000Maximum 1.000 1.000Confidence Level (95%) 0.076 0.072

Page 38 of 39
Accep
ted
Man
uscr
ipt
38
Table 11: Comparison of high and low scorers in supported case and unguided case. Mean is shown without brackets and standard deviation within brackets.
Statistics High Scorers Low Scorers Supported Diagnosis Score 0.94 (0.16) 0.29 (0.37)
Diagnosis lag (seconds) 116.21 (107.19) 143.04 (77.96)Number of Clicks 3.81 (4.53) 3.80 (3.91)Percentage of Clicks on Alarm Variables 43% (34%) 70% (36%)Percentage of Clicks on Related Variables 79% (27%) 89% (25%)Number of Samples 42 40
Unguided Diagnosis Score 0.94 (0.16) 0.46 (0.41)Diagnosis lag (seconds) 130.60 (94.22) 154.89 (92.63)Number of Clicks 4.48 (5.14) 5.75 (6.71)Percentage of Clicks on Alarm Variables 40% (30%) 56% (32%)Percentage of Clicks on Related Variables 74% (24%) 78% (27%)Number of Samples 42 40
Page 39 of 39
Accep
ted
Man
uscr
ipt
39
Table 12: Final subjective assessment survey results
Q1. I have a good understanding of the general process dynamics of the Depropanizer unit.
Do not understand at all 1 2 3 4 5 Great understanding
3.3% 13.1% 44.3% 31.1% 8.2%
Q2. Information displayed is easy to comprehend.
Difficult 1 2 3 4 5 Easy
1.6% 11.5% 39.3% 39.3% 8.2%
Q3. What do you feel about the amount of information displayed?
Barely Enough 1 2 3 4 5 Overwhelming
0.0% 1.6% 50.8% 41.0% 6.6%
Q4. Has the prediction of alarms helped you in your diagnosis?
Not Helpful 1 2 3 4 5 Very Helpful
1.6% 1.6% 19.7% 44.3% 32.8%
Q5. Was the Alarm Summary list in the Alarms Display helpful in completing the tasks?
Not Helpful 1 2 3 4 5 Very Helpful
0.0% 6.6% 9.8% 36.1% 47.5%
Q6. Was the upper pane of the Alarms Display helpful in completing the tasks?
Not Helpful 1 2 3 4 5 Very Helpful
3.3% 9.8% 19.7% 47.5% 19.7%