
A Binary Nature of the Marginal CP Star Sigma Sculptoris
11
A Binary Nature of the Marginal CP Star Sigma Sculptoris Jan Janík 1 , Jir ̌ í Krtička 1 , Zdeněk Mikulášek 1 , Juraj Zverko 2 , Olga Pintado 3 , Ernst Paunzen 1 , Milan Prvák 1 , Jan Skalický 1 , Miloslav Zejda 1 , and Christian Adam 4 1 Department of Theoretical Physics and Astrophysics, Faculty of Science, Masaryk University Kotlár ̌ ská 2, CZ-611 37 Brno, Czech Republic [email protected] 2 SK-059 60, Tatranská Lomnica 133, Slovakia 3 Instituto Superior de Correlación Geológica, CONICET, San Miguel de Tucumán, Argentina 4 Instituto de Astronomia, Universidad Catolica del Norte, Av. Angamos 0610, Castilla 1280 Antofagasta, Chile Received 2017 November 13; accepted 2018 February 20; published 2018 April 2 Abstract The A2 V star σ Scl was suspected of being a low-amplitude rotating variable of the Ap-type star by several authors. Aiming to decide whether the star is a variable chemically peculiar (CP) star, we searched for the photometric and spectroscopic variability, and determined chemical abundances of σ Scl. The possible variability was tested using several types of periodograms applied to the photometry from Long-Term Photometry of Variables project (LTPV) and Hipparcos. Sixty spectrograms of high signal-to-noise (S/N) were obtained and used for chemical analysis of the stellar atmosphere and for looking for spectral variability that is symptomatic for the CP stars. We did not find any signs of the light variability or prominent chemical peculiarity, that is specific for the CP stars. The only exception is the abundance of scandium, which is significantly lower than the solar one and yttrium and barium, which are strongly overabundant. As a by-product of the analysis, and with the addition of 29 further spectra, we found that σ Scl is a single-lined spectroscopic binary with orbital period of 46.877(8) d. We argue that σ Scl is not an Ap star, but rather a marginal Am star in SB1 system. The spectral energy distribution of the binary reveals infrared excess due to circumstellar material. Key words: stars: chemically peculiar – stars: early-type – (stars:) binaries: spectroscopic – stars: variables: general – stars: individual (σ Scl) < – Stars Online material: color figure 1. Introduction The peculiarity of a part of the upper main-sequence stars manifests itself through enhanced spectral lines of some chemical elements and weakened lines of helium, calcium, and scandium. Even if this phenomenon has been known since the end of the nineteenth century (Maury 1897), several fundamental questions remain unanswered until now. The peculiarity of stars with spectra classified as “Ap” or “Bp,” was explained as a consequence of overabundance and a deficit of chemical elements in their atmospheres, which differ from the standard solar abundance (for example Preston 1974). It is accepted that such a phenomenon is a consequence of slow atomic diffusion or a settling in calm upper layers of these stars, then designated as chemically peculiar “CP” stars (Michaud 1970). A further key feature of the classical Ap and Bp stars are periodic changes in the strength and radial velocity of spectral lines and a weak or moderate photometric variability of the same period. Babcock (1947) discovered a global dipolar magnetic field in the star 78 Virginis and cataloged similar stars (Babcock 1958) in which the variability of the field strength in many Ap and Bp stars–including even a reversal of magnetic polarity—was also unveiled. Stibbs (1950) introduced the “Oblique Rotator” model, representing a rigidly rotating star with non-coincident magnetic and rotational axes. Due to the uneven distribution of chemical elements on the stellar surface, the spectral and the related photometric variabilities have been easily understood. However, the expected strict relationship between the locations of spectral and photometric spots on the magnetic chemically peculiar (mCP) stars and their magnetic field geometry is documented in only a few members of the mCP stars. Recently, Rusomarov et al. (2015) showed that surface abundance maps of HD 24712 are inconsistent with the predictions of the current theory of atomic diffusion in the presence of magnetic fields. Krtička et al. (2007, 2009) concluded that although the agreement between the observed and computed light curves seems satisfactory, other effects such as NLTE may play a major role. Shulyak et al. (2010) summarize that the simulated light variability of ε UMa is in very close agreement with the observations; however, the theoretical variation of its β index (defined by Crawford & Mander (1966) related to the Balmer Hβ line) is approximately one order of magnitude smaller than the observed. Krtička et al. Publications of the Astronomical Society of the Pacific, 130:054203 (11pp), 2018 May https://doi.org/10.1088/1538-3873/aab142 © 2018. The Astronomical Society of the Pacific. All rights reserved. Printed in the U.S.A. 1
Transcript of A Binary Nature of the Marginal CP Star Sigma Sculptoris

A Binary Nature of the Marginal CP Star Sigma SculptorisJan Janík1 , Jirí Krtička1, Zdeněk Mikulášek1, Juraj Zverko2, Olga Pintado3, Ernst Paunzen1 , Milan Prvák1, Jan Skalický1,
Miloslav Zejda1 , and Christian Adam4
1 Department of Theoretical Physics and Astrophysics, Faculty of Science, Masaryk University Kotlárská 2, CZ-611 37 Brno, Czech [email protected]
2 SK-059 60, Tatranská Lomnica 133, Slovakia3 Instituto Superior de Correlación Geológica, CONICET, San Miguel de Tucumán, Argentina
4 Instituto de Astronomia, Universidad Catolica del Norte, Av. Angamos 0610, Castilla 1280 Antofagasta, ChileReceived 2017 November 13; accepted 2018 February 20; published 2018 April 2
Abstract
The A2 V star σ Scl was suspected of being a low-amplitude rotating variable of the Ap-type star by severalauthors. Aiming to decide whether the star is a variable chemically peculiar (CP) star, we searched for thephotometric and spectroscopic variability, and determined chemical abundances of σ Scl. The possible variabilitywas tested using several types of periodograms applied to the photometry from Long-Term Photometry ofVariables project (LTPV) and Hipparcos. Sixty spectrograms of high signal-to-noise (S/N) were obtained andused for chemical analysis of the stellar atmosphere and for looking for spectral variability that is symptomatic forthe CP stars. We did not find any signs of the light variability or prominent chemical peculiarity, that is specific forthe CP stars. The only exception is the abundance of scandium, which is significantly lower than the solar one andyttrium and barium, which are strongly overabundant. As a by-product of the analysis, and with the addition of 29further spectra, we found that σ Scl is a single-lined spectroscopic binary with orbital period of 46.877(8) d. Weargue that σ Scl is not an Ap star, but rather a marginal Am star in SB1 system. The spectral energy distribution ofthe binary reveals infrared excess due to circumstellar material.
Key words: stars: chemically peculiar – stars: early-type – (stars:) binaries: spectroscopic – stars: variables: general –stars: individual (σ Scl) < – Stars
Online material: color figure
1. Introduction
The peculiarity of a part of the upper main-sequence starsmanifests itself through enhanced spectral lines of somechemical elements and weakened lines of helium, calcium,and scandium. Even if this phenomenon has been known sincethe end of the nineteenth century (Maury 1897), severalfundamental questions remain unanswered until now.
The peculiarity of stars with spectra classified as “Ap” or“Bp,” was explained as a consequence of overabundance and adeficit of chemical elements in their atmospheres, which differfrom the standard solar abundance (for example Preston 1974).It is accepted that such a phenomenon is a consequence of slowatomic diffusion or a settling in calm upper layers of thesestars, then designated as chemically peculiar “CP” stars(Michaud 1970). A further key feature of the classical Apand Bp stars are periodic changes in the strength and radialvelocity of spectral lines and a weak or moderate photometricvariability of the same period.
Babcock (1947) discovered a global dipolar magnetic field inthe star 78 Virginis and cataloged similar stars (Babcock 1958)in which the variability of the field strength in many Ap and Bp
stars–including even a reversal of magnetic polarity—was alsounveiled. Stibbs (1950) introduced the “Oblique Rotator”model, representing a rigidly rotating star with non-coincidentmagnetic and rotational axes. Due to the uneven distribution ofchemical elements on the stellar surface, the spectral and therelated photometric variabilities have been easily understood.However, the expected strict relationship between the locationsof spectral and photometric spots on the magnetic chemicallypeculiar (mCP) stars and their magnetic field geometry isdocumented in only a few members of the mCP stars.Recently, Rusomarov et al. (2015) showed that surface
abundance maps of HD 24712 are inconsistent with thepredictions of the current theory of atomic diffusion in thepresence of magnetic fields. Krtička et al. (2007, 2009)concluded that although the agreement between the observedand computed light curves seems satisfactory, other effectssuch as NLTE may play a major role. Shulyak et al. (2010)summarize that the simulated light variability of εUMa is invery close agreement with the observations; however, thetheoretical variation of its β index (defined by Crawford &Mander (1966) related to the Balmer Hβ line) is approximatelyone order of magnitude smaller than the observed. Krtička et al.
Publications of the Astronomical Society of the Pacific, 130:054203 (11pp), 2018 May https://doi.org/10.1088/1538-3873/aab142© 2018. The Astronomical Society of the Pacific. All rights reserved. Printed in the U.S.A.
1

(2013) show that neither maximum overabundance of heliumand silicon on the surface of the low-amplitude rotatingvariable CP star HD 64740 do not cause a substantial lightvariability.
For this study, we selected a bright star, σ Scl (HR 293),which is labeled in the SIMBAD database as an α2 CanumVenaticorum- (ACV) type star. All published parameters ofσScl are listed in Table 1. This group of variable stars isknown to have distinctive photometric variability with anamplitude of up to a tenth of magnitude (Hümmerichet al. 2016). However, while Rufener & Bartholdi (1982)observed a variability with an amplitude of 0.06 mag in V filter,the revised version of the Geneva catalogue by Rufener (1988)claimed a smaller amplitude. De Rosa et al. (2014) includedσ Scl in the Volume-limited A-STar (VAST) survey andreported its duplicity.
In this study, we review all available photometric observa-tions. We also obtained a series of high-resolution, high signal-to-noise ratio (S/N) spectra to analyse the spectral line intensityvariability and duplicity.
2. Photometric Variability
The star was observed within the years 1988–1993 in theStrömgren photometric system in the frame of the Long-TermPhotometry of Variables project (LTPV; see Sterken(1983, 1986); Manfroid et al. (1991a, 1991b); Sterken et al.(1993)), in which σScl served as a comparison star to α Scl. Intotal, 1560 individual uvby measurements were published byManfroid & Renson 1994, who confirmed the weak variabilityof σScl. They also indicated a few possible periods, with amost likely one P=2 36975(20), while P=1 37675(10)could be its alias.
We searched for a possible periodic variability using theLTPV data (1560 individual measurements) and Hp measure-ments by Hipparcos satellite (98 measurements; ESA 1998).The amplitude spectrum for photometric measurements bandsy, Hp, b, v, u, do not show any pattern of apparent periodicity
expected in the case of rotationally modulated variability (seeFigure 1). The maximum amplitude peaks, as a rule, do notreach the level of those ones expected in pure random scatter ofthe signal. This level was computed by the shuffle methodmentioned and described in Paunzen et al. (2013) andMikulášek et al. (2015) for particular photometric bands. Atthe same time, we evaluated the statistical significance of thedominant peaks in individual photometric bands by thebootstrapping test, and found that no peak in the studiedamplitude spectrum exceeds the significance of 20% (Mikulá-šek et al. 2015). Consequently, the accuracy of photometricmeasurements we have at our disposal does not allow us to findany statistically approved periodical variability. Particularly, noone from periodograms cited in Mikulášek et al. (2015),especially Periodogram with Modulated Amplitude, RobustS/N Periodogram, and Classical Lomb-Scargle Periodogram,indicate any of the periods mentioned by Manfroid & Renson(1994) (see also Figure 1).
3. Spectroscopic Variability
As a next step, we investigated the spectroscopic character-istics of σScl.
3.1. Observations
The observations were performed with four different echellespectrographs. First, we used the high dispersion echellespectrograph FEROS (R=48 000) attached to the 2.2 MPG/ESO telescope at La Silla Observatory (ESO) in Chile. Wecollected 60 spectra during two observational runs (34 spectrain 2011 and 26 in 2012); these spectra are listed in Table 2.Each individual spectrum has an integrating time 600 sreaching S/N≈500 with the exception of spectra forHJD=2455776.76378-2455776.96153, which have half ofthe exposure time resulting in S/N≈250. The secondinstrument was the high dispersion echelle spectrographGIRAFFE (R=23,000) attached to the 1.9-m telescopeat South African Astronomical Observatory (SAAO). Weobtained three spectra during two nights in 2011. Eachindividual spectrum has an integrating time of 1200 s reachingS/N≈130.The third and fourth echelle spectrographs were REOSC
(R=8,600; 10 spectra) and high dispersion EBASIM(R=31,000; 16 spectra) attached to the Jorge Sahade 2.15-mtelescope at El Leoncito Observatory (CASLEO) in Argentina.The exposure times and S/N are listed in Table 2.The data were reduced with the standard IRAF5 routines.
The spectra were bias-corrected and flat-fielded. We used theTh-Ar-Ne comparison spectrum for a precise wavelengthcalibration, which was sensed through a second fiber
Table 1Published Parameters of σScl (HD 6178, HIP 4852, and HR 293)
Spectral type A2 V Abt & Morrell (1995)Johnson B 5.586±0.014 mag Høg et al. (2000)Johnson V 5.501±0.009 mag Høg et al. (2000)Strömgren u 7.061±0.016 mag Hauck & Mermilliod (1998)Strömgren v 5.778±0.013 mag Hauck & Mermilliod (1998)Strömgren b 5.549±0.011 mag Hauck & Mermilliod (1998)Strömgren y 5.510±0.011 mag Hauck & Mermilliod (1998)β 2.897±0.008 mag Hauck & Mermilliod (1998)Ks 5.224±0.017 mag Cutri et al. (2003)vr −15.4±0.5 km/s Gontcharov (2006)vrot sin i 82.1±1.2 km/s Díaz et al. (2011)Distance 71.2±1.6 pc McDonald et al. (2017)
5 IRAF is distributed by NOAO, which is operated by AURA, Inc., undercooperative agreement with the National Science Foundation.
2
Publications of the Astronomical Society of the Pacific, 130:054203 (11pp), 2018 May Janík et al.

simultaneously with the spectrum of the star through the firstfiber in case for FEROS spectra. For the other instruments, weused calibration Th-Ar spectra which were measured beforeand after the stellar spectrum. We used also IRAF (taskimexam) for S/N measurement of normalized spectra atwavelengths where maximum signal was obtained.
3.2. Stellar Parameters
The effective temperature and surface gravity values listed inTable 3 were derived using the codes UVBYBETA (Moon &Dworetsky 1985) and TEFFLOGG (Smalley & Dworetsky1995) using the values for uvbyβ from Table 1.
The evolutionary tracks for solar metallicity ([Z]=0.014)from Bressan et al. (2012) and the above-mentioned astro-physical parameters yield an age of about 500Myr for σScl.
3.3. Line Profile and Radial Velocity Variability
We investigated a possible presence of line profile variationsas one of characteristic attributes of variable A-type stars.Smalley et al. (2017) investigated the pulsational behaviour ofAm stars. There are δ Scuti, γ Doradus, and hybrid types
found among Am stars. They conclude that δ Scuti typepulsations are mostly confined to the effective temperaturerange 6900< Teff < 7600 K, whereas γ Doradus starsare cooler than 7500 K. Our target is outside the blue edge ofthe classical instability strip given the estimated Teff and log gvalues. We would therefore not expect to find pulsation withinthe limits of our data set.We used for searching of line profile variations the temporal
variance spectrum technique (TVS), devised by Fullerton et al.(1996). We calculated the self-TVS using the last night ofFEROS data (HJD 56159). For two spectral lines in region4400–4500Å Ti II 4443.801Å and Mg II 4481.327Å andtwo ions Sr II 4215.519Å, Ba II 4934.076Å, we obtained anegative result (see Figure 2).We also used TVS for spectra averaged over individual
nights. We co-added individual shifted spectra (correcting fororbital motion) and used the first spectrum as zero point. Wefound again no significant signal.We measured the individual radial velocity for each of the 89
spectra (see Table 2) by means of a cross-correlation function(CCF) using the theoretical spectrum (described in Section 3.4)as a template (Zverko et al. 2007). We processed each spectral
Figure 1. Amplitude spectrum of light variations of σ Scl in u, v, b, y, and Hp colors for the frequencies from 0.05 to 1.95 d−1. There are no statically significantfrequency peaks, except the double around the frequency of 1 sidereal day, apparent in v and u, that are the artifacts of the strong sampling of ground-basedobservations and imperfect detrending of uv data. The vertical dotted lines denote the frequencies f1 and f2 of variability mentioned in Manfroid & Renson (1994). Thedashed lines express the mean level of the maximum peak if there is no periodic signal in measurements.
3
Publications of the Astronomical Society of the Pacific, 130:054203 (11pp), 2018 May Janík et al.

order individually and calculated the weighted mean value foreach observation. Our analysis based on inspection of 89spectrograms from four spectrographs (see Table 2) confirmedthe presence of the radial velocity variability reported in theliterature (Neubauer 1930; Wilson 1953; Bond et al. 1971;Gontcharov 2006). We have found that the observed radialvelocity variation is cyclic with the period P=46 877(8). Thecourse of the RV phase curve (see Figure 3) can be explained asthe consequence of the orbital motion of the primary
component bound in a spectroscopic double star with theparameters summarized in Table 4. The radial velocity curvewas fitted by robust regression eliminating the influence ofoutliers (for details, see Mikulášek & Zejda 2013). Anyphotometric variability connected with the orbital period of thestar have not been revealed.To detect assumptive spectral lines of the secondary comp-
onent, we subtracted the average spectrum, which we have gainedas sum of all spectra shifted by radial velocity of primary
Table 2List of Spectra Obtained Using FEROS@La Silla (A), GIRAFFE@SAAO (B), REOSC@CASLEO (C), and EBASIM@CASLEO (D). HJD is the Mean Heliocentric
Julian Date Reduced by 2,450,000. Phase j is Calculated According T0 and P from Table 4
HJD j In. Reg.[nm] τ [s] S/N vrad [km s−1] HJD j In. Reg.[nm] τ [s] S/N vrad [km s−1]
5775.890 0.4087 A 370–920 600 500 −0.99±0.92 6157.927 0.5585 A 370–920 600 500 −5.87±0.735775.916 0.4093 A 370–920 600 500 −0.98±0.69 6158.805 0.5772 A 370–920 600 500 −6.04±0.785775.940 0.4098 A 370–920 600 500 −0.96±0.84 6158.861 0.5784 A 370–920 600 500 −6.20±0.775776.762 0.4273 A 370–920 300 250 −1.66±0.86 6158.914 0.5796 A 370–920 600 500 −6.30±0.785776.778 0.4277 A 370–920 300 250 −1.74±0.87 6158.929 0.5799 A 370–920 600 500 −6.24±0.755776.794 0.4280 A 370–920 300 250 −1.61±0.82 6159.642 0.5951 A 370–920 600 500 −6.93±0.705776.809 0.4283 A 370–920 300 250 −1.57±0.70 6159.697 0.5963 A 370–920 600 500 −6.88±0.655776.825 0.4287 A 370–920 300 250 −1.50±0.75 6159.722 0.5968 A 370–920 600 500 −6.83±0.635776.840 0.4290 A 370–920 300 250 −1.48±0.78 6159.747 0.5973 A 370–920 600 500 −6.97±0.745776.855 0.4293 A 370–920 300 250 −1.56±0.81 6159.772 0.5979 A 370–920 600 500 −6.97±0.705776.870 0.4296 A 370–920 300 250 −1.64±0.90 6159.797 0.5984 A 370–920 600 500 −6.79±0.695776.885 0.4300 A 370–920 300 250 −1.23±0.73 6159.822 0.5989 A 370–920 600 500 −6.73±0.635776.900 0.4303 A 370–920 300 250 −1.44±0.77 6159.847 0.5995 A 370–920 600 500 −6.98±0.785776.914 0.4306 A 370–920 300 250 −1.43±0.65 6159.872 0.6000 A 370–920 600 500 −6.76±0.705776.930 0.4309 A 370–920 300 250 −1.37±0.79 6159.888 0.6003 A 370–920 600 500 −6.97±0.725776.945 0.4312 A 370–920 300 250 −1.50±0.75 6159.903 0.6007 A 370–920 600 500 −6.89±0.665776.960 0.4316 A 370–920 300 250 −1.52±0.82 6159.919 0.6010 A 370–920 600 500 −6.94±0.655777.718 0.4477 A 370–920 600 500 −1.86±0.78 6159.935 0.6013 A 370–920 600 500 −7.06±0.735777.744 0.4483 A 370–920 600 500 −1.86±0.76 7173.910 0.2319 C 536–782 1800 100 −2.32±1.905777.770 0.4488 A 370–920 600 500 −1.67±0.73 7200.847 0.8065 D 483–685 900 90 −17.83±1.175777.794 0.4494 A 370–920 600 500 −1.94±0.76 7200.860 0.8068 D 483–685 900 90 −17.28±1.255777.819 0.4499 A 370–920 600 500 −1.97±0.87 7201.900 0.8290 D 483–685 900 90 −19.95±1.415777.845 0.4504 A 370–920 600 500 −1.95±0.83 7201.911 0.8292 D 483–685 900 90 −19.89±1.285777.870 0.4510 A 370–920 600 500 −1.88±0.78 7204.904 0.8931 D 399–568 1800 90 −20.53±0.865779.722 0.4905 A 370–920 600 500 −3.18±0.92 7205.859 0.9134 D 399–568 1800 90 −21.29±0.835779.747 0.4910 A 370–920 600 500 −3.20±0.78 7584.874 0.9987 C 477–632 1200 300 −14.74±1.145779.771 0.4915 A 370–920 600 500 −2.95±0.71 7585.824 0.0190 C 477–632 1200 300 −17.14±1.325779.785 0.4918 A 370–920 600 500 −3.08±0.76 7585.883 0.0203 C 477–632 1200 300 −14.47±1.325779.812 0.4924 A 370–920 600 500 −2.98±0.81 7586.824 0.0403 C 477–632 1200 300 −15.34±1.475779.840 0.4930 A 370–920 600 500 −3.18±0.79 7586.864 0.0412 C 477–632 1200 300 −10.65±1.555779.865 0.4935 A 370–920 600 500 −3.08±0.79 7587.818 0.0615 C 477–632 1200 300 −16.46±1.345779.895 0.4942 A 370–920 600 500 −3.18±0.84 7587.858 0.0624 C 477–632 1200 300 −13.22±1.485779.914 0.4946 A 370–920 600 500 −3.26±0.86 7588.796 0.0824 C 477–632 1200 300 −20.08±1.515779.946 0.4952 A 370–920 600 500 −3.36±0.93 7588.839 0.0833 C 477–632 1200 300 −11.33±1.575790.590 0.7223 B 418–682 1200 130 −10.00±1.08 7652.744 0.4466 D 503–701 3600 90 −1.47±0.655790.662 0.7239 B 418–682 1200 130 −13.33±1.66 7652.880 0.4495 D 503–701 3600 90 −0.83±0.655793.661 0.7878 B 418–682 1200 130 −14.47±1.41 7653.690 0.4668 D 503–701 3600 90 −2.23±0.986157.728 0.5543 A 370–920 600 500 −5.56±0.65 7653.850 0.4702 D 503–701 3600 90 −2.08±1.206157.753 0.5548 A 370–920 600 500 −5.91±0.77 7655.708 0.5098 D 416–547 3600 100 −3.30±0.986157.778 0.5553 A 370–920 600 500 −5.79±0.75 7655.841 0.5126 D 416–547 3600 100 −4.69±0.906157.815 0.5561 A 370–920 600 500 −5.86±0.76 7656.654 0.5300 D 416–547 3600 100 −5.14±0.876157.840 0.5567 A 370–920 600 500 −5.80±0.67 7656.812 0.5334 D 416–547 3600 100 −4.75±1.066157.865 0.5572 A 370–920 600 500 −5.74±0.68 7658.742 0.5745 D 436–581 3600 100 −5.73±0.996157.896 0.5579 A 370–920 600 500 −5.81±0.66 7658.873 0.5773 D 436–581 3600 100 −4.79±1.266157.911 0.5582 A 370–920 600 500 −5.77±0.72
4
Publications of the Astronomical Society of the Pacific, 130:054203 (11pp), 2018 May Janík et al.

Figure 2. Averaged profiles of the spectral lines (red) Ti II 4443.801 Å(upper left), Mg II 4481.327 Å(upper right), Sr II 4215.519 Å(bottom left), and Ba II4934.076 Å(bottom right) from night HJD6159, and their TVS spectra (black) with no signatures of variability.
(A color version of this figure is available in the online journal.)
5
Publications of the Astronomical Society of the Pacific, 130:054203 (11pp), 2018 May Janík et al.

component, from each individual spectrum. Despite our bestspectra were integrated to reach S/N=500 no traces of spectrallines of the secondary component have been found. Therefore, thesecondary must be either a low-luminosity star of a cool main-sequence one, or a white/brown dwarf. To specify the possiblemain-sequence companion closely, we estimated its upper limit ofthe luminosity and mass. As an example, we consider the firstspectrum introduced in Table 2. Provided that a signal safelyidentified in a noisy continuum amounts at least 3σ, the centraldepth of the weakest line visible in the spectrum is Dprim=0.006in the scale of the continuum. The spectrum of a cool main-sequence star is covered by plenty of metallic lines, the centraldepth of which reaches to Dsec=0.9. Then the ratio of the lightsLprim/Lsec=0.006/0.9=0.0067, that results in the magnitudedifference between the A2V primary and the secondaryΔM=5.44mag. Considering that primary star has absolutemagnitude Mp(V )=1.3mag, secondary component should thenhaveMs(V )=6.8 mag, that corresponds to a K3V main-sequencestar (Drilling & Landolt 1999). The upper mass limit of itis ≈0.7Me, and with the mass ratio of an A2V to K3V-staris 2.6/0.7=3.7 and the radial velocity of the secondary inthe orbital phase of the observed spectrum considered is
≈−38 km s−1. We do not identify lines of the secondary shiftedwith this value.
3.4. Chemical Composition
The chemical composition was derived using a χ2
minimization of the synthetic spectra for each of the FEROSorders separately (see Figure 4). Synthetic spectra werecomputed using the SYNSPEC code (Hubeny & Lanz 2011),ATLAS12 model atmospheres (Bischof 2005; Castelli 2005;Kurucz 2005), and atomic data from the VALD database(Piskunov et al. 1995; Kupka et al. 1999) and also from Lanz &Hubeny (2007). The observed spectra for abundance analysiswere averaged over all observations. We used a simplexmethod with abundances of individual chemical elements asfree parameters, and we fixed stellar parameters to those givenin Table 3. The final abundances of σScl are given in Table 5(see also Figure 5). The abundances of individual elementswere typically derived from numerous absorption lines present
Figure 3. Radial velocity variations of σSclshow that the star is a primary component of the single-lined spectroscopic binary with the orbital period P=46 877(8).The size of circles corresponds to the weights of individual RV measurements.(A color version of this figure is available in the online journal.)
Table 4Binary Parameters of the σScl System
Orbital period P=46 877(8)JD time of periastron passage T0=2456225.5(7)Numerical eccentricity e=0.195(25)γ velocity γ=−9.2(2) km s−1
K1 semiamplitude K1=−10.3(3) km s−1
Argument of the periastron ω=45(5)°
Table 3Stellar Parameters of σScl
Effective temperature Teff 8 700±125 KSurface gravity log g (cgs) 4.11±0.05
6
Publications of the Astronomical Society of the Pacific, 130:054203 (11pp), 2018 May Janík et al.
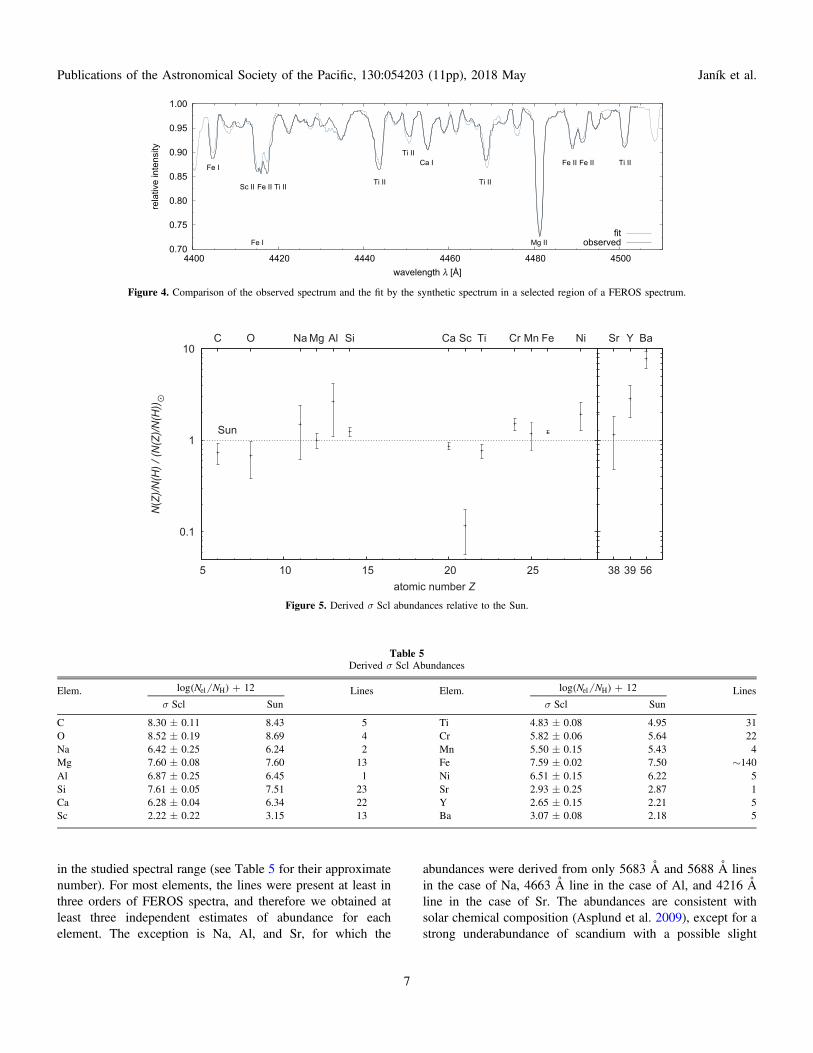
in the studied spectral range (see Table 5 for their approximatenumber). For most elements, the lines were present at least inthree orders of FEROS spectra, and therefore we obtained atleast three independent estimates of abundance for eachelement. The exception is Na, Al, and Sr, for which the
abundances were derived from only 5683Å and 5688Å linesin the case of Na, 4663Å line in the case of Al, and 4216Åline in the case of Sr. The abundances are consistent withsolar chemical composition (Asplund et al. 2009), except for astrong underabundance of scandium with a possible slight
Figure 4. Comparison of the observed spectrum and the fit by the synthetic spectrum in a selected region of a FEROS spectrum.
Table 5Derived σScl Abundances
Elem. +( )N Nlog 12el H Lines Elem. +( )N Nlog 12el H LinesσScl Sun σScl Sun
C 8.30±0.11 8.43 5 Ti 4.83±0.08 4.95 31O 8.52±0.19 8.69 4 Cr 5.82±0.06 5.64 22Na 6.42±0.25 6.24 2 Mn 5.50±0.15 5.43 4Mg 7.60±0.08 7.60 13 Fe 7.59±0.02 7.50 ∼140Al 6.87±0.25 6.45 1 Ni 6.51±0.15 6.22 5Si 7.61±0.05 7.51 23 Sr 2.93±0.25 2.87 1Ca 6.28±0.04 6.34 22 Y 2.65±0.15 2.21 5Sc 2.22±0.22 3.15 13 Ba 3.07±0.08 2.18 5
Figure 5. Derived σ Scl abundances relative to the Sun.
7
Publications of the Astronomical Society of the Pacific, 130:054203 (11pp), 2018 May Janík et al.

overabundance of chromium, iron, and nickel and a strongoverabundance of yttrium and barium.
This may indicate that σScl is a marginal Am (CP1) star.This group of chemically peculiar stars does not have asignificant global magnetic field, and is preferably found inclose binary systems (Adelman 1999; Hui-Bon-Hoa 2000).Almost all CP1 stars seem to be rather evolved with ages above400Myr (Künzli & North 1998). The derived age of σScl(about 500Myr) is consistent with this conclusion.
The observed abundance pattern of CP1 stars is explained bythe diffusion of elements together with the disappearance of theouter convection zone associated with the helium ionizationbecause of gravitational settling of helium (Michaudet al. 1983). They predict a cut-off rotational velocity for suchobjects (≈90 km s−1), above which meridional circulationleads to a mixing in the stellar atmosphere. σScl is very closeto this value, which makes it very interesting for testing themodels where the transit to marginal CP1 stars takes place.
3.5. Analysis of the Spectral Energy Distribution
To put further constraints on the characteristics of thesecondary component, we have investigated the spectral energydistribution (SED) of σScl.
For this, the VO Sed Analyzer (VOSA v5.1, Bayo et al. 2008)tool was used. All of the available photometric data were includedinto the fitting process. We used the synthetic flux from a standard
Kurucz model (Castelli & Kurucz 2004) with Teff=8 750K,log g=4.0, and solar metallicity.Figure 6 shows the observed and synthetic fluxes. We face
two different phenomena. First, there is a flux excess visiblethat emerges with a continuous increase from 1.5 μm. There-fore, we have calculated the difference of the fluxes and fitted asimple black body radiation curve. A temperature between1500 and 2000 K reproduces the flux distribution well. Theorigin of this excess is unclear. It cannot be associated withstellar winds from the companion, because it has to be a giantwith a high luminosity that is not observed.The second, much stronger infrared excess, is visible beyond
20μm, which can be attributed to circumstellar material within thissystem. It is well known that a significant number of stars in thesolar neighbourhood exhibit infrared excess due to circumstellarmaterial (Cotten & Song 2016). Most of these stars are not on thezero-age-main-sequence, but have already evolved on the mainsequence. The origin of this circumstellar material is still unknown.Herdin et al. (2016) and Chen et al. (2017) investigated the
group of CP stars in the infrared region using 2MASS, IRAS,and WISE data. The latter summarized their result as follows.In the 3.4–4.6 μm region, over half of the sample have clearinfrared excesses, which are possibly due to the binarity, themultiplicity, and/or the debris disk, but in the 4.6–12 μmregion they have no or little infrared excess. In addition, in the12–22 μm region, some of the targets show the infraredexcesses and infrared radiation probably due to free-freeemissions. In general, there is no clear picture about the nature
Figure 6. SED of σScl fitted to all available photometry and the synthetic flux from an appropriate stellar atmosphere (Castelli & Kurucz 2004). A flux excess fromabout 1.5 μm is evident. The infrared excess beyond 20 μm is probable due to circumstellar material.
8
Publications of the Astronomical Society of the Pacific, 130:054203 (11pp), 2018 May Janík et al.

of the detected infrared excesses. Here, much theoretical workis still needed to understand the possible sources.
σSclprovides an excellent opportunity to investigate its originand characteristics within a binary system of a very low-mass ratio.
4. NaCo and Data Reduction
Direct imaging of brown dwarfs and other cool-type stars ascompanions to B-type (Hubrig et al. 2001) and solar-type objects(Jenkins et al. 2010) has provided a wealth of well-constraineddata. These observations have been performed using mainlyadaptive optics imaging programs as part of surveys to establish thebinary frequency among various star groups. We have thereforesearched various data archives if such data exist for our target.
For σ Scl, high-angular resolution observations are available,taken with the Adaptive Optics camera NACO (for NasmythAdaptive optics system with the COude near-infrared imager andspectrograph, Rousset et al. 2003; Lenzen et al. 2003) installed atthe Nasmyth B focus of the VLT/UT4 from 2001–2013.
The data set of σ Scl consists of one epoch, imaged in November20046 with the IB_2.18 filter band (λ=2.18±0.06μm) and
employing the NACO S27 optics. The total integration timeis 7.5min.For the data reduction of the NACO images, we use
appropriate calibration data from the ESO data archive, i.e.,darks with the same exposure time, and flats taken in the samefilter and in the same night (20.11.2004 UT 3:30–3:40, HJD53 329.647–53 329.654, orbital phase 0.22) as the sciencedata. To reduce the imaging data, we use ESO ECLIPSE/jitter.7 For each science frame, a master-dark subtractionand flat-field correction is applied, and all images are averagedusing the provided shift+add procedure including measure-ment and subtraction of the bright background of the sky in thenear-infrared.
5. Detection Limits
From the reduced the NACO IB_2.18 image of σ Scl, wemeasure the achieved (S/N=3) detection limit versus angularand projected separation. To measure the dynamic range as afunction of the angular separation, a 1D sensitivity curve wascreated using the following procedure. First, for each pixel onthe detector, the distance to the previously determined position
Figure 7. Dynamic range plot for σ Scl observed with NACO in 2004 November. We plot the achieved apparent magnitude (left y-axis) in the IB_2.18 filter band asfunction of angular (bottom x-axis) and projected separation (top x-axis), in au assuming a distance of 71.2±1.6 pc (McDonald et al. 2017) could be added andadopting a K band magnitude of Ks=5.224±0.017 mag (Cutri et al. 2003). The position of the primary (A) is marked with an asterisk. The measured 3σ sensitivitycurve is shown as a full (red) line; objects below this line cannot be detected. The measured sensitivity curve from the PSF-subtracted image is also shown as dashedblack line. The detectable mass ratios q (right y-axis) obtained from evolutionary models by Bressan et al. (2012) and the diffraction limit (vertical dash-dotted line) ofthe telescope are indicated as well. The background level remains constant at about 14 mag for separations outside of 1.5″ (∼0.09 M☉ at 500 Myr). No visualcompanion was detected within these limits.(A color version of this figure is available in the online journal.)
6 Public data from the ESO data archive, taken in ESO program 074.D-0180(A). 7 ESO C Library for an Image Processing Software Environment.
9
Publications of the Astronomical Society of the Pacific, 130:054203 (11pp), 2018 May Janík et al.

of the central star was calculated, and the correspondingmeasured flux F stored. Then, n annuli of equal width wereselected within which the flux values were sorted, the upperand lower 10% excluded and those values rejected that deviateby more than 3σ from the median to remove the contribution ofthe stars contained in the annulus from the calculation. Thestandard deviation of the remaining values was than used asestimate of the background noise. The resulting 3σ contrastlevel as a function of the angular separation is finally evaluatedby comparison of the estimated background noise with the peakflux of the central star. The procedure described above was alsoapplied to the PSF-subtracted image. However, the differencesbetween the two resulting curves is only marginal. The mainreason for this is that the main source of the noise is the photonnoise, which is superimposed with the measured signal. Theremoval of the signal by subtraction of the PSF does notsignificantly change the measured residual noise, thus thecomputed sensitivity remains almost equal. The result isillustrated in Figure 7.
No additional source could be detected within the fullycovered field of view, i.e., at angular separations smaller thanabout 12 arcsec (∼855 au of projected separation) aroundthe central star σ Scl. In the background-noise-limited region, a(S/N=3) detection limit of about 14 mag is reached atangular separations from σ Scl A beyond about 1.5 arcsec. Atthe derived age of σ Scl of about 500Myr, this allows thedetection of low-mass stellar companions with masses down to0.09 solar masses and projected separations from σ Scl A ofmore than about 107 au.
6. Summary
We reanalyzed sets of photometric data available in theliterature for suspected Ap star σScl to check them forperiodicity. We do not confirm the periods indicated in theliterature. We have not detected any significant light and lineprofile variations. The absence of line profile variations andmostly solar chemical composition support the classification ofσScl as non-variable marginal Am main-sequence star. However,a detailed analysis of radial velocity variations revealed that σSclis a spectroscopic binary (SB1) with the period of 46.877(8) d.We did not find traces of the secondary component in thespectrum, but we did find a flux excess from 1.5 μm in spectralenergy distribution. Yet larger flux excess is visible beyond20 μm, and is caused probably due to circumstellar material.
This work was supported by the grants GAČR 16-01116S,as well as MŠMT 7AMB14AT015 and 7AMB17AT030.Olga Pintado is a Visiting Astronomer, Complejo AstronómicoEl Leoncito, operated under agreement between the ConsejoNacional de Investigaciones Científicas y Técnicas de la
República Argentina and the National Universities of La Plata,Córdoba and San Juan.The research is based on observations obtained at the European
Southern Observatory (ESO programs 087.D-0099 and 089.D-0153), at the South African Astronomical Observatory (SAAO)and at the El Leoncito Astronomical Complex (CASLEO).
ORCID iDs
Jan Janík https://orcid.org/0000-0002-6384-0184Ernst Paunzen https://orcid.org/0000-0002-3304-5200Miloslav Zejda https://orcid.org/0000-0001-6231-3350
References
Abt, H. A., & Morrell, N. I. 1995, ApJS, 99, 135Adelman, S. J. 1999, MNRAS, 310, 146Asplund, M., Grevesse, N., Sauval, A. J., & Scott, P. 2009, ARA&A, 47, 481Babcock, H. W. 1947, ApJ, 105, 105Babcock, H. W. 1958, ApJS, 3, 141Bayo, A., Rodrigo, C., Barrado Y Navascués, D., et al. 2008, A&A, 492, 277Bischof, K. M. 2005, MSAIS, 8, 64Bond, H. E., Perry, C. L., & Bidelman, W. P. 1971, PASP, 83, 643Bressan, A., Marigo, P., Girardi, L., et al. 2012, MNRAS, 427, 127Castelli, F. 2005, MSAIS, 8, 25Castelli, F., & Kurucz, R. L. 2004, arXiv:astro-ph/0405087Chen, P. S., Liu, J. Y., & Shan, H. G. 2017, AJ, 153, 218Cotten, T. H., & Song, I. 2016, ApJS, 225, 15Crawford, D. L., & Mander, J. 1966, AJ, 71, 114Cutri, R. M., Skrutskie, M. F., van Dyk, S., et al. 2003, VizieR Online Data
Catalog, 2246De Rosa, R. J., Patience, J., Wilson, P. A., et al. 2014, MNRAS, 437, 1216Díaz, C. G., González, J. F., Levato, H., & Grosso, M. 2011, A&A, 531, A143Drilling, J. S., & Landolt, A. U. 2002, in Allen’s Astrophysical Quantities, ed.
A. N. Cox (4th ed.; New York: Springer), 381ESA 1998, The Hipparcos and Tycho Catalogs, Celestia, 2000 SP–1220Fullerton, A. W., Gies, D. R., & Bolton, C. T. 1996, ApJ, 103, 475Gontcharov, G. A. 2006, AstL, 32, 759Hauck, B., & Mermilliod, M. 1998, A&AS, 129, 431Herdin, A., Paunzen, E., & Netopil, M. 2016, A&A , 585, A67Høg, E., Fabricius, C., Makarov, V. V., et al. 2000, A&A, 355, 27Hubeny, I., & Lanz, T. 2011, Synspec: General Spectrum Synthesis Program,
Astrophysics Source Code Library, record ascl:1109.022Hubrig, S., Le Mignant, D., North, P., & Krautter, J. 2001, A&A, 372, 152Hui-Bon-Hoa, A. 2000, A&AS, 144, 203Hümmerich, S., Paunzen, E., & Bernhard, K. 2016, AJ, 152, 104Krtička, J., Mikulášek, Z., Zverko, J., & Zižňovský, J. 2007, A&A, 470, 1089Krtička, J., Mikulášek, Z., Henry, G. W., et al. 2009, A&A, 499, 567Krtička, J., Janík, J., Marková, H., et al. 2013, A&A, 556, A18Künzli, M., & North, P. 1998, A&A, 330, 651Kupka, F., Piskunov, N., Ryabchikova, T. A., Stempels, H. C., & Weiss, W. W.
1999, A&AS, 138, 119Kurucz, R. L. 2005, MSAIS, 8, 14Lanz, T., & Hubeny, I. 2007, ApJS, 169, 83Lenzen, R., Hartung, M., Brandner, W., et al. 2003, Proc. SPIE, 4841, 944Manfroid, J., Sterken, C., Bruch, A., et al. 1991a, A&AS, 87, 481Manfroid, J., Sterken, C., Bruch, A., et al. 1991b, ESOSR, 8, 1Manfroid, J., & Renson, P. 1994, A&A, 281, 73Maury, A. 1897, AnHar, 28, 1McDonald, I., Zijlstra, A. A., & Watson, R. A. 2017, MNRAS, 471, 770Michaud, G. 1970, ApJ, 160, 640Michaud, G., Tarasick, D., Charland, Y., & Pelletier, C. 1983, ApJ, 269,
239Mikulášek, Z., Paunzen, E., Netopil, M., & Zejda, M. 2015, ASPC, 494, 320
10
Publications of the Astronomical Society of the Pacific, 130:054203 (11pp), 2018 May Janík et al.

Mikulášek, Z., Žižňovský, J., Zverko, J., & Polosukhina, N. S. 2003,Contributions of the Astronomical Observatory Skalnate Pleso, 33, 29
Moon, T., & Dworetsky, M. M. 1985, MNRAS, 217, 782Neubauer, F. J. 1930, Lick Observatory Bulletin, 15, 46Paunzen, E., Mikulášek, Z., Poleski, R., et al. 2013, A&A, 556, A12Jenkins, J. S., Jones, H. R. A., Biller, B., et al. 2010, A&AS, 515,
A17Piskunov, N. E., Kupka, F., Ryabchikova, T. A., Weiss, W. W., &
Jeffery, C. S. 1995, A&AS, 112, 525Preston, G. W. 1974, ARA&A, 12, 257Rousset, G., Lacombe, F., Puget, P., et al. 2003, Proc. SPIE, 4839, 140Rufener, F., & Bartholdi, P. 1982, A&AS, 48, 503Rufener, F. 1988, Catalogue of Stars Measured in the Geneva Observatory
Photometric System (4th ed.; Sauverny: Geneva Observatory), 39
Rusomarov, N., Kochukhov, O., Ryabchikova, T., & Piskunov, N. 2015,A&A, 573, A123
Shulyak, D., Krtička, J., Mikulášek, Z., Kochukhov, O., & Lüftinger, T. 2010,A&A, 524, A66
Smalley, B., & Dworetsky, M. M. 1995, A&A, 293, 446Smalley, B., Antoci, V., Holdsworth, D. L., et al. 2017, MNRAS, 465, 2662Stibbs, D. W. N. 1950, MNRAS, 110, 395Sterken, C. 1983, Msngr, 33, 10Sterken, C. 1986, in The Study of Variable Stars Using Small Telescopes, ed.
J. R. Percy (Cambridge: Cambridge Univ. Press), 165Sterken, C., Manfroid, J., Anton, K., et al. 1993, A&AS, 102, 79Wilson, R. E. 1953, General Catalogue of Stellar Radial Velocities
(Washington, DC: Carnegie Institute Publication)Zverko, J., Žižňovský, J., Mikulášek, Z., & Iliev, I. K. 2007, CoSka, 37, 49
11
Publications of the Astronomical Society of the Pacific, 130:054203 (11pp), 2018 May Janík et al.