A ADB INSTITUTE WORKING PAPER 17 - Asian … · · 2015-03-31ADB INSTITUTE WORKING PAPER 17...
50
ADB INSTITUTE WORKING PAPER 17 Growth and Poverty Alleviation: Lessons from Development Experience T. N. Srinivasan April 2001 ADB INSTITUTE TOKYO ASIAN DEVELOPMENT BANK INSTITUTE ASIAN DEVELOPMENT BANK INSTITUTE Although only a few developing countries have succeeded in sustaining rapid growth for a long period and in reducing poverty significantly, the evidence does suggest an association between episodes of rapid growth and poverty reduction. There is no robust association between income inequality and aggregate growth. Some policies and factors do seem to promote growth and reduction in poverty: openness to international trade and capital, conditions conducive to the creation of a disciplined and adequately educated and healthy labor force, macroeconomic stability and an environment of 'low' transaction costs. But there have been relatively few comparative studies involving countries differing sufficiently widely in relevant dimensions. Recent analysts have tended to follow the strategy of cross-country regressions. This paper identifies some serious limitations with these regressions. Yet those results, particularly if they are consistent in direction and magnitude across regressions, should not be dismissed, but used as inputs for further theoretical and empirical analyses. Unfortunately, we are still no where near articulating a complete theory of the growth-poverty-inequality relationships.
Transcript of A ADB INSTITUTE WORKING PAPER 17 - Asian … · · 2015-03-31ADB INSTITUTE WORKING PAPER 17...

ADB INSTITUTE WORKING PAPER 17
Growth and Poverty�Alleviation: Lessons from�Development Experience
T. N. SrinivasanApril 2001
ADB INSTITUTETOKYO
ASIA
N D
EV
ELO
PM
EN
T BA
NK IN
ST
ITU
TE
ASIA
N D
EV
ELO
PM
EN
T BA
NK IN
ST
ITU
TE
Although only a few developing countries have succeeded in sustaining rapid growth for a long period and in reducing poverty significantly, the evidence does suggest an association between episodes of rapid growth and poverty reduction. There is no robust association between income inequality and aggregate growth. Some policies and factors do seem to promote growth and reduction in poverty: openness to international trade and capital, conditions conducive to the creation of a disciplined and adequately educated and healthy labor force, macroeconomic stability and anenvironment of 'low' transaction costs.
But there have been relatively few comparative studies involving countries differing sufficiently widely in relevant dimensions. Recent analysts have tended to follow the strategy of cross-country regressions. This paper identifies some serious limitations with these regressions. Yet those results, particularly if they are consistent in direction and magnitude across regressions, should not be dismissed, but used as inputs for further theoretical and empirical analyses. Unfortunately, we are still no where near articulating a complete theory of the growth-poverty-inequality relationships.

ADB Institute Working Paper Series
No. 17
April 2001
Growth and Poverty Alleviation:
Lessons from Development
Experience
T. N. Srinivasan
ADB INSTITUTE WORKING PAPER 17
Additional copies of the paper are available free from the Asian Development Bank Institute, 8th Floor, KasumigasekiBuilding, 3-2-5 Kasumigaseki, Chiyoda-ku, Tokyo 100-6008, Japan. Attention: Publications. Also online at www.adbi.orgCopyright ©2001 Asian Development Bank Institute & the author. All rights reserved. Produced by ADBI Publishing.
ABOUT THE AUTHOR
T. N. Srinivasan is the Samuel C. Park, Jr. Professor of Economics and Chairman of the Departmentof Economics at Yale University and last year was a Visiting Scholar at the ADB Institute. He was aProfessor, and later Research Professor, at the Indian Statistical Institute, Delhi (1964-1977). He hasalso taught at numerous universities, including the University of Minnesota, the MassachusettsInstitute of Technology, Johns Hopkins University and Stanford University. In addition, ProfessorSrinivasan has worked extensively with the ADB and the World Bank, serving for three years as aSpecial Adviser to the Development Research Center (1977-1980), as a member of the EditorialBoard of the World Bank Review (1986-1991), and returning for numerous short-term consultancieswith the World Development Report (1991) and the Economic Development Institute (1995). He haspublished extensively on International Trade, Development, Agricultural Economics andMicroeconomic Theory. Professor Srinivasan is a Fellow of the American Philosophical Society, theEconometric Society and the American Academy of Arts and Sciences, and a Foreign Associate of theNational Academy of Sciences. He holds a Ph.D. in Economics from Yale University.
The Working Paper Series primarily disseminates selected work in progress to facilitate an exchange of ideaswithin the Institute's constituencies and the wider academic and policy communities. An objective of theseries is to circulate primary findings promptly, regardless of the degree of finish. The findings,interpretations, and conclusions are the author's own and are not necessarily endorsed by the AsianDevelopment Bank Institute. They should not be attributed to the Asian Development Bank, its Boards, or anyof its member countries. They are published under the responsibility of the Dean of the ADB Institute. TheInstitute does not guarantee the accuracy or reasonableness of the contents herein and accepts noresponsibility whatsoever for any consequences of its use. The term "country", as used in the context of theADB, refers to a member of the ADB and does not imply any view on the part of the Institute as to sovereigntyor independent status. Names of countries or economies mentioned in this series are chosen by the authors, inthe exercise of their academic freedom, and the Institute is in no way responsible for such usage.
II

PREFACE
The ADB Institute aims to explore the most appropriate development paradigms for Asia composed of well-balanced combinations of the roles of markets, institutions, and governments in the post-crisis period. Under this broad research project on development paradigms, the ADB Institute Working Paper Series will contribute to disseminating works-in-progress as a building block of the project and will invite comments and questions. I trust that this series will provoke constructive discussions among policymakers as well as researchers about where Asian economies should go from the last crisis and current recovery. The conference version of this paper was presented on 8 December 2000 at the ADBI 3rd Anniversary High-Level Symposium on Alternative Development Paradigms and Poverty Reduction held at the Institute.
Masaru Yoshitomi Dean
ADB Institute
III

ABSTRACT
Poverty is a multifaceted phenomenon that goes beyond lack of adequate income. The
overarching objective of development in many countries has been and continues to be the eradication of all facets of poverty. Rapid as well as well equitable growth in income has always been viewed as an instrument for achieving this objective. Although only a few developing countries have succeeded in sustaining rapid growth for a long period and in reducing poverty significantly, the evidence does suggest an association between episodes of rapid growth and poverty reduction.
Policies and processes can be identified a priori, some of which would be expected to generate sustained growth and poverty reduction while others either would not lead to growth or to poverty reduction. The interesting and important analytical issue is why we see the former set of policies and processes only in a few countries. In analyzing this issue, it is clear that a comparative (across nations, sub-national units and time spans) framework is most appropriate.
There are broadly two strategies for an empirical analysis in a comparative mode. One strategy is primarily econometric, the most ubiquitous example being the use of cross-country regressions. The other strategy is to do a set of detailed country studies, based on a common framework, using a variety of analytical tools from theory, history and econometrics and firmly grounded on the relevant socio-political-economic institutions of the countries involved. In principle the two strategies complement each other: cross-country regressions could be used to identify average patterns in the data as well as the outliers from the average. The country studies could be useful in identifying the specific features of the country, period or sector or policy that led to a particular observation being an outlier. Just as results of regressions are more useful if the range of explanatory variables is wider, the results from comparative country studies would be more useful the greater the range of variations across countries studied in institutions, policies, performances and time periods. Whichever strategy is adopted, in designing policies or tendering advice on the design of policies, one has to allow for factors and variables not included in the regressions or in the country analyses, which nonetheless are relevant. This inevitably leads to the use of judgment and the associated possibility of differences even among policy makers and advisers who agree on the lessons from regressions and country studies.
In fact, there have been relatively few comparative country studies involving countries differing sufficiently widely in relevant dimensions. Recent analysts have tended to follow the strategy of cross-country regressions. This paper points out the serious limitations of these regressions. Yet results from such regressions, particularly if they are consistent in direction and magnitude across regressions, should not be dismissed, but used as inputs into further theoretical and empirical analysis. What can we conclude from the available empirical and theoretical analyses?
First, there is a robust association between reduction in absolute poverty and sustained and significant growth in aggregate income.
IV

Second, there is no similar robust association between income inequality and aggregate growth. Third, interpreting the association (or lack thereof) causally is hazardous without
undertaking an in-depth analysis of the operation of mechanisms, including government policies, and the evolution of exogenous factors (e.g. terms of trade, barriers abroad for exports of goods and services, technology) that link growth, poverty and inequality. For example, policy changes (e.g. removal of barriers to external trade and inflow of foreign capital and technology) that accelerate growth could increase income inequality, at least in the short run, when individuals and regions are initially better place to take advantage of the opportunities opened up by policy changes ahead of others. There is some suggestive evidence in support of this from the experience of the People’s Republic of China and India. But as long as other policies are in place or put in place that ensure that those left behind initially catch up over time, the increase in inequality will be temporary. Fourth, keeping in mind the caveats against causal interpretations of associations, some policies and factors, seem to promote growth and reduction in poverty. These are openness to international trade and capital, conditions that are conducive to the creation of a disciplined and adequately educated labor force (in particular adequate (public and private) investment in education and health), macroeconomic stability and, what might be called an environment of 'low' transaction costs. Very broadly defined, these include: (i) costs of transactions between individuals and businesses on the one side and governments at various levels on the other; (ii) avoidable additional costs of poorly functioning economic infrastructure (power, transport, communications, roads, ports, etc.); (iii) costs of mitigating moral hazard, adverse selection and opportunism, including costs of poorly functioning legal system, for defining and enforcing property rights.
Fifth, and finally, it is facile to conclude that lessons from East Asia or India or PRC are necessarily applicable to others. The problem was well posed by Nobel laureate Robert Lucas Jr. "But simply advising a society to follow the Korean model" is a little like advising an aspiring basketball player to "follow the Michael Jordan model." To make use of someone else's successful performance at any task, one needs to be able to break this performance down into its component parts so that one can see what each part contributes to the whole, which aspects of this performance are imitable and, of these, which are worth imitating. One needs, in short a theory. We are no where near articulating such a complete theory of the growth-poverty-inequality relationships. The challenge, in the absence of a complete theory, is to go beyond the general findings and explore why ostensibly similar policies and processes generate growth as well as poverty reduction in some contexts and not others.
V

TABLE OF CONTENTS
Preface III Abstract IV Table of Contents VI
1. Introduction 1 2. Interrelationships Among Growth, Poverty and Inequality 4
2.1. Are There Interrelationships in Theory and Can They Be Found Empirically? 4 2.2. Sources of Growth 5 2.3. Sources of Inequality and Poverty and Factors Influencing Them 6 2.4. Effect of Market Imperfections, Inflexibilities, and Distortions on the Poor 8 2.5. Interrelationships: Influence of Policies and Other Factors in the Short and
Long Run 9 3. Time Series and Cross-sectional Data on Growth, Poverty and Inequality 11
3.1. Data on National Income, Consumption and Growth 11 3.2. International Comparisons of National Income and Growth 12 3.3. Data on Income Distribution and Inequality 13 3.4. Data on Poverty 15 3.5. Comparison of Household Survey and National Income Data 16
4. Did More Rapid Growth Reduce Poverty in India? 17
5. Growth, Inequality and Poverty: International Evidence 20
6. Conclusions 24
VI

Tables and Figures 27
Table 1. Development Outcomes in the 1980s and 1990s, by Growth Class 27 Table 2. Poverty Decline and Growth, Selected Asian Countries 28 Table 3. Inflation and Income Inequality in OECD Countries 29 Table 4. Poverty in India 1951-1997 (with correction for CPIAL) 30 Table 5. Growth Rate (annual average, percentage) 32 Table 6. Estimated Percentages of the Poor in India 33
Figure 1. Ratio of NSS to NAS per capita Consumption 34 Figure 2. Poverty Stagnated, or Did It? 34 Figure 3. Poverty in India, 1973/74-1997: National, Rural and Urban 35 Figure 4. Head Count Rates (Rural India) 36 Bibliography 37
VII

Growth and Poverty Alleviation: Lessons from Development Experience
T. N. Srinivasan1
1. Introduction Eradication of mass poverty was the overarching objective of economic development of policy makers in most developing countries when they achieved political independence in the two decades after the end of World War II. Indeed, colonial rule was seen by most of them as ignoring the poverty of the ruled and serving instead the economic and political interests of the rulers. They were determined to correct the perceived failures of colonial rule by embarking on a structural transformation of their economies and societies. It is no accident, given the abject poverty of their populations, the prevailing high rates of mortality (particularly infant mortality), illiteracy, extensive undernourishment, inadequate health and educational services, that they saw poverty as a multifaceted phenomenon, and not just inadequacy of incomes. Not having had the opportunity (during the colonial period) to participate in making the decisions that affected their lives, some of them viewed the absence of participatory democracy as yet another aspect of poverty. While they were clear about poverty eradication being the overarching objective, they were also emphatic about the instrumental role of rapid growth in income and its better distribution for achieving the objective. Policy makers in developing countries linked the promotion of economic growth to the overarching objective of poverty alleviation, asserting that growth had intrinsic merit as an objective of development in and of itself. Let me begin by illustrating this with a brief reference to Indian development history.
The classic early study of poverty in India was by Dadabhai Naoroji (1901), an Indian who was elected to the British House of Commons. During the colonial era there were a number of socio-economic studies of villages and the extreme poverty of villagers was their major theme (Mann 1916, 1948, Slater 1918). Mann, drawing on the pioneering study of Rowntree of England, estimated the proportion of the poor in the village he studied was 40 percent.2
Naoroji did not offer a blueprint for development. Several other individuals and groups across the political spectrum did, starting from Sir M. Visveswaraya (1934), the National Planning Committee (NPC) of Mahatma Gandhi’s Indian National Congress (Nehru 1946), the Indian Federation of Labour (Banerjee et al. 1944), and a group of businessmen from Bombay (Thakurdas et al. 1944). The followers of Mahatma had their own Gandhian 1 Samuel C. Park Jr. Professor of Economics, Yale University. This paper was presented at the High Level Symposium on Alternative Development Paradigms and Poverty Reduction, Asian Development Bank Institute, Tokyo, December 8, 2000. In writing this paper, I have drawn extensively from my unpublished paper ‘Growth, Poverty Reduction and Inequality’ presented at the World Bank’s Annual Conference on Development Economics (Europe), Paris, June 26-28, 2000. I presented earlier versions of this paper at seminars at the World Bank, and Universities of Heidelberg and Groningen. I thank discussants and participants at these seminars, and in particular Jean Baneth, Takatoshi Ito, M.G. Quibria and Suresh Tendulkar, for their comments. 2 I thank Michael Lipton for drawing my attention to these studies.
1

Plan for Development (Agarwal 1960). Although the groups differed on the details of a development strategy, all agreed that the overarching objective of India’s development was the eradication of poverty and that poverty is not just lack of income. The NPC, which completed its work in 1940, is quite typical of the groups. Its objective
“was to insure an adequate standard of living for the masses; in other words, to get rid of the appalling poverty of the people...the irreducible, in terms of money, had been estimated by economists at figures varying from Rs. 15 to Rs. 25 per capita per month (at prewar prices)...[To] insure an irreducible minimum standard for everybody, the national income had to be greatly increased, and in addition to this increased production there had to be a more equitable distribution of wealth. We calculated that a really progressive standard of living would necessitate the increase of the national wealth by 500 or 600 per cent. That was, however, too big a jump for us, and we aimed at a 200 to 300 per cent increase within ten years.” (Nehru 1946, pp. 402-3, emphasis added).”
Its “objective tests” for progress in poverty eradication included: the attainment of a balanced diet having a caloric value of 2400-2800 kilo calories per adult worker, improvement in clothing from the then consumption of 15 yards to at least 30 yards per capita per annum, housing standards to reach at least 10 square feet per capita, liquidation of illiteracy, increase in expectation of life and access to adequate medical facilities.
All groups (with the possible exception of the Gandhians) set great store on rapid growth of income and, in particular, industrialization as a means for eradicating poverty. In the post independence era, except for the modest first five year plan (1951-56), all the subsequent five year plans set growth targets exceeding five per cent per year. Indian policy makers were by no means unique in seeing rapid income growth as the major instrument for poverty reduction–statements similar to those of the Indians could be found in development plans of many other countries.
India embarked on planning for national development in 1950. As early as in 1960, at the end of the Second Five Year Plan, the question of whether growth was improving the lives of the poor was raised by a socialist member in the Parliament. Prime Minister Nehru responded to this question in introducing the Third Five Year Plan in Parliament and said
“Again it is said that the national incomes over the First and Second Plans have gone up by 42 percent and per capita income by 20 percent. Now a legitimate query is made – where has this gone? To some extent, of course, you can see where it has gone. I sometimes do address a large gathering in the villages, and I can see that they are better fed and better clothed, they build brick houses and they are generally better off. Nevertheless, that does not apply to everybody in India” (Government of India, 1964, p.1).”
The fear that the fruits of growth might not be reaching all the poor led Nehru to appoint a committee to enquire into the trends in income distribution and living levels, from whose report the above quote is taken.
Unfortunately, most developing countries did not achieve rapid growth. Indeed, in contrast to the optimistic expectations of early development policy makers, the actual development experience in the five decades since the end of WWII is decidedly mixed. A few
2

countries of East Asia have achieved sustained and rapid growth for more than three decades. In some countries of South East Asia and China, there has been rapid growth of GDP at rates close to 10 percent per year in the two decades since the eighties. In India there has been less spectacular, but more rapid growth since the eighties relative to the prior three decades. China and India are the world’s two most populous countries. The number of poor at the start of their relatively rapid growth phase was very large. As such, the proportion of the population of the developing world whose lives were improved because of the reduction of poverty in these two countries is substantial.
Data on income, its growth and on trends in income poverty in developing countries are seriously deficient—more on data issues below. The World Bank (1999a) estimates that, based on data from countries for which at least one household survey was available during 1985-98, the proportion of people living on less than $1 a day (in 1985 purchasing power parity terms) in developing countries was about 24 percent in 1998 as compared to 28 percent in 1987. However, there was substantial variation in performance. In East Asia, China, South East Asia (until the recent financial crisis) and India, growth was accompanied by large reductions in some, and more modest reductions in others, in poverty levels. In contrast, “African economic performance has been markedly worse than that of other regions. During the 1980s, per capita GDP declined by 1.3 percent p.a., a full 5 percentage points below the average for all low-income developing countries. During 1990-94 the decline accelerated to 1.8 percent p.a. and the gap widened to 6.2 percentage points.” (Collier and Gunning 1999, p. 64). Of course, decline in per capita GDP need not necessarily be associated with a decline in non-income indicators of poverty. Indeed, until the recent AIDS crisis, indicators such as life expectancy and literacy rose even in countries in which real income fell. If incomes continued to fall, such rises in standards of living could not be sustained.
Tables 1 and 2 suggest a significant association between aggregate growth performance and improvements in human development indicators including the incidence of poverty. However, any association between aggregate growth and reduction in national poverty does not imply either a one-way causal relation between growth and poverty or even that the association would hold for all countries and for all time periods. One has to identify the possible mechanisms through which, on the one hand aggregate growth could affect, positively or negatively, poverty at national or sub-national levels and, on the other, how levels and trends in poverty could influence growth, again in either direction. Clearly, there is no reason to presume that all such mechanisms need operate everywhere and at all times and even if some do, that they operate with the same intensity. Further, there may be leads and lags involved in their operation—for example, it could take several years before an acceleration in growth results in poverty reduction and also, only sustained increases in growth, and not any temporary and reversible increases, could bring about a reduction in poverty. Moreover, growth, poverty and inequality are endogenous outcomes of economic, social and political processes within a nation as well as trends in world economic and political environment in so far as it affects domestic processes. These processes themselves could in part be endogenous and interact with each other. The speed, strengths and the nature of interaction could, and would vary over time and across countries. Such statements as “Aggregate growth is not enough” or “No poverty reduction is possible without aggregate growth”, could be true and false, in the sense of being seemingly valid for some countries or some periods and not valid for other countries or periods. In the rest of the paper, I first discuss in Section 2 the interrelationships between growth, poverty and inequality, and the mechanisms through which growth influences
3

poverty and inequality as well as the mechanisms through which poverty and inequality influence growth. Section 3 is devoted to serious deficiencies in the data on national income and indicators of poverty and of growth. In Section 4, I will discuss the experience of India on the impact of acceleration of growth on poverty, before and after the economic reform and liberalization of 1991. The discussion will also serve to highlight the seriousness of the data problems. In Section 5, I will turn to international experience. Section 6 concludes. 2. Interrelationships Among Growth, Poverty and Inequality
2.1. Are There Interrelationships in Theory and Can They Be Found Empirically? Adam Smith was emphatic about the importance of growth for poverty reduction: “it is in the progressive state, while the society is advancing to the further acquisition,
rather than when it has acquired its full complement of riches, that the condition of the labouring poor, of the great body of the people, seems to be the happiest and the most comfortable. It is hard in the stationary, and miserable in the declining state.” (Smith (1937), p. 81)
In more recent times, Arthur Lewis (1955), in his magisterial survey of growth, comprehensively discussed several aspects of growth including its relation to poverty. His Appendix entitled “Is growth desirable?” anticipates everything contemporary critics of growth have said and more! But, of course, Smith and Lewis wrote long before the recent revival of cross-country regressions and before President James Wolfensohn of the World Bank, and his then chief economist, Joseph Stiglitz, were perceived as supporting those who raised doubts about the existence, direction and strength of the relationship (Wolfensohn and Stiglitz (1999))! Is Lewis’s balanced judgment in favour of growth still unassailable?
I strongly believe it is, but establishing it is so convincingly, based on the development experience of the second half of the twentieth century, is not easy, for theoretical as well as empirical reasons. As I argued in the Introduction, growth, poverty and inequality are endogenous outcomes of proximate, and ultimately socio-economic-political processes, some of which could themselves be endogenous. It is easy to postulate exogenous factors and policy choices that affect all three in the same direction; some in one direction and others in the opposite direction; also in one direction in the short run and the opposite direction in the long run. I will suggest some examples to illustrate these below.
It is sufficient to say that there are in theory no ‘deep’ (in the Lucas sense) parameters to be found empirically in the data, inexorably linking growth with the other two. Elsewhere Jagdish Bhagwati and I (Srinivasan and Bhagwati) (2001) have argued, that cross-country and/or panel regressions, even those that attempt an econometric treatment of possible endogeneity of explanatory variables, are not the most appropriate tools for an empirical analysis of the relationships involved, even if one assumes away all the problems with data discussed in Section 3. On the other hand, nuanced studies narrowly focused on an individual nation (or an appropriate sub-national unit) and through their analysis of the trends in growth, poverty and inequality in depth, and their use of historical, institutional as
4

well as quantitative tools, are much more likely to help in understanding them. 3 Unfortunately, cross-country regressions are far more plentiful than nuanced studies. As such, in Section 5 I will report on results from some of the more careful regression studies even while emphasizing the problems of their interpretation. 2.2. Sources of Growth It is almost banal, but nonetheless true, that the sources of economic growth4 are essentially three: growth in inputs of production, improvements in the efficiency of allocation of inputs across economic activities, and innovation that creates new products, new uses for existing products, and brings about increases in the efficiency of use of inputs.
There are many factors that affect one or more of the three sources of growth: among these, three are particularly important.
Openness to foreign trade and investment: Being open to trade and investment contributes to each of the sources of growth. By enabling the economy to specialize in those activities in which it has comparative advantage, efficiency of the allocation of domestic resources is enhanced. By being open to capital, labour and other resource flows, an economy is able to augment relatively scarce domestic resources and use part of its abundant resources elsewhere where they earn a higher return. Clearly, efficiency of resource use in each nation and across the world is enhanced by greater competition faced by producers everywhere and by the freedom of movement of resources. Finally, the fruits of innovation anywhere in the world become available everywhere in such an open world.
Policies that influence intertemporal resource allocation and risk taking decisions of consumers and producers: Assume for a moment that policy changes are exogenous. Then an unanticipated permanent policy change, such as for example, in income or capital gains taxes, could influence the decisions to save and invest and thereby influence growth in the short run and possibly in the long run as well. To take another example, changes in public expenditures on education and health, if not offset by opposite changes in private expenditures, could influence household decisions regarding fertility and human capital accumulation. These decisions in turn affect growth by altering the time paths of physical and human capital formation as well as labour force participation rates. More generally, fiscal (tax and expenditure), monetary and exchange rate policies could in principle affect intertemporal resource allocation decisions and influence growth.
3 A legitimate and fair question is whether the data and econometric problems are any less serious in the context of country studies than they are in cross-country regression analysis. The answer is yes. First, such studies are less likely to depend solely or even largely on econometric analysis that is sensitive to data reliability. Second, it would be possible to draw on analyses that pertain to parts of the country or selected time periods for the whole country, an option that is unavailable in cross-country regression analyses. 4 I am using the phrase “economic growth” somewhat loosely. Among other things, one has to distinguish between short-term (or transitional) growth and long-term (or steady state) growth. Whether or not a change in rate of accumulation of a factor of production or the efficiency of factor allocation has only transitional effects on growth depends in part on the technology of production. For example, an exogenous change in the rate of investment or opening the economy to foreign trade has only a transitional effect on growth in a Solow type two-factor (capital and labour)-constant-returns-to-scale growth model if the marginal product of capital declines to zero as capital increases indefinitely relative to labour. On the other hand, if the technology is such that the marginal product of capital is bounded away from zero, transitional as well as steady state growth effects could arise from an exogenous change in investment or foreign trade policy (Srinivasan (1995)).
5

Institutional changes: Two very important institutions from the perspective of growth as well as poverty and inequality are markets and institutions of governance. Changes in institutions for risk taking and sharing, such as the replacement of informal risk sharing arrangements among members of a small community (e.g. households in a village) by transactions in a well functioning and anonymous markets, would have significant effects on resource allocation (e.g. crops grown, investments in irrigation system, use of fertilizers, decisions on fertility and human capital accumulation and so on) and growth. Whether or not individuals, particularly the poor, have opportunities to shape the decisions that affect their lives, whether the legal system is impartial, efficient and not too costly in enforcing rights (including property rights) and contracts, whether political and administrative corruption is pervasive or absent, all influence growth directly or indirectly. In cross-country regressions, these features are reflected through a set of explanatory variables such as crude indices of aspects to governance (e.g. indices of civil and political liberties, proxies for the prevalence of rule of law, corruption indices and so on). However, since the relationship between the features captured by such crude indices and growth is at best indirect and very much location and time specific, and possibly endogenous, the interpretation of the regression coefficients is fraught with ambiguities.
2.3. Sources of Inequality and Poverty and Factors Influencing Them
By definition, inequality in the distribution of income is the result of the inequality in the sources that generate income (e.g. stock of assets, opportunities for asset accumulation), and any inequalities among individuals in the process that transforms sources to income flows (e.g. returns on assets, failures for whatever reason to avail of opportunities). The functioning of socio-economic-political institutions is at the core of both these factors.
For example, the income of an individual (or a family or household of which the individual is a member) at a point in time depends of course on what she can earn from her assets including her labour. As long as she has access to competitive markets, and there are no policy or other distortions affecting market prices, her position in the income distribution reflects her position in the distribution of assets. If she is deemed poor in the sense of having an income below a poverty threshold, it means that her stock of assets is inadequate.
An overwhelming majority of the world’s poor live in rural areas and depend on agriculture either as farmers with small land holdings or as landless workers for their livelihood. Not having access to enough cultivable land has long been identified as a major factor in explaining poverty of a large segment of rural population. As such, land reform (i.e. redistribution of land to the landless cultivators), as well as tenancy reform (i.e. improving the security of tenure and increasing the poor tenant’s share in output), have been seen as essential ingredients of any poverty alleviation policy. Obviously, the functioning of land markets (both for transactions in land as an asset and in land tenancies) matters. Indeed, the high cost of transactions in selling or buying land could lock-in potential sellers from exiting agricultural occupation to pursue more rewarding opportunities elsewhere, and buyers, who can use the land more productively from entering, thus reducing their chances of becoming less poor. Also, since land owned serves as a collateral for obtaining credit (particularly from formal institutions) any imperfections in land markets spill over into credit markets. And lack of credit could prevent the poor from availing of income raising opportunities in agriculture. I return to credit markets below.
6

Inadequacy of earnings from current assets does not necessarily preclude the possibility of an individual escaping poverty in the future.5 For example, an individual with access to opportunities for productive investment (such as for example in human capital) as well as finance for such investment can escape poverty in the future, provided the returns from investment are high relative to the cost of finance. Of course imperfections in credit markets could raise the cost of finance.
Coexistence of wealth inequality, capital market imperfections, moral hazard and limited liability could lead to a reduction in realized growth relative to potential growth (Aghion et al. (1999)). The reason is that with a production technology that exhibits diminishing marginal returns to capital, returns to investment by individuals with little capital (wealth) will be higher than returns to investment by those with higher wealth. However, when effort in production is unobservable and liability is limited, individuals will tend to supply less effort (moral hazard). In an imperfect capital market, wealthy individuals with lower marginal returns to capital in their own activity nonetheless will not lend enough to poor individuals with higher returns because of the moral hazard on the part of borrowers. Thus, realized investment in the economy as a whole, and hence realized aggregate growth, would be less than what they would have been, were capital markets to be perfect and moral hazard to be absent. Under the circumstances, Aghion et al. (1999) find that there is a potential for policies of wealth redistribution to enhance growth. But they recognize that whether the potential is realized or not would depend on how wealth redistribution is financed:
“If redistribution were financed through distortionary (ex-post) taxation, there would be two incentive effects which conflict with one another: the standard effect whereby taxation reduces net returns and therefore lenders’ incentive to invest, and moral hazard with limited liability which decreases the effort exerted by borrowers. Then, whether redistribution raises or reduces the rate of growth depends on whether the standard effect of taxation on those individuals with large wealth endowments is smaller or greater than the positive impact on the effort of those with small endowments” (p. 1631).
Even if all markets, including in particular, labour markets (since the poor have few
assets other than their labour), were functioning well, there would always be some individuals who are weakly connected to the income generation processes of the economy because of their particular circumstances such as, for example, severe disabilities. By definition they have limited or no access to income earning opportunities and have to depend on private and public transfers for financing their consumption. Most of them are likely to be poor. Except in so far, as transfers are related to growth of incomes of others in the economy, growth per se is unlikely to alleviate their poverty. This fact was recognized long ago by Indian policy makers: in their blueprint for eradication of mass poverty in a fifteen year (1961-1976) period (Srinivasan and Bardhan (1974), Chapter 1), they planned for growth, at an average rate of over 7 percent per year, to alleviate poverty of only those well connected with income generation processes of the 5 I have used, and will continue in the rest of this paper, the term poverty somewhat imprecisely without distinguishing between transient and permanent (lifetime) poverty, and between poverty of a subset of individuals, such as women and children, within households and poverty of households as a whole. This is not because such distinctions are unimportant. Indeed they are – but to cover them in depth would require adding more pages to an already very long paper.
7

economy. However, for reasons that I briefly mention in Section 4, the realized growth (until the 1980’s) averaged only around 3.5 percent per year. 2.4. Effect of Market Imperfections, Inflexibilities, and Distortions on the Poor Once we recognize the reality that in developing countries the set of markets are rarely complete, and many of the markets that exist often are imperfect in their functioning, policy distortions are numerous, and that institutions (administrative, legal, social and political) function imperfectly as well, the constraints that make a person poor and keep him in poverty become more numerous and complex in their interactions. For example, institutions that govern the functioning of labour markets, particularly labour laws that impede the flexibility and raise the cost of hiring and laying off workers, and enforce relatively high minimum wages, could increase poverty, both by reducing employment in relatively high wage sectors protected by labour laws and by pushing workers into those less well paid sectors outside the ambit of labour laws. It has been recognised for a long time that because labour laws in India imitate those of rich industrialized countries, they protect excessively a small part of the labour force employed in the public sector and organized manufacturing, and have little relation to Indian labour supply-demand realities (Mahalanobis (1969)). Besides increasing poverty, such institutional constraints reduce the growth potential of the economy as well. Yet removing such constraints continues to be politically infeasible in India.
The poor for various well-known and understood reasons do not have access to less expensive credit from formal credit institutions such as commercial banks. If they are lucky, they may be members of a group which extends credit to each other on an informal basis at reasonable cost. If not, many have to obtain credit at much higher costs from moneylenders and other such informal sources or forego credit altogether. Any welfare gain that they could have obtained through consumption smoothing or the potential for their climbing out of poverty through availing of opportunities for investment with high returns are lost if they cannot get credit at modest cost. Clearly such severe credit constraints dampen realized growth relative to potential growth. However, to the extent that credit constraints reflect asymmetric information, moral hazard and enforcement problems, the impact of policy interventions to ease credit constraints is ambiguous since such interventions have two effects which go in opposite directions: a positive effect on growth by enabling the poor to invest in high return activities and a negative effect arising from exacerbation of incentive problems that are at the root of credit constraints.
An example of policy distortion is a trade restriction that protects capital-intensive importables in a labour abundant small open economy. This hurts the poor who have only their labour to sell in two ways: first, by reducing the returns to labour and, second, by raising the cost of their access to capital, as compared to a free trade equilibrium. Another example is a policy that forces farmers to sell part of their output of food crops at below market prices to state agencies that in turn resell the food to urban consumers (poor and non-poor) at subsidized prices. This policy hurts farmers, many of whom are often poor, directly by lowering their revenues, and indirectly through distortionary financing of subsidies to urban consumers. Both these policy distortions dampen growth as well.
I have not, thus far, alluded to macroeconomic policies – in particular, monetary and exchange rate policies, including the so-called financial sector policies relating to financial intermediaries, mainly because I am not a macroeconomist. Of course, one does not have to be a macroeconomist to argue that inflation will hurt the poor most since they have few
8

opportunities to hedge against inflation and that overvalued (in some appropriate sense) exchange rates hurt the poor, both by reducing the returns on exportables produced by them or in the production of which they are employed as workers, and increasing the cost of importables (such as agricultural inputs or food in some countries) purchased by them. It is also clear from the recent financial turmoil in parts of East Asia, that the weakness of the domestic financial sector in combination with relatively easy access to short-term external borrowing could trigger a financial collapse that hurts the poor. 2.5. Interrelationships: Influence of Policies and Other Factors in the Short and Long Run To repeat, the three outcomes, growth, poverty, and inequality, are jointly determined endogenous variables through relationships that could vary over time and space and subject to significant leads and lags in time.6 The exogenous variables determining them would include not only deeper forces of technology and preferences but also political economy.
A negative relationship between growth and poverty is hypothesized from the presumption that more rapid growth is the outcome of factors that raise the returns to the income-earning assets of the poor - for example, if the economy’s comparative advantage is in goods and services in the production of which the assets of the poor are intensively used, an exogenous shift in trade policy which encourages the production of such goods and services will alleviate poverty and increase the growth rate, at least in the short run, as long as a part of the gains in efficiency is invested in accumulation of human and physical capital.7,8 A more rapid growth, to the extent it raises government revenues, and part of the extra revenues are devoted to public expenditures on goods and services (such as education, health, sanitation and hygiene) that are disproportionately consumed by the poor, could reduce non-income facets of poverty such as poor health, high infant mortality and morbidity, lower life expectancy etc. It is also possible that trade liberalization could worsen welfare and increase poverty and inequality at least in the short run. If other distortions are present, and liberalization reduces only the trade distortion, it could be welfare worsening. Also, if trade liberalization opens up opportunities in the availing of which some individuals or regions are better placed because of prior investments, say in human capital or infrastructure, inequalities in income among individuals or regions will go up in the short run. As long as the initial disadvantage of some individuals or regions relative to others can be overcome in time, the short-run unequalizing impact of liberalization will be erased in the long run. Whether this happens or not depends on the flexibility of markets and institutions. 6 Once leads and lags are also recognized, so that an endogenous variable of one period becomes a pre-determined variable in the next (e.g. this period’s growth, in part, determines next period’s inequality and is, in turn, again in part, determined by last period’s inequality). The dynamics of the system could be complicated, with possibilities of “virtuous” and “vicious” cycles and even chaotic behaviour! 7 This argument assumes that either the losers from the shift in trade policy are compensated and the gainers invest part of their gains or in the absence of compensation, any reduction in investment by losers is more than compensated by the increase in investment by gainers. 8 It so happens that in the eighties and nineties labour intensive manufactured exports from developing countries penetrated the markets of developed countries to a greater and greater extent. This was also the period when real wages of less skilled workers stagnated and those of skilled workers increased in developed countries. Some have attributed this increase in skill premium to increased competition from exports of developing countries. Aghion et al. (1999) describe possible factors including import competition that could explain the rise in skill premium and the associated rise in inequality. I will not discuss the literature on skill premia in developed countries since the focus of this paper is poverty and inequality in developing countries.
9
More rapid growth could be associated with increases in poverty and/or inequality, at least temporarily, for other reasons than the initial advantage of some individuals in responding to a policy change. For example, Kuznets suggested that growth sparked by reallocation of resources from low-inequality-low-productivity sectors to high-productivity-high-inequality sectors could raise inequality initially until the transfer process was complete and forces reducing inequality took over. The literature empirically testing this Kuznets relationship is vast but inconclusive (Anand and Kanbur 1993). More rapid growth could increase poverty by eroding the asset base of the poor such as common property resources to which they had free access; more rapid growth resulting from a shift in public expenditure away from the provision of or subsidies on goods and services of importance to the poor towards public investment in growth promoting infrastructure would raise poverty. However, it is not growth per se that is in the source of increased poverty but the mode of financing the investment that led to growth.
More generally, unsustainable growth brought about through inflationary financing of investment, or accumulation of public debt, could increase long-run poverty because growth will cease and the poor will bear the future cost of bringing it about while it lasted. However, while it lasts, such growth could be associated with temporary reductions in poverty. In India, the growth that occurred in the eighties prior to economic reforms in 1991 was unsustainable, led as it was by rising fiscal deficits that were financed by costly borrowing at home and abroad. Soviet-style rapid growth that resulted from increasing rates of investment, ran into diminishing returns, and could not be sustained.
I have thus far been using the terms poverty and inequality interchangeably. This is obviously not appropriate, if poverty is viewed in absolute terms (e.g. proportion of the population with incomes below a threshold) and inequality in relative terms (e.g. measures, such as the Gini coefficient and variance of the distribution of income (or its logarithm)). The distinction between the two is important conceptually and from a policy perspective: for example, growth that increases the incomes of everyone including the poor, but in greater proportion for the non-poor, will be associated with lower poverty and higher inequality. Such growth would be desirable from a social welfare perspective (i.e. all Pareto improvements are desirable) as long as social welfare is sensitive to individual welfare and is free of envy. Whether it is sustainable from a political perspective is another matter altogether.
Early development economists, such as Arthur Lewis (1955) emphasized the importance of savings and the associated accumulation of physical capital for accelerating growth. We now know that it is not just the rate of investment in capital (human or physical) but also whether there are incentives for its efficient use across activities and over time that is important for growth. Given their focus on savings and investment, and the natural presumption that the rich save a greater proportion of their income, they argued that greater inequality in the distribution of income, with a larger proportion of a given total income accruing to the rich, would augment savings, and hence, investment. 9,10 Political scientists in
9 Since they were concerned with long-term growth and also believed, somewhat naively as it turned out, in the ability of the state to smooth fluctuations through fiscal and monetary policies, they did not waste their time on whether potential savings will be invested in full or frustrated in part. As such, business cycles did not play any role in their analysis. In the recent literature, macroeconomic volatility is viewed as a possible channel through which inequality affects growth. Aghion et al. (1999) describe a simple model in which only a fraction of savers can invest in high return projects while everyone has access to a low return project and one’s borrowing is restricted to a proportion of one’s wealth. Because those who invest, and those who save, are not identical, a link between inequality and volatility arises. Investors accumulate debt during booms and eventually reach their
10

the fifties and sixties viewed democratic societies with powerful labour unions as prone to redistributive taxation that taxed heavily the rich savers. Thus, greater inequality or non-democratic regimes would be associated with faster growth from these perspectives.
More recently, it has been argued that the political legitimacy of growth promoting regimes (authoritarian or democratic) depends on whether the fruits of growth are widely shared, and as such, lower inequality in the distribution of income is viewed as facilitating the adoption of growth promoting policies (World Bank 1993). Whether in fact the erstwhile authoritarian regimes of East Asia sought legitimacy by ensuring that fruits of growth were widely shared or whether the policies that generated growth in East Asia, such as outward orientation delivered shared growth is arguable. Some even question whether in fact fruits of growth were widely shared in any case.
Poverty and absence of means of old age security other than support from one’s own children, could encourage greater fertility among households, greater participation of children in the labour force, and lower investment in their human capital. The net effect could be lower growth. By the same token, greater public expenditures on health, education, sanitation and hygiene financed by lower expenditures on, say, economic infrastructure, could improve non-income facets of poverty while reducing growth. But this positive effect on the poor could be offset in part by the fact that the poor have no option, such as for example investing in small generators or using private courier service for offsetting the failures of poorly performing public power and postal systems. There are many possible ways in which changes in poverty and inequality could affect growth in one direction or the other, of which I have discussed only a few.
3. Time Series and Cross-sectional Data on Growth, Poverty and Inequality 3.1. Data on National Income, Consumption and Growth
The two most widely used indicators of development are real national income per capita and its rate of growth. By definition real national income per capita is the ratio of deflated nominal national income (or value added) in any period and an estimated average size of the population during that period. In arriving at nominal value added, first, all activities that add value are to be included so that coverage is complete and, second, outputs and non-factor inputs into each activity in the relevant period are quantified and properly valued so that quantification and valuation are correct. Unfortunately, in developing countries coverage is rarely complete and there are serious problems with methods often employed for quantification and valuation. The biases and errors associated with incomplete borrowing capacity while savings continue to rise, so that part of the savings have to be invested in low return projects thus triggering a slump. They conclude “If the fraction of the population with high-yield investment possibilities is small enough and/or the credit multiplier low enough, there will be continuous oscillations of the investment level. Such volatility of investment in turn implies that there are unexploited production possibilities and hence the long-run growth rate is lower than it could be” (p. 1629). Analytically this model is certainly more sophisticated and interesting than old fashioned multiplier-accelerator models with floors and ceilings on output (Hicks 1950), which also generated boom-bust cycles. But it is perhaps less realistic. 10 Lewis (1955, 1976) argued that only redistribution in favour of profit earners is likely to augment savings. He drew an interesting distinction between 'vertical' and 'horizontal' trickle down, the former referring to progressive increases in the wages of workers in the modern sector at the expense of the expansion of the modern sector. The latter referred to the expansion of the modern sector, at a constant, but higher, real wage than in the rest of the economy. I thank Suresh Tendulkar for drawing my attention to this.
11

coverage and methods of quantification and valuation are likely to vary over time within a country, perhaps become less serious as data gathering capacities improve. Further, the extent of biases and their time trends are unlikely to be comparable across countries.
Growth rates of real income are often compared within countries over different periods and across countries. As is well known, the relative price structure (across commodities and sectors) shifts over time as development proceeds and as different sectors experience different rates of technical progress within and across countries. Under these circumstances, the growth rate of conventional real income estimates over a given period depends on whether the initial or the terminal year is used as the base and on the method of deflation (e.g. single or double deflation). Also, if coverage improves over time or if downward biases in income measurement go down, growth in income as measured would overstate the “true” growth. Equally, understatement of growth could also arise. This is not to say that these problems cannot be addressed. For example, through chain-linking the problem of using a single base year could be alleviated. Furthermore, as the base year is changed to a more recent one, the opportunity is often used also to expand coverage and use more recent information and an ad hoc revision is made in the past data for the difference in coverage as compared to the old base year.11 3.2. International Comparisons of National Income and Growth In addition, in international comparisons an exchange rate conversion is involved. Thus if some (official, black market, purchasing power parity (PPP) or whatever) exchange rate is used to compare the levels of income at a point in time between two countries, and growth rates for a period preceding that time are computed using a constant domestic relative price structure, anomalous results can arise. A prime example of this is provided by the World Bank (1999a, Tables 1.1 and 1.4). According to these tables, in 1997 India and China had GNP per capita of US$370 and US$860 (based on exchange rates of the Bank’s “Atlas” method) respectively and the average annual rate of growth of GNP per capita during 1965-1997 was 2.3% in India and 6.8% in China. Taken together, these levels and rates of growth would imply that China’s per capita GNP in 1965 was about 90 percent of India’s. No knowledgeable observer of the two countries would subscribe to this ranking. Ahmed (1994) illustrates a similar problem by comparing the actual PPP exchange rate converted GDP’s of a year with a forecast obtained by applying domestic GDP growth rate to the PPP converted GDP of some previous years. The differences seem substantial for many countries (see also Heston (1994)). The easy accessibility of PPP-based macroeconomic data put together by Robbert Summers and Alan Heston, ostensibly for more than 100 countries and for more than four decades since 1950, spawned the ‘cross-country growth-regression’ industry. The practitioners of this technique often ignore the fact that most of the data are mere extrapolations.
For many small open developing economies with severely distorted foreign trade sectors, the opportunity costs of traded commodities are their world market prices, although domestic resource allocation decisions would be driven by distorted domestic prices. If distortions are severe, and domestic transformation of imported inputs into tradable outputs is
11 Such revisions could be quantitatively large. For example, the fiscal deficit of India's central government was put at 8.3% of GDP series with 1980-1981 as base and at 7.1% of GDP using the revised series with 1993-94 as base (Government of India 1999, Table 2.1).
12

inefficient, it is possible that value added at world prices (computed by valuing tradable inputs and outputs at world prices) in some activities could be negative, and indeed were found to be negative (Soligo and Stern (1965) for Pakistan, Bhagwati (1968) for India) in some developing countries. Of course value added at domestic distorted prices would always be positive. From a welfare perspective, as the manuals on project appraisal (e.g. Little and Mirrlees (1974 )) argued, only value added at world prices is the appropriate measure. Even if activities with negative value added at world prices are unimportant from the perspective of the economy as a whole, still the levels and growth rates of national income (i.e. value added) at world prices would differ from those at domestic prices (Bhagwati and Hansen (1973)) .
The measurement errors and biases in components of GDP, particularly those that have figured prominently in the recent cross country growth regression literature such as savings, investment, foreign trade and capital flows as well as in data on demographic and human capital indicators are very serious. These issues are discussed in my overview (Srinivasan (1994)) and other papers published in the special issue on Data Base for Development Analysis (Journal of Development Economics, Vol. 44, No. 1, June 1994). 3.3. Data on Income Distribution and Inequality One source of data on income distribution is income tax records. In many developing countries, several categories of income (particularly agricultural income) are tax exempt. The exemption limit for taxable income is high relative to per capita income in countries such as India. Above all there is significant evasion and avoidance of income taxes. For all these reasons the use of tax returns is infeasible in putting together a size distribution of income. Besides, tax returns refer to units which could be individuals, nuclear families, and in India, the so-called Hindu-undivided-family (an extended family which pools its income and expenditures). The distribution of income by such units is not particularly meaningful analytically.
Estimates of the extent of poverty (income or consumption based) and inequality, are mostly based on data on distribution of income or consumption. Many countries also collect income and consumption data at regular intervals through household surveys. Most often survey-based estimates of consumption or income and those derived from national accounts data differ substantially. I return to this issue below in the context of India. Deaton eloquently describes the problems in estimating income in developing countries through a survey as follows:
“The concept of income is itself extraordinarily complex, and most people in developing countries have little reason to distinguish between business and personal cash transactions. . . . . Even in developed countries the measurement of self-employment income is notoriously inaccurate. The problems are not entirely solved even by the detailed questioning of more sophisticated surveys, in which the surveyor, not the respondent, calculates income. And the national accounts data for household saving are not themselves reliable enough to provide a good cross-check that will show what sort of surveys do best or how they should be redesigned to do better” (Deaton (1989), p. 63). Apart from the problem of measuring income and expenditures reliably through
surveys, there are others related to survey design. For example, in the Indian National Sample
13

Survey, the focus of enquiry varied from one annual round to the next. Although, consumption expenditure data are canvassed, even in a round in which it is not the focus, from a subset of households, the sampling and non-sampling errors of estimated average consumption will be higher as compared to rounds in which the primary focus is consumption expenditure, both for the reason of a lower sample size and because its not being the primary focus of the survey. The data collected on consumption expenditure are likely to be of poorer quality as well. Also, these surveys are often designed only for estimating a national or a regional average, accurately. This means that using the empirical distribution across households in the sample, as an estimate of the distribution among the entire population of households, would be subject to large sampling errors. The same problem arises with respect to inequality measures. For example, a sample size that is adequate for estimating the mean consumption with reasonable precision could be inadequate to estimate mean incomes of individual decile groups with the same precision. Also the definition of a household in most surveys, i.e. a household consists of all individuals who usually eat out of the same kitchen in the reference period, is not appropriate for analyzing the distribution of income and expenditure. The more appropriate unit is a family or family-like group whose members pool their incomes and expenditures. Although the survey household is most often a family, this is not always the case.
At least four possible size distributions can be generated from survey data, viz. distribution of households by total or per capita household income, of persons by total or per caput household income. Whether one reports per capita or per household distribution is extremely important since the two would differ substantially and inferences could be very sensitive to the distribution reported. Of course whether the same weight should be assigned to all persons in a household regardless of their sex and age is another issue, though poverty incidence or intensity is unlikely to be sensitive to the use of adult (male or female) equivalence scales. Often data on inequality measures such as the Gini coefficient are published without explicitly specifying to which of the four distributions the coefficient refers. Even by his own very minimal standards, viz. that data be national in coverage, concepts of income and recipient unit be the same over time, and the data base be a national census or household survey, Fields (1994) found that half of the then 70 available data sets for developing economies had to be rejected. Of course, if the problems highlighted by Deaton (1989) about income measurement in surveys are taken as seriously as they should be, and if stricter and perhaps more appropriate standards of reliability and clarity are applied, even more data sets will be rejected. Further, the surveys that are not rejected might be unrepresentative in that they are more likely to be from richer and advanced countries of the world.
Deninger and Square (DS) (1996) have updated Fields (1994). By drawing together more than 2600 observations on inequality measures, such as Gini coefficients and quintile shares, from a wide range of studies for 112 developed and developing countries and for the period 1947-94, they have extracted what we may deem a ‘high-quality’ set of 700 observations and labeled them as acceptable for users. The DS data set has been widely used, along with the Summers-Heston data by the cross-country regression industry. Atkinson and Brandolini (1999), who are very appreciative of the work of DS, subject the DS ‘acceptable’ data for a sub-set of OECD countries to a careful scrutiny as to their sources, methods of compilation, definitions of income and the unit (e.g. household, individual etc.) of measurement and other relevant aspects. Among their many conclusions, the following is worth noting “we are not convinced that at present it is possible to use secondary data sets
14

safely without some knowledge of the underlying sources, and we strongly caution against mechanical use of such data sets” (Atkinson and Brandolini, 1999, p. 35 emphasis added). Few practitioners of cross-country regression go beyond mechanical use. This does not mean that it is not possible to do so: the message of Atkinson and Brandolini is simply that one has to satisfy oneself that the inequality data are reasonably comparable in concept and coverage across countries and over time before embarking on an explanatory or casual analysis which make use of them.
3.4. Data on Poverty A more relevant indicator of development than measures of concentration or relative inequality in the distribution of income for many countries is measures of the extent and intensity of poverty. In measuring poverty there are additional problems of international and intertemporal comparability, arising from alternative definitions of what constitutes the poverty level of real income or expenditure and the relevant price index for converting it to nominal income.
A customary procedure for estimating the extent of poverty is to define a poverty line (i.e. an income or consumption expenditure threshold, usually for individuals), and the poor are those individuals whose income or consumption is below that threshold. There are serious (and contentious, if not insurmountable) problems in defining meaningfully a poverty line income that could be used to distinguish the poor and non-poor, regardless of time and space.12 Adam Smith was very sensitive to the socio-cultural specificity of poverty norms. He classified consumable commodities as either necessaries or luxuries. The bundle of goods consumed by the poor will obviously be largely of necessaries. In defining necessaries he had this to say:
“By necessaries I understand, not only the commodities which are indispensably necessary for the support of life, but whatever the custom of the country renders it indecent for creditable people, even of the lowest order, to be without.. . . Under necessaries therefore, I comprehend, not only those things which nature, but those things, which the established rules of decency have rendered necessary to the lowest rank of people.” (Smith (1937), pp. 821-22).
In sharp contrast to Adam Smith contemporary analysts of poverty ignore them
altogether. For example, the World Bank and other international institutions including the Asian Development Bank, publish estimates of the extent of poverty in individual countries and regions using alternative poverty lines of $1 a day or $2 a day at 1985 purchasing power parity (PPP) terms. I have cited these estimates earlier in this paper. It is worth noting that apart from the questionable use of a common global poverty line, there are other problems with this approach.
First, is the use of PPP. As I noted earlier in the commonly used Summers-Heston data set, actual price comparisons are used in computing PPP only for certain benchmark 12 It might be thought that there are no serious problems in defining a food-energy-method (FEM) based poverty line and that culture-geography-time based differences on non-food components of the poverty basket could be allowed for by using different scaling factors to arrive at an aggregate consumption poverty line from the FEM poverty line. I have argued elsewhere that there are serious conceptual and measurement problems in defining energy requirements on which FEM rests (Srinivasan 1992).
15
countries and years. The extension to other countries and years is by extrapolation through procedures, which the authors themselves admit to being rough and ready. Second, their price comparisons are, at best, of national average prices. For poverty estimation, given that the poverty line is that level of income or expenditure which would enable an individual to purchase the poverty bundle of goods and services, the relevant prices are those that the poor face, and not national average prices. The poor often buy different varieties of the same commodity compared to the non-poor. Even if they buy the same varieties, they sometimes pay higher prices. Further, their consumption is likely to include more home-produced goods and services for which imputed prices are inevitably noisy and, of course, the poor consume different goods and different varieties of the same goods as compared to the non-poor. Third, the only plausible reason for using a common poverty line is that it enables aggregation over countries and regions, allegedly on a comparable basis. But the policy relevance of such aggregate estimates is moot: policies that affect poverty are largely national and sub-national. Only the somewhat naive would believe that international policies which determine foreign aid and assistance from multilateral institutions to developing countries are largely driven by their levels of poverty. Under the circumstances aggregate poverty estimates are of limited, essentially propagandistic rather than analytical, value.13 3.5. Comparison of Household Survey and National Income Data Estimates of private consumption expenditure from household surveys often differ from those from national accounts. Figure 1 shows the trend in the ratio of per capita consumption expenditure from India’s national sample survey (NSS) and national accounts (NAS)–the ratio fell from 75 percent in 1974 to 50 percent in 1998! In the fifties and sixties, the two estimates were much closer to each other, rarely differing by more than 5 percent (Mukherjee and Chatterjee (1974), Srinivasan et al. (1974)). As noted in the two papers, there are many legitimate reasons for the difference. Still, if the difference increases over time, there is a strong presumption that one or both estimation methods have deteriorated in reliability. However, if the increasing discrepancy is solely or largely due to the increasing non-response of and under reporting of their consumption by non-poor households, it would not affect poverty analysis. On the other hand, if it is largely due to under reporting by all groups, it would. Let me illustrate with estimates of trends in poverty at the national level.
The trends in estimated poverty (head-count ratio of the proportion of poor in the Indian population) differ significantly–as seen in Figure 2–depending on whether NSS data are used for both the mean and distribution (among persons) of consumption expenditure or whether NAS mean and NSS distribution are used. The former shows no trend in poverty during the past reform 1990s while the latter shows a declining trend.
Clearly, the policy inference about reforms would be different depending on which data set is used. I return to this issue in Section 4. The sensitivity of inferences to the data used is also seen from Table 3 taken from Atkinson and Brandolini (1999). Whether or not
13 In saying this I do not in any way mean to question the increasing emphasis on poverty alleviation in bilateral and multilateral assistance. Nor do I question the need for continuing to urge such an emphasis. But my point is different: the aggregate numbers are of little help in monitoring progress in poverty alleviation. National (and sub-national data in relatively large nations) poverty data are the most useful for this purpose. Deaton (2000) however sees some value in estimating global poverty using a common poverty line while being very critical of PPP based global poverty estimates.
16

one infers a significant positive association between inequality and average inflation in OECD countries over the period 1970-90 depends on the data used.
In India, the updating of rural and urban poverty lines to reflect price changes is based on versions of the consumer price index for agricultural labourers (CPIAL) and Consumer Price Index for Industrial Workers (CPIIW). In fact, a simple average of CPIIW and a consumer price index for urban non-manual workers is used in updating urban poverty line. Until it was rebased in 1995, in the CPIAL commodity weights were based on expenditure proportions of 1960-61. In CPIIW the weights were based on expenditure patterns of 1958-59 until its rebasing in 1988. Price quotations are collected from shops in selected markets in villages and urban centres.
Deaton and Tarozzi (1999) after noting the problems with price quotations and commodity weights used in the two indices, provide an independent set of calculations for rural and urban price indexes using NSS data on expenditure patterns as well as unit values for commodities for 1987-88 and 1993-94, for India as a whole and for 17 of the largest states and the union territory of Delhi. Their calculations
“suggest as a working hypothesis that, between 1987-88 and 1993-94, there was no great difference in the rate of decline of urban and rural poverty, at least according to the headcount measure (p. 34-35)”.
This section can be summarized simply: there are serious conceptual problems,
measurement errors and biases in the estimates of income growth as well as poverty. Estimated levels as well as time trends in poverty are very sensitive to these errors and biases. If analyses are confined only to those countries with “good” data, a possibly serious selection bias would arise. For all these reasons any lack of statistical association (or for that matter association between growth and poverty reduction in faulty data sets) cannot be accepted at face value without further analysis of data problems. 4. Did More Rapid Growth Reduce Poverty in India? It is clear that only from careful studies of individual countries (in fact, of appropriate sub-regions of large countries) in a comparative framework over a sufficiently long period of time in which there were sufficient changes in policy regimes, institutions, technologies and preferences could one potentially identify the deeper structural relationships involved. I am not aware of any such study for any developing country. The individual country studies that are available, inadequate as they are to varying degrees, nonetheless are informative. Quibria (1994, Volume 1, 1996, Volume 2) reports on rural poverty in several Asian countries. Urban poverty in Asia is the topic of Pernia (1994).
India is almost unique among developing countries for which household survey-based data on consumption expenditure are available for nearly five decades. The Indian data strongly support the association between growth and poverty reduction. If we ignore the growing divergence between estimates of aggregate consumption expenditure national accounts and national sample survey, and use only the data from the sample survey, it is found that until the late seventies, the proportion of the country’s population deemed poor did not show a declining trend. It fluctuated between a low of 43 percent in 1952 to a high of 62 percent in 1966-67 (Table 4). Then between 1977-1978 and 1990-1991, just prior to the introduction of systemic reforms of the economy following a severe economic crisis, the
17

national poverty ratio declined significantly from 48 percent to 35 percent. The macroeconomic stabilization measures adopted at the same time as systemic reforms in July 1991 resulted in the stagnation of real GDP in 1991-92 relative to the previous year. A fall in total agricultural output by two percent, and more importantly of food grains by 4.2 percent in the same year because of poor weather coincided with macroeconomic stabilization. The two together certainly contributed to a rise in poverty ratio to 41 percent in 1992. Since then poverty ratio has apparently stagnated at about 35 percent.
A plausible, even compelling, case can be made that prior to the late seventies poverty ratio did not decline because the growth in per capita income was meager. After all, during the three decades 1950-1980, India’s GDP limped along at an annual average rate of growth of 3.5 percent while population was growing at 2.2 percent per year (Table 5). During the 1980s India’s GDP growth rate accelerated to an average of 5.8 percent per year, a rate that was exceeded by only 9 out of 123 countries (World Bank 1999b, Table 11). The growth acceleration was associated with the reduction in poverty ratio noted earlier. GDP growth resumed after 1991-92, the year of stabilization, and has averaged at 6.1 percent per year in the 1990s. Again, this growth rate was exceeded in relatively few, viz. 19 out of 137, countries (World Bank 1999b, Table 11). Yet, even with systemic reforms since July 1991 and the resumption of GDP growth, there has been apparently no further significant decline in poverty ratio.
The apparent lack of trend in the former is largely due to the absence of such a trend in rural poverty (Figure 3) since the nearly 70 percent of India’s population is rural. It so happens that NSS based poverty estimates of urban and rural India together declined substantially from around 50 percent to around 35 percent between 1977 and 1990. GDP grew at an average rate of 5.7 percent in the 80s and over 6 percent in the 90s (excluding the crisis year of 1991-92). Without a satisfactory explanation for the declining trend in the ratio of NSS to NAS per capita consumption, one is faced with a dilemma. If one associated growth with poverty reduction, then one has to explain the failure of NSS based poverty to go down in the 90s in contrast to the 80s, but not much to explain if NSS distribution of NAS mean consumption are used to estimate poverty throughout. On the other hand, if one had no a priori grounds for associating between growth with poverty reduction, one is left with the problem of explaining such association in the NSS data in the eighties.
Since I happen to believe that sustainable growth will reduce poverty, I will try to explore the factors behind stagnation of poverty, particularly rural poverty, after the 1991 reforms. I have already referred to the finding of Deaton and Tarozzi (1999), that once proper deflators are used, the rural-urban divergence disappears, at least for the period, 1987-88 to 1993-94, covered by them. Even if this were not the case, one could still attribute a large part of the divergence to the fact that the reform process has thus far left agriculture and rural areas largely untouched. Indeed this conclusion is reinforced by the fact that in more urbanized states poverty continues to decline in the post reform period. There is a revealing divergence in the trends in rural poverty between two groups of states in the post reform period. This is seen in Figure 4. In the states of Andhra Pradesh, Gujarat, Karnataka, Kerala, Maharashtra, West Bengal and Punjab, the trends in rural poverty began to diverge from that in the states of Bihar, Madhya Pradesh, Orissa, Rajasthan and Uttar Pradesh from 1977-78, the year when the downward trend in poverty in India began. In the first group, poverty continued to decline in the post reform period, albeit at a slower rate. There was no such decline in the second group.
Besides their greater poverty, the second group of states have higher rates of illiteracy (particularly among females). In terms of other social indicators such as rates of infant
18
mortality, school drop-out rates etc., they are poorly placed relative to the first group. They are also more rural and more dependent on agriculture. Except for Punjab, all other states in the first group are coastal while all the states in the second are inland. I suggest that all these factors taken together put the second group at a relative disadvantage in exploiting the opportunities created by the reforms.
Unlike household surveys in other countries in which sample households provide data on expenditure of food consumption during the week preceding the date of survey, in the Indian NSS, households are asked to provide data for the preceding month. The reference period of a month was adopted in the fifties after a limited experiment comparing the two reference periods and has since been kept unchanged. After 1993-94 and until 1998 as an experiment, data were collected from two independent samples of households using the reference periods of 7 and 30 days preceding the date of survey for food items. Surprisingly, rural (urban) households reported 27 to 32 (31 to 35) percent higher expenditure on food items with a 7 day reference period as compared to 30 day reference period (Table 6). With poverty line unchanged, poverty according to weekly data, ranged between 19 and 24 (15 and 20) percent in rural (urban) areas. These figures were almost 40 to 50 percent lower than those estimated using monthly data. Even more surprisingly, when in the second half of 1999, the data were collected from the same sample of households using the two reference periods, the monthly figure turned out to be nearly the same as the weekly figure!!! Some suggest, that by letting the households be canvassed for the two reference periods at the same time, the possibility that canvassers collected data for only one reference period and arrived at the figure for the other period through arithmetic manipulation, could not be ruled out. Once again, the Indian experiments point to one more source of measurement bias that might affect international comparability of data on poverty. Deaton (2000b) analyzes the Indian experiment in depth.
Datt (1997, 1999), Datt and Ravallion (1992, 1997, 1998a, 1998b) and Ravallion and Datt (1996a, 1996b, 1999) have analyzed the determinants of and factors (including policy instruments) that influence the trends in poverty. Before drawing on their most recent (1999) paper, let me summarize their findings in earlier papers as cited in the World Bank (1997). First, poverty ratio goes down by one percent for every one percent increase in net domestic product per capita14. Second, a decomposition of the changes in poverty ratio into a growth component (i.e. growth in mean consumption) and a redistribution component shows that nearly 87 percent of the observed decline in poverty ratio was accounted for by the growth component. Third, the sectoral composition of growth matters in so far as rural economic growth contributes far more to poverty reduction than urban economic growth. Fourth, initial conditions relating to human resources and infrastructural development accounted for a sizeable share of the differences between states in reducing rural poverty.
In their most recent paper (Ravallion and Datt 1999) they allow "for multiplicative interactions of the sectoral composition of growth with initial conditions in determining the evolution of state level poverty" (p. 3). The authors point out,
“Broadly speaking, our results can be interpreted as indicating that non-farm economic growth was less effective in reducing poverty in states with "poor" initial
14 As I argued earlier, viewing parameters of a relationship between two endogenous variables (in this case, poverty and net domestic product) as stable and as reflecting deeper processes is incorrect. Also, data problems, in particular due to changes in sample design, plague their analysis of data that go back to the 1950s.
19

conditions in terms of rural development (in both absolute terms and relative to urban areas) and human resources. Low farm productivity, low rural living standards relative to urban areas and poor basic education all inhibited the prospects of the poor participating in growth of the non-farm sector.” “Rural and human resource development appear to be strongly synergistic with poverty reduction though an expanding non-farm economy. Amongst the initial conditions we have found to matter significantly to prospects for pro-poor growth, the role played by initial literacy is particularly notable. For example, more than half of the difference between the elasticity of the head count index of poverty to non-farm output for Bihar (the state with lowest elasticity) and Kerala (the highest) is attributable to the latter’s substantially higher initial literacy rate (Ravallion and Datt 1999, p. 20).”
5. Growth, Inequality and Poverty: International Evidence A positive association between growth and reduction in poverty is seen in several large countries with a high incidence of income poverty; such as China, India, Indonesia (until the financial crisis) and the Philippines. A few Sub-Saharan African countries such as Botswana, Lesotho and Mauritius also enjoyed high growth resulting in a reduction in those nations’ poverty. The association with income growth of non-income facets of poverty is also evident (Table 1): there has been a general improvement of life expectancy, rates of infant and child mortality, educational attainments and so on, although some of the gains achieved are being threatened by the AIDS epidemic in some countries of Sub-Saharan Africa and Asia. What is noteworthy, and calls for deeper analysis, is that only 6 out of a sample of 87 countries to which Table 1 refers had sustained and rapid growth over the two decades, 29 had moderate or improved growth in the 1990s and 52 countries failed to achieve sustained growth.
It is evident that for aggregate growth to have an impact on poverty, it has to be sustained for a sufficiently long period of time. The reason is that volatility in aggregate growth implies greater uncertainty on returns from investment by individuals in physical and human capital and in innovations, thus blunting the efforts of the poor to climb out of poverty on their own. Growth volatility also could induce volatility in public revenues and prevent any sustained increase in public expenditures devoted to poverty reduction.
Many developing countries experienced significant growth only during the 1990s. A decade of growth might be too short to see significant reductions in poverty. Except such Asian countries as China and India, a few developing countries had sustained growth covering two decades or more. Since the observations are too few to do an econometric analysis of the growth-poverty-reduction experience over time of individual countries, it is not surprising that cross-country regressions are popular in growth analysis. Although such, regressions are subject to serious limitations on theoretical, econometric and data quality grounds, they could provide useful information, suggest new hypotheses, and even serve as aids to thinking about issues at hand. For this reason I will discuss results of a few such regression studies despite their severe limitations.
In many ways, perhaps the most careful (econometrically) study is that of Dollar and Kraay (2000a). They define the poor as “the bottom one fifth of the population” so that by definition, the proportion of the poor at all times and in all countries is 20 percent. Thus poverty goes down from their perspective if and only if the mean real income of the bottom
20

20 percent goes up. This relative definition of poverty precludes any simple comparison of their results with those of other studies using an absolute definition based on national or international (e.g. $1 a day) poverty lines. Their data on income of the poor and mean income relate to “80 countries covering four decades, giving us 236 episodes in which we can link growth in income of the poor to growth in overall income” (p. 2). They estimate variants of a basic regression of the logarithm of per capita income of the poor on the logarithm of average per capita income, a bunch of control variables and a country fixed effect. They allow for measurement errors and endogeneity of control variables as well as for the omission of possibly relevant control variables. They also test for over identifying restrictions. Their control variables include proxies for openness, capital account restrictions, rule of law, democratic institutions, inflation rate, government consumption and expenditures on social sectors as a proportion of total government spending and primary school enrollment.
The authors sensibly do not over-interpret their results. These suggest, that notwithstanding the variation around the estimated relationship, the effect of growth on income of the poor is the same in rich and poor countries; incomes of the poor do not fall more than proportionately during economic crises; the poverty-growth relationship is stable in recent years; policies that promote overall growth also benefit the poor; good rule of law and fiscal discipline benefit the poor as much as the rest of the population; inflation is more harmful to the poor than for the rest; finally, there is no evidence that formal democratic institutions as well as public spending on health and education have systematic effects on the poor.
Since Adam Smith economists have rightly emphasized that openness to foreign trade “promotes growth through a myriad of channels: increased specialization, efficient resource allocation according to comparative advantage, diffusion of international knowledge through trade, and heightened domestic competition as a result of international competition” (Sachs and Warner, 1995, p.3). Grossman and Helpman (1992) place innovation at the center of the growth process and explicitly model comparative advantage in innovation as well as production and allow for technological spillovers and possible imitation of innovators by others. Indeed, in one version of their model, trade between developed (North) and developing (South), and imitation of Northern innovations by the South, actually spur northern innovations. In Lucas (1993) outward orientation of East Asian economies plays a central role in explaining their ‘miraculous’ growth through learning.
Although the theoretical formulations for a trade-growth linkage, and for a trade-poverty linkage following from it, are strong, empirical demonstrations of the linkage from the studies in the late sixties and seventies sponsored by OECD (Little, Seitorsky and Scott, 1970), and NBER (Bhagwati, 1978; Krueger, 1978) to recent cross-country regression (Sachs and Warner, 1995), have been controversial. Rodriguez and Rodrik (1999) are the most recent critics.
Dollar and Kraay (2000b) attempt to respond to some of their econometric criticisms, by relating decadal changes in trade volumes (which they see as a better (though not perfect) proxy for changes in trade policy) and decadal changes in growth. Focusing on changes also mitigates the effect of geography on growth (and trade) through channels other than trade policy. By including time dummies they seek to control shocks common to all countries included in their analysis. Their focus is on post-1980 globalizers. Whether or not a country is defined as a globalizer is based on the decline in trade-weighted average tariffs and the increase is constant price value of trade (exports plus imports) relative to real GDP. Among the top 40 countries according to each of these two criteria, 16 appear on top in both. The 16
21
included Brazil, China and India among large countries. Unsurprisingly, none of the African countries is among them. Two African economies that came closest to their threshold were Ghana and Uganda, which they included in the analysis. By focusing on within country changes in trade and growth, they find a strong positive relationship between the two, and no systematic relationship between changes in trade and changes in household income inequality. Combining the results of their two papers they confirm the strong theoretical presumption that open trade regimes lead to faster growth and greater poverty reduction.
Bénabou (1996) surveys many cross-country regression results on inequality and growth. His focus is primarily “on mechanisms by which income distribution (whether endogenous or exogenous) can affect output growth, rather than the reverse effects [e.g. Kuznets Curve] from the level of development to inequality” (p. 16), he also asks (and answers without fully resolving it) an interesting empirical question: are countries “converging to the same level of inequality or are there permanent differences” (p. 18).
After surveying 23 reduced form regressions of average growth in per capita GDP over some long period on initial inequality and several controls including initial income, initial stock of human capital or its proxies and regional dummies, he concludes:
“These regressions, run over a variety of data sets and periods with many different measures of income distribution, deliver a consistent message: initial inequality is detrimental to long-run growth. The magnitude of this effect is consistent across most studies: a one-standard-deviation decrease in inequality raises the annual growth rate of GDP per capita by 0.5 to 0.8 percentage points.” (Bénabou (1996), p. 13)
In judging the consistency of the message and the stability of the magnitude of the
effect of inequality on growth across reduced form regressions, one needs to keep in mind the problem that not all the inequality measures used are comparable across countries or over time within countries.
Bénabou also discusses three sets of distribution and growth theories which incorporate some essential features of the political and economic (essentially a market-based) system. In the first set of political economy theories the market system is complete and efficient, so that failures of capital and insurance markets do not prevent efficient asset accumulation and risk taking. As such, inequalities in wealth across otherwise identical individuals in any political-cum-market equilibrium is solely due to inequalities in their political power. An extreme version of such a system would be a political dictatorship and a ‘perfect’ market economy in which all individuals have the same wealth initially. A lump sum redistribution of wealth by the dictator to favored groups would create inequalities that would not have arisen in a non-discriminatory political system. In the second set of imperfect capital market theories, the initial distribution of wealth has macroeconomic implications for growth and its volatility as in Aghion et al. (1999). In the third set of socio-political theories, social and political conflicts among subgroups within the society create uncertainty and insecurity, particularly about property rights. Such uncertainty discourages accumulation of wealth and long-lived assets and hence growth. Bénabou derives several theoretical propositions through two models, one of which integrates the first and second set of theories and the other deals with the third. These propositions are of interest not only in their own right but also for interpreting empirical results.
22

Bénabou is absolutely right in his view that “... the gap between the scope of the theoretical literature and the scarcity of direct evidence makes further empirical work a high priority: signs of the adverse effects of redistribution on growth remain elusive (to put it mildly), and inferences about the role of credit constraints far too indirect. With respect to socio-political conflict, there remains room for theoretical and empirical work to move closer to one another. Existing models provide many valuable insights but few robust results about the effects of income inequality on conflict, whether conflict will be open or latent (off the equilibrium path), fully predictable or uncertain.” (Pp. 60-61).
In contrasting the experiences of Korea and the Philippines, he emphasizes that
stylized theories are not a substitute for detailed case studies. Aghion et al. (1999) express similar views. After stressing the limitations of cross-country regressions, they conclude “A thorough test of the theories we have discussed would therefore require other types of evidence, such as time-series analysis and controlled experiments that test the microfoundation of our analysis.”
Unlike Aghion et al. (1999), Bénabou (1996) and Banerjee and Duflo (2000), who use formal theory to motivate and interpret the findings of cross-country regressions, Barro (2000) starts with an informal discussion of the ways in which inequality could affect growth and of possible determinants of inequality. He then incorporates the mechanisms suggested by the informal discussion into his familiar growth-panel regressions. He does not find, as Bénabou did in his summary of 23 studies, any relation between inequality and growth or investment. Although he finds support for the Kuznets hypothesis of increasing inequality at the initial stages and decreasing inequality at the later stages of development, he also concludes that this relationship does not explain much of the variations across countries and over time.
Banerjee and Duflo (2000) point out that the results of the studies of Barro (2000) and those included in Bénabou (1996) are not necessarily comparable. As such, the diametrically opposite conclusion on the effect of inequality on growth of Barro and Bénabou is not easily resolved. They base their empirical analysis (which, unfortunately, does not take on board the problems of possible non-comparability of inequality measures in the Deninger-Square dataset), on a very simple theoretical political economy model in which distributional conflicts reduce subsequent growth. They find that “there are a set of correlations in the data that do not seem to depend on the choice of data sets and control variables. In particular we find that changes in inequality (in either direction) are associated with lower future growth rates. We also find a strong relationship between changes in inequality and past inequality. Finally, there seems to be a negative relationship between growth rates and inequality lagged one period among countries where the level of inequality was not very high to start with” (Banerjee and Duflo, 2000, p. 2). They conclude (p. 27) that “on the more fundamental question of whether inequality is bad for growth, one data has little to say”.
I conclude from the empirical studies of inequality, those discussed in this paper and others, that their findings are at best suggestive, but by no means conclusive, for several reasons. The inequality measures used are seriously deficient, both from conceptual and measurement perspectives. The complex and dynamic economic-political-social processes that determine the levels and trends in inequality are only crudely captured in the theoretical models. Theoretical foundations based on social welfare functions can be found in the
23

literature for commonly used measures. But typically they are based on assuming an unchanging population and a social welfare function that respects the Pareto principle. Thus, any change that raises the income of one or more individuals without at the same time reducing the income of anyone else is welfare enhancing. Yet, growth that satisfies the Pareto principle may increase income inequality by raising incomes of some over those of others, and may evoke political resistance. The social structure of the population in terms of families (sometimes extended families ) of varying size (and composition of its members in terms of age and sex) is virtually ignored. For example, high inequality in the distribution of current income of individuals or families could be consistent with very little inequality in their life time wealth if they happen to be at different stages of the life cycle. Put another way, the relevant inequality concept from a welfare perspective is that in life time wealth, but available empirical measure is of inequality in current incomes which is a poor proxy for wealth inequality. Of course, if credit and insurance markets are perfect, and problems of moral hazard, adverse reduction are not serious, inequalities in current consumption would be a good proxy for wealth distribution. But these assumptions do not obtain in developing countries, if they obtain anywhere at all. It is well known that the prices paid by the poor and non-poor for the same set of commodities often differ substantially and there are regional differences in prices as well. Yet the inequality data, so carefully reviewed by Deninger and Square, do not allow for this elementary fact and implicitly assume that all groups within a society face the same prices! 6. Conclusions Poverty is a multifaceted phenomenon that includes, but goes beyond, lack of adequate income. The overarching objective of development in many countries has been and continues to be the eradication of all facets of poverty. Rapid as well as well distributed growth in income has always been viewed as an instrument for achieving this objective. Although only a few developing countries have succeeded in sustaining rapid growth for a long period and in reducing poverty significantly, the evidence suggests an association between episodes of rapid growth and poverty reduction.
Policies and processes can be identified a priori, some of which would be expected to generate sustained growth and poverty reduction while others either would not lead to growth or to poverty reduction or both. The interesting and important analytical issue is why we see the former set of policies and processes only in a few countries. In analyzing this issue, it is clear that a comparative (across nations, sub-national units and time spans) framework is most appropriate. Such a framework is essential not only for arriving at analytical and policy conclusions of wide applicability but also for testing the robustness of conclusions.
There are broadly two strategies for an empirical analysis in a comparative mode. One strategy is primarily econometric, the most ubiquitous example being the use of cross-country regressions, the best of which are motivated by a well-articulated theoretical framework. The other strategy is to do a set of detailed country studies but based on a common framework, using a variety of analytical tools from theory, history and econometrics and firmly grounded on the relevant socio-political-economic institutions of the countries involved. In principle, though not always in practice, the two strategies complement each other: cross-country regressions could be used as an efficient engine to identify average patterns in the data as
24

well as the outliers from the average.15 The country studies could be especially useful in identifying the specific features of the country, period or sector or policy that led to a particular observation being an outliner. Just as results of regressions are more useful if the range of explanatory variables is wider, the results from comparative country studies would be more useful the greater is the range of variations across countries studied in institutions, policies, performances and time periods covered. Whichever strategy is adopted, in designing policies or tendering advice on the design of policies, one has to allow for factors and variables not included in the regressions or in the country analyses, but nonetheless are relevant. This inevitably leads to the use of judgment and the associated possibility of differences even among policy makers and advisers who agree on the lessons from regressions and country studies.
There have been relatively few comparative country studies involving countries differing sufficiently widely in relevant dimensions, such as the ones on trade and industrial policies, sponsored by the National Bureau of Economic Research in the seventies and the World Bank later. Recent analysts have followed the strategy of cross-country regressions. In this paper, I have pointed out the serious limitations of these regressions. Yet results from such regressions, particularly if they are consistent in direction and magnitude across regressions, should not be dismissed out of hand, but used as inputs into further theoretical and empirical analysis.
What can we conclude from the available empirical and theoretical analyses? First, there is a robust association between reduction in absolute poverty and
sustained and significant growth in aggregate income. Second, there is no similar robust association between income inequality and
aggregate growth. Third, interpreting the association (or lack thereof) causally is hazardous without
undertaking an in depth analysis of the operation of mechanisms, including government policies, and the evolution of exogenous factors (e.g. terms of trade, barriers abroad for exports of goods and services, technology) that link growth, poverty and inequality. For example, policy changes (e.g. removal of barriers to external trade and inflow of foreign capital and technology) that accelerate growth could increase income inequality, at least in the short run, when individuals and regions who are initially better placed to take advantage of the opportunities opened up by policy changes ahead of others. There is some suggestive evidence in support of this from the experience of China and India. But as long as other policies are in place or put in place that ensure that those left behind initially catch up over time, the increase in inequality will be temporary.
Fourth, keeping in mind the caveats against causal interpretations of associations, some policies and factors, seem to promote growth and reduction in poverty. These are openness to international trade and capital, conditions that are conducive to the creation of a disciplined and adequately educated labour force (in particular adequate (public and private) investment in education and health), macro-economic stability and, what might be called an environment of ‘low’ transactions costs. Very broadly defined, these include, (i) costs of transactions between individuals and businesses on the one side and governments at various
15 After surveying the literature on cross-country growth regressions, Temple (1999), is skeptical “The most interesting findings are rarely convincing, while the more reliable ones hold few surprises”. He nonetheless concludes that “cross-country research provides a useful complement to other investigative techniques, and for some questions of interest, it may even be the only way forward” (p. 151). See also Brock and Durlauf (2000).
25

levels on the other (ii) avoidable additional costs of poorly functioning economic infrastructure (power, transport, communications, roads, ports, etc.) (iii) costs of mitigating moral hazard, adverse selection and opportunism, including costs of poorly functioning legal system, for defining and enforcing property rights.
Fifth, and finally, it is facile to conclude that lessons from East Asia or India or China are necessarily applicable to others. The problem was well posed by Lucas (1993. p. 252) “But simply advising a society to follow the Korean model” is a little like advising an aspiring basketball player to “follow the Michael Jordan model”. To make use of someone else’s successful performance at any task, one needs to be able to break this performance down into its component parts so that one can see what each part contributes to the whole, which aspects of this performance are imitable and, of these, which are worth imitating. One needs, in short a theory. We are no where near articulating such a complete theory of the growth-poverty-inequality relationships. Some may even go so far as to argue that the search for such a complete theory, like the search for a unified theory in physics of all four forces (strong and weak forces, gravity and electro-magnetism), is unlikely to yield fruit in the near future.
The challenge, in the absence of a complete theory, is to go beyond the general findings and explore why ostensibly similar policies and processes generate growth as well as poverty reduction in some contexts and not others; for example, what specific features of a participatory democracy are conducive to favourable outcomes and whether these features could in principle be present even if other features of democracy are not. I am convinced that complementing cross-country econometric analysis with more in depth and nuanced country studies in a comparative mode is the best strategy to meet this challenge.
26

Tables and Figures Table 1: Development Outcomes in the 1980s and 1990s, by Growth Class (unweighted means) High
growth Moderate
or improved growth
Low growth
Poverty Percent with less 1990s 24.1 31.4 36.9 than $1 a day 1980s 31.0 32.1 30.2 Infant mortality Per thousand 1990s 29.2 54.3 60.7 1980s 41.0 66.6 71.0 Illiteracy Percent 1990s 17.2 31.2 31.4 1980s 22.9 37.6 38.8 Life expectancy Years 1990s 70.0 62.9 59.8 1980s 66.8 60.6 58.4 Carbon dioxide emission Tons per capita 1990s 2.4 2.3 1.7 1980s 1.5 2.3 1.8 Deforestation Percent per year 1990-95 0.83 1.05 1.11 1980-85 1.08 0.65 1.15 Water pollution Kilograms per day
per worker 1990s 1980s
0.16 0.18
0.21 0.21
0.21 0.21
GDP growth Percent per year
1990s 1980s
5.3 6.5
4.2 2.3
0.3 2.1
Number of countries 13 53 39
Source: World Bank (2000a), Table 1.2.
27
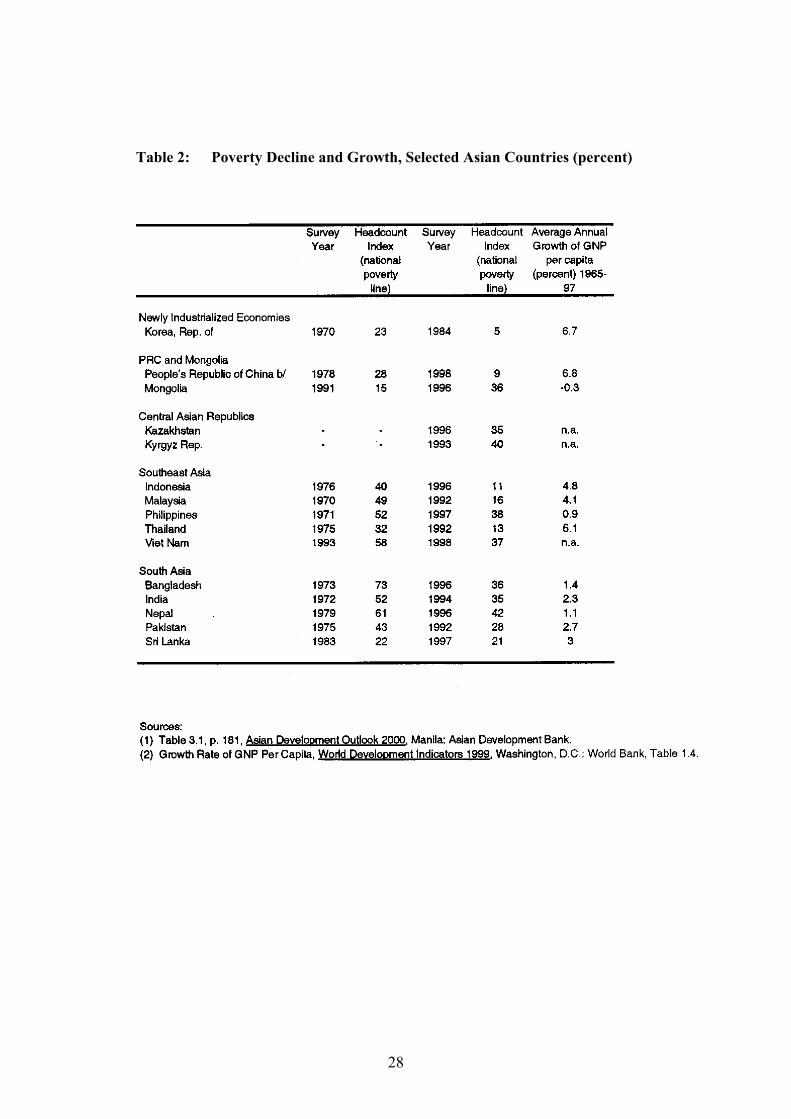
28
Table 2: Poverty Decline and Growth, Selected Asian Countries (percent)

29
Source: Atkinson and Brandolini (1999).
Table 3: Inflation and Income Inequality in OECD Countries

Table 4: Poverty in India 1951-1997 (with correction for CPIAL)
30
(cont.)
30
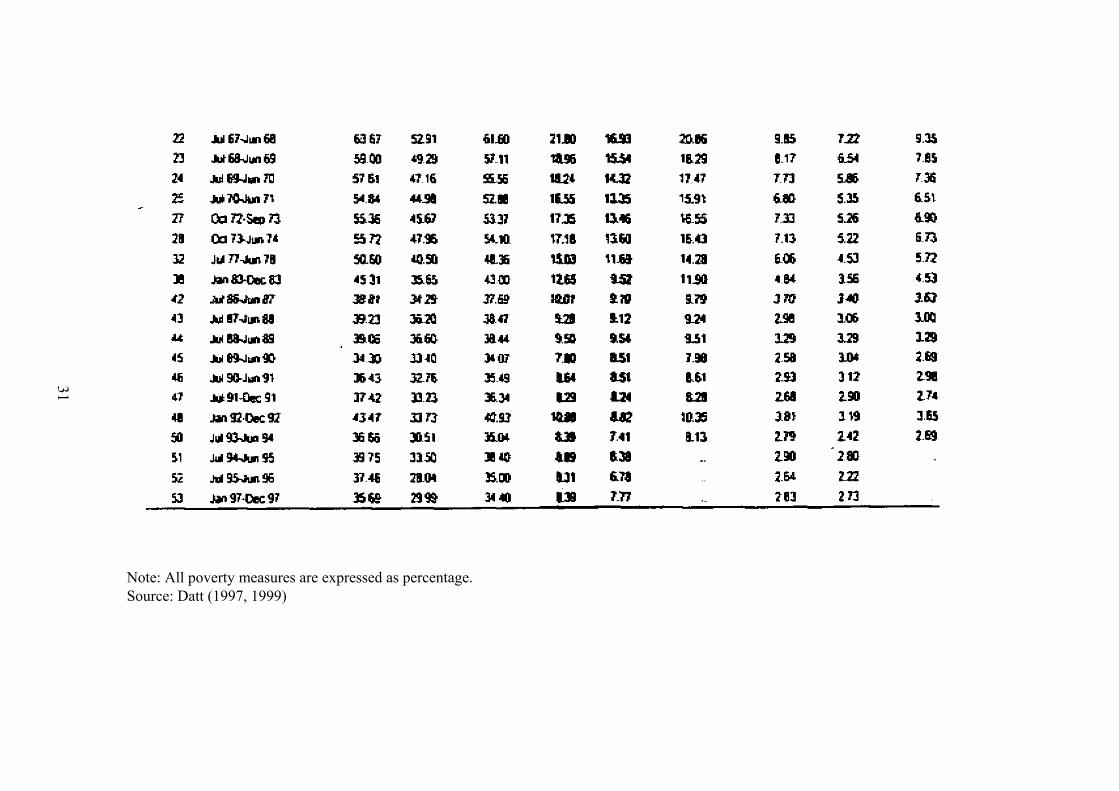
31
Note: All poverty measures are expressed as percentage. Source: Datt (1997, 1999)
31
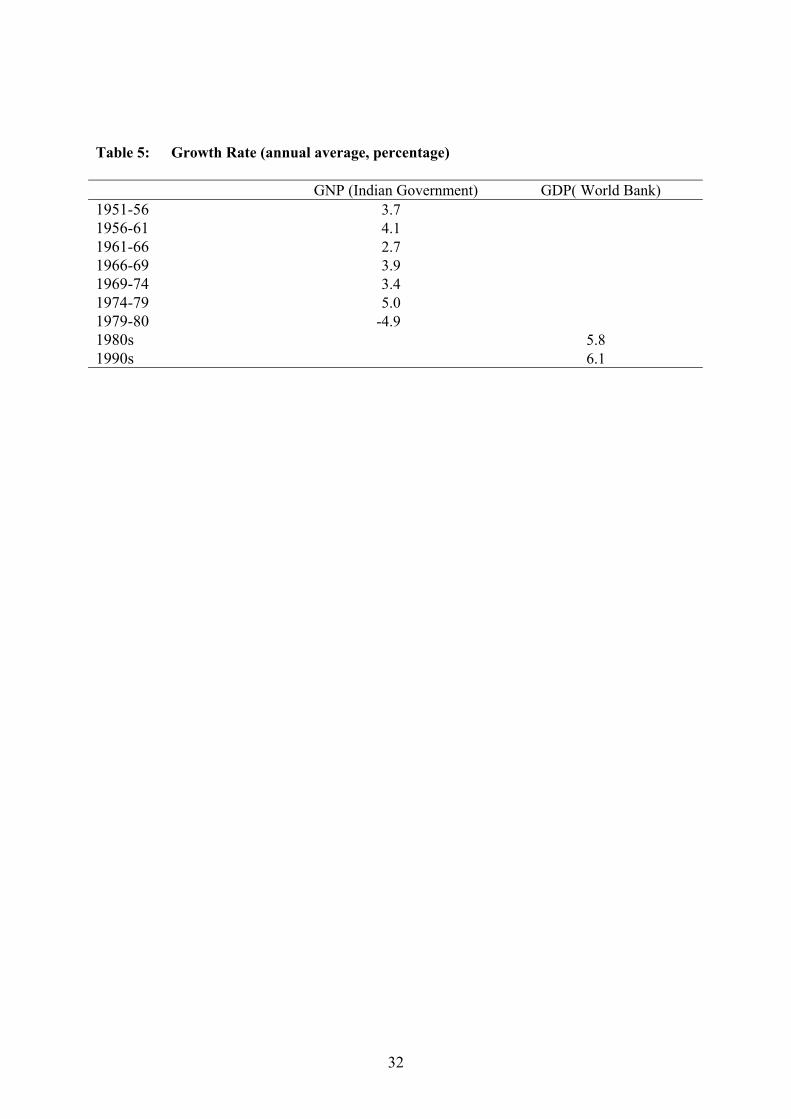
Table 5: Growth Rate (annual average, percentage) GNP (Indian Government) GDP( World Bank) 1951-56 1956-61 1961-66 1966-69 1969-74 1974-79 1979-80 1980s 1990s
3.7 4.1 2.7 3.9 3.4 5.0
-4.9
5.8 6.1
32

33
Sour
ce:
Visa
ria (2
000)
Tab
le 6
: Es
timat
ed P
erce
ntag
es o
f the
Poo
r in
Indi
a

34
Note: “NAS” poverty estimates use the NSS distribution but adjust the survey consumption levels by the ratio of NAS to NSS mean consumption.
Source: World Bank (2000b), Box1.1.
Note: NAS refers to National Statistics and NSS to the National Sample Survey. Source: World Bank (2000b), Box 1.1.

35
Note: The markers in the figure correspond to the mid-point of the NSS suyear on the horizontal axis are calendar years, so 1974.0 is January 1
Source: Based on Datt (1999).
R U N
ural Poverty
rban Poverty
ational Poverty
rvey period, and the974, for example.

36
Sour
ce:
Wor
ld B
ank
(200
0b),
Figu
re 1
.3.
Sour
ce:
Wor
ld B
ank
(200
0b),
Figu
re 1
.3.
Figu
re 4
Hea
d C
ount
Rat
es (R
ural
Indi
a)
Figu
re 4
: H
ead
Cou
nt R
ates
(Rur
al In
dia)
:

Bibliography Agarwal, S. N. (1960), Principles of Gandhian Planning, Bombay: Kitab Mahal. Aghion, Philippe, Eve Caroli, and Cecilia Garcia-Penalosa (1999), “Inequality and Economic
Growth: The Perspective of the New Growth Theories,” Journal of Economic Literature Vol. XXXVII (December), pp. 1615-1660.
Ahmed, Sultan (1994), “Improving Inter-spatial and Inter-temporal Comparability of
National Accounts,” Journal of Development Economics, Vol. 44, No. 1 (June), Amsterdam: North-Holland, pp. 53-75.
Anand, S. and R. Kanbur (1993), “The Kuznets Process and the Inequality-Development
Relationship,” Journal of Development Economics 40(1), 25-52. Atkinson, A.B. and A. Brandolini (1999), “Promise and Pitfalls in the Use of ‘Secondary’
Data Sets: Income Inequality in OECD Countries,” Oxford, Nuffield College (mimeo). Banerjee, B. N., G. D. Parikh and V. M. Tarkunde (1944), People's Plan for Economic Development of India, Bombay: Indian Federation of Labor. Banerjee, A. and E. Duflo (2000), “Inequality and Growth: What Can the Data Say?”, Cambridge, Massachusetts, Department of Economics, MIT. Barro, Robert (2000), “Inequality and Growth in a Panel of Countries,” Harvard University,
mimeo. Bénabou, Roland (1996), “Inequality and Growth,” NBER Macroeconomics Annual, Vol. 11,
MIT Press. Bhagwati, Jagdish (1968), The Theory and Practice of Commercial Policy, Frank Graham
Memorial Lecture, Princeton University (1967), International Finance Section, Princeton.
_____ (1987), (1978) Foreign Trade Regimes and Economic Development: Anatomy of
Exchange Control Regimes, Cambridge, MA Ballinger. Bhagwati, Jagdish and Bent Hansen (1973), “Should Growth Rates Be Evaluated at
International Prices?,” in J. N. Bhagwati and R. S. Eckaus, editors, Development and Planning, Cambridge, MA: MIT Press, chapter 3, pp. 53-68.
Brock, William and Steven Durlauf (2000), “Growth Economics and Reality,” Madison,
University of Wisconsin (mimeo). Collier, Paul and Jan Willem Gunning (1999), “Explaining African Economic Performance,”
Journal of Economic Literature Vol. XXXVII (March), pp. 64-111.
37

Datt, Gaurav (1999), “Has Poverty in India Declined Since the Economic Reforms?” World Bank, mimeo.
_____ (1997), “Poverty in India and Indian States: An Update,” Washington, D.C.:
International Food Policy Research Institute, mimeo. Datt, Gaurav and Martin Ravallion (1992), “Growth and Redistribution Components of
Changes in Poverty Measures: A Decomposition with Applications to Brazil and India in the 1980s,” Journal of Development Economics 38: 275-295.
_____ (1997), “Macroeconomic Crises and Poverty Monitoring: A Case Study for India,”
Review of Development Economics 1 (2): 135-152. _____ (1998a), “Why Have Some Indian States Done Better than Others at Reducing Rural
Poverty?”, Economica 65: 17-38. _____ (1998b), “Farm Productivity and Rural Poverty in India,” Journal of Development
Studies 34: 62-85. Deaton, Angus (1989), “Saving in Developing Countries: Theory and Review,” Proceedings
of the World Bank Annual Conference on Development Economics, Supplement to the World Bank Economic Review, 61-96.
Deaton, Angus and Alessandro Tarozzi (1999), “Prices and Poverty in India,” Princeton
University, mimeo. Deaton, Angus (2000a), “Counting the World's Poor: Problems and Possible Solutions,”
Princeton University, mimeo. Deaton, Angus (2000b), “Preliminary Notes on Reporting Periods in the Indian NSS, 52nd
through 54th Rounds,” Princeton, NJ Research Program in Development Studies (October).
Deninger, K. and L. Squire (1996), “New Data Set Measuring Income Inequality,” World
Bank Economic Review 10 (September), pp. 565-591. Dollar, David and Aart Kraay (2000), “Growth Is Good for the Poor,” World Bank, mimeo. _____ (2000b) “Trade, Growth and Poverty,” Washington D.C., World Bank, mimeo. Fields, Gary (1994), “Data for measuring poverty and inequality changes in the developing
countries,” Journal of Development Economics, Vol. 44, No. 1 (June), Amsterdam: North-Holland, pp. 87-102.
Government of India (1964), Report of the Committee on Distribution of Income and Levels
of Living, New Delhi, Planning Commission.
38
Government of India (1999), Economic Survey 1998-1999, New Delhi: Government of India Press.
Grossman, Gene and Elhanan Helpman (1992), Innovation and Growth in the Global
Economy, Cambridge, MA, MIT Press. Heston, Alan (1994), “A brief review of some problems in using national accounts data in
level of output comparisons and growth studies,” Journal of Development Economics, Vol. 44, No. 1 (June), Amsterdam: North-Holland, pp. 29-52.
Hicks, J. R. (1950), A Contribution to the Theory of the Trade Cycle, Oxford: Clarendon
Press. Krueger, Anne (1978), Foreign Trade Regimes and Economic Development: Liberalization
Attempts and Consequences, Cambridge, M.A., Ballinger. Lewis, Arthur (1955), The Theory of Economic Growth, Homewood, Illinois: Richard D.
Irwin, Inc. Lewis, Arthur (1976), “Development and Distribution” in A. Cairncross and M. Puri (eds.),
Employment, Income Distribution and Development Strategy, New York, Academic Press, pp.26-42.
Little, I.M.D. and Mirrlees, J.A. (1974), Project Appraisal and Planning for Developing
Countries, London: Heinemann. Little, I.M.D., Scitonsky, T. and M.F.G. Scott (1970), Industry and Trade in Some
Developing Countries, Oxford, Oxford University Press. Lucas, Robert (1993) “Making a Miracle,” Econometrica, 61, 251-272 Mahalanobis, Prasanta C. (1969), “The Asian Drama: An Indian View,” Sankhya: The Indian
Journal of Statistics, Series B, Vol. 31, Parts 3 and 4, 425-458 Mann, H. (1916), “The Economics of a Decant Village,” Indian Journal of Economics, Vol. I
(4), 409-33, reprinted as Chapter 9 in Mann, H. (edited by Daniel Thorner), The Social Framework of Agriculture, London: Frank Cass, 1968.
_____ (1948), “Village Betterment in the New India and Pakistan,” Asiatic Review XLIV,
154-770, reprinted as Chapter 22 in Mann, H. (edited by Daniel Thorner), The Social Framework of Agriculture, London: Frank Cass, 1968.
Mukherjee, M. and G. S. Chatterjee (1974), “On the Validity of NSS Estimates of
Consumption Expenditure,” in T. N. Srinivasan and P.K. Bardhan (eds.), Poverty and Income Distribution in India, Calcutta: Indian Statistical Institute, pp. 139-147.
39
Naoroji , Sir Dadabhai (1901), Poverty and Un-British Rule in India, New York: Swan and Sonnenschein.
Nehru, Jawaharlal (1946), The Discovery of India, New York: The John Day Company. Pernia, Ernesto, editor (1994), Urban Poverty in Asia: A Survey of Critical Issues, Hong
Kong: Oxford University Press. Quibria, M.G. (1994), Rural Poverty in Developing Asia, Volume 1, Manila: Asian
Development Bank. _____ (1996), Rural Poverty in Developing Asia, Volume 2, Manila: Asian Development
Bank. Ravallion, Martin and Gaurav Datt (1999), “When is Growth Pro-Poor? Evidence from the
Diverse Experiences of India's States,” World Bank, processed. _____ (1996a), “India’s Checkered History in the Fight Against Poverty: Are There Lessons
for the Future?”, Economic and Political Weekly Vol. 31 (September, Special Number), pp. 2479-2486.
_____ (1996b), “How Important to India’s Poor is the Sectoral Composition of Economic
Growth?”, World Bank Economic Review 10(1): 1-25. Rodriguez, Fransisco and Dani Rodrik (1999), “Trade Policy and Economic Growth: A
Skeptic’s Guide to Cross-National Evidence,” College Park, University of Maryland, Department of Economics, mimeo.
Sachs, Jeffrey and Andrew Warner (1995), “Economic Reform and the Process of Global
Integration.” Brookings Papers on Economic Activity, 1, 1-118. Slater, Gilbert (1918), Some South Indian Villages, Oxford University Press. Soligo, R. and Stern. J. (1965), “Tariff Protection, Import Substitution, and Investment
Efficiency,” Pakistan Development Review (summer), 249-270. Smith, Adam (1937), An Inquiry into the Nature and Causes of the Wealth of Nations. Edited
(with an Introduction, Notes, Marginal Summary and an Enlarged Index) by Edwin Cannan, New York: The Modern Library.
Srinivasan, T. N. (1995), “Long-Run Growth Theories and Empirics: Anything New?” in
Takatoshi Ito and Anne Krueger, (eds.) Growth Theories in Light of the East Asian Experience, Chicago: University of Chicago Press, pp. 37-70.
_____ (1994), “Data Base for Development Analysis: An Overview,” Journal of
Development Economics 44, pp. 3-27.
40
_____ (1992), “Undernutrition: Concepts, Measurements, and Policy Implications,” in S. R. Osmani, editor, Nutrition and Poverty, Oxford: Clarendon Press, pp. 97-120.
Srinivasan, T. N., P.N. Radhakrishnan and A. Vaidyanathan (1974), “Data on Distribution of
Consumption Expenditure in India: An Evaluation,” in T. N. Srinivasan and P.K. Bardhan (eds.), Poverty and Income Distribution in India, Calcutta: Indian Statistical Institute, pp. 148-166.
Srinivasan, T. N. and Pranab Bardhan, (eds.), (1994), Poverty and Income Distribution in
India, Calcutta: Indian Statistical Institute. Srinivasan, T.N. and Jagdish Bhagwati (2001) “Outward Orientation and Development: Are
Revisionists Right?” in Deepak Lal and Richard Shape (eds.) Trade, Development and Political Economy: Essays in Honour of Anne Krueger, London, Palgrave.
Temple, J. (1999), “The New Growth Evidence,” Journal of Economic Literature
XXXVII(1), 112-156. Thakurdas, P., J. Tata, G. Birla, A. Dalal, S. Ram, K. Lalbhai, A. Shroff, and J. Matthai
(1944), A Plan of Economic Development of India, London: Penguin Books. Visaria, Pravin (2000), “Polemics on Indian Poverty During 1994-99”, New Delhi, Institute
of Economic Growth, (mimeo). Visveswaraya, Sir M. (1934), Planned Economy for India, Bangalore: Bangalore Press. Wolfensohn, James and Joseph Stiglitz (1999), “Growth is not Enough,” Financial Times,
September 22. World Bank (2000a), “The Quality of Growth,” Washington, D.C.: World Bank. _____ (2000b), India–Policies to Reduce Poverty and Accelerate Sustainable Development,
Report No. 19471, January 31, Washington, D.C.: World Bank. _____ (1999a), World Development Indicators, Washington, D.C.: World Bank. _____ (1999b), World Development Report, Washington, D.C.: World Bank. _____ (1997), Achievements and Challenges in Reducing Poverty, Report 16483-IN,
Washington, D.C.: World Bank. _____ (1993), The East Asian Miracle: Economic Growth and Public Policy, Washington,
D.C.: World Bank
41

WORKING PAPER SERIES
Public-Private Partnerships in Health(No. S34/01)
Skill Development for Industry(No. S35/01)
High-Level Dialogue on Banking Regulation and Financial Market Development:�New Issues in the Post-Crisis Recovery Phase�(No. S36/01)
Banking Sector Reform�(No. S37/01)
Pacific Public Management Executive Program (PPMEP)Module 3: Managing Programs, Projects and People(No. S38/01)
Information and Communication Technology (ICT) Strategies for Developing Countries(No. S39/01)
HOW TO CONTACT US?
Asian Development Bank InstituteKasumigaseki Building 8F3-2-5 Kasumigaseki, Chiyoda-ku,Tokyo 100-6008 Japan
Tel: +81 (03) 3593-5500Fax: +81 (03) 3593-5571E-mail: [email protected]
Papers are also available online at the ADBI Internet site:http://www.adbi.org/publications/publicat.htm
EXECUTIVE SUMMARY SERIES
The Basic Characteristics of Skills and Organizational Capabilities in the Indian Software IndustryFebruary 2001 Code: 13-2001 by Ted Tschang
Do Foreign Companies Conduct R&D in Developing Countries?A New Approach to Analyzing the Level of R&D, with an Analysis of SingaporeMarch 2001 Code: 14-2001 by Alice H. Amsden, Ted Tschang and Akira Goto
Designing a Financial Market Structure in Post-Crisis Asia �-How to Develop Corporate Bond Markets-March 27, 2001 Code: 15-2001 by Dr. Masaru Yoshitomi and Dr. Sayuri Shirai
Population Pressure, Land Tenure, and Natural Resource ManagementMarch 2001 Code: 16-2001 by Keijiro Otsuka
Growth and Poverty Alleviation: Lessons from Development ExperienceApril 2001 Code: 17-2001 by T. N. Srinivasan
Diverse Paths toward “the Right Institutions:” Law, the State, and Economic Reform in East AsiaApril 2001 Code: 18-2001 by Meredith Woo-Cumings
ADB INSTITUTE WORKING PAPER 17