![LONG TERM PRECESSION MODELservo.aob.rs/eeditions/CDS/Srpsko bugarska konferencija/8... · 2013-08-30 · LONG TERM PRECESSION MODEL X ["]-100000 -50000 0 50000 100000 Y ["]-200000-150000-100000-50000](https://static.fdocuments.in/doc/165x107/5f0451417e708231d40d616e/long-term-precession-bugarska-konferencija8-2013-08-30-long-term-precession.jpg)
A 50000 solar_mass_black_hole_in_the_nucleous_of_rgg_118
6
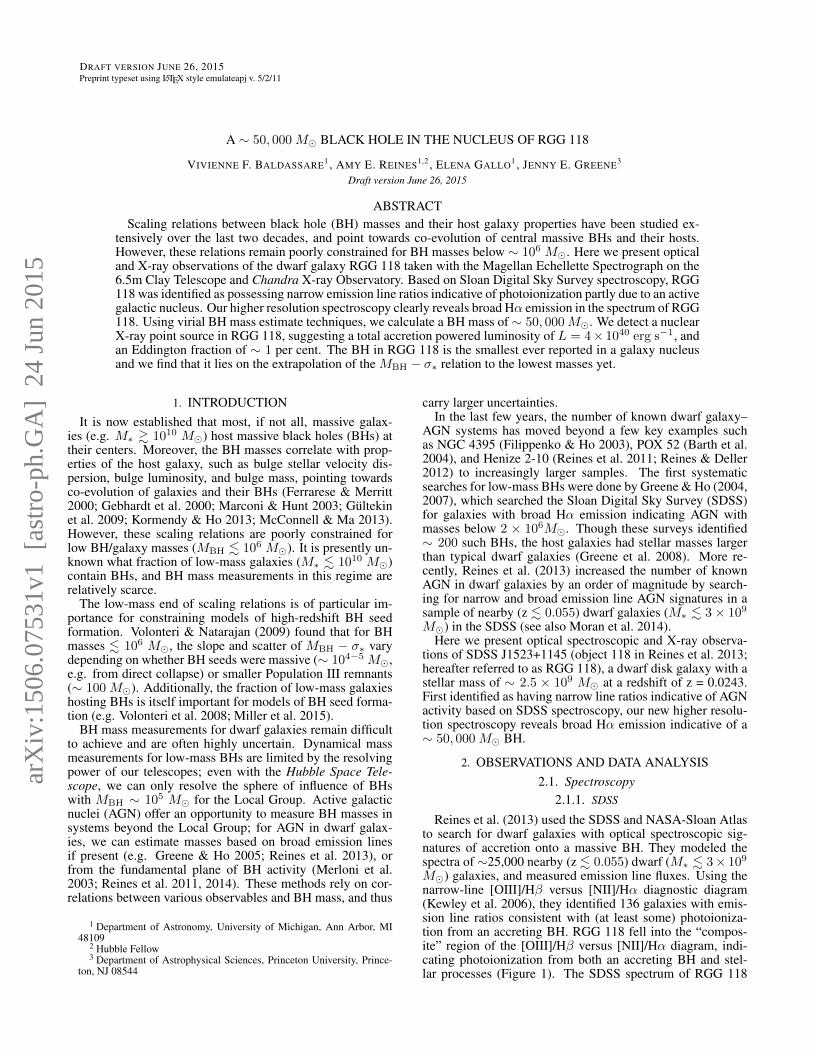
DRAFT VERSION J UNE 26, 2015 Preprint typeset using L A T E X style emulateapj v. 5/2/11 A ∼ 50, 000 M BLACK HOLE IN THE NUCLEUS OF RGG 118 VIVIENNE F. BALDASSARE 1 ,AMY E. REINES 1,2 ,ELENA GALLO 1 ,J ENNY E. GREENE 3 Draft version June 26, 2015 ABSTRACT Scaling relations between black hole (BH) masses and their host galaxy properties have been studied ex- tensively over the last two decades, and point towards co-evolution of central massive BHs and their hosts. However, these relations remain poorly constrained for BH masses below ∼ 10 6 M . Here we present optical and X-ray observations of the dwarf galaxy RGG 118 taken with the Magellan Echellette Spectrograph on the 6.5m Clay Telescope and Chandra X-ray Observatory. Based on Sloan Digital Sky Survey spectroscopy, RGG 118 was identified as possessing narrow emission line ratios indicative of photoionization partly due to an active galactic nucleus. Our higher resolution spectroscopy clearly reveals broad Hα emission in the spectrum of RGG 118. Using virial BH mass estimate techniques, we calculate a BH mass of ∼ 50, 000 M . We detect a nuclear X-ray point source in RGG 118, suggesting a total accretion powered luminosity of L =4 × 10 40 erg s -1 , and an Eddington fraction of ∼ 1 per cent. The BH in RGG 118 is the smallest ever reported in a galaxy nucleus and we find that it lies on the extrapolation of the M BH - σ * relation to the lowest masses yet. 1. INTRODUCTION It is now established that most, if not all, massive galax- ies (e.g. M * & 10 10 M ) host massive black holes (BHs) at their centers. Moreover, the BH masses correlate with prop- erties of the host galaxy, such as bulge stellar velocity dis- persion, bulge luminosity, and bulge mass, pointing towards co-evolution of galaxies and their BHs (Ferrarese & Merritt 2000; Gebhardt et al. 2000; Marconi & Hunt 2003; G¨ ultekin et al. 2009; Kormendy & Ho 2013; McConnell & Ma 2013). However, these scaling relations are poorly constrained for low BH/galaxy masses (M BH . 10 6 M ). It is presently un- known what fraction of low-mass galaxies (M * . 10 10 M ) contain BHs, and BH mass measurements in this regime are relatively scarce. The low-mass end of scaling relations is of particular im- portance for constraining models of high-redshift BH seed formation. Volonteri & Natarajan (2009) found that for BH masses . 10 6 M , the slope and scatter of M BH - σ * vary depending on whether BH seeds were massive (∼ 10 4-5 M , e.g. from direct collapse) or smaller Population III remnants (∼ 100 M ). Additionally, the fraction of low-mass galaxies hosting BHs is itself important for models of BH seed forma- tion (e.g. Volonteri et al. 2008; Miller et al. 2015). BH mass measurements for dwarf galaxies remain difficult to achieve and are often highly uncertain. Dynamical mass measurements for low-mass BHs are limited by the resolving power of our telescopes; even with the Hubble Space Tele- scope, we can only resolve the sphere of influence of BHs with M BH ∼ 10 5 M for the Local Group. Active galactic nuclei (AGN) offer an opportunity to measure BH masses in systems beyond the Local Group; for AGN in dwarf galax- ies, we can estimate masses based on broad emission lines if present (e.g. Greene & Ho 2005; Reines et al. 2013), or from the fundamental plane of BH activity (Merloni et al. 2003; Reines et al. 2011, 2014). These methods rely on cor- relations between various observables and BH mass, and thus 1 Department of Astronomy, University of Michigan, Ann Arbor, MI 48109 2 Hubble Fellow 3 Department of Astrophysical Sciences, Princeton University, Prince- ton, NJ 08544 carry larger uncertainties. In the last few years, the number of known dwarf galaxy– AGN systems has moved beyond a few key examples such as NGC 4395 (Filippenko & Ho 2003), POX 52 (Barth et al. 2004), and Henize 2-10 (Reines et al. 2011; Reines & Deller 2012) to increasingly larger samples. The first systematic searches for low-mass BHs were done by Greene & Ho (2004, 2007), which searched the Sloan Digital Sky Survey (SDSS) for galaxies with broad Hα emission indicating AGN with masses below 2 × 10 6 M . Though these surveys identified ∼ 200 such BHs, the host galaxies had stellar masses larger than typical dwarf galaxies (Greene et al. 2008). More re- cently, Reines et al. (2013) increased the number of known AGN in dwarf galaxies by an order of magnitude by search- ing for narrow and broad emission line AGN signatures in a sample of nearby (z . 0.055) dwarf galaxies (M * . 3 × 10 9 M ) in the SDSS (see also Moran et al. 2014). Here we present optical spectroscopic and X-ray observa- tions of SDSS J1523+1145 (object 118 in Reines et al. 2013; hereafter referred to as RGG 118), a dwarf disk galaxy with a stellar mass of ∼ 2.5 × 10 9 M at a redshift of z = 0.0243. First identified as having narrow line ratios indicative of AGN activity based on SDSS spectroscopy, our new higher resolu- tion spectroscopy reveals broad Hα emission indicative of a ∼ 50, 000 M BH. 2. OBSERVATIONS AND DATA ANALYSIS 2.1. Spectroscopy 2.1.1. SDSS Reines et al. (2013) used the SDSS and NASA-Sloan Atlas to search for dwarf galaxies with optical spectroscopic sig- natures of accretion onto a massive BH. They modeled the spectra of ∼25,000 nearby (z . 0.055) dwarf (M * . 3 × 10 9 M ) galaxies, and measured emission line fluxes. Using the narrow-line [OIII]/Hβ versus [NII]/Hα diagnostic diagram (Kewley et al. 2006), they identified 136 galaxies with emis- sion line ratios consistent with (at least some) photoioniza- tion from an accreting BH. RGG 118 fell into the “compos- ite” region of the [OIII]/Hβ versus [NII]/Hα diagram, indi- cating photoionization from both an accreting BH and stel- lar processes (Figure 1). The SDSS spectrum of RGG 118 arXiv:1506.07531v1 [astro-ph.GA] 24 Jun 2015
-
Upload
sergio-sacani -
Category
Science
-
view
256 -
download
1
Transcript of A 50000 solar_mass_black_hole_in_the_nucleous_of_rgg_118
DRAFT VERSION JUNE 26, 2015Preprint typeset using LATEX style emulateapj v. 5/2/11
A ∼ 50, 000 M� BLACK HOLE IN THE NUCLEUS OF RGG 118
VIVIENNE F. BALDASSARE1 , AMY E. REINES1,2 , ELENA GALLO1 , JENNY E. GREENE3
Draft version June 26, 2015
ABSTRACTScaling relations between black hole (BH) masses and their host galaxy properties have been studied ex-
tensively over the last two decades, and point towards co-evolution of central massive BHs and their hosts.However, these relations remain poorly constrained for BH masses below ∼ 106 M�. Here we present opticaland X-ray observations of the dwarf galaxy RGG 118 taken with the Magellan Echellette Spectrograph on the6.5m Clay Telescope and Chandra X-ray Observatory. Based on Sloan Digital Sky Survey spectroscopy, RGG118 was identified as possessing narrow emission line ratios indicative of photoionization partly due to an activegalactic nucleus. Our higher resolution spectroscopy clearly reveals broad Hα emission in the spectrum of RGG118. Using virial BH mass estimate techniques, we calculate a BH mass of∼ 50, 000M�. We detect a nuclearX-ray point source in RGG 118, suggesting a total accretion powered luminosity of L = 4× 1040 erg s−1, andan Eddington fraction of ∼ 1 per cent. The BH in RGG 118 is the smallest ever reported in a galaxy nucleusand we find that it lies on the extrapolation of the MBH − σ∗ relation to the lowest masses yet.
1. INTRODUCTIONIt is now established that most, if not all, massive galax-
ies (e.g. M∗ & 1010 M�) host massive black holes (BHs) attheir centers. Moreover, the BH masses correlate with prop-erties of the host galaxy, such as bulge stellar velocity dis-persion, bulge luminosity, and bulge mass, pointing towardsco-evolution of galaxies and their BHs (Ferrarese & Merritt2000; Gebhardt et al. 2000; Marconi & Hunt 2003; Gultekinet al. 2009; Kormendy & Ho 2013; McConnell & Ma 2013).However, these scaling relations are poorly constrained forlow BH/galaxy masses (MBH . 106 M�). It is presently un-known what fraction of low-mass galaxies (M∗ . 1010 M�)contain BHs, and BH mass measurements in this regime arerelatively scarce.
The low-mass end of scaling relations is of particular im-portance for constraining models of high-redshift BH seedformation. Volonteri & Natarajan (2009) found that for BHmasses . 106 M�, the slope and scatter of MBH − σ∗ varydepending on whether BH seeds were massive (∼ 104−5 M�,e.g. from direct collapse) or smaller Population III remnants(∼ 100 M�). Additionally, the fraction of low-mass galaxieshosting BHs is itself important for models of BH seed forma-tion (e.g. Volonteri et al. 2008; Miller et al. 2015).
BH mass measurements for dwarf galaxies remain difficultto achieve and are often highly uncertain. Dynamical massmeasurements for low-mass BHs are limited by the resolvingpower of our telescopes; even with the Hubble Space Tele-scope, we can only resolve the sphere of influence of BHswith MBH ∼ 105 M� for the Local Group. Active galacticnuclei (AGN) offer an opportunity to measure BH masses insystems beyond the Local Group; for AGN in dwarf galax-ies, we can estimate masses based on broad emission linesif present (e.g. Greene & Ho 2005; Reines et al. 2013), orfrom the fundamental plane of BH activity (Merloni et al.2003; Reines et al. 2011, 2014). These methods rely on cor-relations between various observables and BH mass, and thus
1 Department of Astronomy, University of Michigan, Ann Arbor, MI48109
2 Hubble Fellow3 Department of Astrophysical Sciences, Princeton University, Prince-
ton, NJ 08544
carry larger uncertainties.In the last few years, the number of known dwarf galaxy–
AGN systems has moved beyond a few key examples suchas NGC 4395 (Filippenko & Ho 2003), POX 52 (Barth et al.2004), and Henize 2-10 (Reines et al. 2011; Reines & Deller2012) to increasingly larger samples. The first systematicsearches for low-mass BHs were done by Greene & Ho (2004,2007), which searched the Sloan Digital Sky Survey (SDSS)for galaxies with broad Hα emission indicating AGN withmasses below 2 × 10⁶M�. Though these surveys identified∼ 200 such BHs, the host galaxies had stellar masses largerthan typical dwarf galaxies (Greene et al. 2008). More re-cently, Reines et al. (2013) increased the number of knownAGN in dwarf galaxies by an order of magnitude by search-ing for narrow and broad emission line AGN signatures in asample of nearby (z . 0.055) dwarf galaxies (M∗ . 3× 10⁹
M�) in the SDSS (see also Moran et al. 2014).Here we present optical spectroscopic and X-ray observa-
tions of SDSS J1523+1145 (object 118 in Reines et al. 2013;hereafter referred to as RGG 118), a dwarf disk galaxy with astellar mass of ∼ 2.5 × 10⁹ M� at a redshift of z = 0.0243.First identified as having narrow line ratios indicative of AGNactivity based on SDSS spectroscopy, our new higher resolu-tion spectroscopy reveals broad Hα emission indicative of a∼ 50, 000 M� BH.
2. OBSERVATIONS AND DATA ANALYSIS2.1. Spectroscopy
2.1.1. SDSS
Reines et al. (2013) used the SDSS and NASA-Sloan Atlasto search for dwarf galaxies with optical spectroscopic sig-natures of accretion onto a massive BH. They modeled thespectra of ∼25,000 nearby (z . 0.055) dwarf (M∗ . 3× 10⁹
M�) galaxies, and measured emission line fluxes. Using thenarrow-line [OIII]/Hβ versus [NII]/Hα diagnostic diagram(Kewley et al. 2006), they identified 136 galaxies with emis-sion line ratios consistent with (at least some) photoioniza-tion from an accreting BH. RGG 118 fell into the “compos-ite” region of the [OIII]/Hβ versus [NII]/Hα diagram, indi-cating photoionization from both an accreting BH and stel-lar processes (Figure 1). The SDSS spectrum of RGG 118
arX
iv:1
506.
0753
1v1
[as
tro-
ph.G
A]
24
Jun
2015
2
-1.0 -0.5 0.0 0.5-0.6
-0.4
-0.2
0.0
0.2
0.4
0.6
0.8
1.0
HII
AGN
Composite
-0.8 -0.4 0.0 0.4
HII
Seyfert
LINER
-2.0 -1.5 -1.0 -0.5
HII
Seyfert
LINER
a
log([O
III]/Hβ)
log([NII]/Hα)
b
log([SII]/Hα) log([OI]/Hα)
c
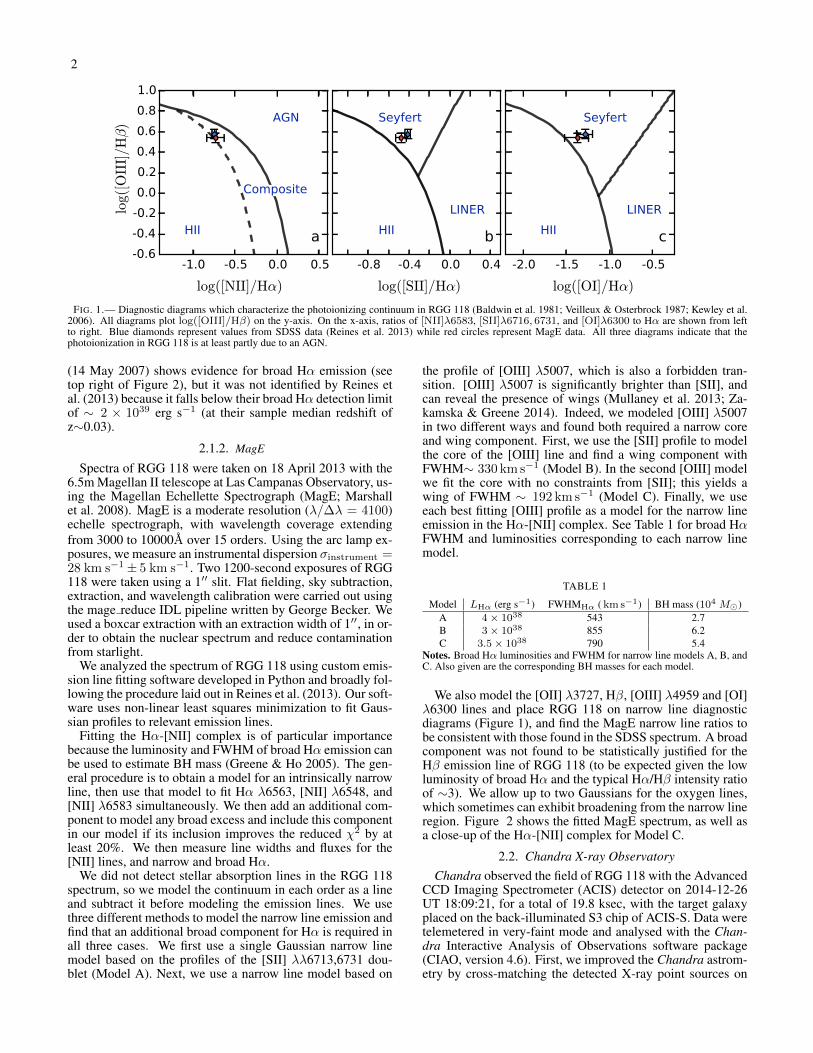
FIG. 1.— Diagnostic diagrams which characterize the photoionizing continuum in RGG 118 (Baldwin et al. 1981; Veilleux & Osterbrock 1987; Kewley et al.2006). All diagrams plot log([OIII]/Hβ) on the y-axis. On the x-axis, ratios of [NII]λ6583, [SII]λ6716, 6731, and [OI]λ6300 to Hα are shown from leftto right. Blue diamonds represent values from SDSS data (Reines et al. 2013) while red circles represent MagE data. All three diagrams indicate that thephotoionization in RGG 118 is at least partly due to an AGN.
(14 May 2007) shows evidence for broad Hα emission (seetop right of Figure 2), but it was not identified by Reines etal. (2013) because it falls below their broad Hα detection limitof ∼ 2 × 1039 erg s−1 (at their sample median redshift ofz∼0.03).
2.1.2. MagE
Spectra of RGG 118 were taken on 18 April 2013 with the6.5m Magellan II telescope at Las Campanas Observatory, us-ing the Magellan Echellette Spectrograph (MagE; Marshallet al. 2008). MagE is a moderate resolution (λ/∆λ = 4100)echelle spectrograph, with wavelength coverage extendingfrom 3000 to 10000A over 15 orders. Using the arc lamp ex-posures, we measure an instrumental dispersion σinstrument =28 km s−1± 5 km s−1. Two 1200-second exposures of RGG118 were taken using a 1′′ slit. Flat fielding, sky subtraction,extraction, and wavelength calibration were carried out usingthe mage reduce IDL pipeline written by George Becker. Weused a boxcar extraction with an extraction width of 1′′, in or-der to obtain the nuclear spectrum and reduce contaminationfrom starlight.
We analyzed the spectrum of RGG 118 using custom emis-sion line fitting software developed in Python and broadly fol-lowing the procedure laid out in Reines et al. (2013). Our soft-ware uses non-linear least squares minimization to fit Gaus-sian profiles to relevant emission lines.
Fitting the Hα-[NII] complex is of particular importancebecause the luminosity and FWHM of broad Hα emission canbe used to estimate BH mass (Greene & Ho 2005). The gen-eral procedure is to obtain a model for an intrinsically narrowline, then use that model to fit Hα λ6563, [NII] λ6548, and[NII] λ6583 simultaneously. We then add an additional com-ponent to model any broad excess and include this componentin our model if its inclusion improves the reduced χ2 by atleast 20%. We then measure line widths and fluxes for the[NII] lines, and narrow and broad Hα.
We did not detect stellar absorption lines in the RGG 118spectrum, so we model the continuum in each order as a lineand subtract it before modeling the emission lines. We usethree different methods to model the narrow line emission andfind that an additional broad component for Hα is required inall three cases. We first use a single Gaussian narrow linemodel based on the profiles of the [SII] λλ6713,6731 dou-blet (Model A). Next, we use a narrow line model based on
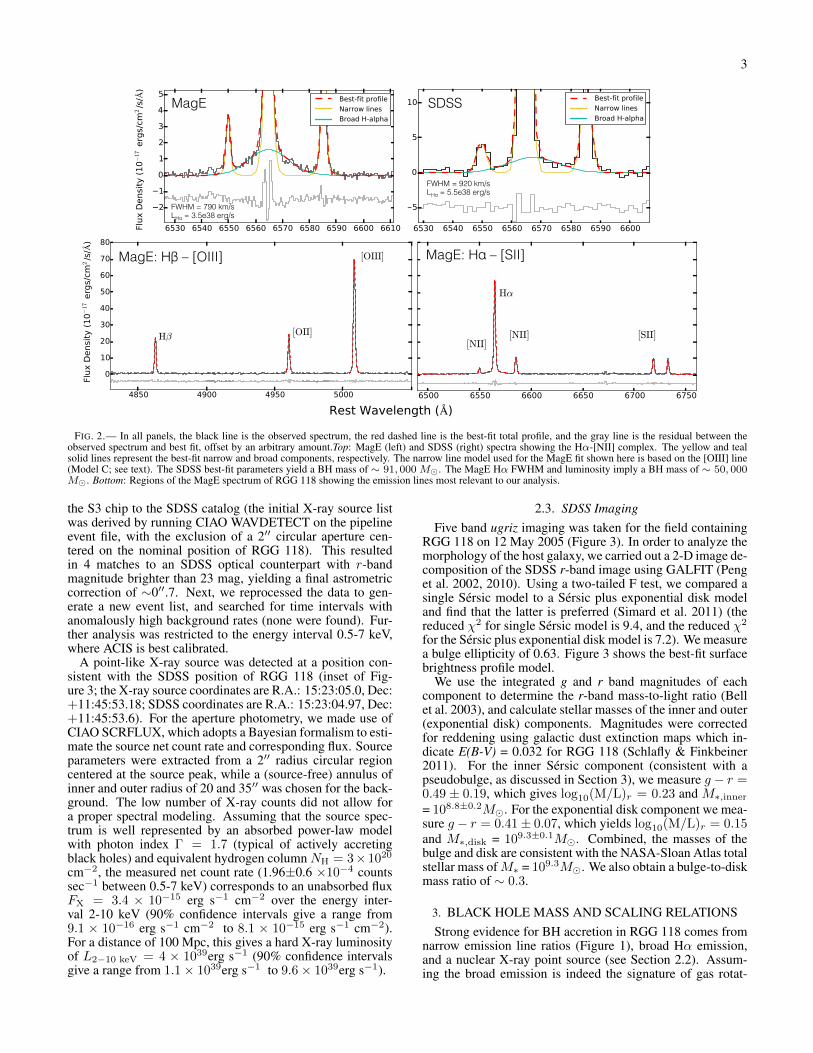
the profile of [OIII] λ5007, which is also a forbidden tran-sition. [OIII] λ5007 is significantly brighter than [SII], andcan reveal the presence of wings (Mullaney et al. 2013; Za-kamska & Greene 2014). Indeed, we modeled [OIII] λ5007in two different ways and found both required a narrow coreand wing component. First, we use the [SII] profile to modelthe core of the [OIII] line and find a wing component withFWHM∼ 330 km s−1 (Model B). In the second [OIII] modelwe fit the core with no constraints from [SII]; this yields awing of FWHM ∼ 192 km s−1 (Model C). Finally, we useeach best fitting [OIII] profile as a model for the narrow lineemission in the Hα-[NII] complex. See Table 1 for broad HαFWHM and luminosities corresponding to each narrow linemodel.
TABLE 1
Model LHα (erg s−1) FWHMHα ( km s−1) BH mass (104 M�)A 4× 1038 543 2.7B 3× 1038 855 6.2C 3.5× 1038 790 5.4
Notes. Broad Hα luminosities and FWHM for narrow line models A, B, andC. Also given are the corresponding BH masses for each model.
We also model the [OII] λ3727, Hβ, [OIII] λ4959 and [OI]λ6300 lines and place RGG 118 on narrow line diagnosticdiagrams (Figure 1), and find the MagE narrow line ratios tobe consistent with those found in the SDSS spectrum. A broadcomponent was not found to be statistically justified for theHβ emission line of RGG 118 (to be expected given the lowluminosity of broad Hα and the typical Hα/Hβ intensity ratioof ∼3). We allow up to two Gaussians for the oxygen lines,which sometimes can exhibit broadening from the narrow lineregion. Figure 2 shows the fitted MagE spectrum, as well asa close-up of the Hα-[NII] complex for Model C.
2.2. Chandra X-ray ObservatoryChandra observed the field of RGG 118 with the Advanced
CCD Imaging Spectrometer (ACIS) detector on 2014-12-26UT 18:09:21, for a total of 19.8 ksec, with the target galaxyplaced on the back-illuminated S3 chip of ACIS-S. Data weretelemetered in very-faint mode and analysed with the Chan-dra Interactive Analysis of Observations software package(CIAO, version 4.6). First, we improved the Chandra astrom-etry by cross-matching the detected X-ray point sources on
3
MagE! SDSS!
FWHM = 920 km/s!LHα = 5.5e38 erg/s !
FWHM = 790 km/s!LHα = 3.5e38 erg/s !
MagE: Hβ – [OIII]! MagE: Hα – [SII]!
FIG. 2.— In all panels, the black line is the observed spectrum, the red dashed line is the best-fit total profile, and the gray line is the residual between theobserved spectrum and best fit, offset by an arbitrary amount.Top: MagE (left) and SDSS (right) spectra showing the Hα-[NII] complex. The yellow and tealsolid lines represent the best-fit narrow and broad components, respectively. The narrow line model used for the MagE fit shown here is based on the [OIII] line(Model C; see text). The SDSS best-fit parameters yield a BH mass of ∼ 91, 000M�. The MagE Hα FWHM and luminosity imply a BH mass of ∼ 50, 000M�. Bottom: Regions of the MagE spectrum of RGG 118 showing the emission lines most relevant to our analysis.
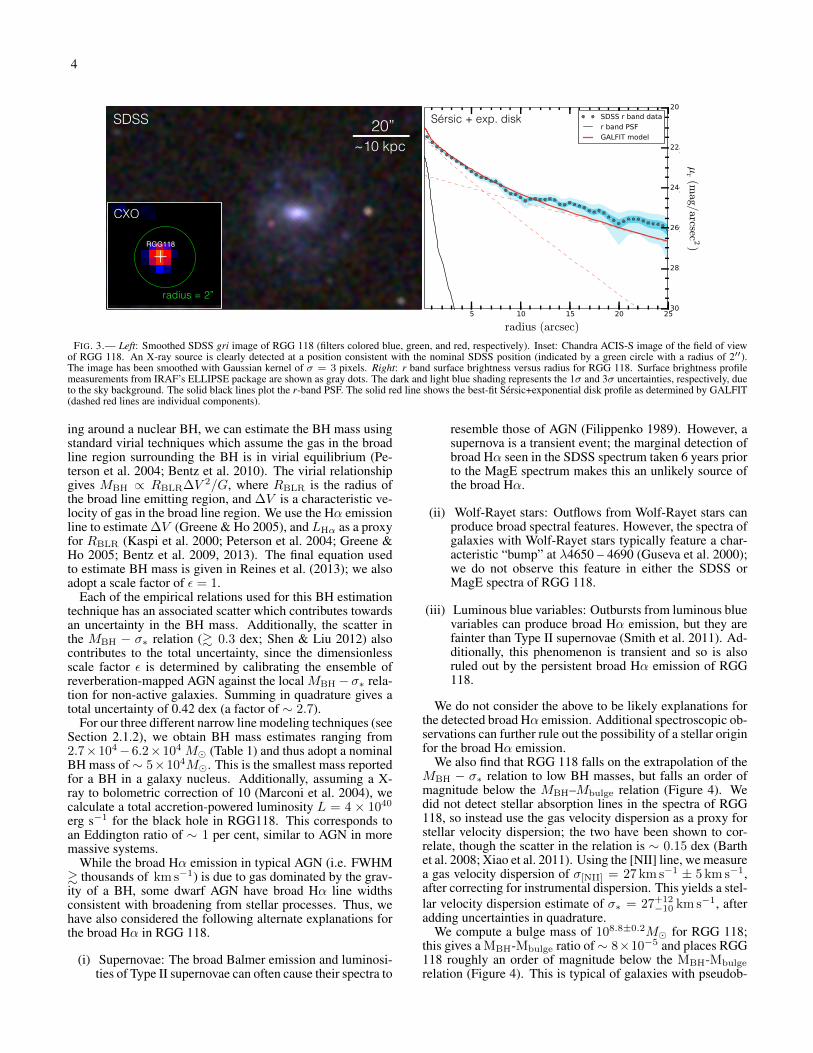
the S3 chip to the SDSS catalog (the initial X-ray source listwas derived by running CIAO WAVDETECT on the pipelineevent file, with the exclusion of a 2′′ circular aperture cen-tered on the nominal position of RGG 118). This resultedin 4 matches to an SDSS optical counterpart with r-bandmagnitude brighter than 23 mag, yielding a final astrometriccorrection of ∼0′′.7. Next, we reprocessed the data to gen-erate a new event list, and searched for time intervals withanomalously high background rates (none were found). Fur-ther analysis was restricted to the energy interval 0.5-7 keV,where ACIS is best calibrated.
A point-like X-ray source was detected at a position con-sistent with the SDSS position of RGG 118 (inset of Fig-ure 3; the X-ray source coordinates are R.A.: 15:23:05.0, Dec:+11:45:53.18; SDSS coordinates are R.A.: 15:23:04.97, Dec:+11:45:53.6). For the aperture photometry, we made use ofCIAO SCRFLUX, which adopts a Bayesian formalism to esti-mate the source net count rate and corresponding flux. Sourceparameters were extracted from a 2′′ radius circular regioncentered at the source peak, while a (source-free) annulus ofinner and outer radius of 20 and 35′′ was chosen for the back-ground. The low number of X-ray counts did not allow fora proper spectral modeling. Assuming that the source spec-trum is well represented by an absorbed power-law modelwith photon index Γ = 1.7 (typical of actively accretingblack holes) and equivalent hydrogen column NH = 3×10²⁰
cm−2, the measured net count rate (1.96±0.6 ×10⁻⁴ countssec−1 between 0.5-7 keV) corresponds to an unabsorbed fluxFX = 3.4 × 10⁻¹⁵ erg s−1 cm−2 over the energy inter-val 2-10 keV (90% confidence intervals give a range from9.1 × 10−16 erg s−1 cm−2 to 8.1 × 10⁻¹⁵ erg s−1 cm−2).For a distance of 100 Mpc, this gives a hard X-ray luminosityof L2−10 keV = 4 × 1039erg s−1 (90% confidence intervalsgive a range from 1.1× 1039erg s−1 to 9.6× 1039erg s−1).
2.3. SDSS ImagingFive band ugriz imaging was taken for the field containing
RGG 118 on 12 May 2005 (Figure 3). In order to analyze themorphology of the host galaxy, we carried out a 2-D image de-composition of the SDSS r-band image using GALFIT (Penget al. 2002, 2010). Using a two-tailed F test, we compared asingle Sersic model to a Sersic plus exponential disk modeland find that the latter is preferred (Simard et al. 2011) (thereduced χ2 for single Sersic model is 9.4, and the reduced χ2
for the Sersic plus exponential disk model is 7.2). We measurea bulge ellipticity of 0.63. Figure 3 shows the best-fit surfacebrightness profile model.
We use the integrated g and r band magnitudes of eachcomponent to determine the r-band mass-to-light ratio (Bellet al. 2003), and calculate stellar masses of the inner and outer(exponential disk) components. Magnitudes were correctedfor reddening using galactic dust extinction maps which in-dicate E(B-V) = 0.032 for RGG 118 (Schlafly & Finkbeiner2011). For the inner Sersic component (consistent with apseudobulge, as discussed in Section 3), we measure g − r =0.49 ± 0.19, which gives log10(M/L)r = 0.23 and M∗,inner= 108.8±0.2M�. For the exponential disk component we mea-sure g − r = 0.41± 0.07, which yields log10(M/L)r = 0.15and M∗,disk = 109.3±0.1M�. Combined, the masses of thebulge and disk are consistent with the NASA-Sloan Atlas totalstellar mass ofM∗ = 109.3M�. We also obtain a bulge-to-diskmass ratio of ∼ 0.3.
3. BLACK HOLE MASS AND SCALING RELATIONSStrong evidence for BH accretion in RGG 118 comes from
narrow emission line ratios (Figure 1), broad Hα emission,and a nuclear X-ray point source (see Section 2.2). Assum-ing the broad emission is indeed the signature of gas rotat-
4
20”! ~10 kpc!
RGG118
SDSS!
CXO!
radius = 2”!
Sérsic + exp. disk!
FIG. 3.— Left: Smoothed SDSS gri image of RGG 118 (filters colored blue, green, and red, respectively). Inset: Chandra ACIS-S image of the field of viewof RGG 118. An X-ray source is clearly detected at a position consistent with the nominal SDSS position (indicated by a green circle with a radius of 2′′).The image has been smoothed with Gaussian kernel of σ = 3 pixels. Right: r band surface brightness versus radius for RGG 118. Surface brightness profilemeasurements from IRAF’s ELLIPSE package are shown as gray dots. The dark and light blue shading represents the 1σ and 3σ uncertainties, respectively, dueto the sky background. The solid black lines plot the r-band PSF. The solid red line shows the best-fit Sersic+exponential disk profile as determined by GALFIT(dashed red lines are individual components).
ing around a nuclear BH, we can estimate the BH mass usingstandard virial techniques which assume the gas in the broadline region surrounding the BH is in virial equilibrium (Pe-terson et al. 2004; Bentz et al. 2010). The virial relationshipgives MBH ∝ RBLR∆V 2/G, where RBLR is the radius ofthe broad line emitting region, and ∆V is a characteristic ve-locity of gas in the broad line region. We use the Hα emissionline to estimate ∆V (Greene & Ho 2005), and LHα as a proxyfor RBLR (Kaspi et al. 2000; Peterson et al. 2004; Greene &Ho 2005; Bentz et al. 2009, 2013). The final equation usedto estimate BH mass is given in Reines et al. (2013); we alsoadopt a scale factor of ε = 1.
Each of the empirical relations used for this BH estimationtechnique has an associated scatter which contributes towardsan uncertainty in the BH mass. Additionally, the scatter inthe MBH − σ∗ relation (& 0.3 dex; Shen & Liu 2012) alsocontributes to the total uncertainty, since the dimensionlessscale factor ε is determined by calibrating the ensemble ofreverberation-mapped AGN against the local MBH − σ∗ rela-tion for non-active galaxies. Summing in quadrature gives atotal uncertainty of 0.42 dex (a factor of ∼ 2.7).
For our three different narrow line modeling techniques (seeSection 2.1.2), we obtain BH mass estimates ranging from2.7×104−6.2×10⁴ M� (Table 1) and thus adopt a nominalBH mass of∼ 5×10⁴M�. This is the smallest mass reportedfor a BH in a galaxy nucleus. Additionally, assuming a X-ray to bolometric correction of 10 (Marconi et al. 2004), wecalculate a total accretion-powered luminosity L = 4 × 1040
erg s−1 for the black hole in RGG118. This corresponds toan Eddington ratio of ∼ 1 per cent, similar to AGN in moremassive systems.
While the broad Hα emission in typical AGN (i.e. FWHM& thousands of km s−1) is due to gas dominated by the grav-ity of a BH, some dwarf AGN have broad Hα line widthsconsistent with broadening from stellar processes. Thus, wehave also considered the following alternate explanations forthe broad Hα in RGG 118.
(i) Supernovae: The broad Balmer emission and luminosi-ties of Type II supernovae can often cause their spectra to
resemble those of AGN (Filippenko 1989). However, asupernova is a transient event; the marginal detection ofbroad Hα seen in the SDSS spectrum taken 6 years priorto the MagE spectrum makes this an unlikely source ofthe broad Hα.
(ii) Wolf-Rayet stars: Outflows from Wolf-Rayet stars canproduce broad spectral features. However, the spectra ofgalaxies with Wolf-Rayet stars typically feature a char-acteristic “bump” at λ4650 – 4690 (Guseva et al. 2000);we do not observe this feature in either the SDSS orMagE spectra of RGG 118.
(iii) Luminous blue variables: Outbursts from luminous bluevariables can produce broad Hα emission, but they arefainter than Type II supernovae (Smith et al. 2011). Ad-ditionally, this phenomenon is transient and so is alsoruled out by the persistent broad Hα emission of RGG118.
We do not consider the above to be likely explanations forthe detected broad Hα emission. Additional spectroscopic ob-servations can further rule out the possibility of a stellar originfor the broad Hα emission.
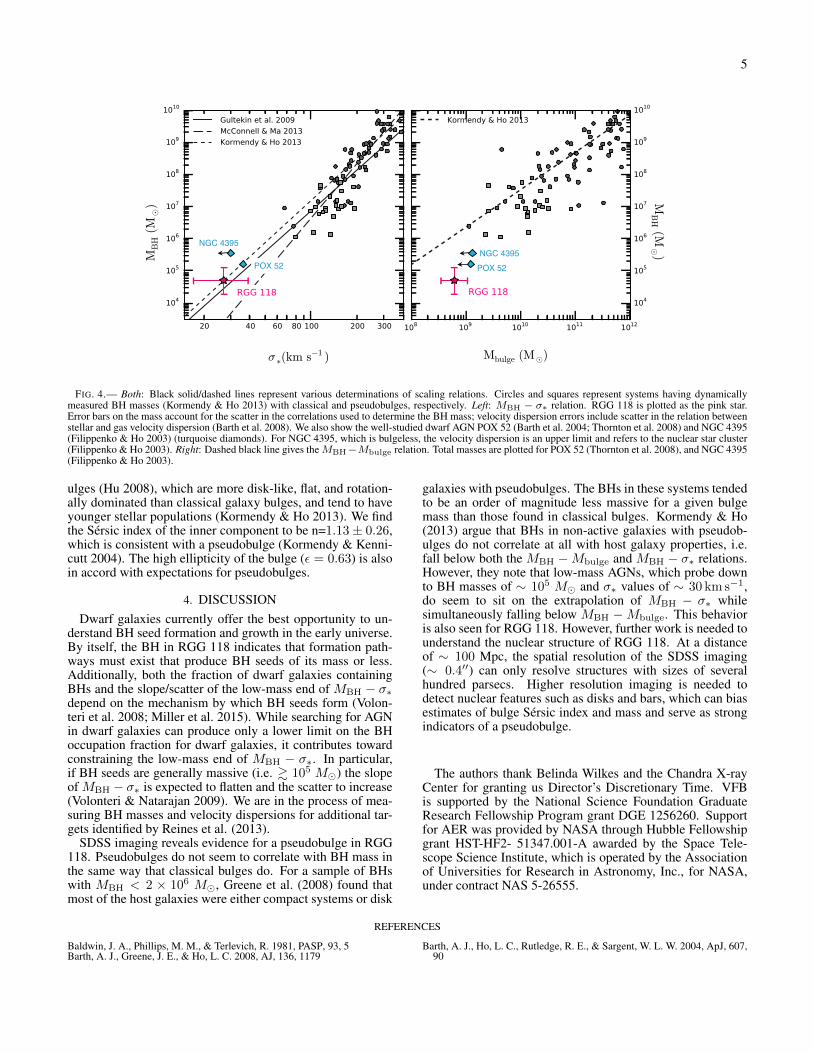
We also find that RGG 118 falls on the extrapolation of theMBH − σ∗ relation to low BH masses, but falls an order ofmagnitude below the MBH–Mbulge relation (Figure 4). Wedid not detect stellar absorption lines in the spectra of RGG118, so instead use the gas velocity dispersion as a proxy forstellar velocity dispersion; the two have been shown to cor-relate, though the scatter in the relation is ∼ 0.15 dex (Barthet al. 2008; Xiao et al. 2011). Using the [NII] line, we measurea gas velocity dispersion of σ[NII] = 27 km s−1 ± 5 km s−1,after correcting for instrumental dispersion. This yields a stel-lar velocity dispersion estimate of σ∗ = 27+12
−10 km s−1, afteradding uncertainties in quadrature.
We compute a bulge mass of 108.8±0.2M� for RGG 118;this gives a MBH-Mbulge ratio of∼ 8×10⁻⁵ and places RGG118 roughly an order of magnitude below the MBH-Mbulge
relation (Figure 4). This is typical of galaxies with pseudob-
5
NGC 4395!
POX 52!NGC 4395!
POX 52!
NGC 4395!
POX 52!NGC 4395!
POX 52!POX 52! POX 52!NGC 4395!
NGC 4395!
FIG. 4.— Both: Black solid/dashed lines represent various determinations of scaling relations. Circles and squares represent systems having dynamicallymeasured BH masses (Kormendy & Ho 2013) with classical and pseudobulges, respectively. Left: MBH − σ∗ relation. RGG 118 is plotted as the pink star.Error bars on the mass account for the scatter in the correlations used to determine the BH mass; velocity dispersion errors include scatter in the relation betweenstellar and gas velocity dispersion (Barth et al. 2008). We also show the well-studied dwarf AGN POX 52 (Barth et al. 2004; Thornton et al. 2008) and NGC 4395(Filippenko & Ho 2003) (turquoise diamonds). For NGC 4395, which is bulgeless, the velocity dispersion is an upper limit and refers to the nuclear star cluster(Filippenko & Ho 2003). Right: Dashed black line gives theMBH−Mbulge relation. Total masses are plotted for POX 52 (Thornton et al. 2008), and NGC 4395(Filippenko & Ho 2003).
ulges (Hu 2008), which are more disk-like, flat, and rotation-ally dominated than classical galaxy bulges, and tend to haveyounger stellar populations (Kormendy & Ho 2013). We findthe Sersic index of the inner component to be n=1.13± 0.26,which is consistent with a pseudobulge (Kormendy & Kenni-cutt 2004). The high ellipticity of the bulge (ε = 0.63) is alsoin accord with expectations for pseudobulges.
4. DISCUSSIONDwarf galaxies currently offer the best opportunity to un-
derstand BH seed formation and growth in the early universe.By itself, the BH in RGG 118 indicates that formation path-ways must exist that produce BH seeds of its mass or less.Additionally, both the fraction of dwarf galaxies containingBHs and the slope/scatter of the low-mass end of MBH − σ∗depend on the mechanism by which BH seeds form (Volon-teri et al. 2008; Miller et al. 2015). While searching for AGNin dwarf galaxies can produce only a lower limit on the BHoccupation fraction for dwarf galaxies, it contributes towardconstraining the low-mass end of MBH − σ∗. In particular,if BH seeds are generally massive (i.e. & 105 M�) the slopeof MBH − σ∗ is expected to flatten and the scatter to increase(Volonteri & Natarajan 2009). We are in the process of mea-suring BH masses and velocity dispersions for additional tar-gets identified by Reines et al. (2013).
SDSS imaging reveals evidence for a pseudobulge in RGG118. Pseudobulges do not seem to correlate with BH mass inthe same way that classical bulges do. For a sample of BHswith MBH < 2 × 10⁶ M�, Greene et al. (2008) found thatmost of the host galaxies were either compact systems or disk
galaxies with pseudobulges. The BHs in these systems tendedto be an order of magnitude less massive for a given bulgemass than those found in classical bulges. Kormendy & Ho(2013) argue that BHs in non-active galaxies with pseudob-ulges do not correlate at all with host galaxy properties, i.e.fall below both the MBH −Mbulge and MBH − σ∗ relations.However, they note that low-mass AGNs, which probe downto BH masses of ∼ 105 M� and σ∗ values of ∼ 30 km s−1,do seem to sit on the extrapolation of MBH − σ∗ whilesimultaneously falling below MBH −Mbulge. This behavioris also seen for RGG 118. However, further work is needed tounderstand the nuclear structure of RGG 118. At a distanceof ∼ 100 Mpc, the spatial resolution of the SDSS imaging(∼ 0.4′′) can only resolve structures with sizes of severalhundred parsecs. Higher resolution imaging is needed todetect nuclear features such as disks and bars, which can biasestimates of bulge Sersic index and mass and serve as strongindicators of a pseudobulge.
The authors thank Belinda Wilkes and the Chandra X-rayCenter for granting us Director’s Discretionary Time. VFBis supported by the National Science Foundation GraduateResearch Fellowship Program grant DGE 1256260. Supportfor AER was provided by NASA through Hubble Fellowshipgrant HST-HF2- 51347.001-A awarded by the Space Tele-scope Science Institute, which is operated by the Associationof Universities for Research in Astronomy, Inc., for NASA,under contract NAS 5-26555.
REFERENCES
Baldwin, J. A., Phillips, M. M., & Terlevich, R. 1981, PASP, 93, 5Barth, A. J., Greene, J. E., & Ho, L. C. 2008, AJ, 136, 1179
Barth, A. J., Ho, L. C., Rutledge, R. E., & Sargent, W. L. W. 2004, ApJ, 607,90
6
Bell, E. F., McIntosh, D. H., Katz, N., & Weinberg, M. D. 2003, ApJS, 149,289
Bentz, M. C., Walsh, J. L., Barth, A. J., et al. 2009, ApJ, 705, 199—. 2010, ApJ, 716, 993Bentz, M. C., Denney, K. D., Grier, C. J., et al. 2013, ApJ, 767, 149Ferrarese, L., & Merritt, D. 2000, ApJ, 539, L9Filippenko, A. V. 1989, AJ, 97, 726Filippenko, A. V., & Ho, L. C. 2003, ApJ, 588, L13Gebhardt, K., Bender, R., Bower, G., et al. 2000, ApJ, 539, L13Greene, J. E., & Ho, L. C. 2004, ApJ, 610, 722—. 2005, ApJ, 630, 122—. 2007, ApJ, 670, 92Greene, J. E., Ho, L. C., & Barth, A. J. 2008, ApJ, 688, 159Gultekin, K., Richstone, D. O., Gebhardt, K., et al. 2009, ApJ, 698, 198Guseva, N. G., Izotov, Y. I., & Thuan, T. X. 2000, ApJ, 531, 776Hu, J. 2008, MNRAS, 386, 2242Kaspi, S., Smith, P. S., Netzer, H., et al. 2000, ApJ, 533, 631Kewley, L. J., Groves, B., Kauffmann, G., & Heckman, T. 2006, MNRAS,
372, 961Kormendy, J., & Ho, L. C. 2013, ARA&A, 51, 511Kormendy, J., & Kennicutt, Jr., R. C. 2004, ARA&A, 42, 603Marconi, A., & Hunt, L. K. 2003, ApJ, 589, L21Marconi, A., Risaliti, G., Gilli, R., et al. 2004, MNRAS, 351, 169Marshall, J. L., Burles, S., Thompson, I. B., et al. 2008, in Society of
Photo-Optical Instrumentation Engineers (SPIE) Conference Series, Vol.7014, Society of Photo-Optical Instrumentation Engineers (SPIE)Conference Series, 54
McConnell, N. J., & Ma, C.-P. 2013, ApJ, 764, 184
Merloni, A., Heinz, S., & di Matteo, T. 2003, MNRAS, 345, 1057Miller, B. P., Gallo, E., Greene, J. E., et al. 2015, ApJ, 799, 98Moran, E. C., Shahinyan, K., Sugarman, H. R., Velez, D. O., & Eracleous,
M. 2014, AJ, 148, 136Mullaney, J. R., Alexander, D. M., Fine, S., et al. 2013, MNRAS, 433, 622Peng, C. Y., Ho, L. C., Impey, C. D., & Rix, H.-W. 2002, AJ, 124, 266—. 2010, AJ, 139, 2097Peterson, B. M., Ferrarese, L., Gilbert, K. M., et al. 2004, ApJ, 613, 682Reines, A. E., & Deller, A. T. 2012, ApJ, 750, L24Reines, A. E., Greene, J. E., & Geha, M. 2013, ApJ, 775, 116Reines, A. E., Plotkin, R. M., Russell, T. D., et al. 2014, ApJ, 787, L30Reines, A. E., Sivakoff, G. R., Johnson, K. E., & Brogan, C. L. 2011,
Nature, 470, 66Schlafly, E. F., & Finkbeiner, D. P. 2011, ApJ, 737, 103SShen, Y., & Liu, X. 2012, ApJ, 753, 125Simard, L., Mendel, J. T., Patton, D. R., Ellison, S. L., & McConnachie,
A. W. 2011, ApJS, 196, 11Smith, N., Li, W., Silverman, J. M., Ganeshalingam, M., & Filippenko, A. V.
2011, MNRAS, 415, 773Thornton, C. E., Barth, A. J., Ho, L. C., Rutledge, R. E., & Greene, J. E.
2008, ApJ, 686, 892Veilleux, S., & Osterbrock, D. E. 1987, ApJS, 63, 295Volonteri, M., Lodato, G., & Natarajan, P. 2008, MNRAS, 383, 1079Volonteri, M., & Natarajan, P. 2009, MNRAS, 400, 1911Xiao, T., Barth, A. J., Greene, J. E., et al. 2011, ApJ, 739, 28Zakamska, N. L., & Greene, J. E. 2014, MNRAS, 442, 784