A 50-STATE LOOK AT RISING COLLEGE PRICES
34
A 50-STATE LOOK AT RISING COLLEGE PRICES AND THE NEW AMERICAN STUDENT MARK HUELSMAN SENIOR POLICY ANALYST
Transcript of A 50-STATE LOOK AT RISING COLLEGE PRICES
A 50-STATE L O O K A T RISING COLLEGE PRICES
A N D T H E NEW AMERICAN S T U D E N T
M A R K H U E L S M A N S E N I O R P O L I C Y A N A L Y S T
demos.org80 Broad St., 4th Fl.New York, NY 10004
Media Contact [email protected]
About DēmosDēmos is a public policy organization working for an America where we all
have an equal say in our democracy and an equal chance in our economy.Our name means “the people.” It is the root word of democracy, and it reminds
us that in America, the true source of our greatness is the diversity of our people. Our nation’s highest challenge is to create a democracy that truly empowers people of all backgrounds, so that we all have a say in setting the policies that shape opportunity and provide for our common future. To help America meet that challenge, Dēmos is working to reduce both political and economic inequality, deploying original research, advocacy, litigation, and strategic com-munications to create the America the people deserve.
AcknowledgementsDēmos would like to thank Lumina Foundation for the generous support of
this work. The views expressed in this paper are solely those of Dēmos authors and not the Lumina Foundation. The data in this report comes from the U.S. Department of Education’s Integrated Postsecondary Education Data System (IPEDS), the U.S. Department of Labor, the State Higher Education Executive Officers Association (SHEEO), U.S. Census Bureau, and the Delta Cost Project.
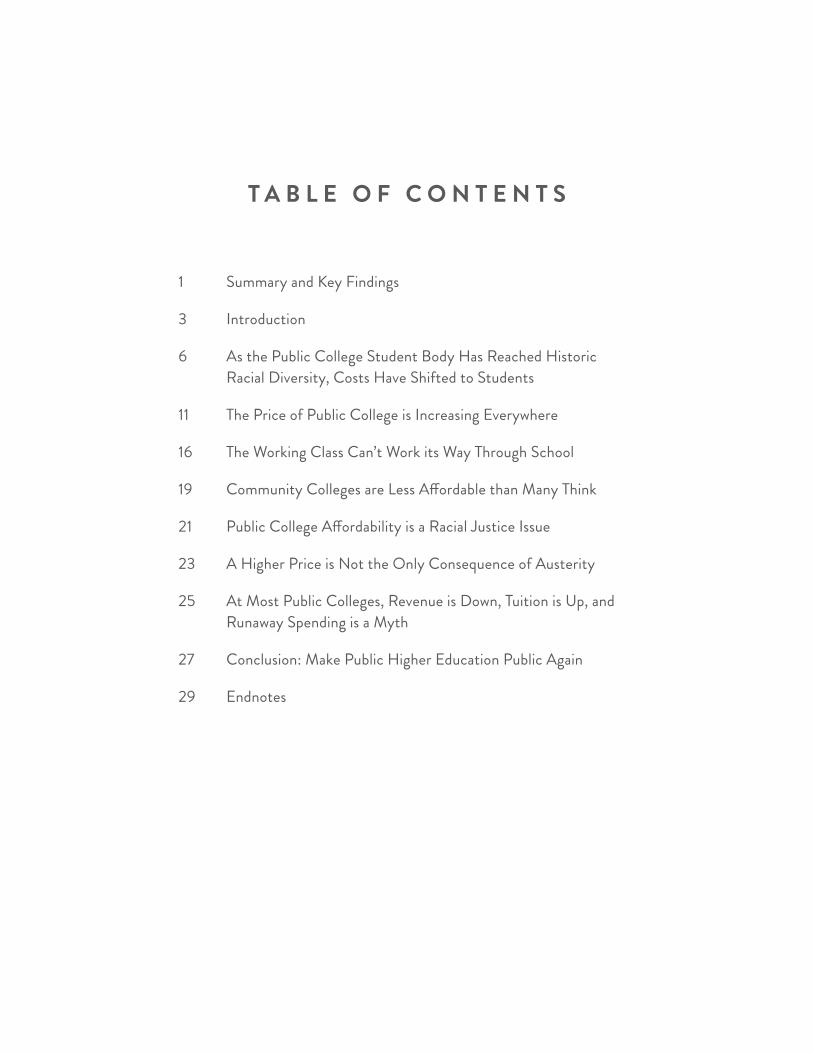
T A B L E O F C O N T E N T S
1 Summary and Key Findings
3 Introduction
6 As the Public College Student Body Has Reached Historic Racial Diversity, Costs Have Shifted to Students
11 The Price of Public College is Increasing Everywhere
16 The Working Class Can’t Work its Way Through School
19 Community Colleges are Less Affordable than Many Think
21 Public College Affordability is a Racial Justice Issue
23 A Higher Price is Not the Only Consequence of Austerity
25 At Most Public Colleges, Revenue is Down, Tuition is Up, and Runaway Spending is a Myth
27 Conclusion: Make Public Higher Education Public Again
29 Endnotes

1
Summary and Key Findings
The notion that any student, regardless of background or family finances, should be able to succeed in college is fundamental to the American ideals of opportunity and meritocracy. Because of this, we have at various times come together to make public colleges and universities more available and affordable to more students. These efforts have generally been successful; investing in affordable education is good policy that not only strengthens opportunity for individuals, but also builds communities, grows our economy, and affirms the values of our democracy.
As a degree or high-quality credential has become close to a requirement for financial stability, policymakers have abandoned the promise that those cre-dentials would be primarily funded through taxpayer support and a modest contribution from students and their families. Some of these cuts are due to an ideology that prioritizes smaller government, lower taxes, and lower levels of public investment generally. In other instances, as the U.S. has undergone downturns in the business cycle, what have often been viewed as necessary and temporary cuts to public higher education funding have instead become the new normal, and per-student funding has generally been on a downward trajectory for many years.
The consequences of our austerity, neglect, and lack of political fortitude are felt most acutely by today’s students, the most diverse in our nation’s history. That today’s students face far higher college prices than previous generations is not in dispute. But the picture is not the same across the county, with wide variation in the levels of state commitments to higher education and to working-class students in particular. Even in states where support seems strong, working-class families face tuition bills that make up very large portions of their family income.
This report lays out where the affordability and funding crises are most acute, taking a state-by-state look at where students can hope to work their way through college, how much each state prioritizes public higher education, and where white students have the greatest advantage in being able to pay the rising price. We find:
• In 49 out of 50 states, public college is less public than in 2001. In all but 1 state (Wyoming), tuition makes up a greater share of total revenue brought in by public colleges and universities than at the beginning of this century.
Summary and Key Findings 2
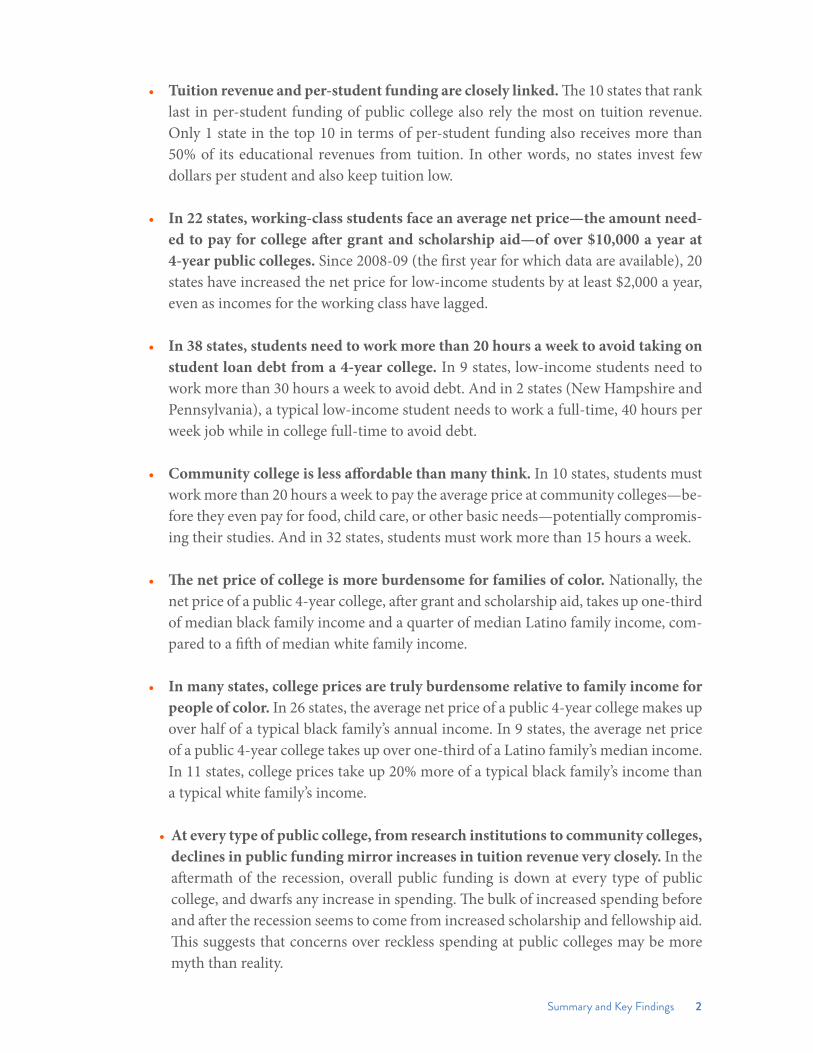
• Tuition revenue and per-student funding are closely linked. The 10 states that rank last in per-student funding of public college also rely the most on tuition revenue. Only 1 state in the top 10 in terms of per-student funding also receives more than 50% of its educational revenues from tuition. In other words, no states invest few dollars per student and also keep tuition low.
• In 22 states, working-class students face an average net price—the amount need-ed to pay for college after grant and scholarship aid—of over $10,000 a year at 4-year public colleges. Since 2008-09 (the first year for which data are available), 20 states have increased the net price for low-income students by at least $2,000 a year, even as incomes for the working class have lagged.
• In 38 states, students need to work more than 20 hours a week to avoid taking on student loan debt from a 4-year college. In 9 states, low-income students need to work more than 30 hours a week to avoid debt. And in 2 states (New Hampshire and Pennsylvania), a typical low-income student needs to work a full-time, 40 hours per week job while in college full-time to avoid debt.
• Community college is less affordable than many think. In 10 states, students must work more than 20 hours a week to pay the average price at community colleges—be-fore they even pay for food, child care, or other basic needs—potentially compromis-ing their studies. And in 32 states, students must work more than 15 hours a week.
• The net price of college is more burdensome for families of color. Nationally, the net price of a public 4-year college, after grant and scholarship aid, takes up one-third of median black family income and a quarter of median Latino family income, com-pared to a fifth of median white family income.
• In many states, college prices are truly burdensome relative to family income for people of color. In 26 states, the average net price of a public 4-year college makes up over half of a typical black family’s annual income. In 9 states, the average net price of a public 4-year college takes up over one-third of a Latino family’s median income. In 11 states, college prices take up 20% more of a typical black family’s income than a typical white family’s income.
• At every type of public college, from research institutions to community colleges, declines in public funding mirror increases in tuition revenue very closely. In the aftermath of the recession, overall public funding is down at every type of public college, and dwarfs any increase in spending. The bulk of increased spending before and after the recession seems to come from increased scholarship and fellowship aid. This suggests that concerns over reckless spending at public colleges may be more myth than reality.
3
Introduction
Ask any American parent, regardless of race or class, what his aspirations are for his child. Ask any worker what she needs to achieve financial security, get a leg up in her career, and have peace of mind. Ask any migrant family the reason they decided to set up a new life in America. Chances are—and polling repeatedly shows1—that the answers to these questions will, in part, involve some type of postsecondary learning or training. Higher education—whether public or private, 2-year, 4-year, or workforce credential—is fundamental to the American ideals of op-portunity and meritocracy, and public investment in it—from the creation of land-grant colleges and community colleges to the GI Bill and the Pell Grant—reflects an un-derstanding that the more a society puts into its people, the more it gets back.
Public support for higher education need not be simply a matter of putting our pooled resources where our shared values are; economic data shows that public investment in postsecondary education pays off for our communi-ties, states, and nation. The Organisation for Economic Cooperation and Development (OECD) estimates that the net public returns—that is, the benefits that accrue to all of us, not just the individual—in the United States range between $100,000 to nearly $300,000 per student.2 Other studies show that individual states see a return of between $3 and $4 for every $1 invested in public colleges and universities.3 There is a persistent link between public spending on colleges and higher tax revenue, lower public assistance spending, greater health outcomes, and lower crime rates. The greater the government support for higher education, the greater the chance that students and families have agency toward their own goals and that communities can be happier, healthier, more resourceful and more productive.
Higher education is fundamental to the American ideals of opportunity and meritocracy, and public investment in it reflects an understanding that the more a society puts into its people, the more it gets back.
"
Introduction 4
Beginning with a well-funded and well-organized political movement animated by the goal of lower taxes and smaller government, and coinciding with an increase in the share of people of color as a total percentage of the population, our national conception of public higher education and other social services has changed.4 Rather than see social spending as something that reaps shared benefits, many politicians have begun to make decisions based on an individualistic view of the safety net. Sure, the argument goes, there may be public benefits to social spending but there are private benefits as well: Individuals see greater earnings, on average, from going to college and thus should shoulder much of the load. In higher education, policymakers shifted the load by cutting postsecond-ary budgets or keeping them flat as more students entered school, while allowing colleges and universities to make up the gap in state funding by charging students more in tuition, fees, and other charges.
Recessions have only exacerbated the impact of this strategy. With fewer jobs available, more students and workers return to school to gain skills and make themselves more attractive in the labor market. During a downturn, states receive less tax revenue but still need to balance their budgets, so they often reduce funding for public higher education and many other vital services to manage these tight circumstances. Finally, as families lose jobs, take pay cuts, and rely more on spending down their savings, students have less wealth to draw upon to pay for college.
As tuition has continued to rise, the federal government has been faced with several options. It could dramatically increase the available grant aid to needy students and ensure that no matter the cost, students will always have an affordable, quality option. Or, the federal government could pressure states to maintain or increase the funding of their public colleges and universities as a way of sharing responsibility. In reality, the federal government has chosen a third path, one with dire consequences for working-class students and students of color. The federal government has, with very few exceptions,5 withheld any pressure on states to increase funding for general support or for working-class students themselves. And while the maximum Pell Grant has increased slightly over time, it has been dwarfed by rising costs of attending college. Today the Pell Grant covers less than one-third of the cost of attending a public college or university. In the late 1970s, it covered nearly three-fourths.6
Instead, the federal government’s response to rising college prices has focused on the federal student loan program, pushing the burden of rising college prices onto students. By offering students a line of credit, and providing students with subsidies on interest rates and various repayment options, this policy approach encumbers students’ futures with hefty loan obligations. On its face, this is a reasonable proposition—after all, the

5
typical student has a bright financial future if she completes a degree program and can use a boost in earnings to pay off the initial amount borrowed. Indeed, the popular notion tends to be that a student loan, like a mortgage, is “good debt,” borrowed against one’s likely future success.
But it does not take a great deal of analysis to understand that below the surface, a debt-financed system of undergraduate higher education can mean an unacceptable level of risk for some students. Work-ing-class students and students of color are more likely to face trouble repaying student loans, and African-American students in particular have loan balances that exceed the amount they borrowed more than a decade after they begin school.7 This is in no way due to differences in personal responsibility, and instead simply reflects a level of both risk and discrimination that do not face white students after leaving college. Meanwhile, Latino students and other fast-growing student populations may show greater aversion to taking on debt in the first place,8 which can lead to them working excessive hours while in college or foregoing college altogether. The decision to take on debt can be deeply personal, and rooted in history. Not taking that into account, and instead foisting debt upon the majority of students entering college may prevent us from encouraging more students to complete a degree program, not to mention preventing some populations from enjoying the full financial benefits of a degree or credential.
In short, our system has not met rising demand for education with policies that would make price manageable. Students are not the only ones who feel the impact of these deliberate policy decisions. Public institutions themselves, particularly those that cannot rely on large donations, endowments, and research grants, resort to cutting classes and services, deferring maintenance, and laying off staff and faculty when state funding is lower. Indeed, the idea of “doing more with less” is often ingrained in community colleges, open-access institutions, and Minority Serving Institutions, while many other colleges are less burdened by austerity measures.
But the picture is not the same in every state. The level of commitment to higher education, and to working-class students in particular, varies dramatically across the country. Even in states where support seems strong, working-class families face outsized tuition bills that drain their family income. This report examines the 50 states and finds the states with the most acute higher-education affordability and funding crises, and the states that are relative bright spots for working-class students and students of color.
As the Public College Student Body Has Reached Historic Racial Diversity, Costs Have Shifted to Students 6
As the Public College Student Body Has Reached Historic Racial Diversity, Costs Have Shifted to Students
The Great Recession presented a nightmare scenario for families and workers with aspirations to go—or go back—to school. As un-employment grew and both property values and consumer sentiment declined, state lawmakers faced acutely shrinking revenues which, combined with balanced-budget requirements, led them to cut higher education budgets. A recent report from the Center on Budget and Policy Priorities confirms that the vast majority of states are still well below their pre-recession levels of funding for postsecond-ary education, even a decade after the recession hit.9 As states have starved public colleges of per-student funding that they once relied upon, those institutions have increased tuition, cut programs or employees, and engaged in other cost-cutting measures. Meanwhile, many families who had been counting on savings or home equity to pay for college had to draw down savings after losing a job, saw their investments or home values wiped out, or both. The recession was particularly brutal for communities of color, who lost a far greater portion of their wealth than white households. 10
As states decreased higher education funding and colleges rapidly raised tuition in response to the financial crisis, students had fewer resources to pay for college. And, the fundamental compact underlying an education at an in-state college or university changed. What was once a service mostly funded by state tax revenue became much more reliant on tuition and fees, and accordingly, student debt.
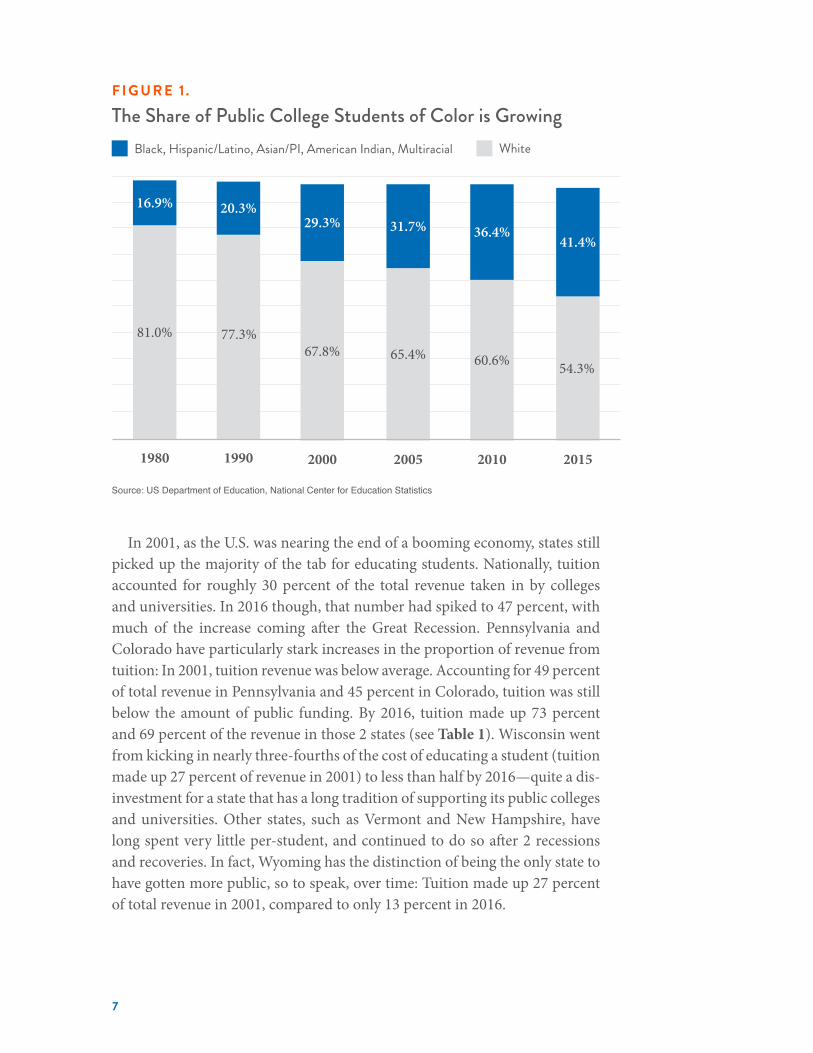
In many ways, cuts during the recession were a brutal continua-tion of the erosion of per-student spending over a period of several decades.11 And this funding backslide has happened just as the racial and socioeconomic makeup of the college-going population has changed. Whereas students of color made up only 1 in 6 public college students in 1980, they now make up over 4 in 10, as Figure 1 shows.12
What was once a service mostly funded by state tax revenue became much more reliant on tuition and fees, and accordingly, student debt.
"
7
In 2001, as the U.S. was nearing the end of a booming economy, states still picked up the majority of the tab for educating students. Nationally, tuition accounted for roughly 30 percent of the total revenue taken in by colleges and universities. In 2016 though, that number had spiked to 47 percent, with much of the increase coming after the Great Recession. Pennsylvania and Colorado have particularly stark increases in the proportion of revenue from tuition: In 2001, tuition revenue was below average. Accounting for 49 percent of total revenue in Pennsylvania and 45 percent in Colorado, tuition was still below the amount of public funding. By 2016, tuition made up 73 percent and 69 percent of the revenue in those 2 states (see Table 1). Wisconsin went from kicking in nearly three-fourths of the cost of educating a student (tuition made up 27 percent of revenue in 2001) to less than half by 2016—quite a dis-investment for a state that has a long tradition of supporting its public colleges and universities. Other states, such as Vermont and New Hampshire, have long spent very little per-student, and continued to do so after 2 recessions and recoveries. In fact, Wyoming has the distinction of being the only state to have gotten more public, so to speak, over time: Tuition made up 27 percent of total revenue in 2001, compared to only 13 percent in 2016.
2000 2005 2010 2015
67.8% 65.4% 60.6% 54.3%
29.3% 31.7% 36.4%41.4%
F I G U R E 1 .
The Share of Public College Students of Color is GrowingBlack, Hispanic/Latino, Asian/PI, American Indian, Multiracial White
Source: US Department of Education, National Center for Education Statistics
1980 1990
81.0% 77.3%
16.9% 20.3%

As the Public College Student Body Has Reached Historic Racial Diversity, Costs Have Shifted to Students 8
TA B L E 1 .
In 49 States, Students are Covering More of the Cost of Public College than in 2001 Percent of Educational Revenue Covered by Tuition
State 2001 2016Rank,
2016
Alabama 42% 68% 43
Alaska 21% 30% 3
Arizona 32% 63% 39
Arkansas 26% 46% 17
California 10% 21% 2
Colorado 45% 69% 45
Connecticut 32% 51% 27
Delaware 54% 75% 48
Florida 27% 35% 8
Georgia 17% 38% 11
Hawaii 20% 32% 5
Idaho 19% 35% 8
Illinois 19% 32%* 5
Indiana 41% 61% 37
Iowa 35% 60% 35
Kansas 28% 53% 30
Kentucky 30% 50% 26
Louisiana 26% 45% 16
Maine 35% 55% 32
Maryland 37% 49% 23
Massachusetts 29% 43% 15
Michigan 40% 69% 45
Minnesota 29% 53% 30
Mississippi 28% 49% 23
Missouri 27% 49% 23
State 2001 2016Rank,
2016
Montana 43% 52% 29
Nebraska 33% 40% 13
Nevada 24% 38% 11
New Hampshire 65% 79% 49
New Jersey 39% 60% 35
New Mexico 11% 31% 4
New York 30% 37% 10
North Carolina 19% 34% 7
North Dakota 40% 48% 20
Ohio 40% 59% 34
Oklahoma 21% 48% 20
Oregon 36% 58% 33
Pennsylvania 49% 73% 47
Rhode Island 44% 61% 37
South Carolina 38% 63% 39
South Dakota 46% 68% 43
Tennessee 34% 48% 20
Texas 34% 40% 13
Utah 27% 47% 19
Vermont 76% 86% 50
Virginia 32% 64% 41
Washington 24% 46% 17
West Virginia 39% 64% 41
Wisconsin 27% 51% 27
Wyoming 27% 13% 1Source: State Higher Education Executive Officers (2017). *2016 Data for Illinois is unavailable due to a long-standing budget disagreement that defunded much of the state’s public colleges. This figure is from 2015.

9
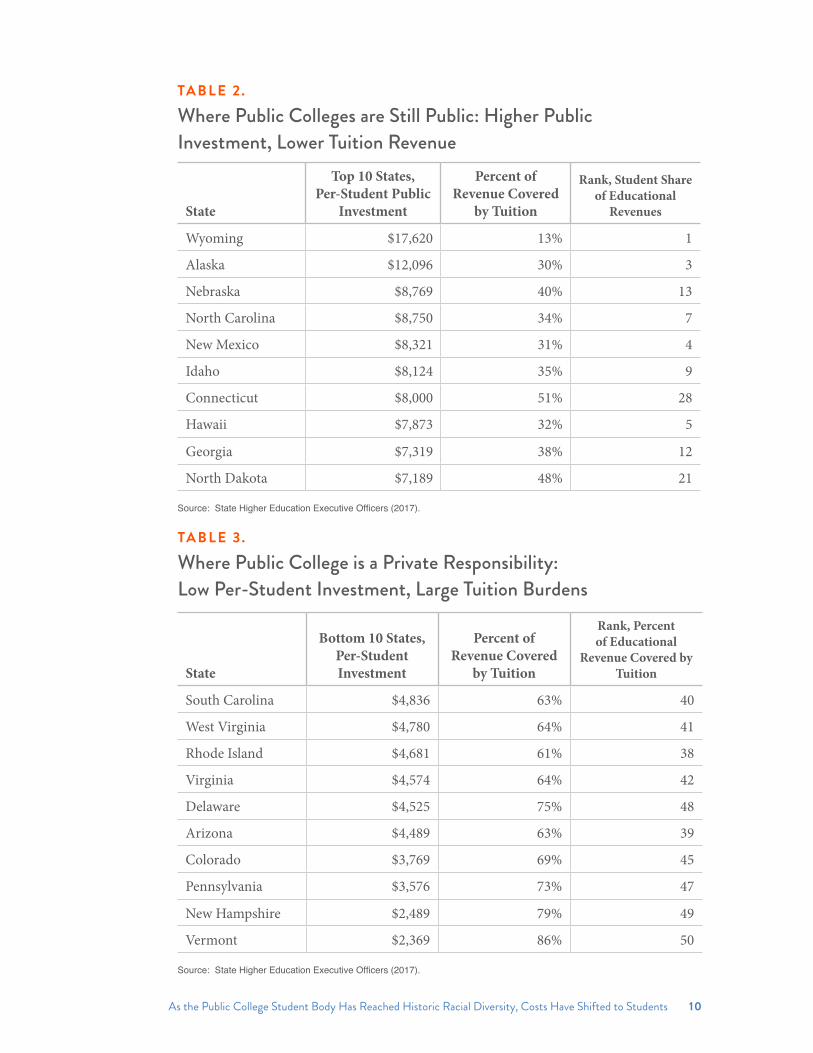
Generally speaking, states in which tuition revenue makes up a smaller portion of overall funding are also states that rank highly in terms of per-student investment. In other words, states that spend a lot per student are not also taking in massive amounts of tuition revenue and spending it wantonly. In fact, in the 10 states that spend the most per student, only 1 (Connecticut) has more than half of its funding come from tuition, as indicated in Table 2.
By contrast, the 10 states that spend the least per student all tend to rely a great deal more on tuition revenue to fund higher education, as Table 3 shows.
In short, there are no states that magically spend very little per student while also bringing in very little tuition revenue. When states do not prioritize higher education as a public good, students and families generally bear the burden. As higher education has become more representative by race, our state and federal policymakers have been vacating the compact with students that previous generations enjoyed.
As the Public College Student Body Has Reached Historic Racial Diversity, Costs Have Shifted to Students 10
TA B L E 3.
Where Public College is a Private Responsibility: Low Per-Student Investment, Large Tuition Burdens
Source: State Higher Education Executive Officers (2017).
State
Bottom 10 States, Per-Student Investment
Percent of Revenue Covered
by Tuition
Rank, Percent of Educational
Revenue Covered by Tuition
South Carolina $4,836 63% 40
West Virginia $4,780 64% 41
Rhode Island $4,681 61% 38
Virginia $4,574 64% 42
Delaware $4,525 75% 48
Arizona $4,489 63% 39
Colorado $3,769 69% 45
Pennsylvania $3,576 73% 47
New Hampshire $2,489 79% 49
Vermont $2,369 86% 50
TA B L E 2.
Where Public Colleges are Still Public: Higher Public Investment, Lower Tuition Revenue
Source: State Higher Education Executive Officers (2017).
State
Top 10 States, Per-Student Public
Investment
Percent of Revenue Covered
by Tuition
Rank, Student Share of Educational
Revenues
Wyoming $17,620 13% 1
Alaska $12,096 30% 3
Nebraska $8,769 40% 13
North Carolina $8,750 34% 7
New Mexico $8,321 31% 4
Idaho $8,124 35% 9
Connecticut $8,000 51% 28
Hawaii $7,873 32% 5
Georgia $7,319 38% 12
North Dakota $7,189 48% 21

11
The Price of Public College is Increasing Everywhere
Recent studies have attempted to quantify the exact relationship between cuts to higher education funding and tuition increases. After all, states that cut budgets could also have tuition caps in place, preventing colleges from increasing tuition beyond a certain point—and thus requiring them to cut staff, services, or academic offerings, or to enroll more students who can pay out-of-state tuition. And some institutions, likely those with greater resources to begin with, may be able to absorb some cuts without increasing tuition in the same year that they see a budget cut. While it remains a source of ongoing debate, the most rigorous analysis to date finds that, in recent years, every $1,000 cut in per-student funding has led to a $318 increase in tuition and fees.13
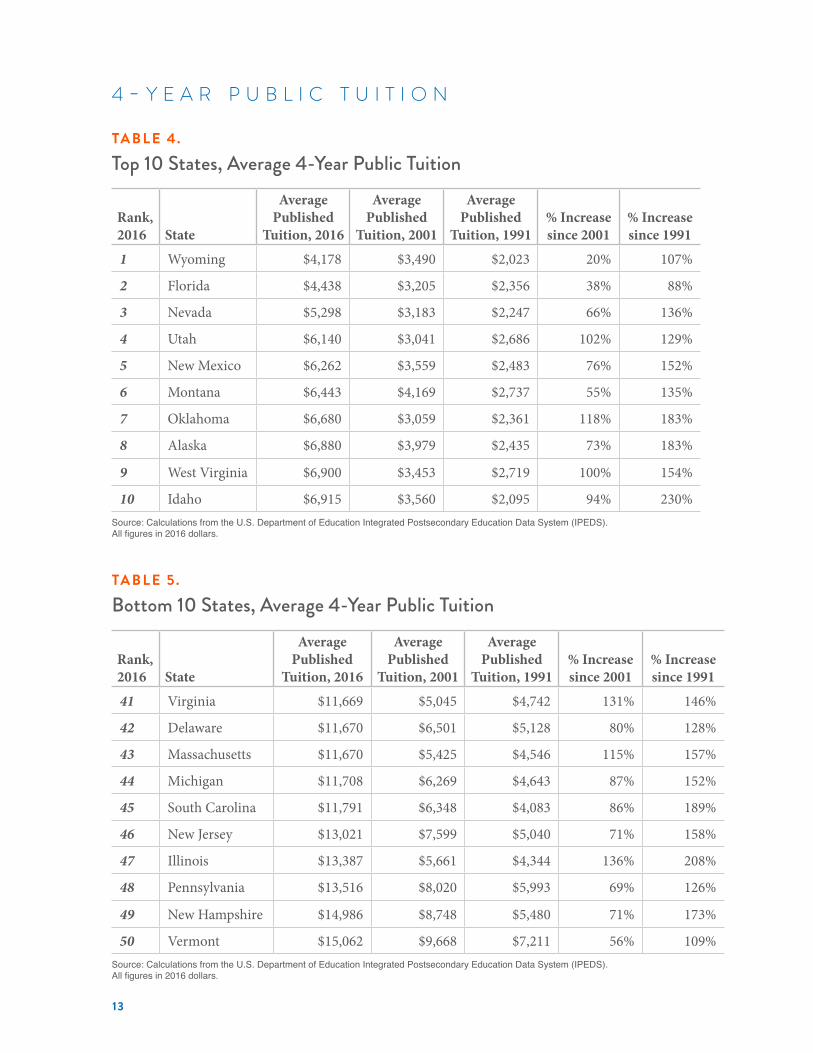
Incontrovertibly, tuition is increasing. Average tuition at public 4-year colleges across the country is $9,970 a year in 2017, which is double the sticker price ($4,970) in 2001, and two-and-a-half times as high as the average ($3,790) in 1991.14 As with state funding, there are enormous variations in the average tuition at public colleges and uni-versities from state to state. To be sure, residents of every state have seen tuition spike over the past 25 years or more. In fact, tuition at the least affordable state in 1991 (Vermont) would rank comfortably in the top half of states today.
As we see in Table 4, Wyoming’s average 4-year tuition is the lowest, and the state ranks first in terms of per-student state funding of higher education.
Vermont’s average 4-year tuition is the highest at more than $15,000 a year, and not incidentally, the state ranks last in terms of per-student state funding of higher education. (See Table 5.)
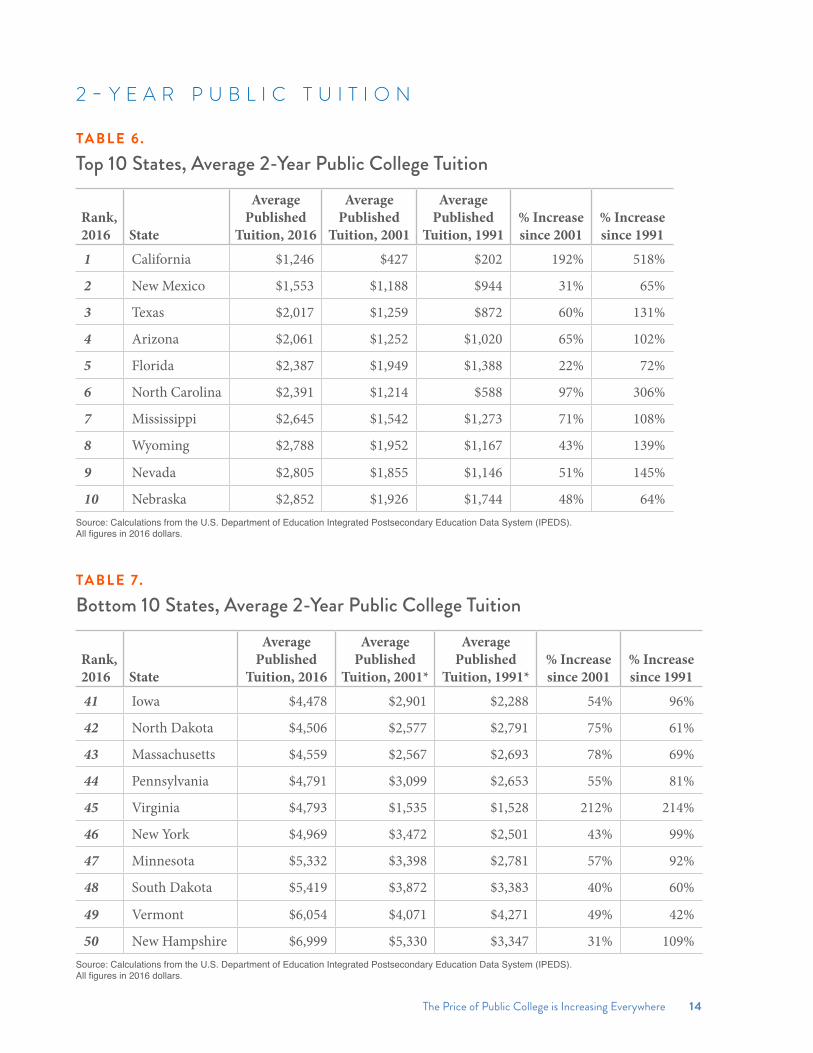
The same story is true for community colleges, which educate 4 out of every 10 American college students and often receive less than other public colleges from a dwindling pot of state funds.15 The difference between California, where mandatory fees hover around $1,200, and New Hampshire, where tuition averages nearly $7,000 for a public 2-year college, is stark. So is the rapid cost increase in Virginia 2-year colleges, where tuition has more than tripled since the turn of this
Incontrovertibly, tuition is increasing. Average tuition at public 4-year colleges across the country is $9,970 a year in 2017, which is double the sticker price ($4,970) in 2001, and two-and-a-half times as high as the average ($3,790) in 1991.
"
The Price of Public College is Increasing Everywhere 12
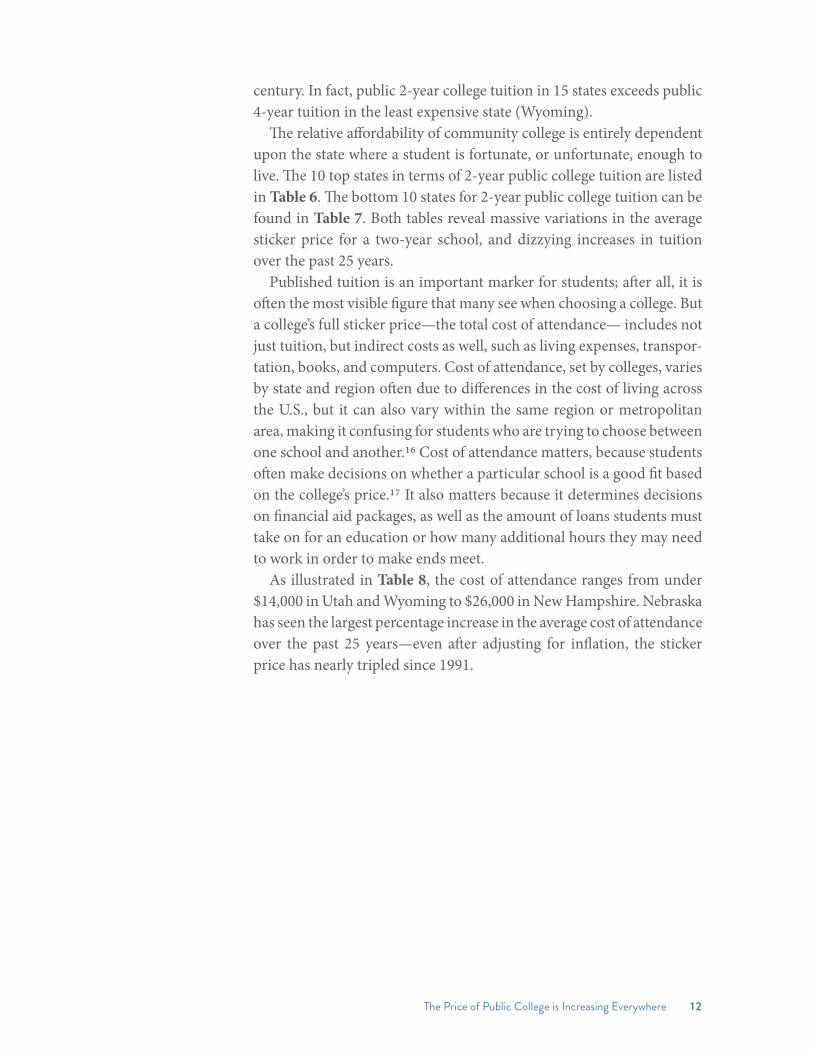
century. In fact, public 2-year college tuition in 15 states exceeds public 4-year tuition in the least expensive state (Wyoming).
The relative affordability of community college is entirely dependent upon the state where a student is fortunate, or unfortunate, enough to live. The 10 top states in terms of 2-year public college tuition are listed in Table 6. The bottom 10 states for 2-year public college tuition can be found in Table 7. Both tables reveal massive variations in the average sticker price for a two-year school, and dizzying increases in tuition over the past 25 years.
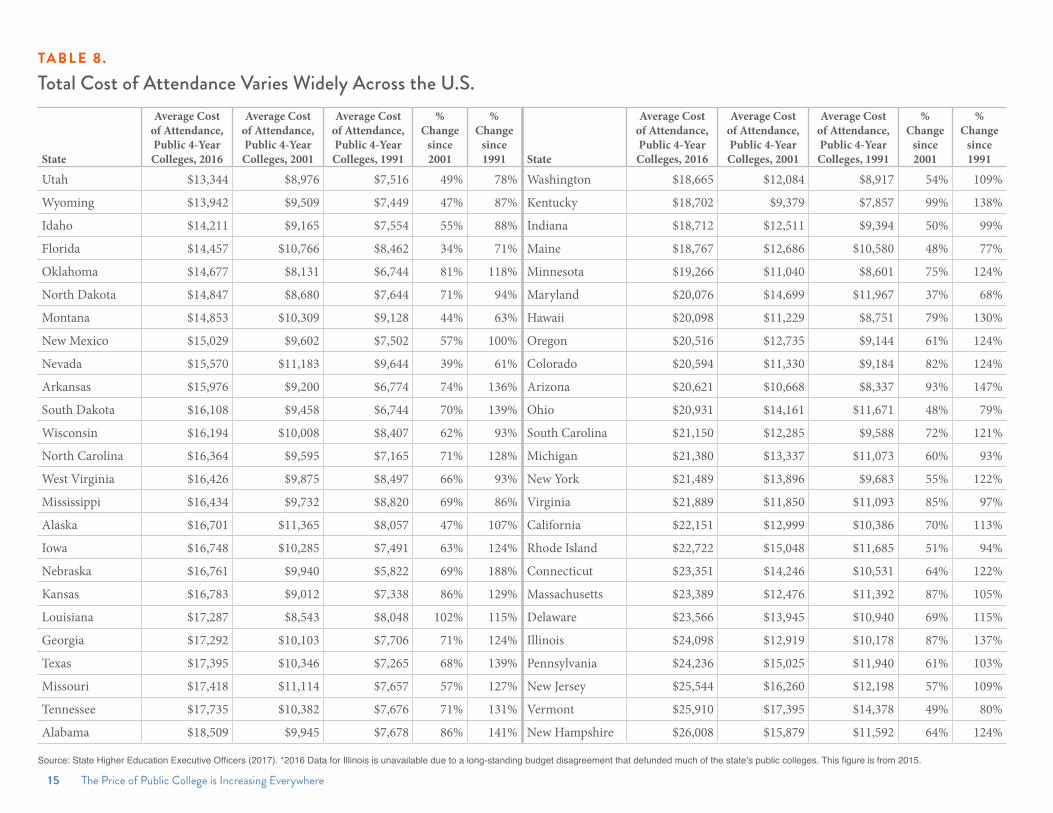
Published tuition is an important marker for students; after all, it is often the most visible figure that many see when choosing a college. But a college’s full sticker price—the total cost of attendance— includes not just tuition, but indirect costs as well, such as living expenses, transpor-tation, books, and computers. Cost of attendance, set by colleges, varies by state and region often due to differences in the cost of living across the U.S., but it can also vary within the same region or metropolitan area, making it confusing for students who are trying to choose between one school and another.16 Cost of attendance matters, because students often make decisions on whether a particular school is a good fit based on the college’s price.17 It also matters because it determines decisions on financial aid packages, as well as the amount of loans students must take on for an education or how many additional hours they may need to work in order to make ends meet.
As illustrated in Table 8, the cost of attendance ranges from under $14,000 in Utah and Wyoming to $26,000 in New Hampshire. Nebraska has seen the largest percentage increase in the average cost of attendance over the past 25 years—even after adjusting for inflation, the sticker price has nearly tripled since 1991.
13
TA B L E 5.
Bottom 10 States, Average 4-Year Public Tuition
Source: Calculations from the U.S. Department of Education Integrated Postsecondary Education Data System (IPEDS). All figures in 2016 dollars.
Rank, 2016 State
Average Published
Tuition, 2016
Average Published
Tuition, 2001
Average Published
Tuition, 1991% Increase since 2001
% Increase since 1991
41 Virginia $11,669 $5,045 $4,742 131% 146%
42 Delaware $11,670 $6,501 $5,128 80% 128%
43 Massachusetts $11,670 $5,425 $4,546 115% 157%
44 Michigan $11,708 $6,269 $4,643 87% 152%
45 South Carolina $11,791 $6,348 $4,083 86% 189%
46 New Jersey $13,021 $7,599 $5,040 71% 158%
47 Illinois $13,387 $5,661 $4,344 136% 208%
48 Pennsylvania $13,516 $8,020 $5,993 69% 126%
49 New Hampshire $14,986 $8,748 $5,480 71% 173%
50 Vermont $15,062 $9,668 $7,211 56% 109%
TA B L E 4.
Top 10 States, Average 4-Year Public Tuition
Source: Calculations from the U.S. Department of Education Integrated Postsecondary Education Data System (IPEDS). All figures in 2016 dollars.
Rank, 2016 State
Average Published
Tuition, 2016
Average Published
Tuition, 2001
Average Published
Tuition, 1991% Increase since 2001
% Increase since 1991
1 Wyoming $4,178 $3,490 $2,023 20% 107%
2 Florida $4,438 $3,205 $2,356 38% 88%
3 Nevada $5,298 $3,183 $2,247 66% 136%
4 Utah $6,140 $3,041 $2,686 102% 129%
5 New Mexico $6,262 $3,559 $2,483 76% 152%
6 Montana $6,443 $4,169 $2,737 55% 135%
7 Oklahoma $6,680 $3,059 $2,361 118% 183%
8 Alaska $6,880 $3,979 $2,435 73% 183%
9 West Virginia $6,900 $3,453 $2,719 100% 154%
10 Idaho $6,915 $3,560 $2,095 94% 230%
4 - y e a r p u b l i c t u i t i o n
The Price of Public College is Increasing Everywhere 14
TA B L E 7.
Bottom 10 States, Average 2-Year Public College Tuition
Source: Calculations from the U.S. Department of Education Integrated Postsecondary Education Data System (IPEDS). All figures in 2016 dollars.
Rank, 2016 State
Average Published
Tuition, 2016
Average Published
Tuition, 2001*
Average Published
Tuition, 1991*% Increase since 2001
% Increase since 1991
41 Iowa $4,478 $2,901 $2,288 54% 96%
42 North Dakota $4,506 $2,577 $2,791 75% 61%
43 Massachusetts $4,559 $2,567 $2,693 78% 69%
44 Pennsylvania $4,791 $3,099 $2,653 55% 81%
45 Virginia $4,793 $1,535 $1,528 212% 214%
46 New York $4,969 $3,472 $2,501 43% 99%
47 Minnesota $5,332 $3,398 $2,781 57% 92%
48 South Dakota $5,419 $3,872 $3,383 40% 60%
49 Vermont $6,054 $4,071 $4,271 49% 42%
50 New Hampshire $6,999 $5,330 $3,347 31% 109%
TA B L E 6.
Top 10 States, Average 2-Year Public College Tuition
Source: Calculations from the U.S. Department of Education Integrated Postsecondary Education Data System (IPEDS). All figures in 2016 dollars.
Rank, 2016 State
Average Published
Tuition, 2016
Average Published
Tuition, 2001
Average Published
Tuition, 1991% Increase since 2001
% Increase since 1991
1 California $1,246 $427 $202 192% 518%
2 New Mexico $1,553 $1,188 $944 31% 65%
3 Texas $2,017 $1,259 $872 60% 131%
4 Arizona $2,061 $1,252 $1,020 65% 102%
5 Florida $2,387 $1,949 $1,388 22% 72%
6 North Carolina $2,391 $1,214 $588 97% 306%
7 Mississippi $2,645 $1,542 $1,273 71% 108%
8 Wyoming $2,788 $1,952 $1,167 43% 139%
9 Nevada $2,805 $1,855 $1,146 51% 145%
10 Nebraska $2,852 $1,926 $1,744 48% 64%
2 - y e a r p u b l i c t u i t i o n
15 The Price of Public College is Increasing Everywhere
TA B L E 8.
Total Cost of Attendance Varies Widely Across the U.S.
State
Average Cost of Attendance, Public 4-Year Colleges, 2016
Average Cost of Attendance, Public 4-Year Colleges, 2001
Average Cost of Attendance, Public 4-Year Colleges, 1991
% Change
since 2001
% Change
since 1991
Utah $13,344 $8,976 $7,516 49% 78%
Wyoming $13,942 $9,509 $7,449 47% 87%
Idaho $14,211 $9,165 $7,554 55% 88%
Florida $14,457 $10,766 $8,462 34% 71%
Oklahoma $14,677 $8,131 $6,744 81% 118%
North Dakota $14,847 $8,680 $7,644 71% 94%
Montana $14,853 $10,309 $9,128 44% 63%
New Mexico $15,029 $9,602 $7,502 57% 100%
Nevada $15,570 $11,183 $9,644 39% 61%
Arkansas $15,976 $9,200 $6,774 74% 136%
South Dakota $16,108 $9,458 $6,744 70% 139%
Wisconsin $16,194 $10,008 $8,407 62% 93%
North Carolina $16,364 $9,595 $7,165 71% 128%
West Virginia $16,426 $9,875 $8,497 66% 93%
Mississippi $16,434 $9,732 $8,820 69% 86%
Alaska $16,701 $11,365 $8,057 47% 107%
Iowa $16,748 $10,285 $7,491 63% 124%
Nebraska $16,761 $9,940 $5,822 69% 188%
Kansas $16,783 $9,012 $7,338 86% 129%
Louisiana $17,287 $8,543 $8,048 102% 115%
Georgia $17,292 $10,103 $7,706 71% 124%
Texas $17,395 $10,346 $7,265 68% 139%
Missouri $17,418 $11,114 $7,657 57% 127%
Tennessee $17,735 $10,382 $7,676 71% 131%
Alabama $18,509 $9,945 $7,678 86% 141%
State
Average Cost of Attendance, Public 4-Year Colleges, 2016
Average Cost of Attendance, Public 4-Year Colleges, 2001
Average Cost of Attendance, Public 4-Year Colleges, 1991
% Change
since 2001
% Change
since 1991
Washington $18,665 $12,084 $8,917 54% 109%
Kentucky $18,702 $9,379 $7,857 99% 138%
Indiana $18,712 $12,511 $9,394 50% 99%
Maine $18,767 $12,686 $10,580 48% 77%
Minnesota $19,266 $11,040 $8,601 75% 124%
Maryland $20,076 $14,699 $11,967 37% 68%
Hawaii $20,098 $11,229 $8,751 79% 130%
Oregon $20,516 $12,735 $9,144 61% 124%
Colorado $20,594 $11,330 $9,184 82% 124%
Arizona $20,621 $10,668 $8,337 93% 147%
Ohio $20,931 $14,161 $11,671 48% 79%
South Carolina $21,150 $12,285 $9,588 72% 121%
Michigan $21,380 $13,337 $11,073 60% 93%
New York $21,489 $13,896 $9,683 55% 122%
Virginia $21,889 $11,850 $11,093 85% 97%
California $22,151 $12,999 $10,386 70% 113%
Rhode Island $22,722 $15,048 $11,685 51% 94%
Connecticut $23,351 $14,246 $10,531 64% 122%
Massachusetts $23,389 $12,476 $11,392 87% 105%
Delaware $23,566 $13,945 $10,940 69% 115%
Illinois $24,098 $12,919 $10,178 87% 137%
Pennsylvania $24,236 $15,025 $11,940 61% 103%
New Jersey $25,544 $16,260 $12,198 57% 109%
Vermont $25,910 $17,395 $14,378 49% 80%
New Hampshire $26,008 $15,879 $11,592 64% 124%
Source: State Higher Education Executive Officers (2017). *2016 Data for Illinois is unavailable due to a long-standing budget disagreement that defunded much of the state’s public colleges. This figure is from 2015.
The Working Class Can’t Work its Way Through School 16
The Working Class Can’t Work its Way Through School
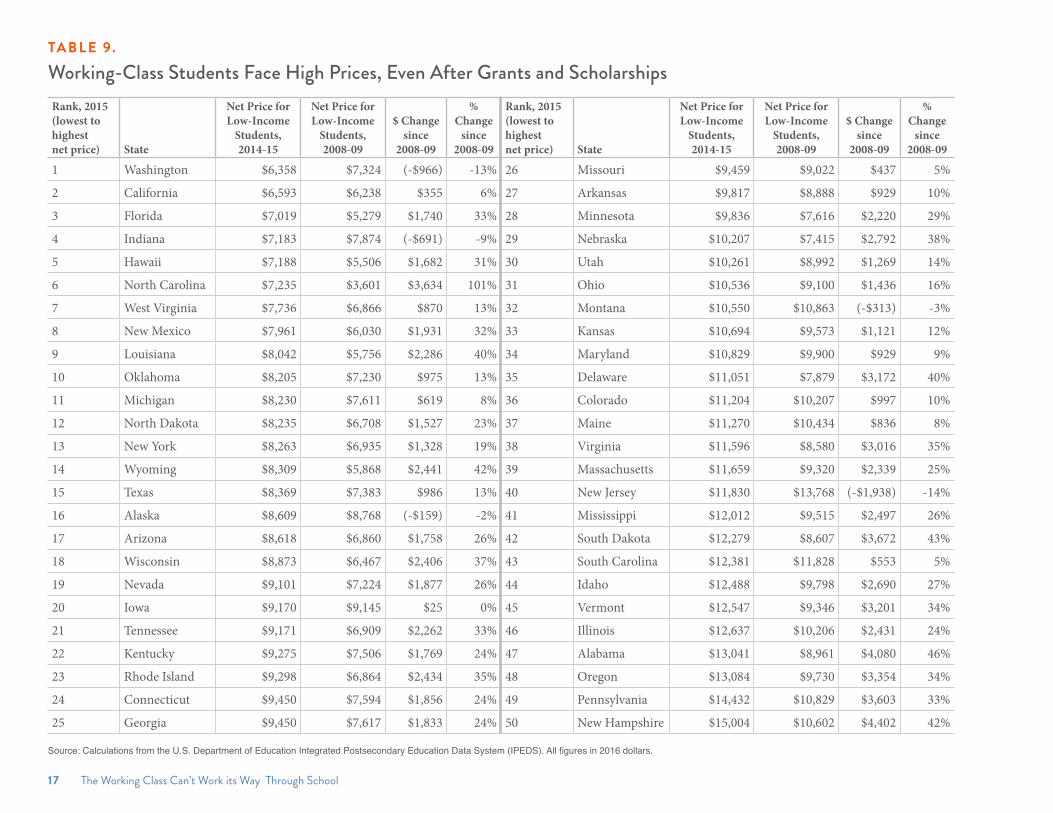
Of course, many students rely on grants and scholarships to lower the total cost of college. For instance, the federal Pell Grant was designed to level the playing field between low- and high-income students, and enable working-class students to attend college without undue burden despite having fewer financial means. Net price—the total cost of school to students after grant aid—reveals a state or institution’s priorities. Even high-tuition states and colleges can provide enough grant aid, when combined with a Pell Grant, to enable students to work their way through college. Unfortunately, the available data show that the grant aid available from federal, state, or other sources does not come close to making the average total cost attainable to low-income students. Work-ing-class students18 face an average net price of over $10,000 a year in 22 states. Since 2008-09 (the first year for which data are available), 20 states have increased the net price for low-income students by at least $2,000 a year—even as incomes for the working class have lagged. (See Table 9.)
In the vast majority of states, the idea of working your way through school is no more than an antiquated myth. A combination of low minimum wages and high college prices make borrowing an inevi-tability for students. If he or she did not want to borrow, the typical low-income student in New Hampshire and Pennsylvania would not only need to rely on grant and scholarship aid, but would need to work a full-time, 40 hours per week job while also attending college full time. In 38 states, students need to work more than 20 hours a week to avoid debt—an impossibility for the 25 percent of students who have children of their own.19
On the other hand, working-class students in Washington and California can come closer to working their way through college without debt. By already prioritizing grant aid toward low-income students, while ensuring that workers have a better shot at earning a living wage, these states would need to provide only marginally more support to working-class students in order to ensure that a part-time job is all that’s needed to pay for school. Table 10 indicates how many hours a student must work to afford college in each state, even after receiving grants.
A combination of low minimum wages and high college prices make borrowing an inevitability for students.
"
17 The Working Class Can’t Work its Way Through School
TA B L E 9.
Working-Class Students Face High Prices, Even After Grants and ScholarshipsRank, 2015(lowest to highest net price) State
Net Price for Low-Income
Students, 2014-15
Net Price for Low-Income
Students, 2008-09
$ Change since
2008-09
% Change
since 2008-09
1 Washington $6,358 $7,324 (-$966) -13%
2 California $6,593 $6,238 $355 6%
3 Florida $7,019 $5,279 $1,740 33%
4 Indiana $7,183 $7,874 (-$691) -9%
5 Hawaii $7,188 $5,506 $1,682 31%
6 North Carolina $7,235 $3,601 $3,634 101%
7 West Virginia $7,736 $6,866 $870 13%
8 New Mexico $7,961 $6,030 $1,931 32%
9 Louisiana $8,042 $5,756 $2,286 40%
10 Oklahoma $8,205 $7,230 $975 13%
11 Michigan $8,230 $7,611 $619 8%
12 North Dakota $8,235 $6,708 $1,527 23%
13 New York $8,263 $6,935 $1,328 19%
14 Wyoming $8,309 $5,868 $2,441 42%
15 Texas $8,369 $7,383 $986 13%
16 Alaska $8,609 $8,768 (-$159) -2%
17 Arizona $8,618 $6,860 $1,758 26%
18 Wisconsin $8,873 $6,467 $2,406 37%
19 Nevada $9,101 $7,224 $1,877 26%
20 Iowa $9,170 $9,145 $25 0%
21 Tennessee $9,171 $6,909 $2,262 33%
22 Kentucky $9,275 $7,506 $1,769 24%
23 Rhode Island $9,298 $6,864 $2,434 35%
24 Connecticut $9,450 $7,594 $1,856 24%
25 Georgia $9,450 $7,617 $1,833 24%
Rank, 2015(lowest to highest net price) State
Net Price for Low-Income
Students, 2014-15
Net Price for Low-Income
Students, 2008-09
$ Change since
2008-09
% Change
since 2008-09
26 Missouri $9,459 $9,022 $437 5%
27 Arkansas $9,817 $8,888 $929 10%
28 Minnesota $9,836 $7,616 $2,220 29%
29 Nebraska $10,207 $7,415 $2,792 38%
30 Utah $10,261 $8,992 $1,269 14%
31 Ohio $10,536 $9,100 $1,436 16%
32 Montana $10,550 $10,863 (-$313) -3%
33 Kansas $10,694 $9,573 $1,121 12%
34 Maryland $10,829 $9,900 $929 9%
35 Delaware $11,051 $7,879 $3,172 40%
36 Colorado $11,204 $10,207 $997 10%
37 Maine $11,270 $10,434 $836 8%
38 Virginia $11,596 $8,580 $3,016 35%
39 Massachusetts $11,659 $9,320 $2,339 25%
40 New Jersey $11,830 $13,768 (-$1,938) -14%
41 Mississippi $12,012 $9,515 $2,497 26%
42 South Dakota $12,279 $8,607 $3,672 43%
43 South Carolina $12,381 $11,828 $553 5%
44 Idaho $12,488 $9,798 $2,690 27%
45 Vermont $12,547 $9,346 $3,201 34%
46 Illinois $12,637 $10,206 $2,431 24%
47 Alabama $13,041 $8,961 $4,080 46%
48 Oregon $13,084 $9,730 $3,354 34%
49 Pennsylvania $14,432 $10,829 $3,603 33%
50 New Hampshire $15,004 $10,602 $4,402 42%
Source: Calculations from the U.S. Department of Education Integrated Postsecondary Education Data System (IPEDS). All figures in 2016 dollars.

The Working Class Can’t Work its Way Through School 18
TA B L E 10.
The Working Class Can’t Work Its Way Through School: Weekly Work Hours Needed to Pay for 4-Year College, After Grants
State
Average Net Price for Low-Income Students, Public
4-Year Colleges 2015State Minimum
Wage
Weekly Work Hours Needed to Pay for College
New Hampshire $15,004 $7.25 41.4
Pennsylvania $14,432 $7.25 39.8
Alabama $13,041 $7.25 36
Idaho $12,488 $7.25 34.4
South Carolina $12,381 $7.25 34.2
Mississippi $12,012 $7.25 33.1
Virginia $11,596 $7.25 32
Illinois $12,637 $8.25 30.6
Kansas $10,694 $7.25 29.5
South Dakota $12,279 $8.65 28.4
Utah $10,261 $7.25 28.3
New Jersey $11,830 $8.44 28
Delaware $11,051 $8.25 26.8
Georgia $9,450 $7.25 26.1
Montana $10,550 $8.15 25.9
Ohio $10,536 $8.15 25.9
Kentucky $9,275 $7.25 25.6
Oregon $13,084 $10.25 25.5
Tennessee $9,171 $7.25 25.3
Iowa $9,170 $7.25 25.3
Vermont $12,547 $10.00 25.1
Maine $11,270 $9.00 25
Missouri $9,459 $7.70 24.6
Wisconsin $8,873 $7.25 24.5
Colorado $11,204 $9.30 24.1
State
Average Net Price for Low-Income Students, Public
4-Year Colleges 2015State Minimum
Wage
Weekly Work Hours Needed to Pay for College
Maryland $10,829 $9.25 23.4
Arkansas $9,817 $8.50 23.1
Texas $8,369 $7.25 23.1
Wyoming $8,309 $7.25 22.9
North Dakota $8,235 $7.25 22.7
Nebraska $10,207 $9.00 22.7
Oklahoma $8,205 $7.25 22.6
Louisiana $8,042 $7.25 22.2
Nevada $9,101 $8.25 22.1
New Mexico $7,961 $7.50 21.2
Massachusetts $11,659 $11.00 21.2
Minnesota $9,836 $9.50 20.7
North Carolina $7,235 $7.25 20
Indiana $7,183 $7.25 19.8
Rhode Island $9,298 $9.60 19.4
Connecticut $9,450 $10.10 18.7
Michigan $8,230 $8.90 18.5
West Virginia $7,736 $8.75 17.7
Alaska $8,609 $9.75 17.7
Florida $7,019 $8.10 17.3
Arizona $8,618 $10.00 17.2
Hawaii $7,188 $9.25 15.5
New York $8,263 $11.00 15
California $6,593 $10.50 12.6
Washington $6,358 $11.00 11.6
Source: Calculations from IPEDS Data center, U.S Department of Labor Wage and Hour Division.
19
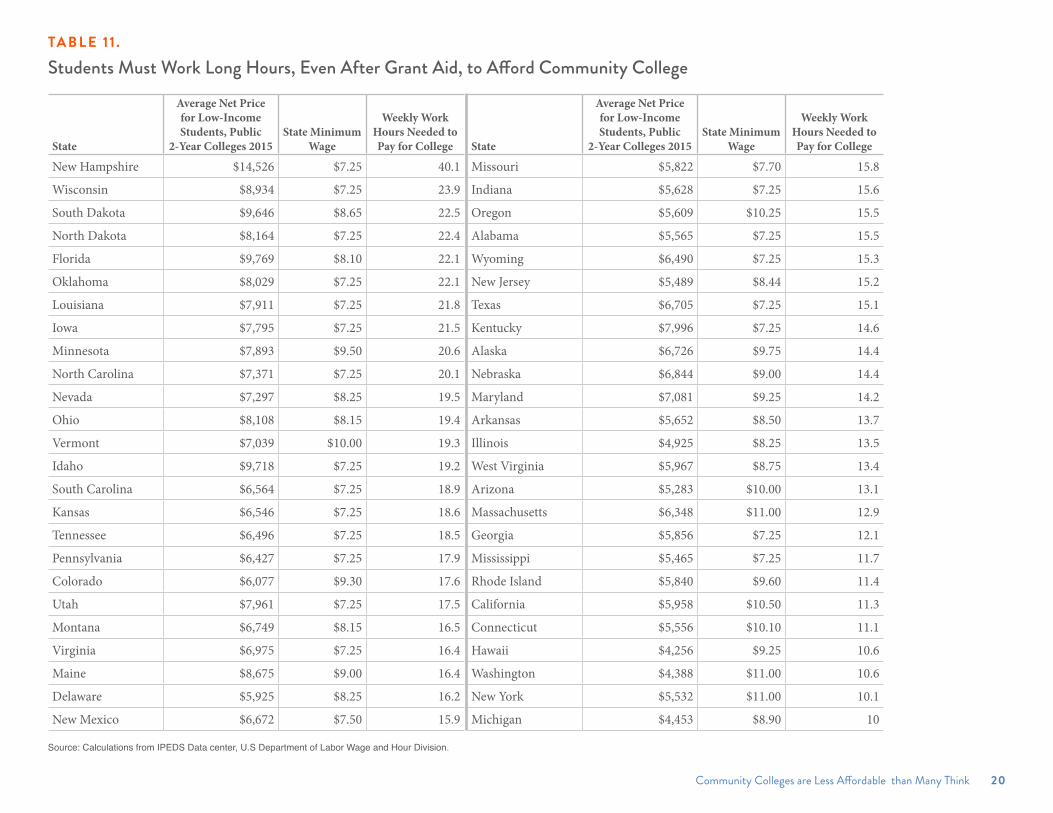
Community Colleges are Less Affordable than Many Think
In the popular imagination, public 2-year colleges are often seen as a more affordable alternative to public or private 4-year schools. Policy-makers on both sides of the aisle extol colleges that offer technical and vocational education, or low-cost introductory courses at relatively low tuition compared to 4-year schools. But even students in low- or free-tui-tion states must pay for books, living costs, transportation, other fees, and in many cases, child care. These costs are not covered by the meager grant aid students often receive. In short, despite rhetoric from some conserva-tives, it is a myth that community college is “already free” for students who receive grant or scholarship aid to defray tuition costs.20
As Table 11 shows, in 32 states, students must work more than 15 hours a week just to pay for community college—before they even begin to cover food, child care, or other basic needs. The 15-hour threshold is instructive, as studies find that working more than that is detrimen-tal to a student’s chances of academic success.21 By making low-income students work beyond the point at which they are likely to be successful (and not requiring the same of high-income students), our system per-petuates inequality both by requiring a larger financial burden of work-ing-class students, and increasing the likelihood that they will drop out. The best way to get students to a degree program is to provide the financial and other supports necessary to do so, rather than requiring them to layer excessive work hours on top of academic responsibilities.
Community Colleges are Less Affordable than Many Think 20
TA B L E 11 .
Students Must Work Long Hours, Even After Grant Aid, to Afford Community College
State
Average Net Price for Low-Income Students, Public
2-Year Colleges 2015State Minimum
Wage
Weekly Work Hours Needed to Pay for College
New Hampshire $14,526 $7.25 40.1
Wisconsin $8,934 $7.25 23.9
South Dakota $9,646 $8.65 22.5
North Dakota $8,164 $7.25 22.4
Florida $9,769 $8.10 22.1
Oklahoma $8,029 $7.25 22.1
Louisiana $7,911 $7.25 21.8
Iowa $7,795 $7.25 21.5
Minnesota $7,893 $9.50 20.6
North Carolina $7,371 $7.25 20.1
Nevada $7,297 $8.25 19.5
Ohio $8,108 $8.15 19.4
Vermont $7,039 $10.00 19.3
Idaho $9,718 $7.25 19.2
South Carolina $6,564 $7.25 18.9
Kansas $6,546 $7.25 18.6
Tennessee $6,496 $7.25 18.5
Pennsylvania $6,427 $7.25 17.9
Colorado $6,077 $9.30 17.6
Utah $7,961 $7.25 17.5
Montana $6,749 $8.15 16.5
Virginia $6,975 $7.25 16.4
Maine $8,675 $9.00 16.4
Delaware $5,925 $8.25 16.2
New Mexico $6,672 $7.50 15.9
State
Average Net Price for Low-Income Students, Public
2-Year Colleges 2015State Minimum
Wage
Weekly Work Hours Needed to Pay for College
Missouri $5,822 $7.70 15.8
Indiana $5,628 $7.25 15.6
Oregon $5,609 $10.25 15.5
Alabama $5,565 $7.25 15.5
Wyoming $6,490 $7.25 15.3
New Jersey $5,489 $8.44 15.2
Texas $6,705 $7.25 15.1
Kentucky $7,996 $7.25 14.6
Alaska $6,726 $9.75 14.4
Nebraska $6,844 $9.00 14.4
Maryland $7,081 $9.25 14.2
Arkansas $5,652 $8.50 13.7
Illinois $4,925 $8.25 13.5
West Virginia $5,967 $8.75 13.4
Arizona $5,283 $10.00 13.1
Massachusetts $6,348 $11.00 12.9
Georgia $5,856 $7.25 12.1
Mississippi $5,465 $7.25 11.7
Rhode Island $5,840 $9.60 11.4
California $5,958 $10.50 11.3
Connecticut $5,556 $10.10 11.1
Hawaii $4,256 $9.25 10.6
Washington $4,388 $11.00 10.6
New York $5,532 $11.00 10.1
Michigan $4,453 $8.90 10
Source: Calculations from IPEDS Data center, U.S Department of Labor Wage and Hour Division.
21
Public College Affordability is a Racial Justice Issue
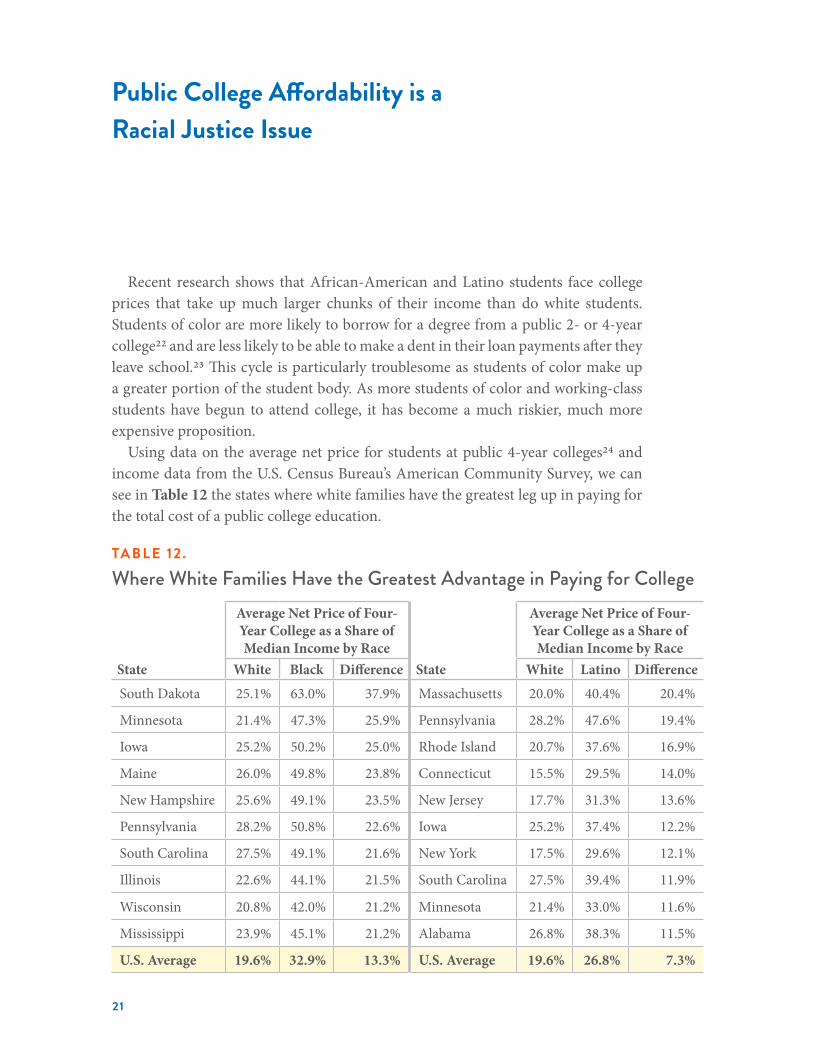
Recent research shows that African-American and Latino students face college prices that take up much larger chunks of their income than do white students. Students of color are more likely to borrow for a degree from a public 2- or 4-year college22 and are less likely to be able to make a dent in their loan payments after they leave school.23 This cycle is particularly troublesome as students of color make up a greater portion of the student body. As more students of color and working-class students have begun to attend college, it has become a much riskier, much more expensive proposition.
Using data on the average net price for students at public 4-year colleges24 and income data from the U.S. Census Bureau’s American Community Survey, we can see in Table 12 the states where white families have the greatest leg up in paying for the total cost of a public college education.
TA B L E 12.
Where White Families Have the Greatest Advantage in Paying for College
State
Average Net Price of Four-Year College as a Share of Median Income by Race
White Black Difference
South Dakota 25.1% 63.0% 37.9%
Minnesota 21.4% 47.3% 25.9%
Iowa 25.2% 50.2% 25.0%
Maine 26.0% 49.8% 23.8%
New Hampshire 25.6% 49.1% 23.5%
Pennsylvania 28.2% 50.8% 22.6%
South Carolina 27.5% 49.1% 21.6%
Illinois 22.6% 44.1% 21.5%
Wisconsin 20.8% 42.0% 21.2%
Mississippi 23.9% 45.1% 21.2%
U.S. Average 19.6% 32.9% 13.3%
State
Average Net Price of Four-Year College as a Share of Median Income by Race
White Latino Difference
Massachusetts 20.0% 40.4% 20.4%
Pennsylvania 28.2% 47.6% 19.4%
Rhode Island 20.7% 37.6% 16.9%
Connecticut 15.5% 29.5% 14.0%
New Jersey 17.7% 31.3% 13.6%
Iowa 25.2% 37.4% 12.2%
New York 17.5% 29.6% 12.1%
South Carolina 27.5% 39.4% 11.9%
Minnesota 21.4% 33.0% 11.6%
Alabama 26.8% 38.3% 11.5%
U.S. Average 19.6% 26.8% 7.3%
Public College Affordability is a Racial Justice Issue 22
Nationally, the net price of a public 4-year college—after students receive grants and scholarships—takes up a third of median black income, compared to a fifth of median white income. In 4 states (South Dakota, Pennsylvania, Iowa, and Maine), the average net price of a public 4-year college makes up half of a typical black family’s annual income, and in 26 states, net price makes up more than a third of that family’s annual earnings. In 13 states, college prices take up 20% more of a typical black family’s income than a typical white family’s income. South Dakota and Minnesota have the largest differ-ences between black and white families on this measure (see Table 12 above), and only 2 states—Hawaii and Montana—have no or almost no disparity between black and white households in the burden of paying for college.
The data tell a similar story for Latino families, who see greater financial burdens attending public colleges than white families in every state but 2—Maine and West Virginia. In 9 states, net price makes up more than a third of a year’s income. In Pennsylvania alone, the net price of a public 4-year college takes up half (47.6 percent) of a Pennsylvania Latino family’s income, compared to 28.2 percent of a typical white family’s income in the state. In Massachusetts, college prices take up just 20 percent of the average white family’s income, but 40 percent of a Latino family’s income, the largest such gap in the country.
Obviously, these figures are reflective of wage and earnings dis-parities between white families and families of color, and state pol-icymakers should work to reduce wage and wealth gaps through any policy mechanism available to them. Further, state leaders should understand that college is not the only financial obligation facing families: Accounting for other things such as food, child care, retirement savings, health care and other needs are likely to push families beyond the point at which they could reasonably meet all of their financial obligations. But these data should also be a wake-up call to higher education leaders and state officials who set prices without regard to racial disparities that those prices cause or perpetuate. The fact is that high net prices will have a greater impact on students if their families cannot rely on high annual earnings to either save for college beforehand, or pay off debts accrued later.
23
A Higher Price is Not the Only Consequence of Austerity
Of course, a lack of investment in public higher education can do more than just increase prices for students. When policymakers starve public colleges and universities of funding, colleges must consider a number of strategies, none of which tend to help working-class students.
Some institutions can recover lost revenue by enrolling more out-of-state students and charging greater tuition. And indeed, one study estimated that a $1,000 drop in per-student state funding correlates with a nearly 3 percent increase in out-of-state enrollment.25 In turn, an increase in out-of-state enrollment can drive down the number of low-income students or students of color, particularly at public research institu-tions. In other words, the institutions with the greatest resources have the opportunity to replace poorer, in-state students with wealthier, out-of-state students. In fact, as higher education overall has become more diverse, wealthy public colleges in many areas have remained stubbornly segregated. African-American enrollment has stagnated or even declined at elite public colleges and universities.26
Other institutions take even more drastic action in response to austerity measures. Faced with recession-era cuts, California community colleges cut course offerings by a quarter.27 Pennsylvania froze enrollment in nearly 200 programs and made deep cuts to its higher education workforce.28 Just last year, Missouri cut over $100 million from its public universities, which resulted in 474 layoffs.29 In Illinois, a politically manu-factured budget impasse led Chicago State, which educates primarily Af-rican-American and Latino students, to cut 300 employees.30
In addition to changing the mix of students who attend public colleges, cutting courses, or reducing staffing levels, institutions have increasing-ly relied on contingent and adjunct faculty as a way of lowering costs during an age of declining revenue. Between 1976 and 2011, the share of faculty who were part-time rose from 25 percent to 41 percent.31 Many contingent faculty are paid substandard wages and do not receive benefits, and nearly a quarter must rely on some type of public assistance.32 People of color tend to be underrepresented in the academy generally. While

A Higher Price is Not the Only Consequence of Austerity 24
only 10 percent of all faculty members are people of color, a full 75 percent of professors of color are contingent, meaning institutions are relegating faculty members of color primarily to jobs that have lower wages, fewer benefits, and less job security.
Budget cuts can have a number of impacts, and to be sure, in-stitutions can engage in multiple cost-cutting strategies simulta-neously. But the combination of higher prices, fewer academic offerings, fewer low-income students, and less job security for faculty can be a toxic mix—and do little to fulfill higher education’s promise as an engine of upward mobility.
25
At Most Public Colleges, Revenue is Down, Tuition is Up, and Runaway Spending is a Myth
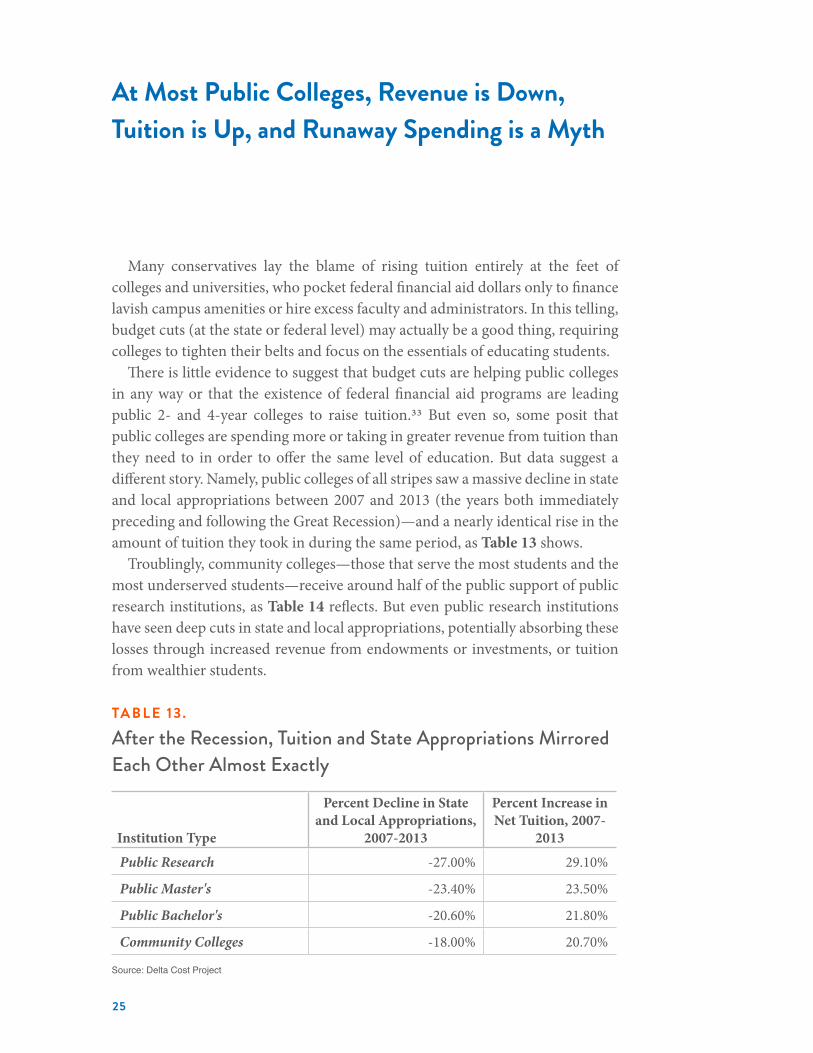
Many conservatives lay the blame of rising tuition entirely at the feet of colleges and universities, who pocket federal financial aid dollars only to finance lavish campus amenities or hire excess faculty and administrators. In this telling, budget cuts (at the state or federal level) may actually be a good thing, requiring colleges to tighten their belts and focus on the essentials of educating students.
There is little evidence to suggest that budget cuts are helping public colleges in any way or that the existence of federal financial aid programs are leading public 2- and 4-year colleges to raise tuition.33 But even so, some posit that public colleges are spending more or taking in greater revenue from tuition than they need to in order to offer the same level of education. But data suggest a different story. Namely, public colleges of all stripes saw a massive decline in state and local appropriations between 2007 and 2013 (the years both immediately preceding and following the Great Recession)—and a nearly identical rise in the amount of tuition they took in during the same period, as Table 13 shows.
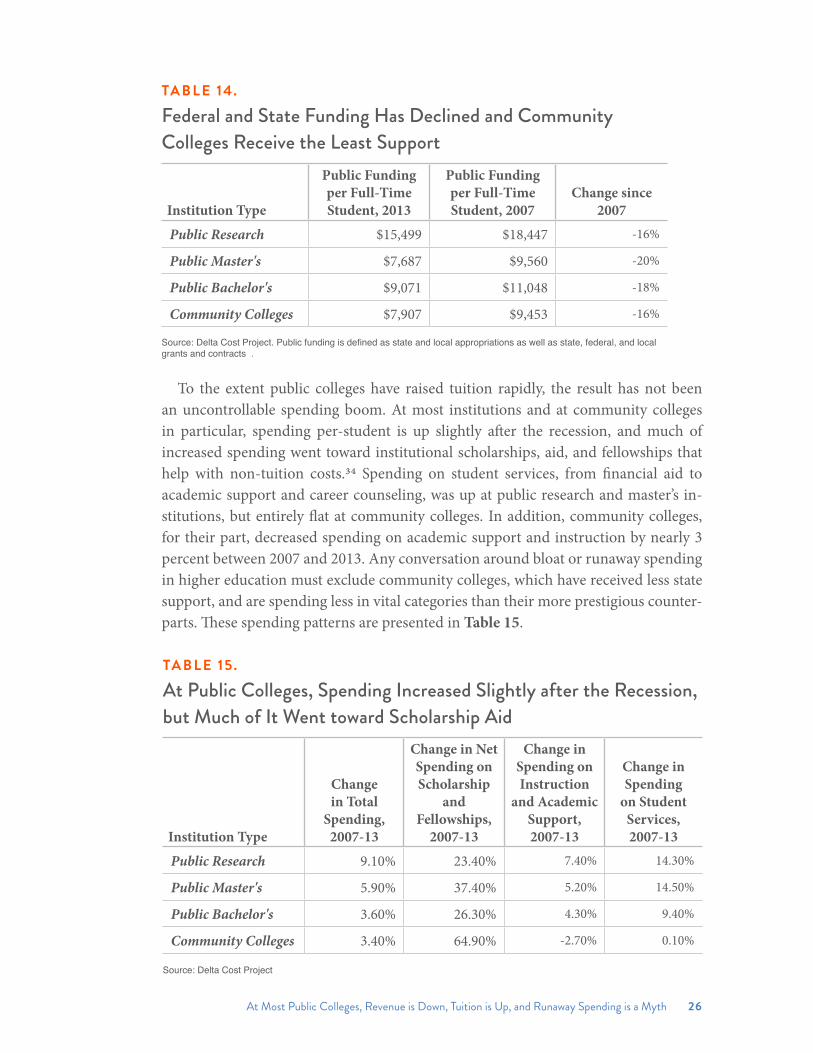
Troublingly, community colleges—those that serve the most students and the most underserved students—receive around half of the public support of public research institutions, as Table 14 reflects. But even public research institutions have seen deep cuts in state and local appropriations, potentially absorbing these losses through increased revenue from endowments or investments, or tuition from wealthier students.
TA B L E 13.
After the Recession, Tuition and State Appropriations Mirrored Each Other Almost Exactly
Source: Delta Cost Project
Institution Type
Percent Decline in State and Local Appropriations,
2007-2013
Percent Increase in Net Tuition, 2007-
2013
Public Research -27.00% 29.10%
Public Master's -23.40% 23.50%
Public Bachelor's -20.60% 21.80%
Community Colleges -18.00% 20.70%
At Most Public Colleges, Revenue is Down, Tuition is Up, and Runaway Spending is a Myth 26
Institution Type
Change in Total
Spending, 2007-13
Change in Net Spending on Scholarship
and Fellowships,
2007-13
Change in Spending on Instruction
and Academic Support, 2007-13
Change in Spending
on Student Services, 2007-13
Public Research 9.10% 23.40% 7.40% 14.30%
Public Master's 5.90% 37.40% 5.20% 14.50%
Public Bachelor's 3.60% 26.30% 4.30% 9.40%
Community Colleges 3.40% 64.90% -2.70% 0.10%
TA B L E 14.
Federal and State Funding Has Declined and Community Colleges Receive the Least Support
Source: Delta Cost Project. Public funding is defined as state and local appropriations as well as state, federal, and local grants and contracts .
Institution Type
Public Funding per Full-Time Student, 2013
Public Funding per Full-Time Student, 2007
Change since 2007
Public Research $15,499 $18,447 -16%
Public Master's $7,687 $9,560 -20%
Public Bachelor's $9,071 $11,048 -18%
Community Colleges $7,907 $9,453 -16%
TA B L E 15.
At Public Colleges, Spending Increased Slightly after the Recession, but Much of It Went toward Scholarship Aid
Source: Delta Cost Project
To the extent public colleges have raised tuition rapidly, the result has not been an uncontrollable spending boom. At most institutions and at community colleges in particular, spending per-student is up slightly after the recession, and much of increased spending went toward institutional scholarships, aid, and fellowships that help with non-tuition costs.34 Spending on student services, from financial aid to academic support and career counseling, was up at public research and master’s in-stitutions, but entirely flat at community colleges. In addition, community colleges, for their part, decreased spending on academic support and instruction by nearly 3 percent between 2007 and 2013. Any conversation around bloat or runaway spending in higher education must exclude community colleges, which have received less state support, and are spending less in vital categories than their more prestigious counter-parts. These spending patterns are presented in Table 15.

27
Conclusion: Make Public Higher Education Public Again
A well-functioning, well-funded system of public higher education is essential for our democracy broadly, but it is also essential for the communities in which public institutions are the center. The unfulfilled promise of land-grant colleges, the GI Bill, the Pell Grant, and other big investments is that every American, regardless of race or class, should be able to better themselves and follow their academic and career path.
As our population has become less white and more economically unequal, policymakers have broken that promise. A generation that enjoyed a generously funded system—one which in which the public took responsibility for public higher education, enabling students to fund college on a part-time job—has pulled up the ladder. In its stead, we have created a system built on ever-increas-ing student debt and assumptions that colleges should do “more with less,” as if the very notion of less public funding is a necessity and not a political choice. To make public higher education the ladder it once was, we must make public higher education public again.
Conclusion: Make Public Higher Education Public Again 28
about the data
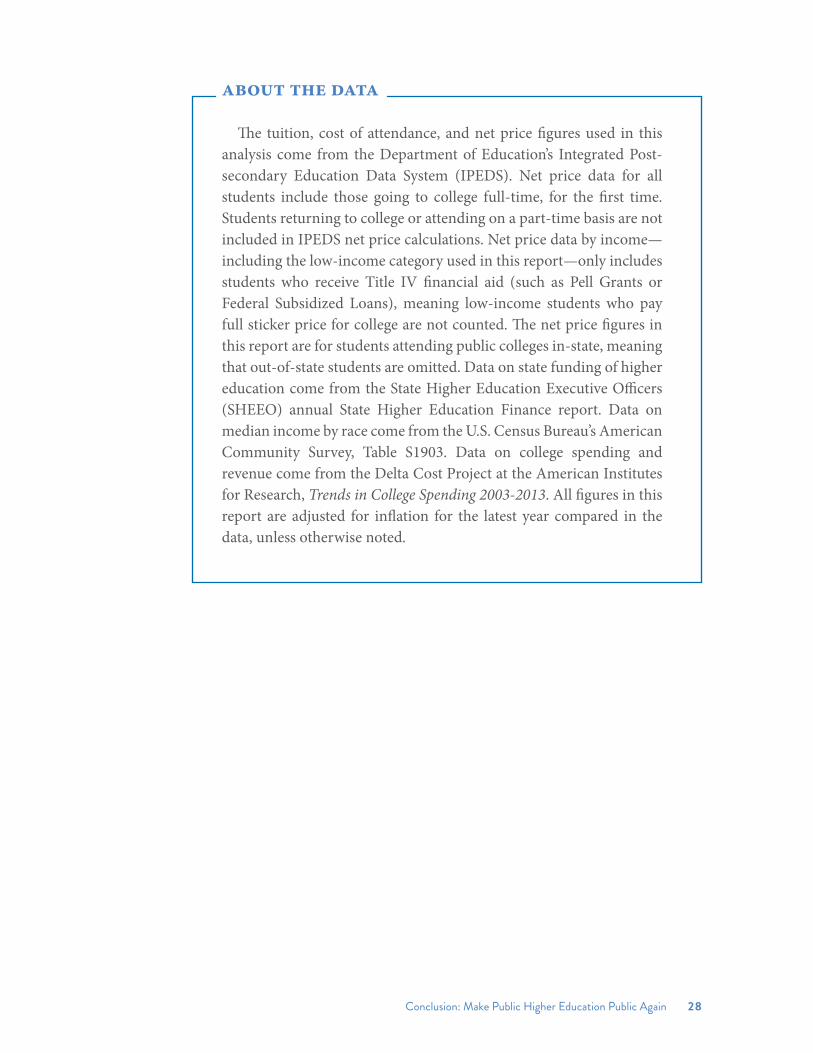
The tuition, cost of attendance, and net price figures used in this analysis come from the Department of Education’s Integrated Post-secondary Education Data System (IPEDS). Net price data for all students include those going to college full-time, for the first time. Students returning to college or attending on a part-time basis are not included in IPEDS net price calculations. Net price data by income—including the low-income category used in this report—only includes students who receive Title IV financial aid (such as Pell Grants or Federal Subsidized Loans), meaning low-income students who pay full sticker price for college are not counted. The net price figures in this report are for students attending public colleges in-state, meaning that out-of-state students are omitted. Data on state funding of higher education come from the State Higher Education Executive Officers (SHEEO) annual State Higher Education Finance report. Data on median income by race come from the U.S. Census Bureau’s American Community Survey, Table S1903. Data on college spending and revenue come from the Delta Cost Project at the American Institutes for Research, Trends in College Spending 2003-2013. All figures in this report are adjusted for inflation for the latest year compared in the data, unless otherwise noted.

29
Endnotes
1. “Postsecondary Education Aspirations and Barriers,” Gallup and Lumina Foundation, 2014, http://news.gallup.com/poll/182462/postsecondary-education-aspirations-barriers.aspx.
2. “Education at a Glance 2017: OECD Indicators,” Organisation for Economic Co-operation and Development, September 12, 2017, http://www.oecd.org/edu/education-at-a-glance-19991487.htm.
3. Michael Hout, “Social and Economic Returns to College Education in the United States,” Annual Review of Sociology 38, no. 1 (2012): 379-400. doi:10.1146/annurev.soc.012809.102503.
4. Wilson Smith and Thomas Bender, American Higher Education Transformed, 1940-2005: Documenting the National Discourse (Baltimore, MD: The Johns Hopkins University Press, 2008).
5. In the American Recovery and Reinvestment Act, Congress mandated that states not cut higher education below a certain level as a condition of receiving stimulus funds. In addition, the Leveraging Education Assistance Partnerships (LEAP) program provided states with funding on the condition that they set up need-based grant aid programs for students.
6. “Trends in Student Aid 2017,” College Board, 2017, https://trends.collegeboard.org/student-aid.7. Ben Miller, New Federal Data Show a Student Loan Crisis for African American Borrowers, Center for
American Progress, October 19, 2017. https://www.americanprogress.org/issues/education-postsecondary/news/2017/10/16/440711/new-federal-data-show-student-loan-crisis-african-american-borrowers/.
8. Angela Boatman, Brent J. Evans, and Adela Soliz, “Understanding Loan Aversion in Education,” 2017, AERA Open 3 (1); Sara Goldrick-Rab and Robert Kelchen, “Making Sense of Loan Aversion: Evidence from Wisconsin,” Student Loans and the Dynamics of Debt, 317–78 (2015). doi:10.17848/9780880994873.ch10.
9. Michael Mitchell, Michael Leachman, and Kathleen Masterson, A Lost Decade in Higher Education Funding, Center on Budget and Policy Priorities, August 23, 2017. https://www.cbpp.org/research/state-budget-and-tax/a-lost-decade-in-higher-education-funding.
10. Gillian B. White, “The Recession’s Racial Slant,” The Atlantic, June 24, 2015. https://www.theatlantic.com/business/archive/2015/06/black-recession-housing-race/396725/.
11. John Quinterno and Viany Orozco, The Great Cost Shift, Dēmos, April 3, 2012. http://www.demos.org/publication/great-cost-shift-how-higher-education-cuts-undermine-future-middle-class.
12. U.S. Department of Education, National Center for Education Statistics, Higher Education General Information Survey (HEGIS), “Fall Enrollment in Colleges and Universities” surveys, 1976 and 1980; Integrated Postsecondary Education Data System (IPEDS), “Fall Enrollment Survey” (IPEDS-EF:90); and IPEDS Spring 2001 through Spring 2016, Fall Enrollment component. (This table was prepared October 2016.)
13. Douglas A. Webber, “State Divestment and Tuition at Public Institutions,” Economics of Education Review 60 (October 2017): 1-4. doi:10.1016/j.econedurev.2017.07.007.
14. “Trends in Student Aid 2017,” College Board, 2017. https://trends.collegeboard.org/ 2001 tuition figure adjusted for inflation.
15. Richard Kahlenberg, How Higher Education Funding Shortchanges Community Colleges, The Century Foundation, March 10, 2017. https://tcf.org/content/report/how-higher-education-funding-shortchanges-community-colleges/.
16. Ben Myers, “How Colleges Give Students a Flawed Sense of Living Costs,” Chronicle of Higher Education, July 10, 2017. https://www.chronicle.com/interactives/cost-of-living; Robert Kelchen, Sara Goldrick-Rab, and Braden Hosch, “The Costs of College Attendance: Examining Variation and Consistency in Institutional Living Cost Allowances,” The Journal of Higher Education 88, no. 6 (2017): 947-71. doi:10.1080/00221546.2016.1272092.
17. Rick Seltzer, “Turning Down Top Choices,” Inside Higher Ed, March 23, 2017. https://www.insidehighered.
Endnotes 30
com/news/2017/03/23/study-shows-how-price-sensitive-students-are-selecting-colleges; “A Majority of Students Rule Out Colleges Based on Sticker Price,” Art & Science Group, September, 2012. https://www.artsci.com/insights/studentpoll/volume-9-issue-1.
18. The IPEDS net price data for low-income students includes students from families making under $30,000 annually who were awarded Title IV federal financial aid.
19. Melanie Kruvelis, Lindsey Reichlin Cruse, and Barbara Gault, Single Mothers in College: Growing Enrollment, Financial Challenges, and the Benefits of Attainment, Institute for Women’s Policy Research, September 20, 2017. https://iwpr.org/publications/single-mothers-college-growing-enrollment-financial-challenges-benefits-attainment/.
20. “Lamar Alexander Responds to President Obama’s Free College Plan,” WCYB May 24, 2016. Accessed December 13, 2017. http://www.wcyb.com/news/lamar-alexander-responds-to-president-obamas-free-college-plan/14267301.
21. Sarah Blanchard Kyte, Who Does Work Work For? ACT Center for Equity in Learning, July 2017. https://equityinlearning.act.org/research-doc/who-does-work-work-for/.
22. Mark Huelsman, The Debt Divide: The Racial and Class Bias Behind the New Normal of Student Borrowing, Dēmos, May 19, 2015. http://www.demos.org/publication/debt-divide-racial-and-class-bias-behind-new-normal-student-borrowing.
23. Miller (2017).24. Whereas the data above show the average net price for low-income students (from families making under
$30,000 annually), the net price figures used in these calculations are for all degree-seeking full-time students attending college for the first time.
25. Ozan Jaquette and Bradley R. Curs, “Creating the Out-of-State University: Do Public Universities Increase Nonresident Freshman Enrollment in Response to Declining State Appropriations?” Research in Higher Education 56, no. 6 (2015): 535-65. doi:10.1007/s11162-015-9362-2.
26. Andrew McGill, “The Missing Black Students at Elite American Universities,” The Atlantic, November 23, 2015. https://www.theatlantic.com/politics/archive/2015/11/black-college-student-body/417189/.
27. Michelle Maitre, “Community College Enrollment, Course Offerings Rebounding, Survey Indicates.” EdSource, September 11, 2013. https://edsource.org/2013/community-college-enrollment-course-offerings-rebounding-campus-survey-indicates/38820.
28. Ry Rivard, “Wither Pennsylvania,” Inside Higher Ed, December 2, 2013. https://www.insidehighered.com/news/2013/12/02/pennsylvanias-14-university-system-feeling-pain-budget-cuts-and-demographic-shifts.
29. Ashley Jost, “Details on University of Missouri Cuts: 474 Jobs Cut; Mizzou Takes the Biggest Hit,” St. Louis Post Dispatch, June 03, 2017. http://www.stltoday.com/news/local/education/details-on-university-of-missouri-cuts-jobs-cut-mizzou-takes/article_254f5a3e-f127-579a-80bb-906c282c45dc.html.
30. Jon Marcus, “Nationwide, State Budget Cuts Disproportionately Hit Low-Income, Minority College Students,” PBS, January 03, 2017. https://www.pbs.org/newshour/education/divided-learn-state-budgets-cuts-hit-poorer-minority-college-students.
31. Lydia DePillis, “Adjunct Professors Get Poverty-Level Wages. Should Their Pay Quintuple?” The Washington Post, February 06, 2015. https://www.washingtonpost.com/news/wonk/wp/2015/02/06/adjunct-professors-get-poverty-level-wages-should-their-pay-quintuple/?utm_term=.e19c5d707dbf.
32. Ken Jacobs, Ian Perry, and Jenifer MacGillvary, The High Public Cost of Low Wages, UC Berkeley Labor Center. April 2015. http://laborcenter.berkeley.edu/pdf/2015/the-high-public-cost-of-low-wages.pdf.
33. Adam Stoll, David Bradley, and Shannon M. Mahan, Overview of the Relationship between Federal Student Aid and Increases in College Prices, Congressional Research Service, August 22, 2014. http://c.ymcdn.com/sites/www.ncher.us/resource/collection/1CFB07FA-74C6-4F0A-8E79-3ADB2C453546/R43692.pdf.
34. The Delta Cost project defines “net scholarships and fellowships” as “Institutional spending on scholarships and fellowships net of allowances. Does not include federal aid, tuition waivers, or tuition discounts (which since 1998 have been reported as waivers). It is a residual measure that captures any remaining aid after it is applied to tuition and auxiliaries.”

D E M O S . O R G