90 percent of filtered HCO 3 –. NH 4 + NH 3 H + HCO 3 - 1mMol/Kg/day GLUTAMINE NH 3 H+H+ Distal...
28
90 90 percent percent of of filtered filtered HCO HCO 3 –
-
Upload
frederica-mckenzie -
Category
Documents
-
view
219 -
download
1
Transcript of 90 percent of filtered HCO 3 –. NH 4 + NH 3 H + HCO 3 - 1mMol/Kg/day GLUTAMINE NH 3 H+H+ Distal...
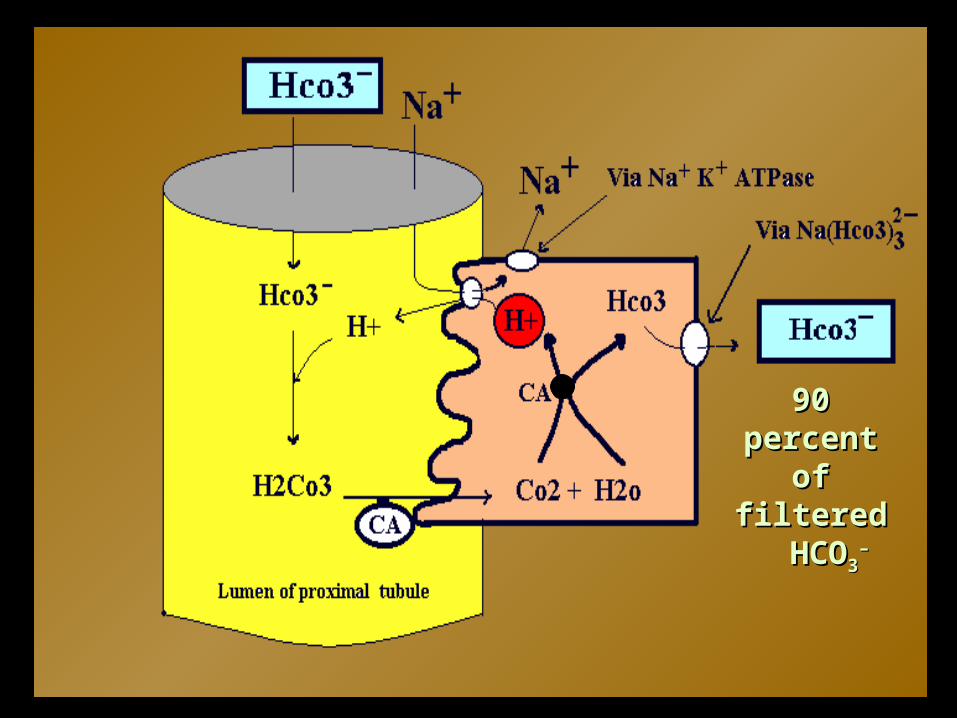
90 percent 90 percent of filteredof filtered HCO HCO33
––

NH4+
NH3
H+
HCO3-
1mMol/Kg/day
GLUTAMINE
NH3
H+
DistalPretubular Cell
K+
GFR
AmmoniogenesisAmmoniogenesisactively synthesize HCO3
– in addition
to secreting H+.
HPOHPO442–2– (pK 6.8) excretion in the urine is (pK 6.8) excretion in the urine is
anotheranother mechanism for Hmechanism for H++ elimination elimination HH++ is trapped in the urine as the acid is trapped in the urine as the acid
H2POH2PO44––
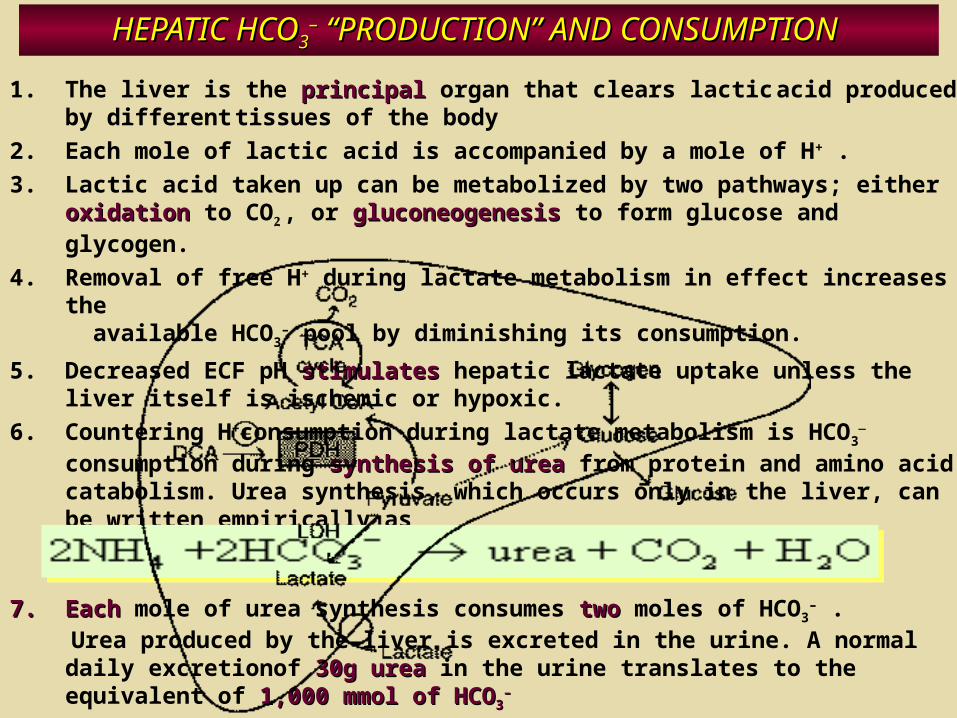
HEPATIC HCOHEPATIC HCO33–– “PRODUCTION” AND CONSUMPTION “PRODUCTION” AND CONSUMPTION
1. The liver is the principalprincipal organ that clears lactic acid produced by different tissues of the body
2. Each mole of lactic acid is accompanied by a mole of H+ .
3. Lactic acid taken up can be metabolized by two pathways; either oxidationoxidation to CO2 , or gluconeogenesisgluconeogenesis to form glucose and glycogen.
4. Removal of free H+ during lactate metabolism in effect increases the available HCO3
– pool by diminishing its consumption.
5. Decreased ECF pH stimulatesstimulates hepatic lactate uptake unless the liver itself is ischemic or hypoxic.
6. Countering H+consumption during lactate metabolism is HCO3–
consumption during synthesis of ureasynthesis of urea from protein and amino acid catabolism. Urea synthesis, which occurs only in the liver, can be written empirically as
7.7. EachEach mole of urea synthesis consumes twotwo moles of HCO3– .
Urea produced by the liver is excreted in the urine. A normal daily excretionof 30g urea30g urea in the urine translates to the equivalent of 1,000 1,000 mmol of HCOmmol of HCO33
––
ANALYTIC TOOLS USED IN ACID-BASE CHEMISTRY
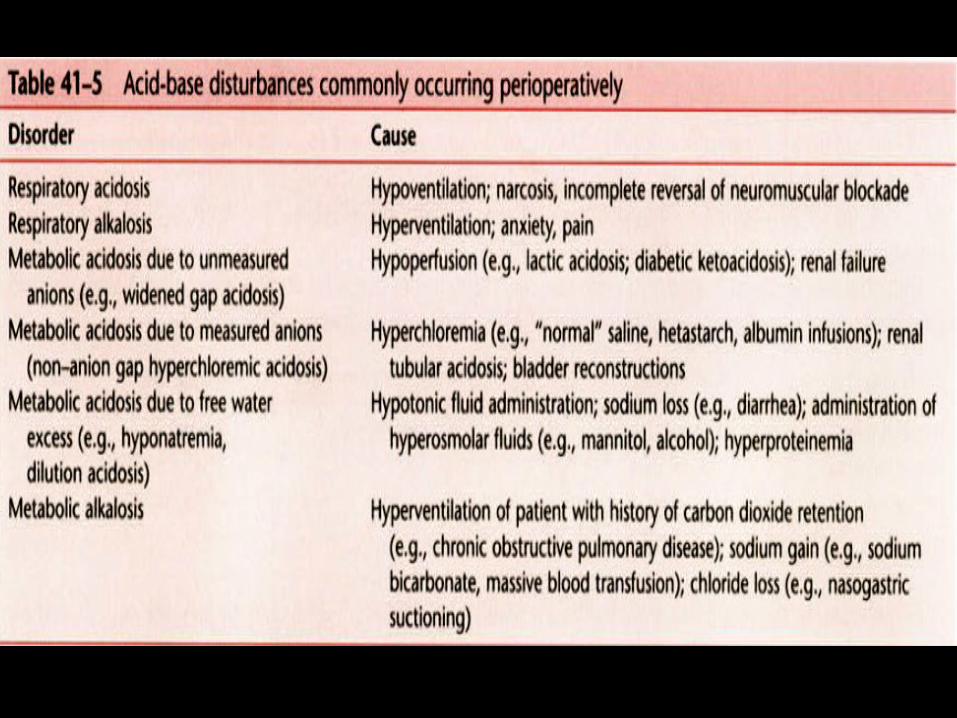
• The clinical significance of acid-base perturbations is determined by the underlying cause rather than the serum concentration of hydrogen and hydroxyl ions.
• The accuracy of acid-base measurements, however, is not determined by the blood gas value alone, which measures volatile acid and pH.
• Rather, measurement of each of the strong and weak ions that influence water dissociation, although cumbersome, is essential.

Carbon Dioxide-Bicarbonate (Boston) Approach
First, the approach is not as simple as it seems,
requiring the clinician to refer to confusing maps or
to learn formulas and perform mental arithmetic.
Second, the system neither explains nor accounts
for many of the complex acid-base abnormalities
Many physicians have incorrectly Many physicians have incorrectly assigned the increase in HCOassigned the increase in HCO33
- - as as compensation for raised PCOcompensation for raised PCO22 . .
It is not.It is not.
The increased HCOThe increased HCO3 3 -- concentration concentration
reflects increased total COreflects increased total CO22 in the body. in the body. Alterations in HCOAlterations in HCO3 3
-- reflect its role as a reflect its role as a buffer, CObuffer, CO22 by-product, and weak acid. by-product, and weak acid.
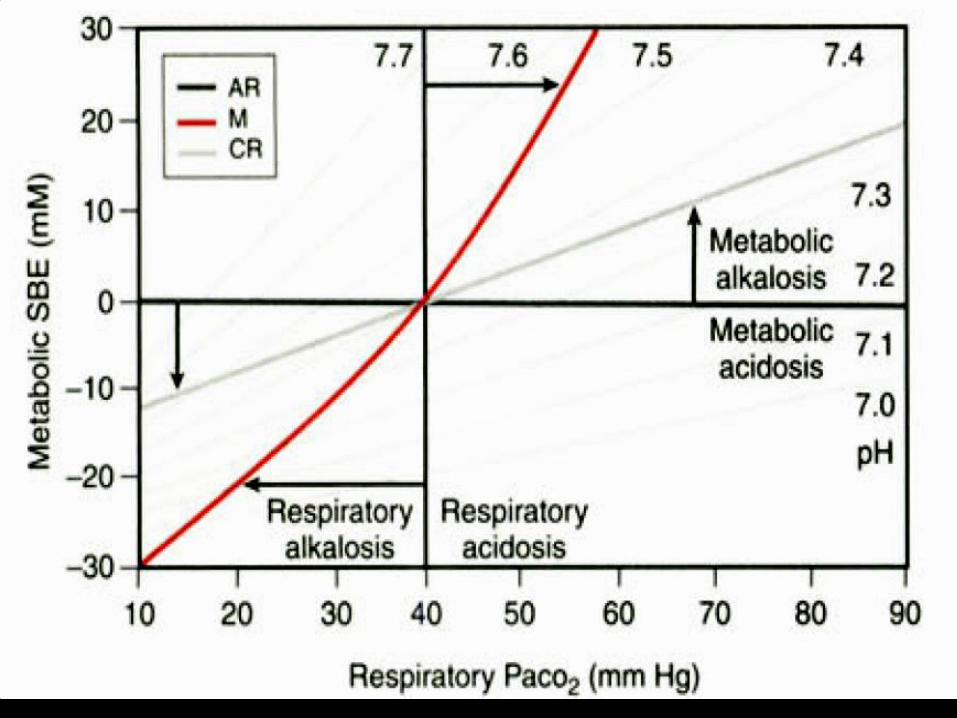
Base Deficit or Excess Base Deficit or Excess (Copenhagen) Approach(Copenhagen) Approach
• Whole blood buffer base (BB)
• The sum of the bicarbonate and the nonvolatile buffer ions (essentially the serum albumin, phosphate, and hemoglobin)
• Normally, BB = [Na+ ] + [K+ ] − [Cl− ].
• The major drawback of the use of buffer base measurements is the potential for changes in buffering capacity associated with alterations in hemoglobin concentration.
Base Deficit or Excess Base Deficit or Excess (Copenhagen) Approach(Copenhagen) Approach
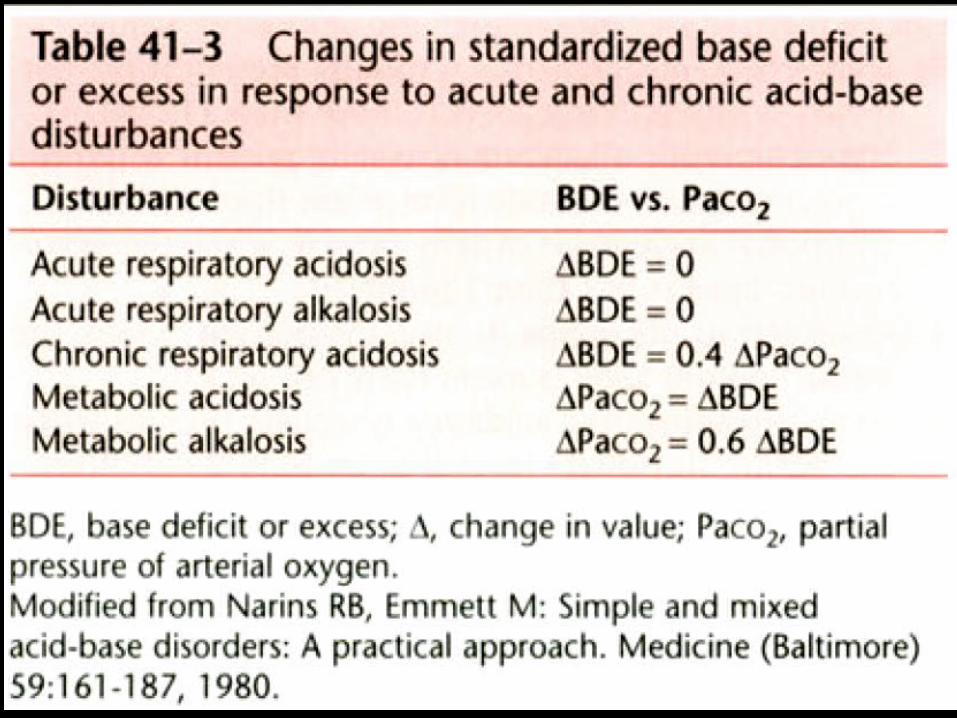
• In 1958, Siggard-Anderson and colleagues developed a simpler measure of metabolic acid-base activity, the BDE (base deficit or excess).
• They defined the BDE as the amount of strong acid or base required to return pH to 7.4, assuming a PCO2 of 40 mm Hg and temperature of 38°C.
• in the 1960s : (nomograms ) standardized base excess (SBE)
• SBE = 0.9287 × [ HCO3− − 24.4 + (pH − 7.4)]

Base Deficit or Excess (Copenhagen) Approach
• These measures may miss the presence of an acid-base disturbance entirely; for example a hypoalbuminemic (metabolic alkalosis), critically ill patient with a lactic acidosis may have a normal range pH, bicarbonate, and BE. This may lead to inappropriate therapy.
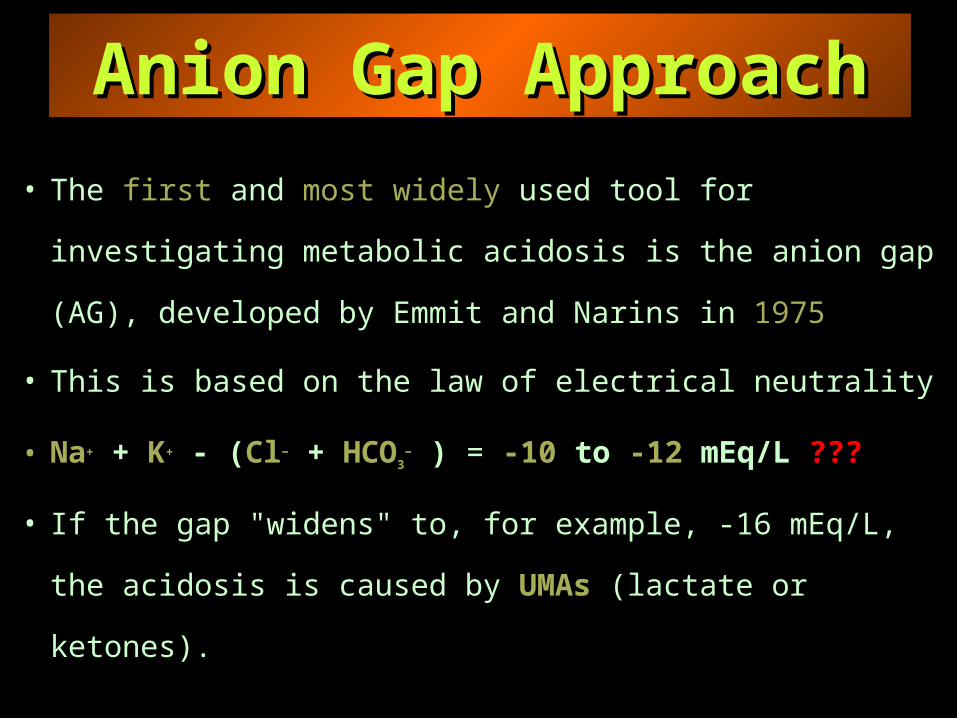
Anion Gap ApproachAnion Gap Approach
• The first and most widely used tool for investigating
metabolic acidosis is the anion gap (AG), developed
by Emmit and Narins in 1975
• This is based on the law of electrical neutrality
• Na+ + K+ - (Cl− + HCO3− ) = -10 to -12 mEq/L ???
• If the gap "widens" to, for example, -16 mEq/L, the
acidosis is caused by UMAs (lactate or ketones).

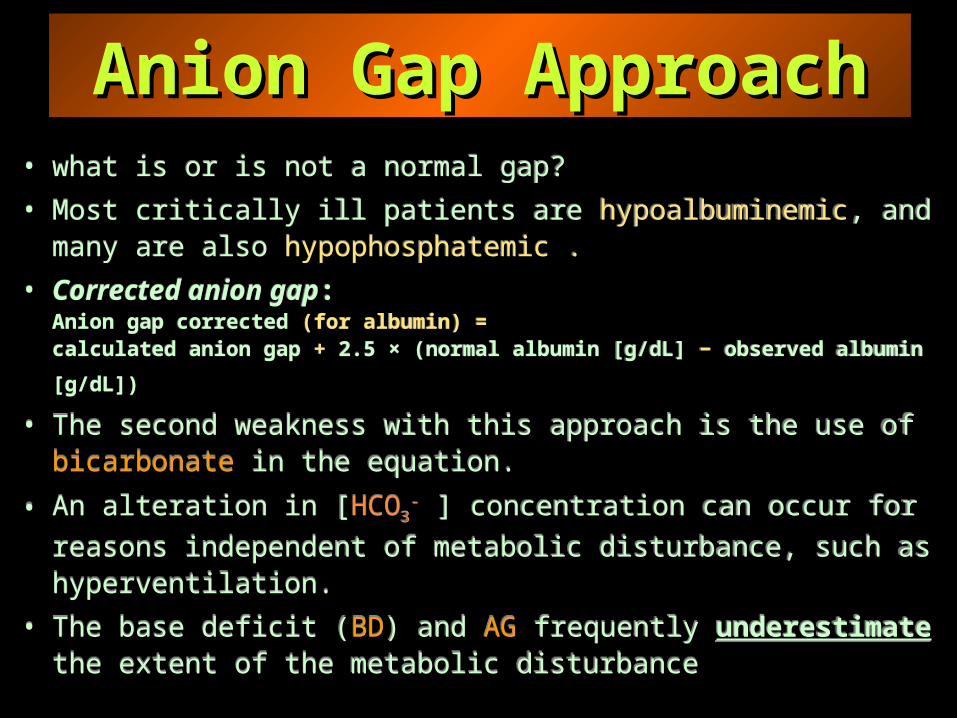
• what is or is not a normal gap?
• Most critically ill patients are hypoalbuminemic, and many are also hypophosphatemic .
• Corrected anion gap:Anion gap corrected (for albumin) =
calculated anion gap + 2.5 × (normal albumin [g/dL] − observed albumin [g/dL])
• The second weakness with this approach is the use of bicarbonate in the equation.
• An alteration in [HCO3- ] concentration can occur for reasons
independent of metabolic disturbance, such as hyperventilation.
• The base deficit (BD) and AG frequently underestimate the extent of the metabolic disturbance
Anion Gap ApproachAnion Gap Approach

A more accurate reflection of true acid-base status
SID= [(Na+ + Mg2+ + Ca2+ + K+ ) − (Cl− + A− )] = 40 to 44mEq/L
[Cl− ]corrected = [Cl− ]observed × ([Na+ ]normal/[Na+ ]observed)
Stewart-Fencl ApproachStewart-Fencl Approach
SIDeSIDa
Strong
CationsStrong
Anions
SIDa = ( [Na+ ] + [K+ ] + [Mg2+ ] + [Ca2+ ] ) − [Cl− ]
•SIDe = [HCO3− ] + (charge on albumin) +
(charge on inorganic phosphate [Pi]) (in mmol/L)
The normal SIG as 8 ± 2 mEq/L.

• BDE = Standard BDE
• CBE = Calculated BDE
• BEG = BDE − CBE
• BEfw = Changes in free water = 0.3 × (Na − 140)
• BECl = Changes in chloride = 102 − (Cl − 140/Na)
• BEalb = Changes in albumin = 3.4 × (4.5 − albumin)
• CBE = BEfw + BECl + BEalb
Stewart-Fencl ApproachStewart-Fencl Approach

1. Hyperchloremic acidemia: [Cl− ]corrected > 112 mEq/L.
2. Hypochloremic alkalemia: [Cl− ]corrected < 100 mEq/L.
3. Dilutional acidemia : serum sodium < 136 mEq/L
4. Contraction alkalemia : serum sodium > 148 mEq/L
5. Hyperphosphatemic acidemia : [Pi] > 2.0 mmol/L
6. Hypoalbuminemic alkalosis : [alb] < 3.5 g/dL
Stewart-Fencl ApproachStewart-Fencl Approach
[Cl− ] corrected = [Cl− ] observed × ([Na+ ] normal / [Na+ ] observed)
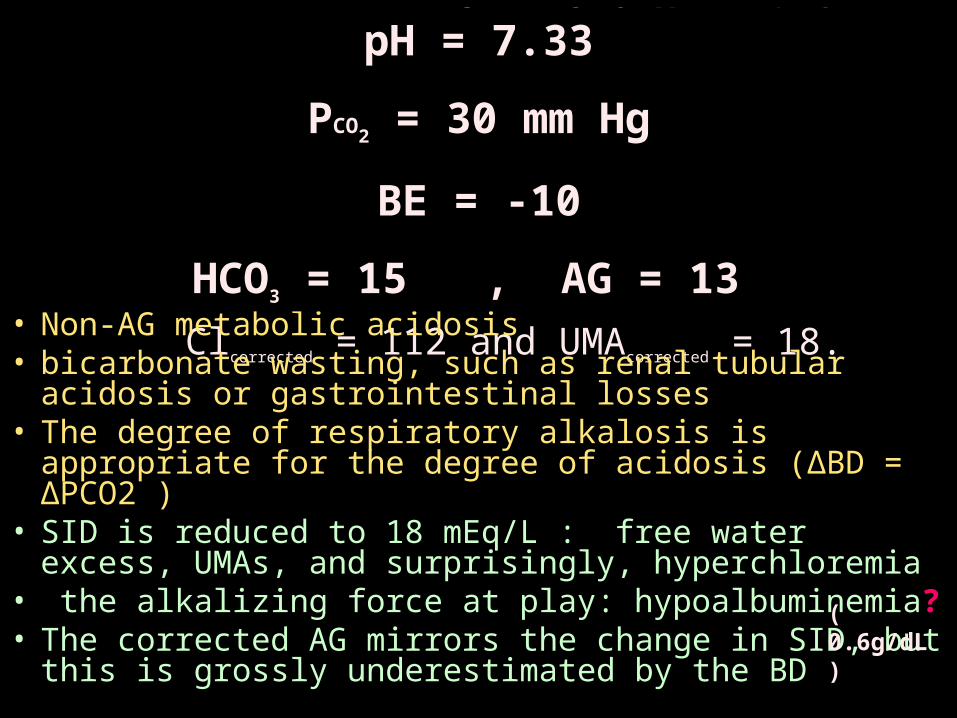
Na = 117 K = 3.9 Ca = 3.0 Mg = 1.4 Cl = 92 Pi = 0.6 mmol/Lalbumin = 6.0 g/L pH = 7.33 PCO2 = 30 mm Hg HCO3 = 15 AG = 13 AGcorrected = 23 BE = -10 SID = 18 Clcorrected = 112 and UMAcorrected = 18.
• Non-AG metabolic acidosis• bicarbonate wasting, such as renal tubular acidosis or
gastrointestinal losses• The degree of respiratory alkalosis is appropriate for
the degree of acidosis (ΔBD = ΔPCO2 )• SID is reduced to 18 mEq/L : free water excess,
UMAs, and surprisingly, hyperchloremia• the alkalizing force at play: hypoalbuminemia? • The corrected AG mirrors the change in SID, but
this is grossly underestimated by the BD
( 0.6g/dL )
pH = 7.33
PCO2 = 30 mm Hg
BE = -10
HCO3 = 15 , AG = 13
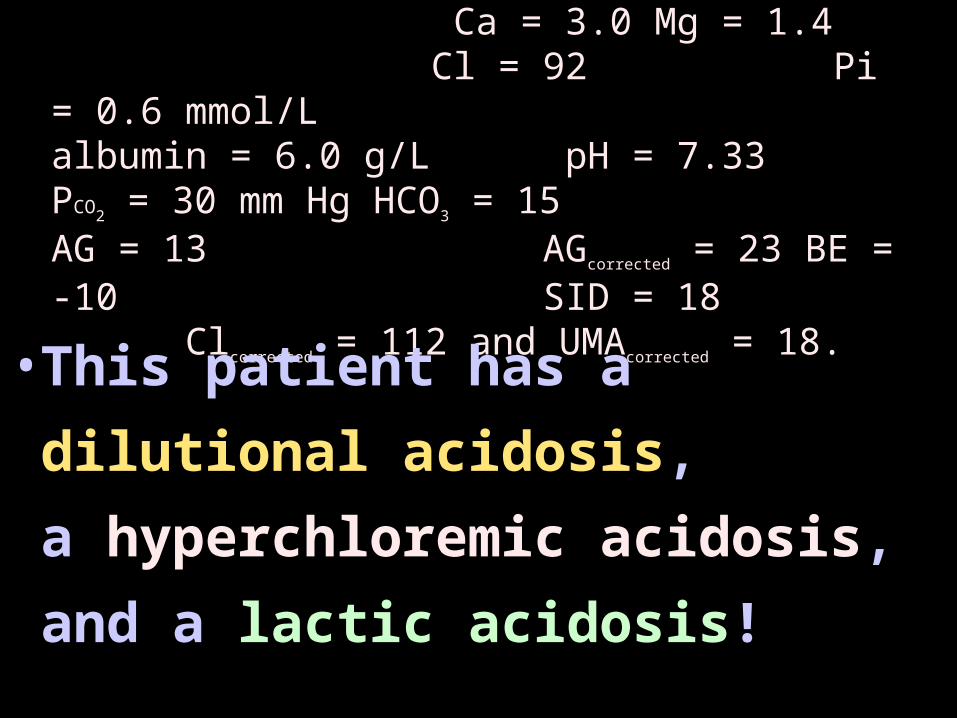
Na = 117 K = 3.9 Ca = 3.0 Mg = 1.4 Cl = 92 Pi = 0.6 mmol/Lalbumin = 6.0 g/L pH = 7.33 PCO2 = 30 mm Hg HCO3 = 15 AG = 13 AGcorrected = 23 BE = -10 SID = 18 Clcorrected = 112 and UMAcorrected = 18.
• This patient has a
dilutional acidosis,
a hyperchloremic acidosis,
and a lactic acidosis!
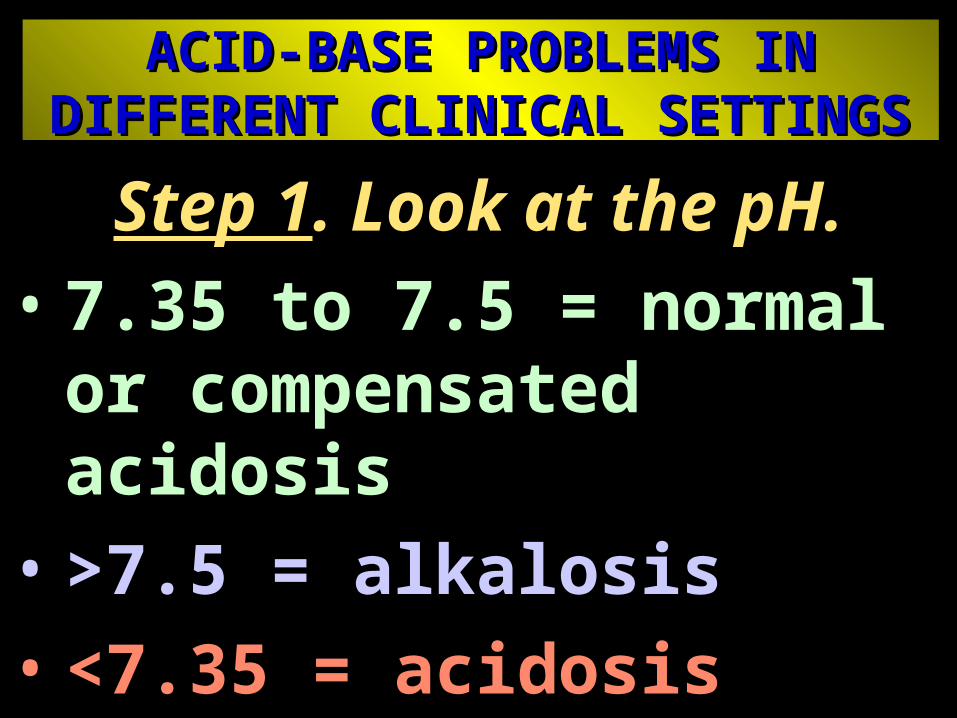
ACID-BASE PROBLEMS IN ACID-BASE PROBLEMS IN DIFFERENT CLINICAL SETTINGSDIFFERENT CLINICAL SETTINGS
Step 1. Look at the pH.• 7.35 to 7.5 = normal or
compensated acidosis
• >7.5 = alkalosis
• <7.35 = acidosis

ACID-BASE PROBLEMS IN DIFFERENT CLINICAL SETTINGS
•Step 2. Look for respiratory component (volatile acid = CO2 ).
• PCO2 = 35 to 45 (normal range)
• PCO2 < 35 mm Hg = respiratory alkalosis or compensation for metabolic acidosis (if so, BD > -5).
• PCO2 >45 = respiratory acidosis acute if pH < 7.35; chronic if pH in normal range and BE > 5
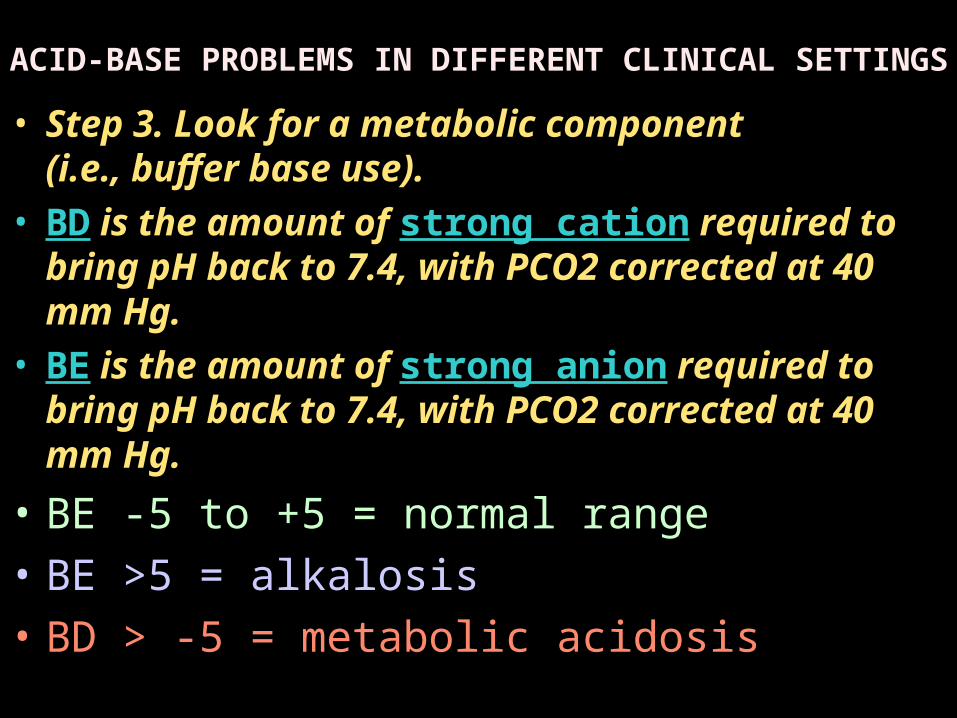
• Step 3. Look for a metabolic component (i.e., buffer base use).
• BD is the amount of strong cation required to bring pH back to 7.4, with PCO2 corrected at 40 mm Hg.
• BE is the amount of strong anion required to bring pH back to 7.4, with PCO2 corrected at 40 mm Hg.
• BE -5 to +5 = normal range
• BE >5 = alkalosis
• BD > -5 = metabolic acidosis
ACID-BASE PROBLEMS IN DIFFERENT CLINICAL SETTINGS

1 Acidosis, CO2 < 35 mm Hg, ± BD > -5 = • acute metabolic acidosis acute metabolic acidosis
2 Normal-range pH, CO2 < 35, BD > -5 = • acute metabolic acidosis plus compensation acute metabolic acidosis plus compensation
3 Acidosis, PCO2 > 45, normal-range BDE = • acute respiratory acidosis acute respiratory acidosis
4 Normal-range pH, PCO2 > 45, BE > +5 = • prolonged respiratory acidosis prolonged respiratory acidosis
5 Alkalosis, PCO2 > 45, BE > +5 = • metabolic alkalosis metabolic alkalosis
6 Alkalosis, PCO2 < 35, normal-range BDE = • acute respiratory alkalosis acute respiratory alkalosis 7 If the acid-base picture does not conform to any of
these options, a mixed pattern exists.

Acid-Base Disturbances in Emergency Settings
• The common disturbances are: acute respiratory acidosis acute respiratory acidosis acute respiratory alkalosis acute respiratory alkalosis acute metabolic acidosisacute metabolic acidosis
• Acute metabolic alkalosisAcute metabolic alkalosis is unusual.
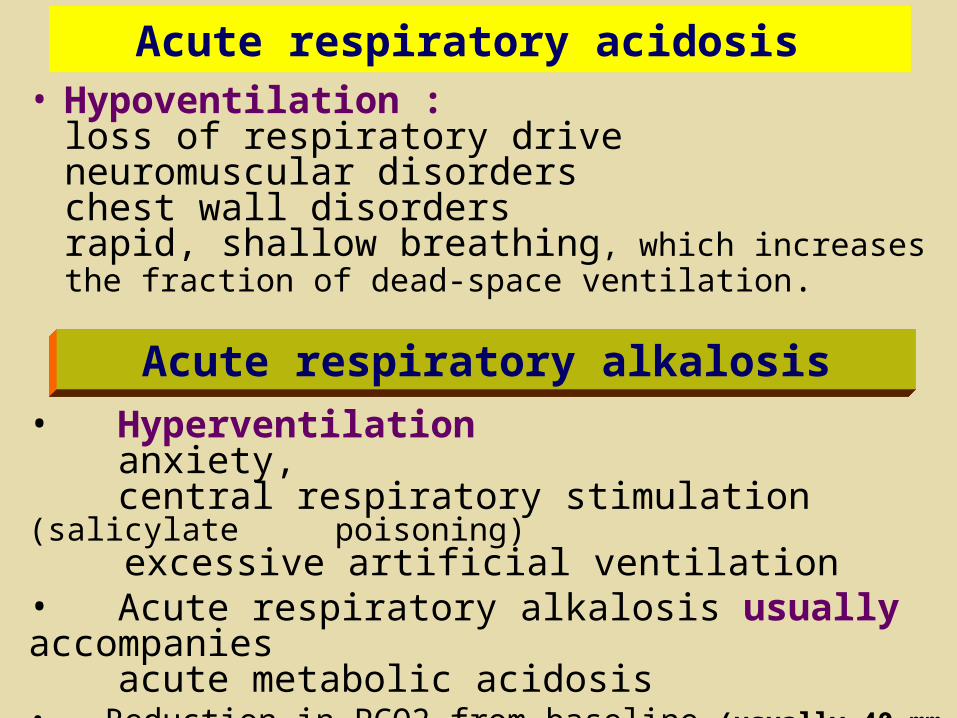
Acute respiratory acidosis • Hypoventilation :
loss of respiratory drive neuromuscular disorders chest wall disorders rapid, shallow breathing, which increases the fraction of dead-space ventilation.
Acute respiratory alkalosis• Hyperventilation anxiety, central respiratory stimulation (salicylate poisoning) excessive artificial ventilation• Acute respiratory alkalosis usually accompanies acute metabolic acidosis• Reduction in PCO2 from baseline (usually 40 mm Hg) is equal to the magnitude of the BD.


•BEfw = Changes in free water = 0.3 × (Na − 140)
+ 2.4 = 0.3 × ( 148 – 140 )
•BECl = Changes in chloride = 102 − (Cl − 140/Na)
-17 = 102 – ( 120 – 140/148 )
•BEalb = Changes in albumin = 3.4 × (4.5 − albumin)
+8.5 = 3.4 × ( 4.5 – 2 )
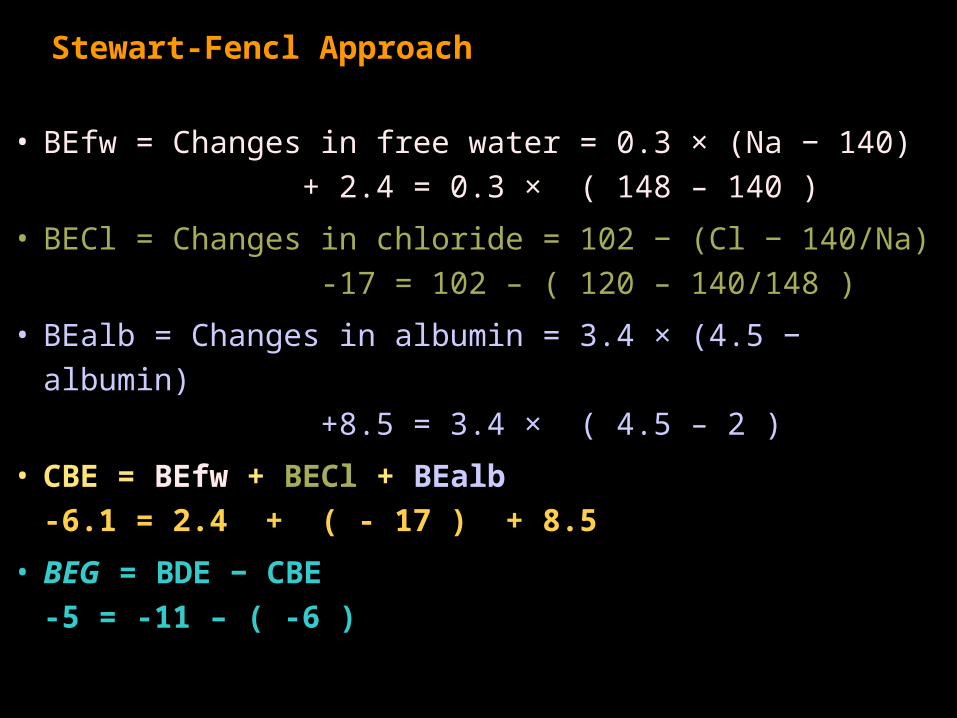
Stewart-Fencl Approach
• BEfw = Changes in free water = 0.3 × (Na − 140)
+ 2.4 = 0.3 × ( 148 – 140 )
• BECl = Changes in chloride = 102 − (Cl − 140/Na)
-17 = 102 – ( 120 – 140/148 )
• BEalb = Changes in albumin = 3.4 × (4.5 − albumin)
+8.5 = 3.4 × ( 4.5 – 2 )
• CBE = BEfw + BECl + BEalb
-6.1 = 2.4 + ( - 17 ) + 8.5
• BEG = BDE − CBE
-5 = -11 – ( -6 )