8.L.3.3 Name: Datestantonrms.weebly.com/uploads/2/4/1/3/24133900/8.l... · 21. The following...
23
8.L.3.3 Name: Date: 1. A marine food web is shown below. Which chart correctly shows three of the organisms according to their roles in cycling matter in the marine food web? A. B. C. D. page 1
Transcript of 8.L.3.3 Name: Datestantonrms.weebly.com/uploads/2/4/1/3/24133900/8.l... · 21. The following...

8.L.3.3
Name: Date:
1. A marine food web is shown below.
Which chart correctly shows three of the organisms according to their roles in cycling matter in the marine foodweb?
A. B.
C. D.
page 1

2. The picture below shows the energy flow through a meadow community.
Which statement best describes the flow of energy as it passes through the organisms in the pyramid?
A. Energy flows through the organisms from bottom to top and increases at each level.
B. Energy flows through the organisms from bottom to top and decreases at each level.
C. Energy flows through the organisms from top to bottom and increases at each level.
D. Energy flows through the organisms from top to bottom and decreases at each level.
3. The diagram below shows a simple food web.
Which animal is classified as an omnivore?
A. red fox B. deer C. black bear D. rabbit
page 2 8.L.3.3

4. The table below contains information about animal diets.
Which energy pyramid best represents the data in the table?
A. B.
C. D.
page 3 8.L.3.3

5. Examining Simple Communities
A group of organisms that interact with and depend upon one another is called a community. The movementof matter and energy through a community can be studied by examining its food web. As organisms eat otherorganisms, energy and nutrients pass through various feeding levels. These feeding levels are called trophic levels.The following is a diagram of the energy and nutrient flow through a simple community.
According to the diagram, nutrients from dead organisms are released into the soil by the action of .
A. producers B. first order consumers C. third order consumers D. decomposers
6. Which of the following trophic levels would have the least amount of available energy?
A. Producers B. First order consumers
C. Second order consumers D. Third order consumers
7. Which statement is true, based on the diagram?
A. Energy flows through a community from the sun to producers and then to consumers.
B. Nutrients are available to producers, but not consumers.
C. Nutrients and energy come from sunlight.
D. Some trophic levels have no available energy. 18 1999 Science
page 4 8.L.3.3

8. Ecosystems are composed of all living and nonliving components in an area. Food webs show the flow of nutrientsand energy within an ecosystem.
Use the food web to answer the following questions.
A chemical pesticide was applied to an area of this ecosystem by a landowner to control the mouse population.There was a decrease in the mouse population due to the presence of this pesticide. Which one of the followingwould most likely occur first due to this change in the ecosystem?
A. The amount of grass would decrease. B. The snake population would increase.
C. The rabbit food supply would increase. D. The snake food supply would increase.
page 5 8.L.3.3

9. Interactions in an ecosystem result from the transfer of matter and energy from producers to consumers andeventually to decomposers.
What are the forms of energy transfer from #1 → #4?
A. Chemical energy to chemical energy B. Light energy to chemical energy
C. Chemical energy to heat energy D. Heat energy to mechanical energy
page 6 8.L.3.3

10. In ecosystems, the sun’s energy is transferred through food webs as shown below.
The sun’s energy is most directly available to people through
A. path A. B. path B. C. path C. D. path D.
11. Use the food chain below to answer the following question.
What do the arrows in the food chain indicate about the flow of energy in an ecosystem?
A. Energy is continuously recycled by the organisms in an ecosystem.
B. Energy flows in one direction in an ecosystem, from producers to consumers.
C. More of the available energy in an ecosystem is given to large animals than to small animals.
D. Organisms at the end of the food chain receive more energy than those at the beginning.
page 7 8.L.3.3

12. Use the food web below to answer the following question.
Which group is not represented in the food web?
A. producers B. primary consumers C. secondary consumers D. decomposers
page 8 8.L.3.3

13. Which diagram correctly shows the direction of energy flow through a food web?
A. B.
C. D.
14. What is the role of decomposers in a food chain?
A. They consume other organisms. B. They break down dead organic matter.
C. They use the Sun’s energy to make food. D. They convert inorganic matter into organic matter.
page 9 8.L.3.3

15. Which of the following groups of organisms uses sunlight to convert carbon dioxide and water into sugar andoxygen?
A. carnivores B. decomposers C. herbivores D. producers
16. Lightning from a thunderstorm strikes a tree that falls to the forest floor and dies. During the next few years thedead tree undergoes many changes.
What organisms are most likely responsible for the biological and chemical changes to the tree?
A. consumers B. decomposers C. predators D. producers
page 10 8.L.3.3

17. A marine food web is shown below.
Which of the following diagrams correctly represents an energy pyramid from this web?
A. B.
C. D.
page 11 8.L.3.3

18. Which of the following energy pyramids shows the correct placement of trophic levels?
A.
B.
C.
D.
page 12 8.L.3.3
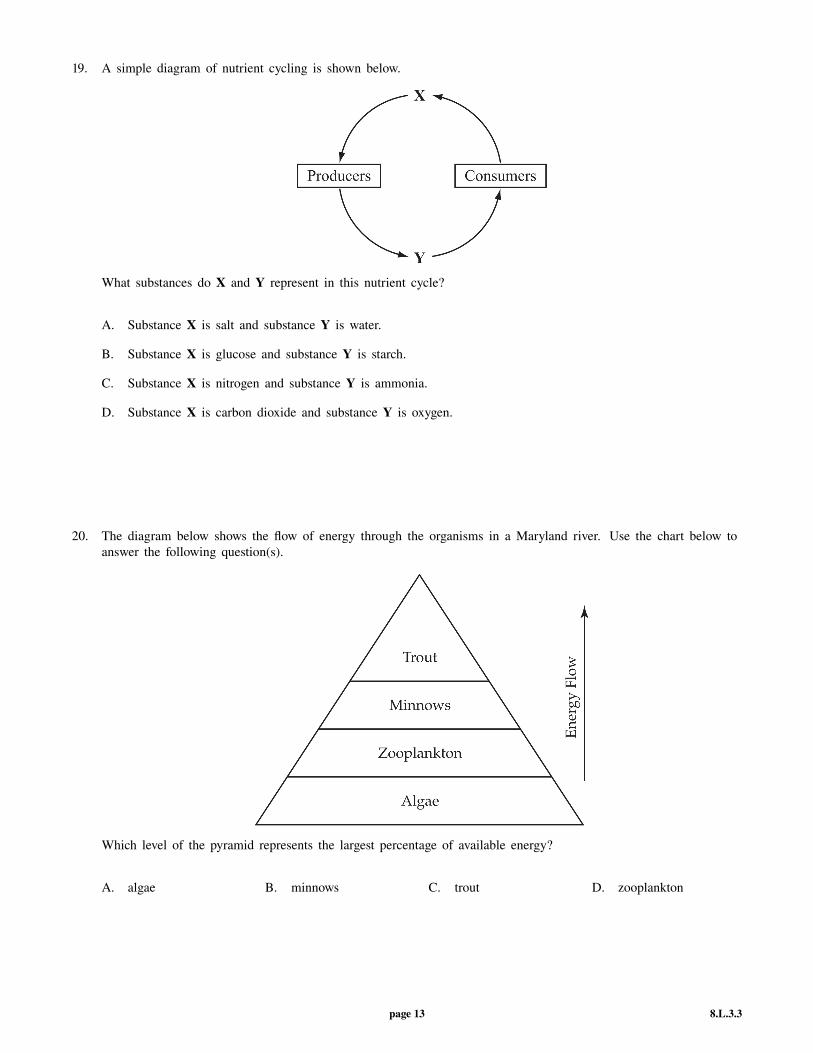
19. A simple diagram of nutrient cycling is shown below.
What substances do X and Y represent in this nutrient cycle?
A. Substance X is salt and substance Y is water.
B. Substance X is glucose and substance Y is starch.
C. Substance X is nitrogen and substance Y is ammonia.
D. Substance X is carbon dioxide and substance Y is oxygen.
20. The diagram below shows the flow of energy through the organisms in a Maryland river. Use the chart below toanswer the following question(s).
Which level of the pyramid represents the largest percentage of available energy?
A. algae B. minnows C. trout D. zooplankton
page 13 8.L.3.3
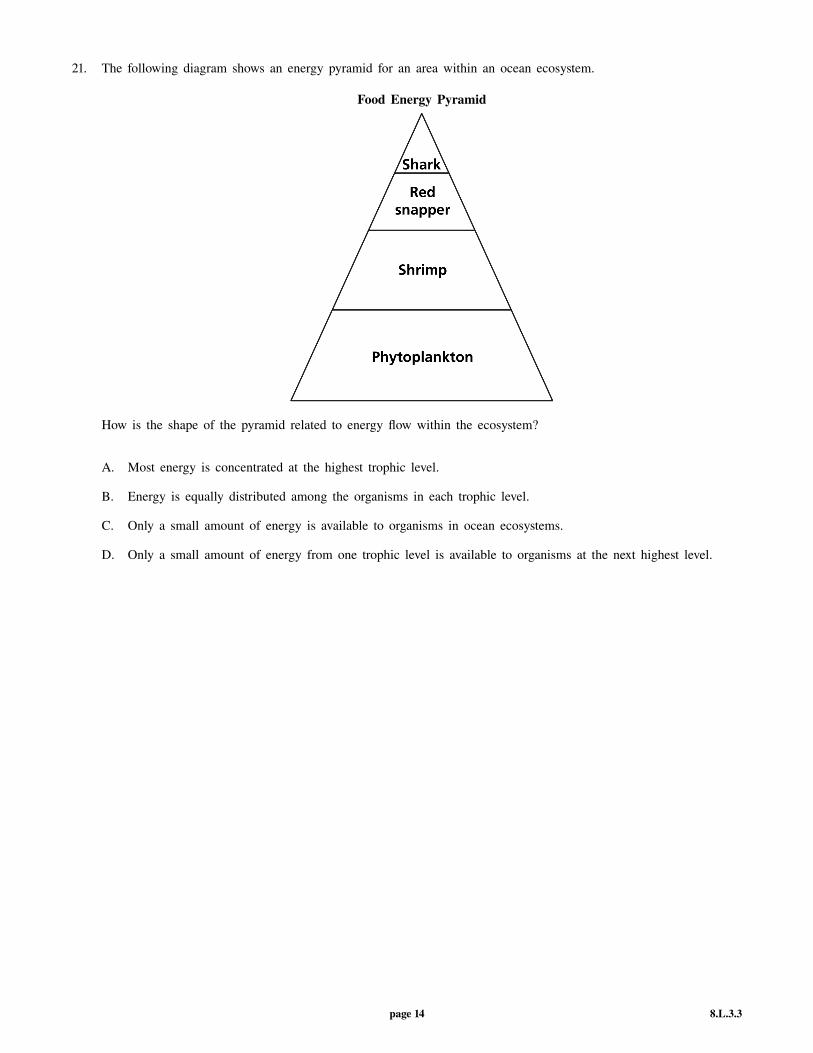
21. The following diagram shows an energy pyramid for an area within an ocean ecosystem.
Food Energy Pyramid
How is the shape of the pyramid related to energy flow within the ecosystem?
A. Most energy is concentrated at the highest trophic level.
B. Energy is equally distributed among the organisms in each trophic level.
C. Only a small amount of energy is available to organisms in ocean ecosystems.
D. Only a small amount of energy from one trophic level is available to organisms at the next highest level.
page 14 8.L.3.3

22. The following diagram shows an energy pyramid for a wetland in Mississippi.
Energy Pyramid of Mississippi Wetland
Which conclusion is supported by this diagram?
A. River otters are tertiary consumers and have the least energy available to them.
B. Crayfish are secondary consumers and have the most energy available to them.
C. Phytoplankton are primary producers and have the least energy available to them.
D. Zooplankton are secondary producers and have the most energy available to them.
23. Which best determines the number of wolves that can live in an area?
A. the amount of snow in the area each year B. the number of birds that live in the area
C. the number of trees in the area D. the amount of food available in the area
24. In a food pyramid, which best explains why the number of organisms decreases from one trophic level to the next?
A. Consumers at the lower level require more energy than the top-level consumers.
B. Consumers at the top level require more energy than the lower-level consumers.
C. The consumers are feeding on larger organisms that have less energy.
D. The consumers are feeding on smaller organisms that have less energy.
page 15 8.L.3.3

25. The diagram below shows an energy pyramid for a forest ecosystem.
What do the sizes of the levels in the energy pyramid represent?
A. the amount of energy available in the organisms at each level
B. the amount of energy used daily by the organisms at each level
C. the amount of heat given off daily by the organisms at each level
D. the amount of energy recycled by the organisms at each level
page 16 8.L.3.3
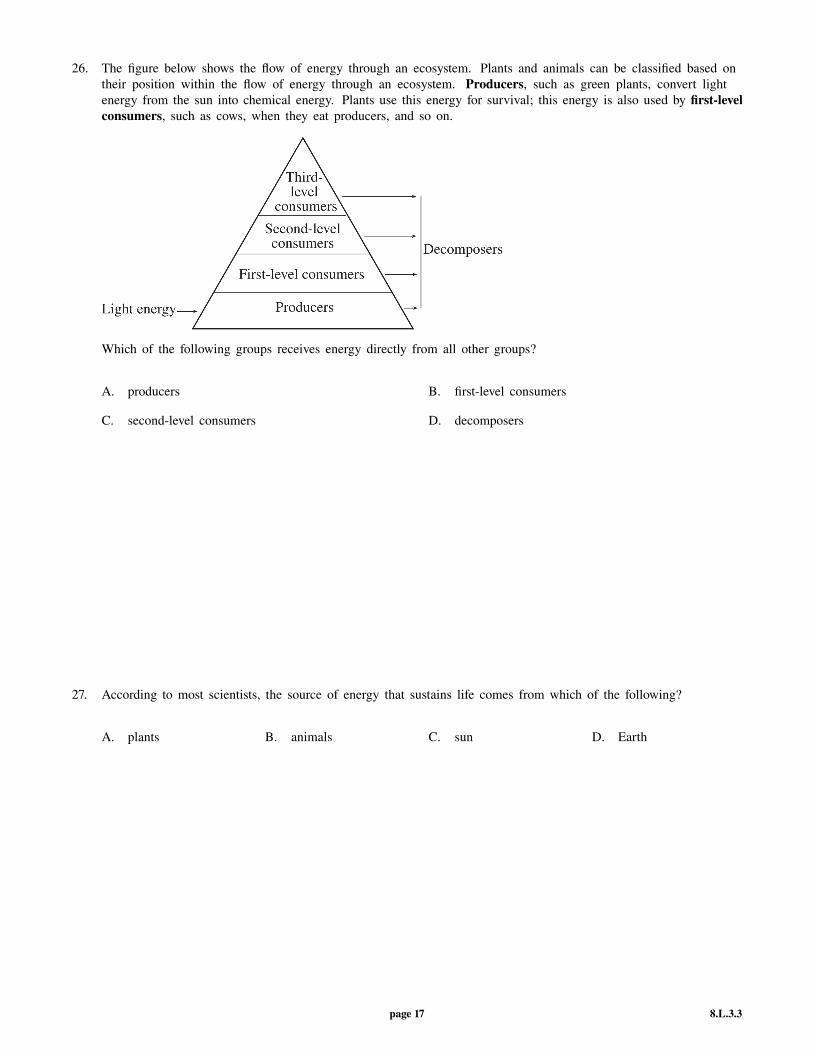
26. The figure below shows the flow of energy through an ecosystem. Plants and animals can be classified based ontheir position within the flow of energy through an ecosystem. Producers, such as green plants, convert lightenergy from the sun into chemical energy. Plants use this energy for survival; this energy is also used by first-levelconsumers, such as cows, when they eat producers, and so on.
Which of the following groups receives energy directly from all other groups?
A. producers B. first-level consumers
C. second-level consumers D. decomposers
27. According to most scientists, the source of energy that sustains life comes from which of the following?
A. plants B. animals C. sun D. Earth
page 17 8.L.3.3
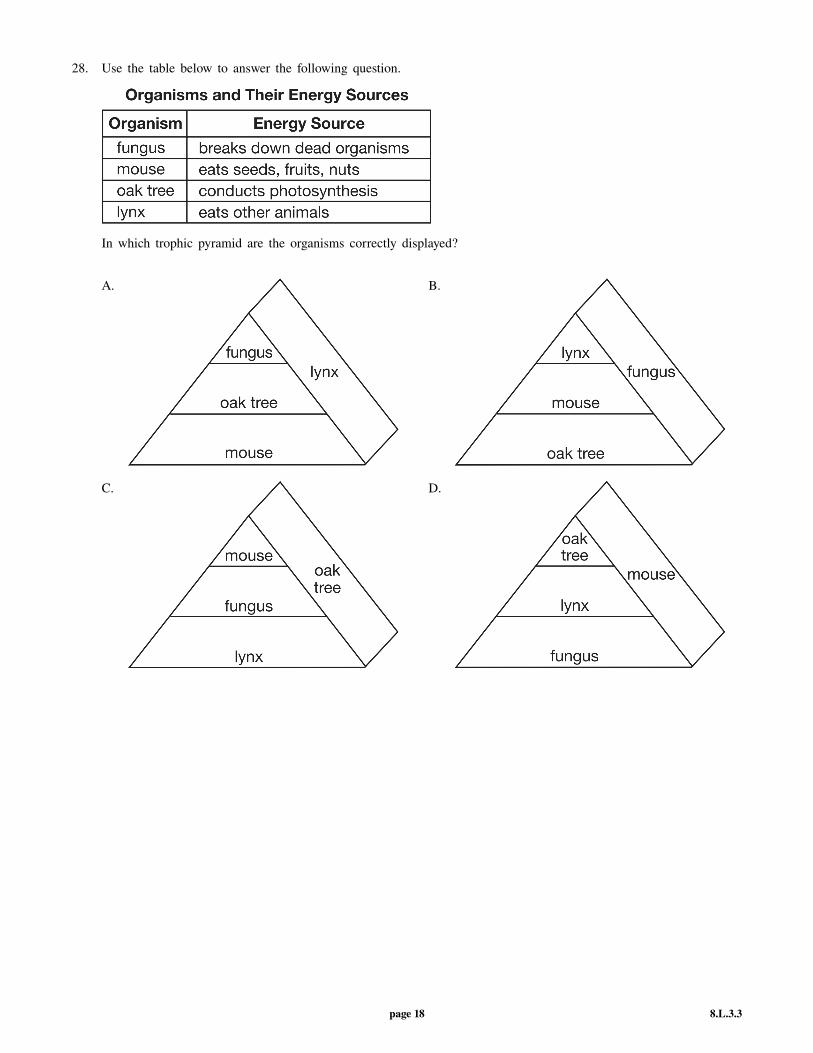
28. Use the table below to answer the following question.
In which trophic pyramid are the organisms correctly displayed?
A. B.
C. D.
page 18 8.L.3.3

29. The diagram below shows an example of interdependence among aquatic organisms. During the day the organismseither use up or give off (a) or (b) as shown by the arrows.
Choose the right answer for (a) and (b) from the alternatives given.
A. (a) is oxygen and (b) is carbon dioxide. B. (a) is nitrogen and (b) is carbon dioxide.
C. (a) is carbon dioxide and (b) is oxygen. D. (a) is carbon dioxide and (b) is carbohydrate.
30. What is the main function of chloroplasts in a plant cell?
A. To absorb light energy and manufacture food B. To remove waste materials by active transport
C. To manufacture chemical energy from food D. To control the shape of the cell
page 19 8.L.3.3

31. In the picture of an aquarium, six items are labeled.
Explain why each of the following is important in maintaining the ecosystem in the aquarium.
a) the plant
b) the light
page 20 8.L.3.3

32. A prairie ecosystem includes many different organisms, such as grasses, coyotes, trees, mushrooms, snakes, andmice, as shown in the picture below. The energy needed by all the organisms in the ecosystem comes from oneprimary source.
a) Identify the primary source of energy in the prairie ecosystem.
b) Identify one producer, one consumer, and one decomposer shown in the picture of the prairie ecosystem.
c) Explain how the energy from the primary source you identified in previously moves through the prairieecosystem. Be sure to include producers, consumers, and decomposers in your answer.
page 21 8.L.3.3

33. A class observed grasshoppers, frogs, mice, snakes, and owls in a grassy field. They are all part of the same foodweb.
Students combined their observations of what the organisms eat in the table.
In the space below, draw a food web with four of these organisms.
When drawing the food web, be sure to use the names of the four organisms and draw arrows to trace the energyflow among the organisms.
page 22 8.L.3.3

Problem-Attic format version 4.4.210c_ 2011–2014 EducAide Software
Licensed for use by Cindy RudolphTerms of Use at www.problem-attic.com
8.L.3.3 05/13/2014
1.Answer: C
2.Answer: B
3.Answer: C
4.Answer: A
5.Answer: D
6.Answer: D
7.Answer: A
8.Answer: C
9.Answer: B
10.Answer: B
11.Answer: B
12.Answer: D
13.Answer: C
14.Answer: B
15.Answer: D
16.Answer: B
17.Answer: C
18.Answer: A
19.Answer: D
20.Answer:
21.Answer: D
22.Answer: A
23.Answer: D
24.Answer: B
25.Answer: A
26.Answer: D
27.Answer: C
28.Answer: B
29.Answer: A
30.Answer: A
31.Answer: [answers may vary]; [answers may vary]
32.Answer:
33.Answer: The response provides a complete food
web drawing, which includes fourcombinations of organisms. The foodweb uses the names of four organismsand shows all relationships among theorganisms identified. The arrows aredrawn in the correct direction to show theorganization and flow of energy amongthe organisms.