7.5: Comparing Two Population Proportions with...
12
Sect 7_5.notebook 1 March 19, 2018 7.5: Comparing Two Population Proportions with Confidence Sometimes, we wish to compare two population parameters, such as two population proportions. For example, we might want to see if public opinion has changed on some issue over time. Or, we might want to compare proportions of men with women to see if gender results in differences. Ex: Is the proportion of Americans who supported gay marriage different in 2016 than it was in 2008? Ex: Is the proportion of men who suffer from alcoholism different than it is for women?
Transcript of 7.5: Comparing Two Population Proportions with...

Sect 7_5.notebook
1
March 19, 2018
7.5: Comparing Two Population Proportions with Confidence
Sometimes, we wish to compare two population parameters, such as two population proportions. For example, we might want to see if public opinion has changed on some issue over time. Or, we might want to compare proportions of men with women to see if gender results in differences.
Ex: Is the proportion of Americans who supported gay marriage different in 2016 than it was in 2008?
Ex: Is the proportion of men who suffer from alcoholism different than it is for women?
Sect 7_5.notebook
2
March 19, 2018
We can investigate these kinds of questions by looking at samples of the populations. But then we run into a problem: we know that random samples will vary. Because of chance, the sample proportions (statistics) may differ, but the population proportions (parameters) might actually be the same.
Dilemma: Even if the proportions are equal for two populations, the sample proportions drawn from those populations are usually different.
One solution is to use a confidence interval to try to identify “true” differences in population proportions.
Sect 7_5.notebook
3
March 19, 2018
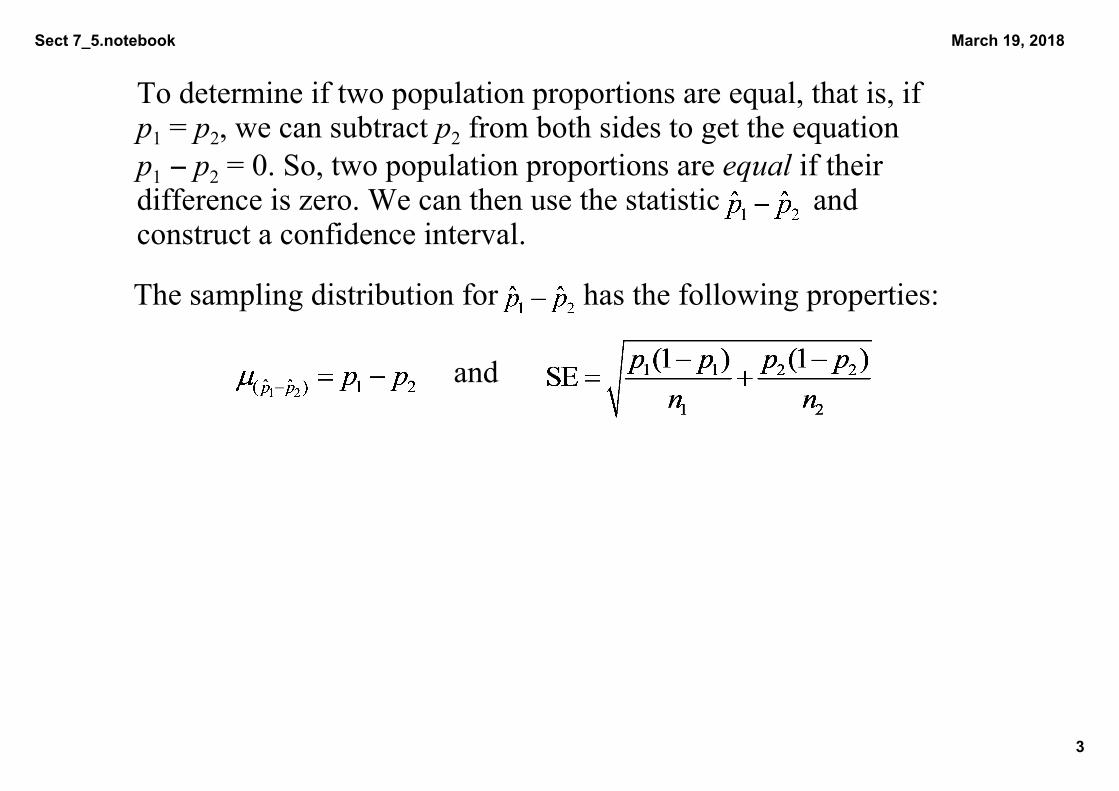
To determine if two population proportions are equal, that is, if p1 = p2, we can subtract p2 from both sides to get the equationp1 − p2 = 0. So, two population proportions are equal if their difference is zero. We can then use the statistic and construct a confidence interval.
The sampling distribution for has the following properties:
and

Sect 7_5.notebook
4
March 19, 2018
Of course, we will typically not know p1 or p2, so we will have to use the estimated standard error, which is:
The confidence interval will therefore have the form:
Estimate (Margin of error)

Sect 7_5.notebook
5
March 19, 2018
Assumptions:1. Both samples must be collected randomly and the observations within each sample must be independent.2. Both sample sizes are large enough to expect at least 10 successes and 10 failures. This means , , , and . 3. Both population sizes must be at least 10 times bigger than the sample sizes.4. The samples must be independent of each other.

Sect 7_5.notebook
6
March 19, 2018
Ex 1: In 2006, a Harvard study was conducted to determine whether prayer assisted hospital patients. 1201 bypass surgery patients from six hospitals were randomly assigned to two groups. Of 604 bypass patients who were prayed for, 314 suffered complications. Of 597 bypass patients who weren’t prayed for, 304 had complications.(a) Based on the sample percentages, does prayer seem to lower the risk of complications for patients?
(b) Can we make a definitive conclusion based on these percentages alone?
Sect 7_5.notebook
7
March 19, 2018
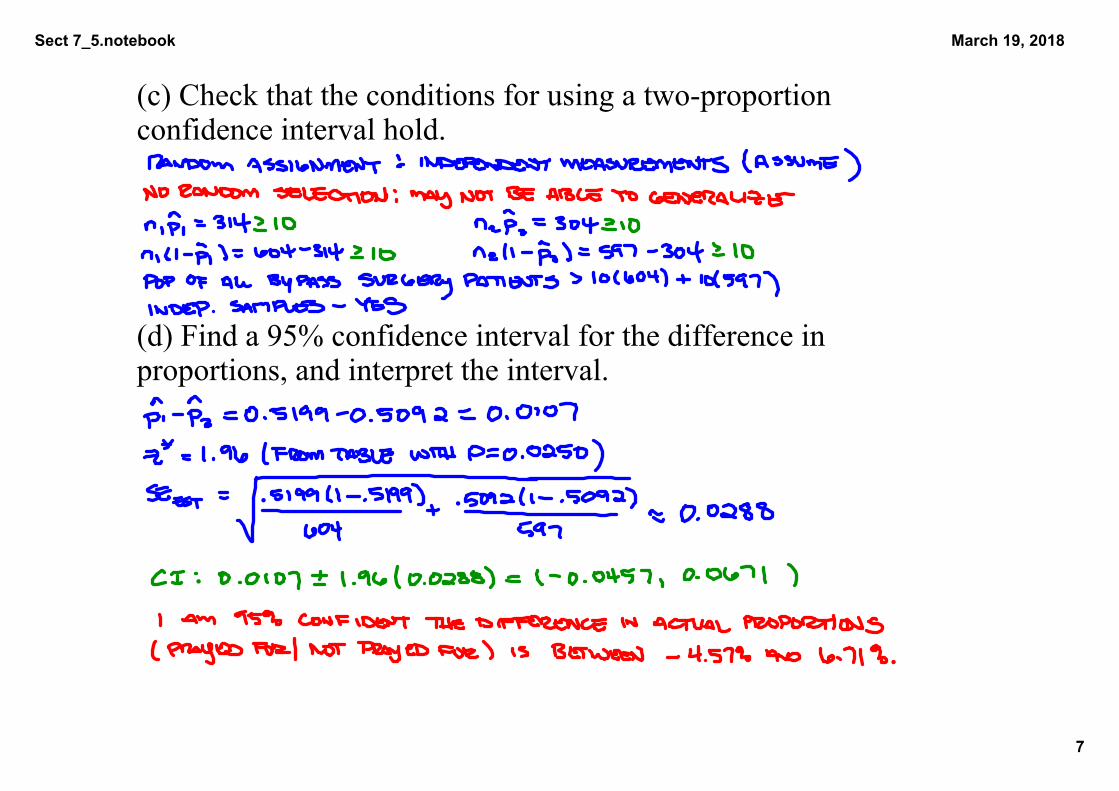
(c) Check that the conditions for using a twoproportion confidence interval hold.
(d) Find a 95% confidence interval for the difference in proportions, and interpret the interval.

Sect 7_5.notebook
8
March 19, 2018
(e) Is there statistical evidence to conclude that prayer made a difference in the rate of complications?
Sect 7_5.notebook
9
March 19, 2018
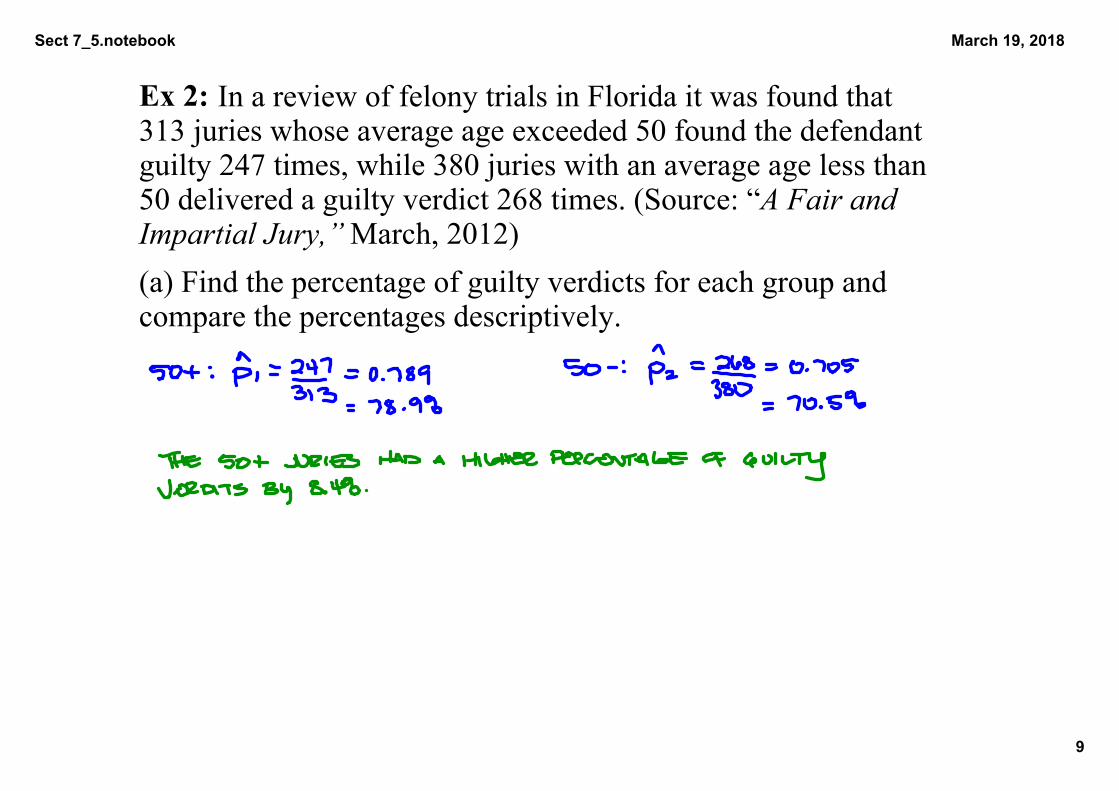
Ex 2: In a review of felony trials in Florida it was found that 313 juries whose average age exceeded 50 found the defendant guilty 247 times, while 380 juries with an average age less than 50 delivered a guilty verdict 268 times. (Source: “A Fair and Impartial Jury,” March, 2012)(a) Find the percentage of guilty verdicts for each group and compare the percentages descriptively.

Sect 7_5.notebook
10
March 19, 2018
(b) Check that the conditions for using a twoproportion confidence interval hold.
(c) Find a 95% confidence interval for the difference in proportions, and interpret the interval.
Sect 7_5.notebook
11
March 19, 2018
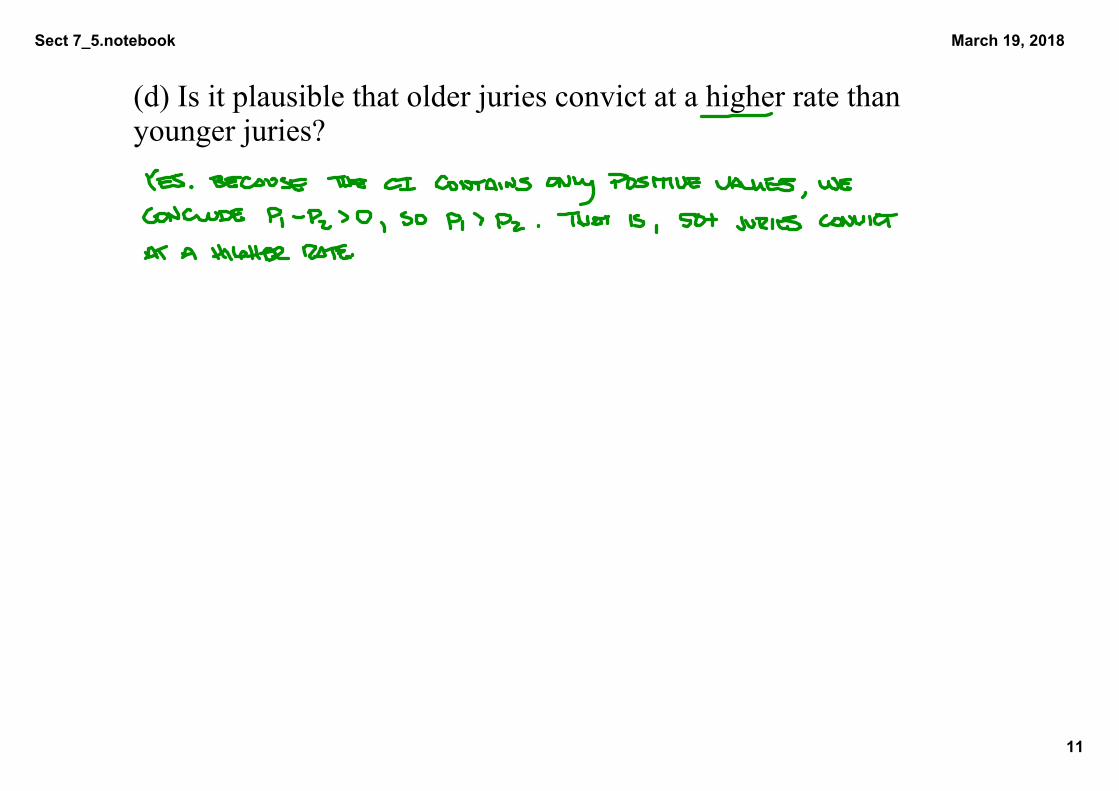
(d) Is it plausible that older juries convict at a higher rate than younger juries?
Sect 7_5.notebook
12
March 19, 2018
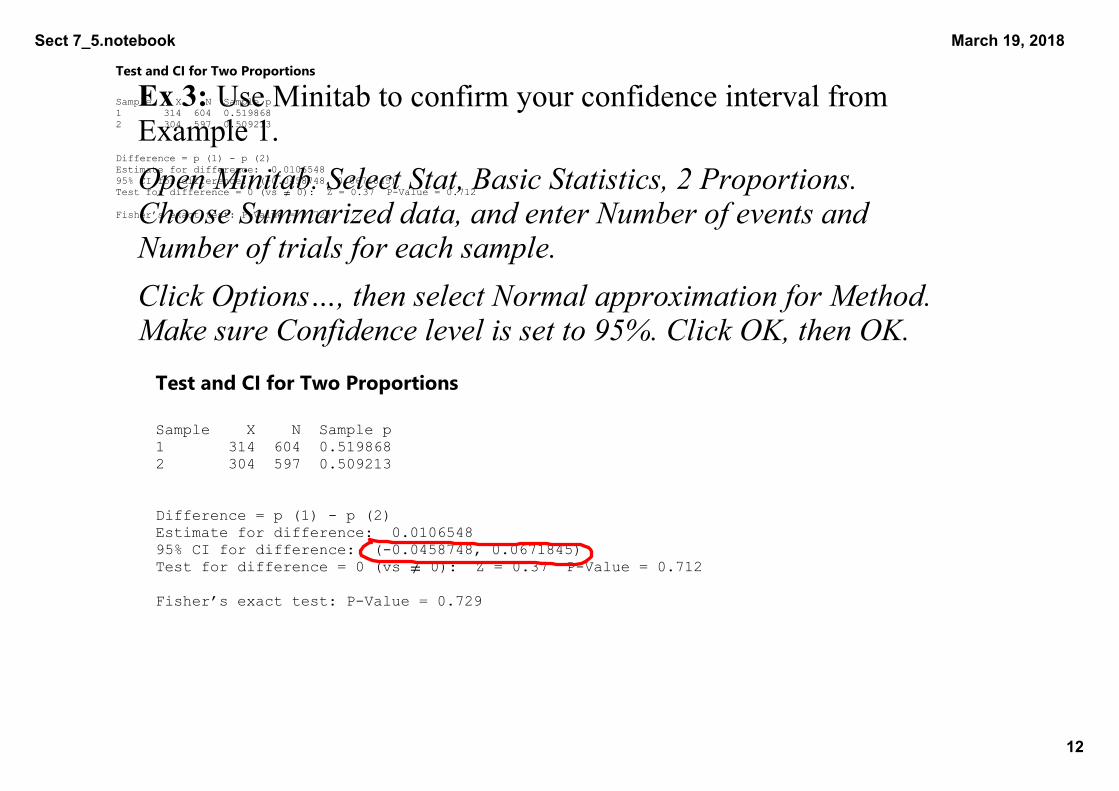
Ex 3: Use Minitab to confirm your confidence interval from Example 1.Open Minitab. Select Stat, Basic Statistics, 2 Proportions. Choose Summarized data, and enter Number of events and Number of trials for each sample.Click Options…, then select Normal approximation for Method. Make sure Confidence level is set to 95%. Click OK, then OK.
Test and CI for Two Proportions
Sample X N Sample p1 314 604 0.5198682 304 597 0.509213
Difference = p (1) p (2)Estimate for difference: 0.010654895% CI for difference: (0.0458748, 0.0671845)Test for difference = 0 (vs ≠ 0): Z = 0.37 PValue = 0.712
Fisher’s exact test: PValue = 0.729
Test and CI for Two Proportions
Sample X N Sample p1 314 604 0.5198682 304 597 0.509213
Difference = p (1) p (2)Estimate for difference: 0.010654895% CI for difference: (0.0458748, 0.0671845)Test for difference = 0 (vs ≠ 0): Z = 0.37 PValue = 0.712
Fisher’s exact test: PValue = 0.729