7374 Letter p01-12 IDCS5 - Procter & Gamble · PDF fileincluding Pampers, Gillette, Tide,...
12
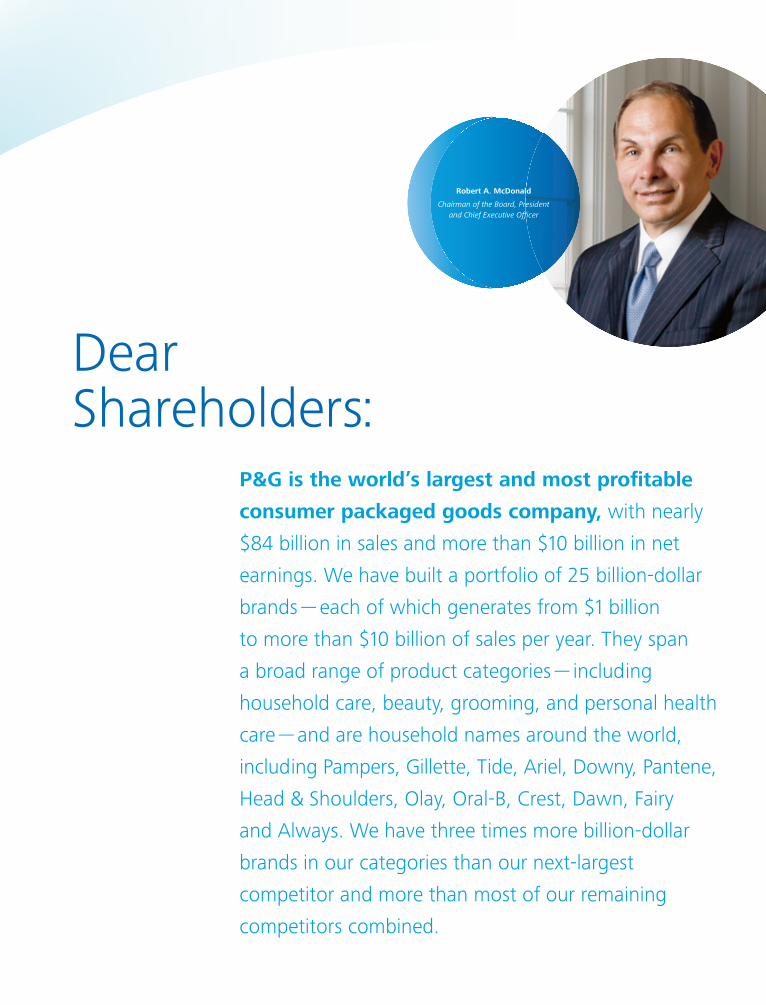
Dear Shareholders: P&G is the world’s largest and most profitable consumer packaged goods company, with nearly $84 billion in sales and more than $10 billion in net earnings. We have built a portfolio of 25 billion-dollar brands — each of which generates from $1 billion to more than $10 billion of sales per year. They span a broad range of product categories — including household care, beauty, grooming, and personal health care — and are household names around the world, including Pampers, Gillette, Tide, Ariel, Downy, Pantene, Head & Shoulders, Olay, Oral-B, Crest, Dawn, Fairy and Always. We have three times more billion-dollar brands in our categories than our next-largest competitor and more than most of our remaining competitors combined. Robert A. McDonald Chairman of the Board, President and Chief Executive Officer
Transcript of 7374 Letter p01-12 IDCS5 - Procter & Gamble · PDF fileincluding Pampers, Gillette, Tide,...
DearShareholders:
P&G is the world’s largest and most profi table
consumer packaged goods company, with nearly
$84 billion in sales and more than $10 billion in net
earnings. We have built a portfolio of 25 billion-dollar
brands — each of which generates from $1 billion
to more than $10 billion of sales per year. They span
a broad range of product categories — including
household care, beauty, grooming, and personal health
care — and are household names around the world,
including Pampers, Gillette, Tide, Ariel, Downy, Pantene,
Head & Shoulders, Olay, Oral-B, Crest, Dawn, Fairy
and Always. We have three times more billion-dollar
brands in our categories than our next-largest
competitor and more than most of our remaining
competitors combined.
Robert A. McDonald
Chairman of the Board, President and Chief Executive Offi cer
P&G’s Long-Term Growth Targets
Organic Sales Growth 1 – 2% above global market growth rates
Core EPS Growth High single to low double digits
Free Cash Flow 90% of net earnings
We’re celebrating P&G’s 175th anniversary this year, a milestone
that very few companies have achieved. Our long track record of
success is based on a time-tested business model — we discover
meaningful insights into what consumers need and want; we
translate those insights into noticeably superior products focused on
those needs; we communicate that superiority through advertising
that includes compelling claims, performance demonstrations,
and superior benefi t visuals; and we price our products at a point
where consumers experience superior overall value. All of this
drives leadership market share, higher sales and lower costs,
which enable us to reinvest in our business and win on a sustained
basis. This model is simple and clear — and when we execute it
consistently, we win.
We have used this model to build a company with nearly $84 billion in sales and more than $10 billion in net earnings.
This model has also enabled P&G to deliver reliable and meaningful
growth over long periods of time, outperforming the market and
performing among the very best in our industry. Measuring from
the end of each quarter starting in 1980, rolling 10-year returns have
exceeded both the S&P 500 and the Dow Jones Industrial Average
in 82 out of 88 periods, or 93% of the time. And rolling 20-year
returns have exceeded both the S&P 500 and the Dow Jones
Industrial Average in 46 out of 48 periods, or 96% of the time.
Within this longer-term track record, there have been shorter periods
of underperformance, as we’ve experienced the past couple of
years. These have typically been followed by periods of strong out-
performance. This past track record does not in any way guarantee
future success. It does refl ect, however, the strength of our time-
tested business model.
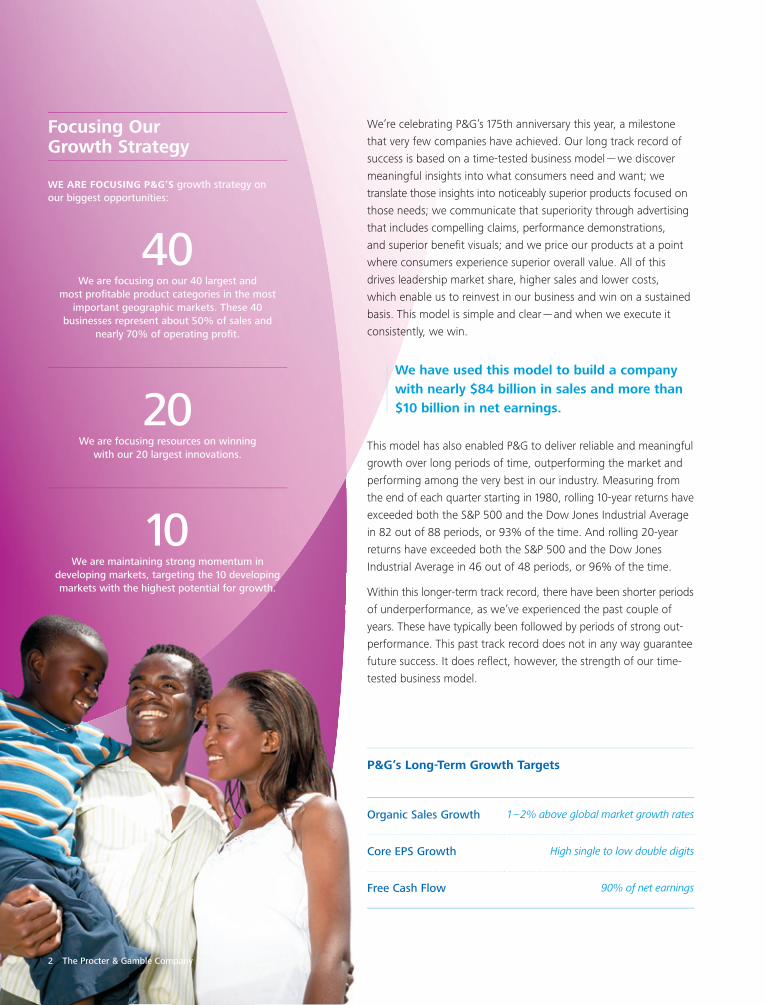
Focusing Our Growth Strategy
WE ARE FOCUSING P&G’S growth strategy on our biggest opportunities:
40We are focusing on our 40 largest and
most profi table product categories in the most important geographic markets. These 40
businesses represent about 50% of sales and nearly 70% of operating profi t.
20We are focusing resources on winning
with our 20 largest innovations.
10We are maintaining strong momentum in
developing markets, targeting the 10 developing markets with the highest potential for growth.
2 The Procter & Gamble Company

The model works. Funding it with productivity savings and executing
it broadly and consistently with discipline is the proven way for
P&G to deliver the business and fi nancial results to which we’ve
committed. This is what we are doing.
Fiscal Year 2012 Financial ResultsDeveloping-market organic sales growth and cash fl ow productivity
were both strong in 2012. Developed-market organic sales growth
and earnings progress were not.
In fi scal 2012, we delivered 3% organic sales growth overall. P&G has averaged 4% organic sales growth over the past three years, achieving 3% to 5% organic sales growth for 11 consecutive quarters.
In just three years, we’ve added organic sales of $8.5 billion,
the equivalent of adding a Fortune 300 company to our portfolio.
Growth continues to be very strong in developing markets, which
now generate 38% of P&G’s sales and 44% of our unit volume.
It’s a $32 billion business for P&G, the largest developing-market
business of any consumer products company. We see signifi cant
remaining growth opportunities as our business in developing
markets is still smaller as a percent of sales than the developing
market businesses of some of our competitors, and we will continue
to focus on growing our business in the largest and most important
of these markets.
Our growth in developed markets has been weaker, resulting from
slower market growth and declining market shares. The share
declines in these markets were driven primarily by consumer value
issues on key brands in several large categories due to a combina-
tion of price increases taken to recover higher commodity costs,
which our competitors did not take, and increased promotional
activity by competitors. Developed markets represent about 60%
of our sales and 70% of operating profi ts, so it’s essential that
they are healthy and growing. Consequently, developed-market
businesses — including fabric care and baby care in the United States
and the largest markets in Western Europe, as well as the United
States oral care, skin care, hair care, shave care and feminine care
categories — are a disproportionate focus of strengthened plans
that we began to implement earlier this year. We are ensuring we
have product offerings from each of these businesses that provide
superior value — at the right price and with innovation that is
strong — supported by marketing that effectively communicates the
superiority of our products.
developing marketnet sales*
Strong Growth inDeveloping Markets
OUR DEVELOPING-MARKET SALES growth has been very strong over the past ten years. Three years ago, we made an intervention to expand further in these markets, and we’re growing at nearly double the rate of the underlying markets. Developing markets are now a $32 billion business for P&G, generating 38% of sales and 44% of our unit volume.
We’re focused on our top 10 developing markets where growth prospects are highest, including the important “BRIC” markets of Brazil, Russia, India and China, where sales have grown an average of 20% over the past decade.
>14%P&G has a strong track record
of successful developing-market growth — averaging
>14% growth over the past decade.
china
17%compound
annual growth
201220072002
india
27%compound
annual growth
201220072002
russia
25%compound
annual growth
201220072002
bric markets net sales*brazil
23%compound
annual growth
201220072002
201220072002
* Bars represent net sales in U.S. dollars.
The Procter & Gamble Company 3

Core earnings per share for fi scal year 2012 were $3.85, which
is 1% below the prior-year level. The EPS benefi ts from sales
growth, cost savings and share repurchase this past year were
more than offset by a combination of headwinds from higher raw
material costs, geographic mix, a higher effective core tax rate
and increased investments to support our accelerated portfolio
expansion into developing markets.
Free cash fl ow for the fi scal year was $9.3 billion. Adjusted free
cash fl ow productivity was 90%, consistent with our target. During
the fi scal year, we returned $10 billion of cash to shareholders
through $6 billion of dividends and $4 billion of share repurchase.
We paid a dividend for the 122nd consecutive year, making P&G one of only nine publicly traded companies headquartered in the U.S. to have delivered uninterrupted dividends for 120 years or more.
We also increased the dividend by 7%. This was the 56th
consecutive year we have increased the dividend, one of only six
companies to have done this.
Over the last 10 years, P&G has paid out $42 billion in dividends.
Excluding $20 billion of share repurchase associated with the
Gillette acquisition, we have repurchased $46 billion of stock.
In total, through dividends and share repurchase, we have returned
$88 billion of cash to our shareholders, which is 90% of reported
net earnings.
Returning capital to shareholders, through both dividends and share repurchase, remains a central pillar of our efforts to create superior shareholder value.
I’m proud of the extraordinary efforts P&G people have made to
keep our Company growing through a very demanding economic
period. We know, however, that we have not delivered suffi cient
growth to rank among the best performers in our industry.
To do this, we must get back on a path toward our long-term
annual objective of high single-digit to low double-digit EPS growth
and total shareholder return in the top third of our competitive
peer group.
more than
2/3of the
unit dose laundrysegment
Innovation thatSets New Standards
TIDE PODS IS AN EXAMPLE OF P&G innovation that obsoletes existing products or creates entirely new product categories. The innovative, three-chamber, pre-measured packet can simply be dropped in the wash — no measuring, no worrying — and it even dissolves in cold water.
Since launching in the U.S. in February 2012, Tide PODS has had a very strong performance — ahead of our expectations. Since we began shipping PODS, the unit dose laundry segment has more than doubled to 6% of total laundry share — and Tide PODS is over two-thirds of this segment.
It’s an innovation that’s making laundry day easier — and is saving consumers loads of time.
4 The Procter & Gamble Company

cost reduction progressWe’re making good progress in all these areas.
Driving Productivity and Cost Savings
PRODUCTIVITY IS THE GREAT ENABLER that allows us to invest in leadership levels of consumer understanding and innovation, ensure our brands are priced competitively, overcome macro headwinds and deliver bottom-line growth…simultaneously.
Earlier this year, we announced our objective of delivering $10 billion* in cost savings by the end of fi scal year 2016. This program includes $6 billion of savings in cost of goods sold, $1 billion from marketing effi ciencies, and $3 billion from non-manufacturing overhead.
* Based on projected revenue and costs growing at a 5% annual rate through 2016.
To accelerate progress down this path and address our shortfalls,
we have implemented three meaningful changes: strengthening
our core business, renewing our focus on discontinuous innovation,
and implementing a $10 billion productivity program.
Focusing on Our CoreThe fi rst change is our 40/20/10 focus — focusing resources on
the 40 largest and most profi table businesses, many of which are
in developed markets; on our 20 largest innovations; and on the
10 most important developing markets.
Our 40 largest businesses generate more than 50% of sales and
nearly 70% of operating profi t. They are disproportionately in the
U.S. and China, which are P&G’s fi rst and second largest, most
profi table markets, respectively.
Our 20 most important innovations are nearly 10 times larger on average than the rest of the initiatives. This is the core of our innovation pipeline.
Our 10 most important developing markets are critical to P&G’s
future growth. Between 2010 and 2020, the world’s population
will grow by 700 million people, and 95% of this population
growth will be in developing markets. During that same period,
the world’s middle class will increase by 1.4 billion people, 98%
in developing markets. Population growth and household income
growth are the primary drivers of our business growth, so these
trends are highly encouraging for P&G’s future. We are maintain-
ing strong momentum in developing markets, targeting the 10
developing markets with the highest potential for growth.
We will innovate and execute with excellence across all our busi-
nesses, but this sharp focus on core businesses, our biggest
innovations and developing markets will have the greatest impact
on getting P&G back on track to leadership levels of growth and
shareholder value.
Winning with InnovationThe second change we’ve made is a deliberate refocus
on discontinuous innovation — innovation that obsoletes current
products and creates new categories and new brands. Examples
are products such as Tide PODS, Swiffer, and Crest Whitestrips.
We will maintain our commitment to ongoing innovation
in our base business (i.e., the innovations that enable P&G’s brands
to maintain superior performance and value between more
$10 these productivity plans will help P&G fi nance top-line growth, ensure our consumer value propositions are superior, overcome macro headwinds and deliver better bottom-line growth.
$1Bmarketing
$6Bcost of goods
$3Boverhead
billion
The Procter & Gamble Company 5

disruptive innovations), but some of our fastest periods of
growth — and some of our largest and most profi table present-
day businesses — were driven by discontinuous innovation:
disposable diapers, liquid laundry detergents, home care
items like Swiffer and Febreze. We need to get back to this
level of innovation in a meaningful way.
We have an increasingly promising pipeline of category- and brand-creating innovations. It will take some time to get these innovations ready for launch, but I am confi dent they will make a meaningful and sustainable difference as they enter the market.
Improving ProductivityThe third change is the $10 billion productivity program
we announced in February. This is critical because
productivity is the great enabler. It enables us to fund top-
line growth, to ensure our consumer value propositions are
superior, to overcome macro headwinds, and to deliver
better bottom-line growth.
Time-TestedBusiness Model
P&G’S LONG TRACK RECORD OF SUCCESS is based on a time-tested business model:
• We discover meaningful insights into what consumers need and want.
• We translate those insights into noticeably superior products.
• We communicate product superiority through advertising that includes compelling claims, performance demonstrations and superior benefi t visuals.
• We price our products so that consumers experience superior overall value.
This drives leadership market shares, higher sales and lower costs, enabling us to reinvestin our business.
The model is simple and clear — and when we execute it consistently, we win.
6 The Procter & Gamble Company
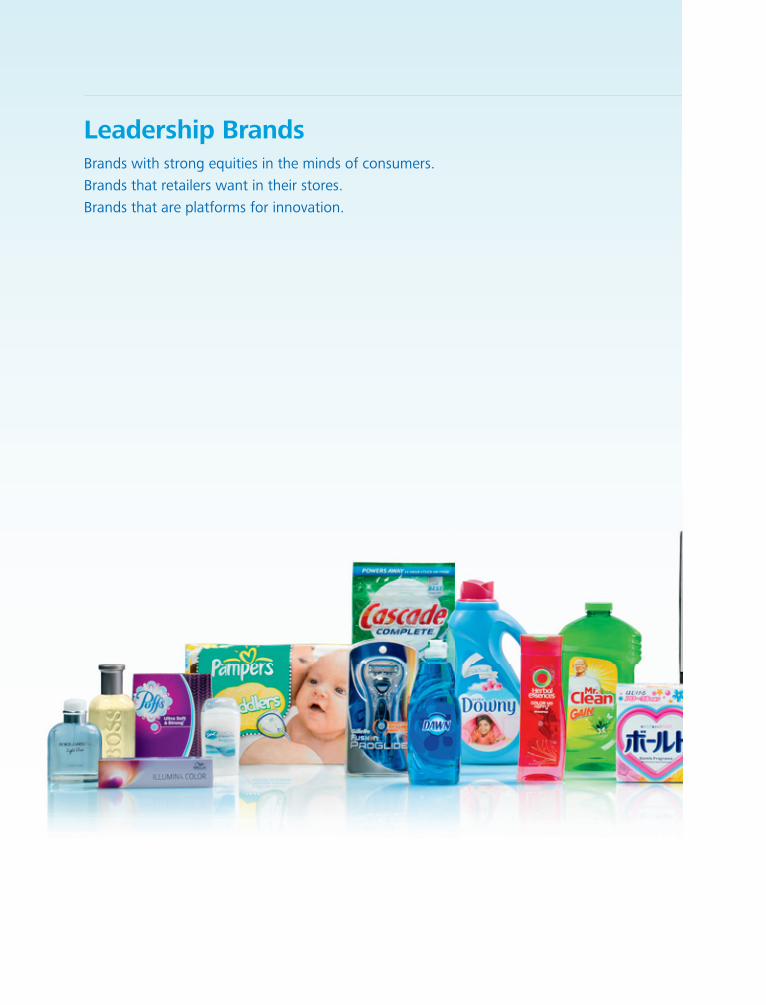
Leadership BrandsBrands with strong equities in the minds of consumers.
Brands that retailers want in their stores.
Brands that are platforms for innovation.


50P&G’s 50 Leadership
Brands are some of the world’s most well-known
household names.
90%These 50 brands
represent 90% of P&G sales and more than 90% of our profi ts.
2525 of these 50 brands are our Billion-Dollar
Brands, each generating more than $1 billion in
annual sales.
see p&g’s 50 leadership brands
Companies that deliver leadership levels of growth
over long periods of time, through favorable and
unfavorable economic conditions alike, are almost always
companies with strong productivity cultures.
Our productivity program includes $6 billion of savings in
cost of goods sold, $3 billion from non-manufacturing
overhead, and $1 billion from marketing effi ciencies. We have
already identifi ed and staffed $1 billion of the $1.2 billion in
cost-of-goods-sold savings that we need in fi scal year 2013.
We’re ahead of our targets to reduce non-manufacturing
enrollment. In addition, manufacturing enrollment remained
essentially fl at, as signifi cant productivity improvements
offset the added staffi ng required to operate several new
manufacturing facilities which went into operation during
the past year. And while we are continuing to increase
marketing spending, we are also leveraging effi ciencies that
enable our brands to increase reach and improve effective-
ness — essentially doing more with less.
In addition to these three changes, we are improving execu-
tion in all parts of the Company. Better execution will help
us to overcome macro challenges, manage competitive
threats and get the maximum benefi t from our innovation,
marketing and productivity programs.
We are also maintaining accountability — at all levels. On
average across the Company, short-term bonus awards will
be below target for the 2012 fi scal year. Three-year perfor-
mance awards for senior executives are currently tracking, in
aggregate, to less than 50% of target. We all acknowledge
this refl ects the level and quality of our results.
We have the right metrics to incent results that are aligned
with shareholder objectives. Our long-term bonus metrics
are simple: organic sales growth relative to competition,
operating earnings growth, EPS growth and free cash fl ow
productivity — all of which drive total shareholder return.
We’ve aligned the entire Company next year on short-term
metrics of volume and sales growth, market share, operating
profi t growth, productivity (which is delivering against the
$10 billion plan), cash fl ow and internal controls. These are
the metrics that we will measure ourselves against and that
you can measure our progress by.
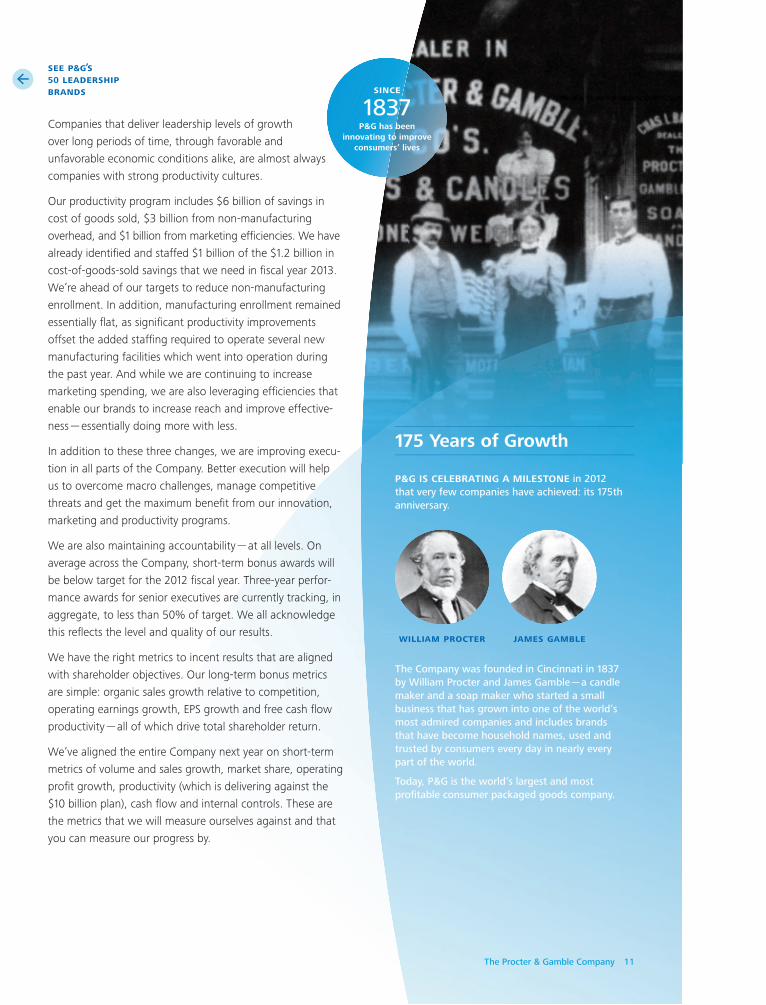
175 Years of Growth
P&G IS CELEBRATING A MILESTONE in 2012 that very few companies have achieved: its 175th anniversary.
The Company was founded in Cincinnati in 1837 by William Procter and James Gamble — a candle maker and a soap maker who started a small business that has grown into one of the world’s most admired companies and includes brands that have become household names, used and trusted by consumers every day in nearly every part of the world.
Today, P&G is the world’s largest and most profi table consumer packaged goods company.
william procter james gamble
since
1837P&G has been
innovating to improve consumers’ lives
The Procter & Gamble Company 11
* Excludes $20 billion of share repurchase associated with the Gillette acquisition.
Committed to Shareholder Value Creation
THE WHOLE P&G ORGANIZATION is committed to shareholder value creation, and our objective is to consistently rank among the top third of our competitive peer group in Total Shareholder Return (TSR). Over the last 10 years, we have paid out $42 billion in dividends, and we have repurchased $46 billion* in stock. In total, we have returned $88 billion of cash to our shareholders, which is 90% of reported net earnings. Cash yield to shareholders has averaged 5% over this period.
And over appropriately long periods of time — rolling 3-year, 5-year and 10-year periods — P&G has frequently outperformed the S&P 500 & Dow Jones Industrial Average since 1980.
This performance has made P&G an excellent long-term investment.
56CONSECUTIVE YEARS OF
DIVIDEND INCREASES (one of only six companies to do this)
$88 billionOF CASH RETURNED TO
SHAREHOLDERS over 10 years
122CONSECUTIVE YEARS OF DIVIDENDS(one of only nine companies to do this)
With these changes, we should be poised to seize meaningful
opportunities for top- and bottom-line growth. We have signifi cant
opportunity for revenue growth through increased market share in
our established businesses, by expanding our portfolio of superior
branded products into the most promising markets and price tiers,
and by innovating to expand product categories and create new
ones. On the bottom line, our productivity opportunity is substan-
tive and the program is in place. This will help fi nance top-line
growth, ensure our consumer value propositions are superior,
overcome macro headwinds and deliver better earnings growth.
We have taken decisive action, but this Company wasn’t built
overnight. It will take some time to restart growth in developed
markets and to get the savings program to full run-rate levels.
It will take some investment to restart innovation where it has
been lacking, to ensure our brands are priced appropriately,
and to ensure that our marketing plans are suffi cient to generate
consumer awareness, trial and loyalty. We are committed to
make those investments, fueled by improvements in productivity
and costs.
We are moving forward with urgency, but with balance — balancing
developing- and developed-market growth, balancing the top and
bottom lines, and balancing short- and long-term returns.
I am confi dent we will deliver.
175 Years of GrowthIn its 175-year history, P&G has weathered economic downturns
and crises, wars and unprecedented change in virtually every
aspect of our business. We’ve gone through some rough patches,
but we have stayed focused on the fundamentals of our business,
learned from our mistakes, and preserved the core of our Company
while being willing to change everything else necessary to win
with consumers and retail customers.
We’ve been able to do this so consistently over time because of the
quality of P&G people. They are P&G’s most important competitive
advantage. Along with our time-tested business model, we have
a successful and equally tested model of hiring the best people and
building them into the best leaders in our industry. The character
and caliber of P&G people remain my greatest sources of confi dence
in our Company’s future.
Robert A. McDonaldChairman of the Board, President and Chief Executive Offi cer
12 The Procter & Gamble Company


![[RTF]goaprintingpress.gov.ingoaprintingpress.gov.in/downloads/7374/7374-13-SIII-EOG...Keni Brothers -Ganga INiwas -General Souza Bran, dao Road, Panaji. Karmali Virjee -Afonso de Albuquerque](https://static.fdocuments.in/doc/165x107/5aa857b27f8b9a86188b6f51/rtf-brothers-ganga-iniwas-general-souza-bran-dao-road-panaji-karmali-virjee.jpg)