720-686-1-PB (1).pdf
11
© 2013. Gaurva Verma, Dr. M.K.Verma & Dr. R.K.Tripathi. This is a research/review paper, distributed under the terms of the Creative Commons Attribution-Noncommercial 3.0 Unported License http://creativecommons.org/licenses/by-nc/3.0/), permitting all non commercial use, distribution, and reproduction in any medium, provided the original work is properly cit ed. Global Journal of Researches in Engineering Civil And Structural Engineering Volume 13 Issue 1 Version 1.0 Year 2013 Type: Double Blind Peer Reviewed International Research Journal Publisher: Global Journals Inc. (USA) Online ISSN: 2249-4596 & Print ISSN: 0975-5861 Dynamic Analysis of Hirakud Dam Due to Seismic Forces By Gaurva Verma, Dr. M.K.Verma & Dr. R.K.Tripathi Deptt.of Civil Engg, NIT, Raipur, India Abstract - The present study investigates and analyses the behavior of a concrete gravity dam during the strong ground horizontal motions due to an earthquake with CADAM. The model in thesis is the structure of Hirakud gravity dam. Hirakud dam across river Mahanadi in eastern India is a composite structure of earth, concrete and masonry. Length of the main dam is 4.80 Km, flanked by 21 km earthen dykes on left and right sides, making a total length of 25.8km. Two concrete spillways of average height 45.75 m and maximum height 60.96 m are located in the two arms of the river. Hirakud dam has been built at Latitude 210-32’ N and Longitude 830-52’E across river Mahanadi at about 15 km upstream of Sambalpur town. This is the first post independence major multipurpose river valley project in India. It hasn't ever shakes under the influence of powerful ground motions in the area. Because of lowness and special firmness of the structure it behaves like a solid body, therefore the structure should be compared with many different earthquake accelerations and then the maximum vibration of the body is considerable. After linear dynamic analysis with CADAM the results show the stresses on the body of the dam are relative to particularity of each earthquake like magnitude, epicenter distance and PGA .The body of dam is modeled two dimensional in CADAM. Keywords : dynamic analysis, concrete dam, seismic forces simulating. GJRE Classification : DynamicAnalysisofHirakudDamDuetoSeismicForces Strictly as per the compliance and regulations of : FOR Code : 090506
-
Upload
astrid-aubry -
Category
Documents
-
view
224 -
download
0
Transcript of 720-686-1-PB (1).pdf

7/27/2019 720-686-1-PB (1).pdf
http://slidepdf.com/reader/full/720-686-1-pb-1pdf 1/11
© 2013. Gaurva Verma, Dr. M.K.Verma & Dr. R.K.Tripathi. This is a research/review paper, distributed under the terms of the
Creative Commons Attribution-Noncommercial 3.0 Unported License http://creativecommons.org/licenses/by-nc/3.0/), permittingall non commercial use, distribution, and reproduction in any medium, provided the original work is properly cited.
Global Journal of Researches in EngineeringCivil And Structural EngineeringVolume 13 Issue 1 Version 1.0 Year 2013
Type: Double Blind Peer Reviewed International Research Journal
Publisher: Global Journals Inc. (USA)
Online ISSN: 2249-4596 & Print ISSN: 0975-5861
Dynamic Analysis of Hirakud Dam Due to Seismic Forces
By Gaurva Verma, Dr. M.K.Verma & Dr. R.K.TripathiDeptt.of Civil Engg, NIT, Raipur, India
Abstract - The present study investigates and analyses the behavior of a concrete gravity dam
during the strong ground horizontal motions due to an earthquake with CADAM. The model in
thesis is the structure of Hirakud gravity dam. Hirakud dam across river Mahanadi in eastern
India is a composite structure of earth, concrete and masonry. Length of the main dam is 4.80Km, flanked by 21 km earthen dykes on left and right sides, making a total length of 25.8km. Two
concrete spillways of average height 45.75 m and maximum height 60.96 m are located in the
two arms of the river. Hirakud dam has been built at Latitude 210-32’ N and Longitude 830-52’E
across river Mahanadi at about 15 km upstream of Sambalpur town. This is the first post
independence major multipurpose river valley project in India. It hasn't ever shakes under the
influence of powerful ground motions in the area. Because of lowness and special firmness of
the structure it behaves like a solid body, therefore the structure should be compared with many
different earthquake accelerations and then the maximum vibration of the body is considerable.
After linear dynamic analysis with CADAM the results show the stresses on the body of the damare relative to particularity of each earthquake like magnitude, epicenter distance and PGA .The
body of dam is modeled two dimensional in CADAM.
Keywords : dynamic analysis, concrete dam, seismic forces simulating.
GJRE Classification :
DynamicAnalysisofHirakudDamDuetoSeismicForces Strictly as per the compliance and regulations of :
FOR Code : 090506

7/27/2019 720-686-1-PB (1).pdf
http://slidepdf.com/reader/full/720-686-1-pb-1pdf 2/11
Dynamic Analysis of Hirakud Dam Due toSeismic Forces
Gaurva Verma α, Dr. M.K.Verma σ & Dr. R.K.Tripathi ρ
Abstract - The present study investigates and analyses thebehavior of a concrete gravity dam during the strong ground
horizontal motions due to an earthquake with CADAM. The
model in thesis is the structure of Hirakud gravity dam.Hirakud dam across river Mahanadi in eastern India is a
composite structure of earth, concrete and masonry. Length of
the main dam is 4.80 Km, flanked by 21 km earthen dykes on
left and right sides, making a total length of 25.8km. Two
concrete spillways of average height 45.75 m and maximumheight 60.96 m are located in the two arms of the river. Hirakud
dam has been built at Latitude 210
-32’ N and Longitude 830
-
52’E across river Mahanadi at about 15 km upstream of
Sambalpur town. This is the first post independence majormultipurpose river valley project in India. It hasn't ever shakes
under the influence of powerful ground motions in the area.
Because of lowness and special firmness of the structure it
behaves like a solid body, therefore the structure should becompared with many different earthquake accelerations and
then the maximum vibration of the body is considerable. After
linear dynamic analysis with CADAM the results show thestresses on the body of the dam are relative to particularity of
each earthquake like magnitude, epicenter distance and PGA.
The body of dam is modeled two dimensional in CADAM.The procedure of analyses is linear response spectra analysis.
The acceleration records of ground motions in the CADAM
dynamic response spectra analysis are real records of
occurred earthquakes. The other data which are used inCADAM modeling are approximately unreal and exaggerated
and they are used for magnifying the influence of earthquake
on the dam's body.
Keywords : dynamic analysis, concrete dam, seismic forces simulating.
I. Introduction
istorically Odisha has experienced very fewmoderate to large earthquakes. Some eventswith magnitudes in excess of 5.0 have originated
in the Bay of Bengal off the coast of the state. Several
faults have been identified in the region and some haveshown evidence of movement during the Holoceneepoch. The Brahmani Fault in the vicinity of Bonaigarh isamong then. The Mahanadi also flows through a grabenstructure. Several deep-seated faults are situatedbeneath the Mahanadi Delta. However, it must be statedthat proximity to faults does not necessarily translate
Author α: Research Scholar Deptt.of Civil Engg. NIT, Raipur, (C.G.)
492010, India. E-mail : [email protected] Author σ : Professor Deptt.of Civil Engg NIT, Raipur, (C.G.) 492010,
India. E-mail : [email protected] Author ρ: Associated Professor Deptt.of Civil Engg NIT, Raipur, (C.G.)
492010, India. E-mail : [email protected]
into a higher hazard as compared to areas locatedfurther away, as damage from earthquakes depends onnumerous factors such as subsurface geology as wellas adherence to the building codes.
Recognizing an earthquake behavior is of highimportance. Previous earth quake experiences has shedlight on the fact that in order to decrease the damagescaused by earthquakes is only possible through indepth studies of previous earth quakes and also takinginto consideration quake behavior of importantstructures. Concrete dames are of great importance
because any damage can cause irreparable financialand causalities. Dynamic analysis of the concrete weightdams against external and internal forces has been thecenter of attention for Scientists and experts.
Present study is focused on dynamic analysis ofconcrete dam against difference forces caused byrecent earthquakes. HassanMirza-Bozorg andMehdiVarmarziar in 2009 did a study in which theystudied the effect of earthquake on the linear responseof the concrete dam. The purpose of this study was tostudy the effect of non-uniform instigation tremulous ontremulous response of concrete dam and to compare itto uniform instigation which is common in analyzing anddesigning dams using the ABAQUES software. Choprain 1991 studied the effect of earthquake on a weightdam conditional of the fact that there is a shaking floorunder the dam. In this study the effect of earthquake ona rigid dam and a flexible dam was studied and severalgraphs were shown. Several problems that are a resultof static analysis method are addressed. Variousdrawbacks include not considering: the structuralelasticity, damping forces, variation of the foundationacceleration over time, and the alternation and shortduration characteristics of the seismic loading. InResponse Spectra analysis method the history of the
structures behavior under the accelogram of theearthquake was studied and the forces, stresses andmovements were calculated. In this study CADAM wasused which is considered to be powerful software of thiskind. For the purpose of response spectra records ofreal earthquakes such as earthquake on 12 June 2001 -Konokjora-Sundargarh area, Odisha, Mw 4.7, is used.
II. History
Dynamic analysis of concrete dam is morecomplicated compared to other buildings under thesame conditions. ICOLD recommendations are followed
H G l o b a
l J o u r n a l o f R e s e a r c h e s i n E n g i n e e r i n g
X I I I I s s u e
I V e r s i o n I
1
Y e a r
2 0 1 3
V o l u m e
(D
) E
© 2013 Global Journals Inc. (US)

7/27/2019 720-686-1-PB (1).pdf
http://slidepdf.com/reader/full/720-686-1-pb-1pdf 3/11
while evaluating the seismic parameters (ICOLD, 1989),therefore an Operating Basis Earthquake (OBE) and aMaximum Credible Earthquake (MCE) are considered.The seismic input is defined in terms of maximumhorizontal accelerations and unified response spectra. Artificial acceleration time histories which are compatiblewith the response spectra are also provided and can be
employed especially for non-linear analyses. McGuire´srelationship between magnitude, distance and groundacceleration is used when evaluating the maximumhorizontal acceleration which is based on theearthquake-catalogue (Lenhardt, 1995). For the OBE, areturn period of 200 years is selected with a minimumvalue of 0.6 m/s2. For the MCE, not only the results ofextreme-value statistics are considered, but also theglobal geology and long-term tectonic processes aretaken into account. The resulting ground accelerationscould be considered as approximate values only and, ingeneral, more detailed studies including the localgeological situation are necessary for a specific site. The
maximum acceleration of the vertical excitation isdefined as 2/3 of the respective maximum horizontalacceleration.
A pseudo-dynamic seismic analysis is based onthe response spectra method. It is conceptually similarto a pseudo-static analysis except that it recognizes thedynamic amplification of the inertia forces along theheight of the dam. However, the oscillatory nature of theamplified inertia forces is not considered. That is thestress and stability analyses are performed with theinertia forces continuously applied in the same direction.Since the pseudo-dynamic method does not recognize
the oscillatory nature of earthquake loads it is alsoappropriate to perform the safety evaluation in twophases: (a)the stress analysis using peak spectralacceleration values, and (b) the stability analysis usingsustained spectral acceleration values. It is assumed inthese analyses that the dynamic amplification appliesonly to the horizontal rock acceleration. The period ofvibration of the dam in the vertical direction isconsidered sufficiently small to neglect the amplificationof vertical ground motions along the height of the dam.
a) The equations governing the lineal dynamic analysis of structures
For three-dimensional seismic motion, thetypical modal Equation is written as:
() + 2 () + 2
() =
() + () + nz ()
Where the three Mode Participation Factors aredefined by
= −∅
In which i is equal to x, y or z. Two majorproblems must be solved to obtain an approximate
response spectrum solution to this equation. First, foreach direction of ground motion, maximum peak forcesand displacements must be estimated. Second, afterthe response for the three orthogonal directions hasbeen solved, it is necessary to estimate the maximumresponse from the three components of earthquakemotion acting at the same time. This section addresses
the modal combination problem from one component ofmotion only.For input in one direction only, Equation (15.1)
is written as:
Given a specified ground motion (),
damping value and assuming Pni= -1.0, it is possible tosolve the Equation at various values of and plot acurve of the maximum peak response () . For thisacceleration input, the curve is by definition thedisplacement response spectrum for the earthquakemotion. A different curve will exist for each differentvalue of damping.
A plot of () is defined as the pseudo-
velocity spectrum and a plot of 2( ) is definedas the pseudo-acceleration spectrum.
The three curves-displacement responsespectrum, pseudo-velocity spectrum, and pseudo-acceleration spectrum are normally plotted as one curveon special log paper. However, the pseudo-values haveminimum physical significance and are not an essentialpart of a response spectrum analysis. The true valuesfor maximum velocity and acceleration are calculatedfrom the solution of Equation (15.2). There is a
mathematical relationship, however, between thepseudo-acceleration spectrum and the total accelerationspectrum. The total acceleration of the unit mass, singledegree-of-freedom system, governed by Equation(15.2), is given by:
() = () + ()
Equation (15.2) can be solved for (t ) andsubstituted into Equation (15.3) to yield:
() = −2() − 2 ()
Therefore, for the special case of zero damping,
the total acceleration of the system is equal to 2
y (t ) .For this reason, the displacement response spectrum curve is normally not plotted as modal displacement y ()MAX versus . It is standard to present the curve interms of S () versus a period T in seconds,
Where:
S ( )a = −( )2()MAX
and
2
Dynamic Analysis of Hirakud Dam Due to Seismic Forces
G l o b a
l J o u r n a l o f R e s e a r c h e s i n E n g i n e e r i n g
X I I I I s s u ev
I V
e r s i o n I
2
Y e a r
2 0 1 3
V o l u m e
(D
) E
© 2013 Global Journals Inc. (US)© 2013 Global Journals Inc. (US)
() + 2 () + 2 () = ()

7/27/2019 720-686-1-PB (1).pdf
http://slidepdf.com/reader/full/720-686-1-pb-1pdf 4/11
The pseudo-acceleration spectrum curve, S ()a , has the units of acceleration versus period thathas some physical significance for zero damping only. Itis apparent that all response spectrum curves representthe properties of the earthquake at a specific site andare not a function of the properties of the structuralsystem. After an estimation is made of the linear viscous
damping properties of the structure, a specific responsespectrum curve is selected.
III. Modeling the D ams S ystem and
Foundation
The Hirakud Dam is a composite structure ofearth, concrete and masonry. Ten km north ofSambalpur, it is the longest major earthen dam in theworld, measuring 24 km including dykes, and standsacross the river Mahanadi. The main dam has an overalllength of 4.8 km spanning between two hills; theLamdungri on the left and the Chandili Dunguri on the
right. The dam is flanked by 21 km earthen dykes onboth the left and right sides, closing the low saddlesbeyond the adjoining hills. The dam and dykes togethermeasure 25.8 km. It also forms the biggest artificial lakein Asia, with a reservoir holding 743 km² at full capacity,with a shoreline of over 640 km.
The building of the dam in spite of its greatheight and its hardness shows a strong behavior underhorizontal movements, because of this in the belowstudy the modeling was done under the acceleration ofseveral earthquakes so that we can study the maximumvibration.
The study area lies between 17° to 24°N, 78°o88°E and a simplified geology map (Sarkar, 2001) withmain tectonic elements (GSI, 2000) is shown in Fig. 1.The Bastar craton [BB] is separated from the Dharwar[DB] and Singhbhum cratons [SB] by the Godavari [GG]and Mahanadi [MG] Gondwana grabens respectively;with the Eastern Ghat Mobile belts [EGMB] lying to thesouth east. From detailed geological, petrological andstructural studies the Central Indian shear (CIS, Yedekaret al., 1990) has been identified, which separates theBastar block from the northern (Bundelkhand) block.The western side of this shear is buried under alluviumand traps while to the east it forks into two parts with the
northern part coming close to the Tan shear. Fromgeological and geochronological data the other arm isconjectured to extend eastwards below the Gondwanasediments and merge with the Singhbhum shear [8](Yedekar et al., 1990). The Tan shear [3] is believed toextend below the cover (Yedekar et al., 1990) andpossibly joins the Barabhum shear [7] within theSinghbhum block [SB]. Due to the extensive surfacecover of the Mahanadi Graben [MG] by the Gondwanasediments, the subsurface extension of these structuresneeds to be verified. The north-western part of the studyregion and the northern part of the Godavari Graben are
covered by Deccan flood basalts. The Bastar cratonconsists of two Proterozoic basins (Chattisgarh [C] andIndravati [I]). The Central Indian Tectonic zone (CITZ)(Yedekar et al., 1990) lying to the north of the CIS ismarked by several sub-parallel ENE trending faults:Narmada North and South [11 and 12], Tapti fault [1],Gavilgarh fault [2], Tan shear [3], Bamni-Chilpa fault [5]
and Tatapani fault [6]. The Tatapani area has severalthermal springs that are responsible for the high heatflow in Central India (Ravi Shankar, 1991). TheSinghbhum Block [SB] to the east is separated from therest of the Indian Peninsular Shield by the MahanadiGraben [MG] occurring to its west and the Sukindathrust (Mahadevan, 2001) to the south. Tectonically, thisblock includes the Singhbhum granite (which includesbanded iron formation) to the south, and the ProterozoicSinghbhum mobile belt in the middle separated from theChotanagpur Granite Gneiss terrain in the north by theBarabhum shear [7]. The Eastern Ghat Mobile Belt(EGMB) is a high-grade NE-SW metamorphic belt to the
south of the Singhbhum block. The EGMB is separatedfrom the adjoining blocks by a major shear/thrust calledSileru shear zone
Figure 1 : Simplified geology ande tectonic map of thestudy area redrawn from Sarkar (2001) and GSI (2000).DB-Dharwar block, BB-Bastar block, SB-Singhbhumblock, CITZ-Central Indian Tectonic zone,EGMB-EasternGhat Mobile Belt, GG-Godavari graben, MG-Mahanadigraben, I-Indravati basin, C-Chattisgarh basin, 1-Tapti
fault, 2-Gavilgarh fault, 3-Tan shear, 4-Central Indianshear, 5-Bamni-Chilpa fault,6-Tatapani fault, 7- arabhumshear, 8-Singhbhum shear, 9-Sukinda thrust, 10-Silerushear, 11-North Narmada fault, 12-South Narmada fault.Hy-Hyderabad, Bn-Bhubhaneswar, Dn-Dhanbad, Jb-Jabalpur, Np-Nagpur.
Dynamic Analysis of Hirakud Dam Due to Seismic Forces
G l o b a
l J o u r n a l o f R e s e a r c h e s i n E n g i n e e r i n g
X I I I I s s u e
I V e r s i o n I
3
Y e a r
2 0 1 3
V o l u m e
(D
) E
© 2013 Global Journals Inc. (US)

7/27/2019 720-686-1-PB (1).pdf
http://slidepdf.com/reader/full/720-686-1-pb-1pdf 5/11
Figure 2 : Figure showing the Mahanadi Basin
Figure 3 : A view of the dam
Since the pseudo-dynamic method does notrecognize the oscillatory nature of earthquake loads it isalso appropriate to perform the safety evaluation in twophases: (a)
the stress analysis using peak spectral
acceleration values, and (b) the stability analysis usingsustained spectral acceleration values. It is assumed inthese analyses that the dynamic amplification appliesonly to the horizontal rock acceleration. The period ofvibration of the dam in the vertical direction isconsidered sufficiently small to neglect the amplificationof vertical ground motions along the height of the dam.
To ensure the accuracy of the pseudo-dynamicmethod, the structure is divided in thin layers to performnumerical integrations. Number of divisions up to 301can be specified. The weight of the concrete is2630Kg/m3.The Poisson’s coefficient was 0.2. Thedynamic flexibility of the structure is modeled with thedynamic concrete Young’s modulus (Es) 27400MPa.The dam damping on rigid foundation without reservoirinteraction is considered to be 0.05. Any change tothese basic parameters affects the fundamental periodof vibration and the damping of the dam-foundation-reservoir system. Thus the spectral accelerations are
evaluated. The wave reflection coefficient (α) is the ratioof the amplitude of the reflected hydrodynamic pressurewave to the amplitude of a vertical propagating pressurewave incident on the reservoir bottom. A value of α
= 1
indicates that pressure waves are completely reflected,and smaller values of α
indicate increasingly absorptive
materials .The value of α is considered to be 0.5. The
velocity of pressure waves in water is in fact the speedof sound in water. Generally it is assumed at 1440m/sec (4720 ft/sec).
Because the maximum response in the naturalvibration mode and in higher modes doesn't occur at thesame time, a modal combination has to be considered.Four options are offered to the user: (i) Only the firstmode; (ii) Only the static correction computed for highermodes; (iii) SRSS (square-root-of-the-sum-of-squares ofthe first mode and static correction for higher modes); orthe (iv) Sum of absolute values which provides alwaysconservative results.
The
SRSS combination is considered for the study.
Figure 4
: Accelograph for
12 June 2001
- Konokjora-
Sundargarh area, Odisha, Mw 4.7 earthquake
IV.
A nalysis and R esults
Dyamic Analysis of the dam section has beenperformed using CADAM with the parameters of thedam as input. The dam section has been checked forvarious load combinations .The result of stress andstability analysis for usual combination had beenpresented through Table 1 and Table 2 respectivelywhereas Table 3 and Table 4 depicts the results ofstress and stability analysis for flood combination. It isevident from the results that the stress are within thepermissible limits on all the joints and the Factor ofsafety for Overturning and Sliding is quite higher thanthe desired/safe values as per the code. The results ofstress and stability analysis for peak acceleration valuesand sustained acceleration values for Seismic 1(OBE)has been presented through Table 5-8 It is observedthat the dam section is safe for all seismic combinations
Dynamic Analysis of Hirakud Dam Due to Seismic Forces
G l o b a
l J o u r n a l o f R e s e a r c h e s i n E n g i n e e r i n g
X I I I I s s u ev
I V
e r s i o n I
4
Y e a r
2 0 1 3
V o l u m e
(D
) E
© 2013 Global Journals Inc. (US)

7/27/2019 720-686-1-PB (1).pdf
http://slidepdf.com/reader/full/720-686-1-pb-1pdf 6/11
and the dam is safe against stresses, sliding andoverturning at all the joints considered.
The overall results can be summarized asfollows. The dam section is found to be safe for thepresent PGA values of 0.16g and no further retrofittingmeasures are required for the section presently. TheFOS for sliding and overturning are observed as 8.974
and 6.258 for usual combination where as required is1.00. For flood combination the FOS is observed as5.385 and 5.939 whereas required is greater than1. Forseismic 1 combination FOS is 19.707 and 4.336 whenrequired is 1.1 . The Static, Pseudo-Static and PseudoDynamic Loads with the position of application aresummarized from Table 9 to Table 16.
Table 1 : Usual combination (stress analysis)
Table 2
: Usual combination (stability Analysis)
Joint
Safety Factors
Resultants
Uplift
ID
Upstre
am
Elevati
on
Sliding
Peak residual Overturning
Toward
u/s d/s
Uplifting
Normal
kN Shear
KN Moment
KN Position
% of
joint
Final
Force
kN
1
60.000
>100
> 100
> 100
> 100
> 100
-215.2
0.0
0.0
50.000
2
50.000
>100
> 100
> 100
> 100
> 100
-2381.7
0.0
-1108.9
45.404
3
40.000
>100
40.973
12.909
11.994
12.592
-5247.8
128.1
-4933.7
34.244
50.000
4
30.000
33.034
8.001
5.892
4.876
5.651
-8960.0
1119.9
-34795.1
35.059
45.404
5
20.000
16.566
4.450
4.760
3.403
4.294
-13761.2
3092.7
-55802.8
38.045
34.244
6
10.000
11.085
3.250
4.369
2.779
3.727
-19651.5
6046.5
-72464.9
41.189
35.059
7
Base
8.974
3.032
6.258
3.184
5.101
-30265.7
9981.2
-109446.0
42.736
38.045
Required >1.00 >1.000 >1.000 >1.000 >1.000
Table 3 : Flood combination (stress analysis)
joint
Stresses
ID
Upstream
Elevation
(m)
Normal stresses
U/s D/s
(kPa) (kPa)
Allowable stresses
Tension
compression
Shear
u/s maximum D/s
(kPa) (kPa) (kPa)
1
60.000
-23.544
-23.544
0.000 -15000.00
2
50.000
-191.114
-207.443
0.000 -15000.00
0.000 -22.397 164.497
3
40.000
-293.961
-167.575
0.000 -15000.00
0.000 132.883 132.883
4
30.000
-288.830
-281.060
0.000 -15000.00
0.000 222.874 222.874
5 20.000 -269.627 -422.169 0.000 -15000.00 0.000 334.770 334.770
6
10.000
-247.919
-571.632
0.000 -15000.00
0.000 453.290 453.290
7
Base
-411.487
-724.370
0.000 -15000.00
0.000 574.407 574.407
Dynamic Analysis of Hirakud Dam Due to Seismic Forces
G l o b a
l J o u r n a l o f R e s e a r c h e s i n E n g i n e e r i n g
X I I I I s s u e
I V e r s i o n I
5
Y e a r
2 0 1 3
V o l u m e
(D
) E
© 2013 Global Journals Inc. (US)
Joint Stresses
ID
UpstreamElevation
(m)
Normal stressesU/s D/s
(kPa) (kPa)
Allowable stressesTension compression
Shearu/s maximum D/s
(kPa) (kPa) (kPa)
1 60.000 -23.544 -23.544 0.000 -9990.000
2 50.000 -299.908 -170.263 0.000 -9990.000
3 40.000 -565.245 -15.875 0.000 -9990.000 0.000 12.588 12.588
4 30.000 -653.789 -35.684 0.000 -9990.000 0.000 58.710 28.297
5 20.000 -696.683 -114.696 0.000 -9990.000 0.000 121.565 90.951
6 10.000 -717.814 -221.321 0.000 -9990.000 0.000 195.466 175.402
7 Base -872.986 -342.992 0.000 -9990.000 0.000 280.541 271.984
Table 4 : Flood combination (stability Analysis)
Joint Safety Factors Resultants Uplift
ID
Upstream
Elevation
Sliding
Peakresidual
Overturning
towardu/s d/s
Uplifting
Normal
kN
Shear
KN
Moment
KN
Position
% ofjoint
Final
ForcekN
1 60.000 > 100 > 100 > 100 > 100 > 100 -215.2 0.0 0.0 50.000
2 50.000 47.116 7.724 9.462 4.269 6.565 -2018.9 261.4 139.7 50.683 362.8
3 40.000 15.509 2.839 4.707 2.526 3.720 -4167.9 1468.0 -3435.6 45.436 1532.6

7/27/2019 720-686-1-PB (1).pdf
http://slidepdf.com/reader/full/720-686-1-pb-1pdf 7/11
4
30.000
9.512
2.026
4.177
2.033
3.128
-7405.9
3655.6
-437.4
49.773
3480.3
5
20.000
7.083
1.719
4.044
1.819
2.891
-11733.0
6824.3
14626.2
53.675
6206.0
6
10.000
5.782
1.563
3.998
1.702
2.766
-17149.2
10973.9
47247.1
56.583
9709.5
7
Base
5.385
1.755
5.939
2.033
4.016
-28271.5
16104.5
64611.4
54.591
9374.0
Required >1.0000 >1.000 >1.000 >1.000 >1.000
Table 5 : Seismic #1 combination-Peak accelerations (Stress Analysis)
Table 6 : Seismic #1 combination-Peak accelerations (Stability Analysis)
Table
7
:
Seismic #1 combination-Sustained accelerations (Stress Analysis)
joint
Stresses
ID
Upstream
levation(m)
Normal stresses
/s D/s
kPa) (kPa)
Allowable stresses
ension compression
Shear
/s maximum D/s
kPa) (kPa) (kPa)
1
60.000
-25.491
-23.167
0.000 -27270.000
0.000 -5.267 0.000
2
50.000
-405.094
-80.749
0.000 -27270.000
0.000 -58.450 64.032
3
40.000
-694.229
0.000
0.000 -27270.000
0.000 -32.352 0.000
4
30.000
-781.563
0.000
0.000 -27270.000
0.000 27.458 0.000
5
20.000
-824.091
-22.546
0.000 -27270.000
0.000 90.646 17.878
6
10.000
-854.207
-127.713
0.000 -27270.000
0.000 150.389 101.273
7
Base
-1026.093
-240.301
0.000 -27270.000
0.000 218.551 190.553
joint Stresses
ID
Upstream Elevation
(m)
Normal stresses U/s D/s (kPa) (kPa)
Allowable stresses Tension
compression
Shear u/s maximum
D/s (kPa) (kPa) (kPa)
1 60.000 -28.061 -24.050 0.000 -27270.000 0.000 -9.068 0.000 2 50.000 -485.349 -34.973 0.000 -27270.000 0.000 -68.147 27.733 3 40.000 -797.246 0.000 0.000 -27270.000 0.000 -45.624 0.000 4 30.000 -841.444 0.000 0.000 -27270.000 0.000 26.446 0.000 5 20.000 -878.089 -46.114 0.000 -27270.000 0.000 63.312 36.567 6 10.000 -960.965 -115.083 0.000 -27270.000 0.000 98.155 91.258 7 BASE -1204.610 -172.699 0.000 -27270.000 0.000 138.375 136.946
Joint
Safety Factors
Resultants
Uplift
ID
Upstream
Elevation
Sliding
Peak residual
Overturning
Toward
u/s d/s
Uplifting
Normal
kN
Shear
KN
Moment
KN
Position
% of
joint
Final
Force
kN
1
60.000
> 100
4.310
38.973
> 100
> 100
-238.1
-55.3
-27.9
48.717 2
50.000
32.229
6.437
4.619
> 100
> 100
-2635.7
-409.5
-3852.3
35.574
48.6
3
40.000
63.373
13.106
3.801
14.598
13.936
-5855.8
-446.8
-14337.2
27.112
452.7 4
30.000
95.377
23.863
3.999
5.662
6.254
-10121.2
424.1
-40580.1
30.853
1926.3
5
20.000
33.843
9.830
4.103
3.872
4.752
-15674.7
1594.6
-79772.5
34.997
4177.8 6
10.000
23.665
7.492
3.656
3.187
4.124
-22516.4
3005.3
-123459.6
36.898
7207.2
Base
19.707
7.089
4.336
3.700
5.645
-34281.2
4835.9
-213093.8
37.513
7379.7 Required >1.000 >1.000 >1.00 >1.00 >1.00
Dynamic Analysis of Hirakud Dam Due to Seismic Forces
G l o b a
l J o u r n a l o f R e s e a r c h e s i n E n g i n e e r i n g
X I I I I s s u ev
I V
e r s i o n I
6
Y e a r
2 0 1 3
V o l u m e
(D
) E
© 2013 Global Journals Inc. (US)
2 50.000 48.511 9.221 6.952 > 100 > 100 -2461.1 -266.9 -2774.3 38.873
3 40.000 79.350 16.094 4.571 13.316 13.012 -5437.8 -337.9 -14197.9 28.913 452.7
4 30.000 90.446 21.348 3.717 5.310 5.840 -9322.8 436.7 -37068.9 30.597 1926.3
Table 8 : Seismic #1 combination-Sustained accelerations (Stability Analysis)
Joint Safety Factors Resultants Uplift
ID
UpstreamElevation
SlidingPeak
residual
Overturningtoward
u/s d/sUplifting
NormalkN
ShearKN
MomentKN
Position
% ofjoint
FinalForce
kN
1 60.000 > 100 6.929 62.817 > 100 > 100 -222.4 -32.1 -16.2 49.204

7/27/2019 720-686-1-PB (1).pdf
http://slidepdf.com/reader/full/720-686-1-pb-1pdf 8/11
Table 9
:
Static
Loads (1/1)
Self Weight
Normal Operating Level
Joint
Dam
Upstream Reservoir
Uplift
ID
UpstreamElevation
Vertical Load
Horizontal Load
Normal Load
D(kN)
Position x
Hnu(kN)
Elevation(m)
Un(kN)
PositionI(m)
1
60.00
-215.2
4.570
2
50.00
-2381.7
4.600
3
40.00
-5700.5
6.133
128.1
41.703
452.7
6.020
4
30.00
-10886.3
6.515
1119.9
35.037
1926.3
8.664
5
20.00
-17939.0
11.090
3092.7
28.370
4177.8
11.307
6
10.00
-26858.7
13.721
6046.5
21.703
7207.2
13.950
7
Base
-37645.4
16.370
9981.2
15.037
7379.7
16.593
Table
10
:
Static Loads (2/2)
Flood Level
Joint
Upstream Reservoir
Uplift
ID
Upstream
Elevation
Horizontal Load
Normal Load
Hnu(kN)
Elevation(m)
Un(kN)
PositionI(m)
1
60.00
2
50.00
261.4
52.433
362.8
3.377
3
40.00
1468.0
45.767
1532.6
6.020
4
30.00
3655.6
39.100
3480.3
8.664
5
20.00
6824.3
32.433
6206.0
11.307
6
10.00
10973.9
25.767
9709.5
13.950
7
Base
16104.5
19.100
9374.0
16.593
5
20.000
24.279
6.693
3.573
3.662
4.437
-14359.2
2145.4
-76854.7
34.221
4177.8
6
10.000
14.504
4.363
3.537
2.972
3.851
-20546.8
4709.6
-106034.4
37.669
7207.2
7
Base
11.298
3.898
4.781
3.397
5.271
-31520.5
8086.4
-162269.2
39.658
7379.7
Required >1.000 >1.000 >1. 00 >1.00 >1.00
Dynamic Analysis of Hirakud Dam Due to Seismic Forces
G l o b a
l J o u r n a l o f R e s e a r c h e s i n E n g i n e e r i n g
X I I I I s s u e
I V e r s i o n I
7
Y e a r
2 0 1 3
V o l u m e
(D
) E
© 2013 Global Journals Inc. (US)
Table 11 : Pseudo-Static Loads (Seismic Coefficient)-Stress Analysis
JOINT Inertia LoadReservoirs (Operating
Level)
Dam UpstreamID Upstream Elevation Horizontal Load Vertical Load Horizontal Load
Qh(Kn)
Elevation(m)
Qv(kN)
Positionx(m)
Hdu(kN)
Elevation(m)
1 60.00 -34.4 60.500 -23.0 4.570
2 50.00 -381.1 55.469 -254.0 4.600
3 40.00 -912.1 49.101 -608.1 6.133 -66.1 42.044
4 30.00 -1741.8 42.241 -1161.2 8.515 -336.2 36.044
5 20.00 -2870.2 35.376 -1913.5 11.090 -720.3 30.044
6 10.00 -4297.4 28.551 -2864.9 13.721 -1190.9 24.044
7 Base -6023.3 21.762 -4015.5 16.370 -1734.3 18.044
JOINTInertia Load Reservoirs Level)
Dam UpstreamID Upstream Elevation Horizontal Load Vertical Load Horizontal Load
Qh(Kn)
Elevation(m)
Qv(kN)
Positionx(m)
Hdu(kN)
Elevation(m)
1 60.00 -10.8 60.500 -7.2 4.570
2 50.00 -119.1 55.469 -79.4 4.600
Table 12 : Pseudo-Static Loads (Seismic Coefficient)
(Operating

7/27/2019 720-686-1-PB (1).pdf
http://slidepdf.com/reader/full/720-686-1-pb-1pdf 9/11
3
40.00
-285.0
49.101
-190.0
6.133
-20.7
42.044
4
30.00
-544.3
42.241
-362.9
8.515
-105.1
36.044
5
20.00
-897.0
35.376
-598.0
11.090
-225.1
30.044
6
10.00
-1342.9
28.551
-895.3
13.721
-372.2
24.044
7
Base
-1882.3
21.762
-1254.8
16.370
-542.0
18.044
T a b l e 1 3
:
P s e u d o -
D y n a m i c
L o a d s ( C h o p r a ' S
M e t h o d ) -
S t r e
s s A n a l y s i s ( 1 / 2 )
Dynamic Analysis of Hirakud Dam Due to Seismic Forces
© 2013 Global Journals Inc. (US)
JOIN
FR
MOD
H
GH
MOD
MOD
C
MBN
ON
D
M
R
OIR
(U
R
M)
TOTA
D
M
R
OIR
(U
R
M)
TOTA
S
H
RZON
A
LOAD
H
RZON
A
LOAD
H
RZON
A
LOAD
H
RZON
A
LOAD
H
RZON
A
LOAD
H
RZON
A
LOAD
H
RZON
A
LOAD
I D
U p s t r e
a m
E l e v a t i
o n
( m )
E q 1
( k N )
e l e v a t i o n
( m )
H d 1
( k N )
e l e v a t i
o n
( m )
E m 1
( k N )
E l e v a t i o
n ( m )
E q s
( k N )
E l e v a t i
o n
( m )
H d s
( k N )
E l e v a t i
o n
( m )
E m s
( k N )
E l e v a t i o
n ( m )
E m c
( k N )
E l e v a
t i
o n
( m )
1
6 0 . 0
0
- 2 8 . 5
6 0 . 5
0 4
- 2 8 . 5
6 0 . 5
0 4
4 7 . 3
6 0 . 5
0 6
4 7 . 3
6 0 . 5
0 6
- 5 5 . 3
6 0 . 5 0
5
2
5 0 . 0
0
- 2 4 6 . 6
5 6 . 0
0 9
- 2 4 6 . 6
5 6 . 0
0 9
3 2 6 . 9
5 6 . 6
3 9
3 2 6 . 9
5 6 . 6
3 9
- 4 0 9 . 5
5 6 . 4 1
1
3
4 0 . 0
0
- 4 4 0 . 1
5 1 . 1
4 2
- 1 2 . 5
4 1 . 8
8 0
- 4 5 2 . 6
5 0 . 8
8 6
3 5 1 . 6
5 6 . 4
3 7
2 . 9
5 6 . 7
7 6
3 5 4 . 5
5 6 . 4
3 9
- 5 7 4 . 9
5 3 . 0 6
6
4
3 0 . 0
0
- 6 2 0 . 8
4 6 . 4
9 1
- 6 1 . 0
3 6 . 2
6 0
- 6 8 1 . 8
4 5 . 5
7 6
4 0 . 8
2 2 7 . 7
8
7
- 1 7 9 . 4
3 3 . 7
6 3
- 1 3 8 . 6
- 2 3 . 3
8 6
- 6 9 5 . 7
4 4 . 9 0
4
5
2 0 . 0
0 0
- 7 5 4 . 2
4 2 . 7
5 1
- 1 1 2 . 7
3 1 . 1
1 1
- 8 6 6 . 9
4 1 . 2
3 8
- 7 0 4 . 6
1 2 . 7
0 5
- 5 1 7 . 2
2 7 . 8
3 3
- 1 2 2 1 . 8
1 9 . 1
0 9
- 1 4 9 8 . 1
2 8 . 5 0
2
6
1 0 . 0
0 0
- 8 3 0 . 4
4 0 . 2
6 1
- 1 5 9 . 3
2 6 . 4
3 2
- 9 8 9 . 7
3 8 . 0
3 5
- 1 9 1 2 . 9
1 3 . 9
5 5
- 9 6 2 . 7
2 1 . 8
2 2
- 2 8 7 5 . 6
1 6 . 5
8 9
- 3 0 4 1 . 2
1 9 . 9 8
1
7
B a s e
- 8 5 5 . 0
3 9 . 2
9 3
- 2 0 0 . 3
2 2 . 0
7 0
- 1 0 5 5 . 4
3 6 . 0
2 4
- 3 5 6 8 . 0
9 . 6
9 8
- 1 4 6 8 . 0
1 6 . 0
0 8
- 5 0 3 5 . 9
1 1 . 5
3 7
- 5 1 4 5 . 3
1 3 . 4 9
5
G l o b a
l J o u r n a l o f R e s e a r c h e s i n E n g i n e e r i n g
X I I I I s s u ev
I V
e r s i o n I
8
Y e a r
2 0 1 3
V o l u m e
(D
) E
7/27/2019 720-686-1-PB (1).pdf
http://slidepdf.com/reader/full/720-686-1-pb-1pdf 10/11
Dynamic Analysis of Hirakud Dam Due to Seismic Forces
© 2013 Global Journals Inc. (US)
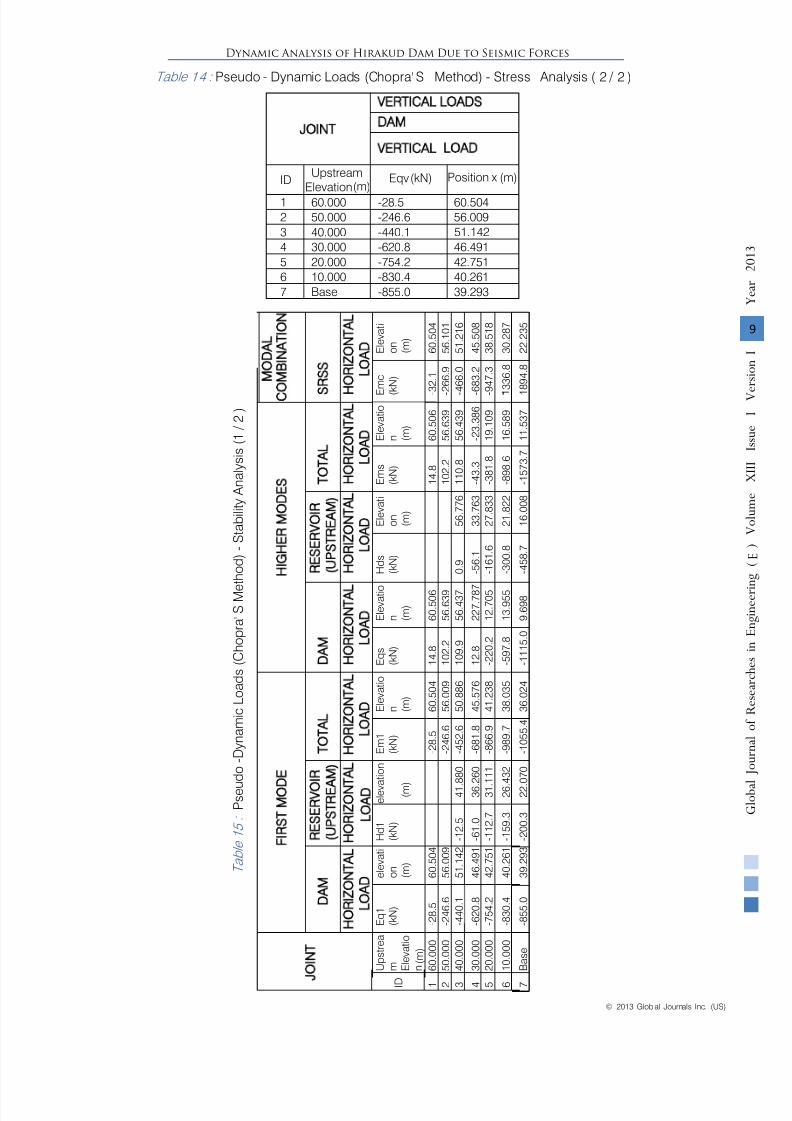
Table 14 : Pseudo - Dynamic Loads (Chopra' S Method) - Stress Analysis ( 2 / 2 )
T a b l e 1 5 : P s e u
d o - D y n a m i c L o a d s ( C h o p r a ' S M e
t h o d ) - S t a b i l i t y A n a l y s i s ( 1 / 2 )
JOINT
VERTICAL LOADS
DAM
VERTICAL LOAD
IDUpstream
Elevation(m)Eqv(kN) Position x (m)
1 60.000 -28.5 60.504
2 50.000 -246.6 56.009
3 40.000 -440.1 51.142
4 30.000 -620.8 46.491
5 20.000 -754.2 42.751
6 10.000 -830.4 40.261
7 Base -855.0 39.293
JOIN
FR
MOD
H
GH
MOD
MOD
C
MBN
ON
D
M
R
O
IR
(U
R
M)
TOTA
D
M
R
OIR
(U
R
M)
TOTA
S
H
RZON
A
LOAD
H
RZON
A
LOAD
H
RZON
A
LOAD
H
RZON
A
LOAD
H
RZON
A
LOAD
H
RZON
A
LOAD
H
RZON
A
LOAD
I D
U p s t r e a
m E l e v a t i o
n ( m )
E q 1
( k N )
e l e v a t i
o n
( m )
H d 1
( k N )
e l e v a t i o n
( m )
E m 1
( k N )
E l e v a t i o
n ( m )
E q s
( k N )
E l e v a t i o
n ( m )
H d s
( k N )
E l e v a t i
o n
( m )
E m s
( k N )
E l e v a t i o
n ( m )
E
m c
( k N )
E l e v a t i
o n
( m )
1
6 0 . 0
0 0
- 2 8 . 5
6 0 . 5
0 4
- 2 8 . 5
6 0 . 5
0 4
1 4 . 8
6 0 . 5
0 6
1 4 . 8
6 0 . 5
0 6
- 3 2 . 1
6 0 . 5
0 4
2
5 0 . 0
0 0
- 2 4 6 . 6
5 6 . 0
0 9
- 2 4 6 . 6
5 6 . 0
0 9
1 0 2 . 2
5 6 . 6
3 9
1 0 2 . 2
5 6 . 6
3 9
- 2 6 6 . 9
5 6 . 1
0 1
3
4 0 . 0
0 0
- 4 4 0 . 1
5 1 . 1
4 2
- 1 2 . 5
4 1 . 8
8 0
- 4 5 2 . 6
5 0 . 8
8 6
1 0 9 . 9
5 6 . 4
3 7
0 . 9
5 6 . 7
7 6
1 1 0 . 8
5 6 . 4
3 9
- 4 6 6 . 0
5 1 . 2
1 6
4
3 0 . 0
0 0
- 6 2 0 . 8
4 6 . 4
9 1
- 6 1 . 0
3 6 . 2
6 0
- 6 8 1 . 8
4 5 . 5
7 6
1 2 . 8
2 2 7 . 7 8
7
- 5 6 . 1
3 3 . 7
6 3
- 4 3 . 3
- 2 3 . 3
8 6
- 6 8 3 . 2
4 5 . 5
0 8
5
2 0 . 0
0 0
- 7 5 4 . 2
4 2 . 7
5 1
- 1 1 2 . 7
3 1 . 1
1 1
- 8 6 6 . 9
4 1 . 2
3 8
- 2 2 0 . 2
1 2 . 7
0 5
- 1 6 1 . 6
2 7 . 8
3 3
- 3 8 1 . 8
1 9 . 1
0 9
- 9 4 7 . 3
3 8 . 5
1 8
6
1 0 . 0
0 0
- 8 3 0 . 4
4 0 . 2
6 1
- 1 5 9 . 3
2 6 . 4
3 2
- 9 8 9 . 7
3 8 . 0
3 5
- 5 9 7 . 8
1 3 . 9
5 5
- 3 0 0 . 8
2 1 . 8
2 2
- 8 9 8 . 6
1 6 . 5
8 9
-1
3 3 6 . 8
3 0 . 2
8 7
7
B a s e
- 8 5 5 . 0
3 9 . 2
9 3
- 2 0 0 . 3
2 2 . 0
7 0
- 1 0 5 5 . 4
3 6 . 0
2 4
- 1 1 1 5 . 0
9 . 6
9 8
- 4 5 8 . 7
1 6 . 0
0 8
- 1 5 7 3 . 7
1 1 . 5
3 7
- 1
8 9 4 . 8
2 2 . 2
3 5
G l o b a
l J o u r n a l o f R e s e a r c h e s i n E n g i n e e r i n g
X I I I I s s u e
I V e r s i o n I
9
Y e a r
2 0 1 3
V o l u m e
(D
) E

7/27/2019 720-686-1-PB (1).pdf
http://slidepdf.com/reader/full/720-686-1-pb-1pdf 11/11
11.
Krinitzsky, E.
L. (1995), Deterministic versusprobabilistic seismic hazard analysis for criticalstructures, Eng Geol 40, 1–7.
12.
Mills,B.L.,HVD-8110-MDA-97-5,”Kinematic studies
to determine the stability of postulated independentconcrete blocks indicated by the non-linear analysisof Hoover Dam during Seismic Loading”, Bureau ofReclamation, December 1997.
13.
National Research Council (NRC) 1985, Safety ofDams; Flood and Earthquake Criteria, WashingtonD.C; National Academy Press.
14.
O’Connell, D. and Ake, J.,”Ground Motion Analysisfor Hoover dam”, Bureau of Reclamation,Seismotectonic Report 94-1, January 1995.
15.
Payne, T.L.HVD-8110-MDA-97-2,”Linear ElasticDynamic Structural Analysis including mass in the
foundation for Hoover Dam”, Bureau ofReclamation, April, 1998.
16.
Sahu, Tejram 2006-07, NIT, Raipur, Chhattisgarh,“Seismic Hazard Analysis of Gangrel and SondurDam Sites”, M.Tech.desertation.
17.
Sarma S. K. (1975), Seismic stability of earth damsand embankments. Geotechnique, 25, 743 -
761,ISSN: 0016-8505.
18.
Scott, G.”RIGID-Dynamic Response of Jointed RockMasses”, University of Colorado, 1982.
19.
United States Committee on Large Dams,”U.S. andWorld Dam, Hydropower and Reservoir Statistics”,USCOLD Committee on Register of Dams, 1995.
20.
USBR, Design of Gravity Dams . Denver: UnitedStates Department of the Interior –
Bureau ofReclamation, 1976.
21.
Westergaard H. M., “Water pressure on damsduring earthquakes” Transactions ASCE , v. 98, n.1835, pp. 418-433, 1933.
Dynamic Analysis of Hirakud Dam Due to Seismic Forces
G l o b a
l J o u r n a l o f R e s e a r c h e s i n E n g i n e e r i n g
X I I I I s s u ev
I V
e r s i o n I
10
Y e a r
2 0 1 3
V o l u m e
(D
) E
© 2013 Global Journals Inc. (US)
2. Bureau of Reclamation (1976).”Design of Gravitydams” A Water Resources Technical Publication.
3. Chopra A.K. Dynamics of Structures – Application to Earthquake Engineering . PrenticeHall, 2001.
4. Chopra A.K. and Hanchen T.,”EACD-3D-96: AComputer program for 3-dimensional analysis ofconcrete Dam” University of California, Berkeley,California, Report No.UCB/SEMM-96/06,October
1996.5. Fenves and Chopra A.K. (1987)”Simplified Analysis
of Concrete Dams”, Journal of StructuralEngineering, ASCE, Vol.113, No.8, pp1688-1708.
6. FERC (Federal Energy Regulatory Commission).Chapter III Gravity Dams. In: Federal EnergyRegulatory Commission, Office of HydropowerLicensing. Engineering guidelines for evaluation ofhydropower projects. Washington, 2002.
V. Conclusions and R ecommendations
Results presented in this paper demonstratethat the response of concrete gravity dam-reservoirsystems is significantly affected by various static anddynamic loading parameters. The design check ofexisting dam is performed, for the present PGA value ofthe earlier earthquake i.e. 0.16g, to assess whetherseismic upgrading of Hirakud Dam is necessary fromseismic safety point of view. It can be concluded fromthe present study that the dam section is safe for allpossible load combinations and no further retrofittingmeasures are required for the section.
R eferences R éférences R eferencias
1. Anatech Corporation” ANACAP-Concrete AnalysisProgram”, Version 2.le, 1997.
8. ICOLD (1989) ‘Selecting Parameters for Largedams-Guidelines and Recommendations’ ICOLD
Committee on Seismic Aspects of Large dams,Bulletin 72.9. Koltuniuk, R.M., HVD-8110-MDA-97-4,”Non-linear
Dynamic Structural Analysis of Hoover DamIncluding Modelling of Contraction Joint Openingand Concrete Cracking “, Bureau of Reclamation,September 1997.
10. Kramer, Steven L.1996, Geotechnical EarthquakeEngineering, Prentice Hall, 653 pp.
Table16 : PSEUDO - DYNAMIC LOADS (CHOPRA' SMETHOD) - STABILITY ANALYSIS ( 2/ 2 )
DAM
VERTICAL LOAD
ID
Upstream
Elevation
(m)
Eqv
(kN)
Position x
(m)
1 60.000 -7.2 4.570
2 50.000 -79.4 4.600
3 40.000 -190.0 6.133
4 30.000 -362.9 8.515
5 20.000 -598.0 11.090
6 10.000 -895.3 13.721
7 Base -1254.8 16.370
7. Gupta I.D. (2002)”The state of the art in SeismicHazard Analysis”, ISET Journal of EarthquakeTechnology, Paper No.428, Vol.39, No.4, December2002, pp 311-346.
Theory and