SI 686 Lecture 4b. Social Identity Theory: Psychology and...
39
SI 686/786: Public Goods SI 686 Lecture 4b. Social Identity Theory: Psychology and Economics Yan Chen SI 686/786, Fall 2008 SI 686/786: Public Goods Outline Social Identity Theory Tajfel and Turner (1986) Economic Models of Social Identity Preferences: Akerlof and Kranton (2000, 2005) Beliefs: Benabou and Tirole (2006)
Transcript of SI 686 Lecture 4b. Social Identity Theory: Psychology and...
SI 686/786: Public Goods
SI 686 Lecture 4b. Social Identity Theory: Psychology and Economics
Yan Chen
SI 686/786, Fall 2008
SI 686/786: Public Goods
Outline
Social Identity Theory
� Tajfel and Turner (1986)
Economic Models of Social Identity
� Preferences:Akerlof and Kranton (2000, 2005)
� Beliefs:Benabou and Tirole (2006)
SI 686/786: Public Goods
The social identity theory of intergroup behavior
Tajfel and Turner (1986)
SI 686/786: Public Goods
Minimal group paradigm
Randomly assigned groups on the basis of some trivial tasks
No social interaction between subjects
Group membership are anonymous
Decision task requires no link between a chooser’s self interest and her choices� Other-other allocation
� Rating other participants

SI 686/786: Public Goods
Main findings
The trivial, ad hoc intergroup categorization leads to in-group favoritism and out-group discrimination
Factors enhancing or mitigating group effects:� Category salience
� Group status
� Relevance of comparison dimensions
SI 686/786: Public Goods
What social-psychological processes are involved in the development of positive group identity?
Within the pattern of ingroup favoritism� Maximum difference (MD): more important
� Maximum ingroup profit (MIP)
They seem to be competing with out-group
Social categorization as cognitive tools that segment, classify and order the social environment
Social groups provide a system of orientation for self-reference: create and define an individual’s place in society

SI 686/786: Public Goods
Social Identity and Social Comparisons
Individuals strive to achieve or to maintain positive social identity
Positive social identity is based on favorable comparisons between ingroup and some relevant outgroups
When social identity is unsatisfactory, individuals will strive either to leave their existing group or to make their existing group more positively distinct
SI 686/786: Public Goods
Summary
Integration of the three processes� Social categorization
� Self-evaluation through social identity
� Intergroup social comparison
A coherent and testable framework that explains various forms of intergroup behavior, social conflict and social change
SI 686/786: Public Goods
Economics and Identity
Akerlof and Kranton (2000)
SI 686/786: Public Goods
Identity expands economic analysis …
Identity can explain behavior that appears detrimental
Identity underlies a new type of externality
Identity reveals a new way that preferences can be changed
Choice of identity may be the most important “economic” decision people make

SI 686/786: Public Goods
A utility function with identity
),,;,( :identity sj'person A
iesexternalit i.e., actions, others' :
services and goods ofn consumptio e.g., actions,own sj' :
),,(
categoriesdifferent in peoplefor eappropriatbehavior ons,prescripti :P
sticscharacteriown sj' :
peopleother all of thoseand categoriesown sj'person :c
status sociallower or higher havemay categories
Red; andGreen category, social :C
PcaaII
a
a
IaaUU
jjjjjj
j
j
jjjjj
j
j
ε
ε
−
−
−
=
=
SI 686/786: Public Goods
Examples of identity related behavior
Self-mutilation
Gender and occupation
� Female trial lawyer, male nurse, female Marine
Alumni giving
Mountaineering
� enhances an individual’s sense of self
SI 686/786: Public Goods
Example: Creation and manipulation of C and P
Advertising� Marlboro
� Virginia Slim
Professionals and graduate schools
Political identities� Fascist and populist leaders
� Gandhi’s Salt March
� French Revolution
SI 686/786: Public Goods
Identity and the Economics of Organizations
Akerlof and Kranton (2005)
SI 686/786: Public Goods
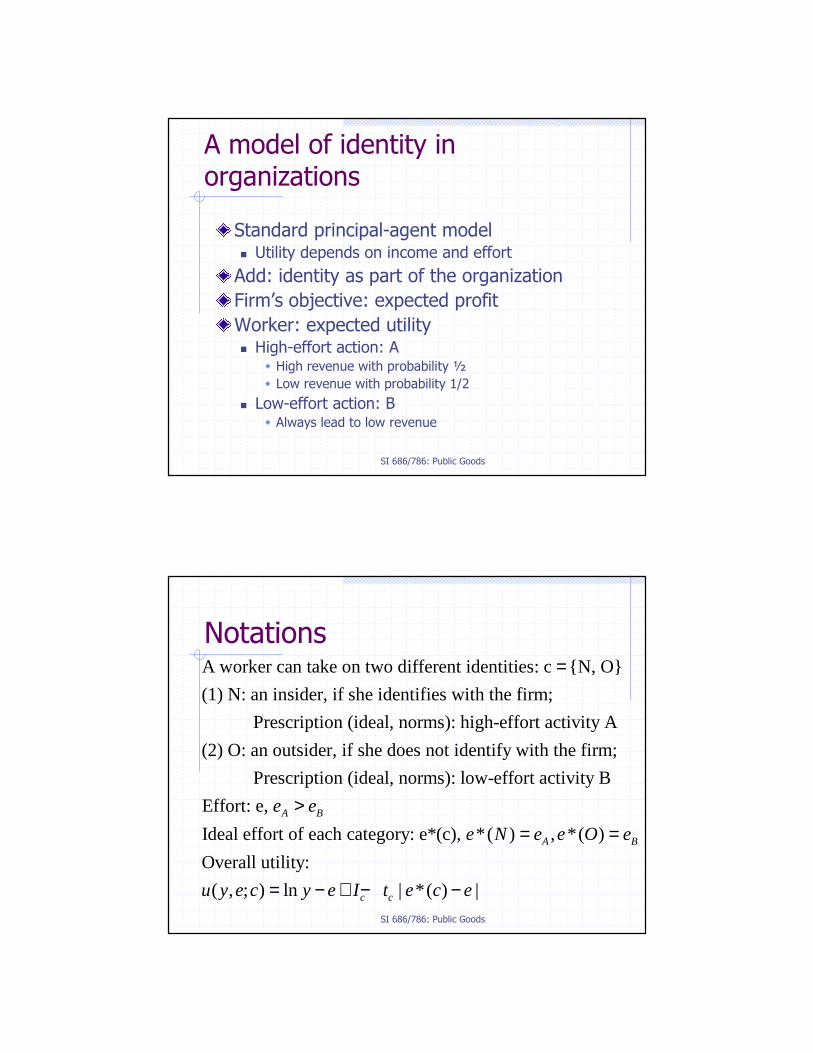
Pitfalls of monetary incentive schemes: blunt instrument
Can only be based on observables, often imperfect indicators of individual effort
Create opportunities for workers to game the system� Most jobs involve multiple tasks
� Outperfom on well-rewarded tasks
� Underperform on poorly rewarded tasks
� Tournaments: incentives to sabotage each other
Crowd out non-monetary incentives� Gneezy and Rustichini (2002)
SI 686/786: Public Goods
Apply identity to contract theory
Bring Id into the economics of organization
Id as supplement (substitute?) for monetary reward
Id can flatten reward schedule
� Employer pay less once id is induced
Q: how far can id go?
SI 686/786: Public Goods
A model of identity in organizations
Standard principal-agent model� Utility depends on income and effort
Add: identity as part of the organization
Firm’s objective: expected profit
Worker: expected utility� High-effort action: A
� High revenue with probability ½
� Low revenue with probability 1/2
� Low-effort action: B� Always lead to low revenue
SI 686/786: Public Goods
A worker can take on two different identities: c {N, O}
(1) N: an insider, if she identifies with the firm;
Prescription (ideal, norms): high-effort activity A
(2) O: an outsider, if she does
=
not identify with the firm;
Prescription (ideal, norms): low-effort activity B
Effort: e,
Ideal effort of each category: e*(c), *( ) , *( )
Overall utility:
( , ; ) ln | *(
A B
A B
c c
e e
e N e e O e
u y e c y e I t e c
>= =
= − + − ) |e−
Notations

SI 686/786: Public Goods
Setup and questions
Principal can invest in “motivational capital” and change a worker’s identity from O to N, at a cost q
� Example: IIDF (intellectual integration and direction finding)
When is it profitable to do so?
Compare P’s expected profits when worker is an O to that when she is N
SI 686/786: Public Goods
Set up optimal contract …
|)(*|ln|)(*|ln2
1ln
2
1
|)(*|ln2
1ln
2
1..
][2
1] [
2
1)(max
) induce to wantsalways (P
:sconstraint IC and IR subject toprofit expected maximizes P
observingwhen , wage,low a
, observingwhen , high wage, a chooses P
LH
L
H
BccBcLAccA
cL
cH
AccAcL
cH
cL
cH
A
cL
cH
ecetIewecetIeww
uecetIewwts
wwc
e
w
w
−−+−≥−−+−+
≥−−+−+
+−+=Π ππ
ππ
SI 686/786: Public Goods
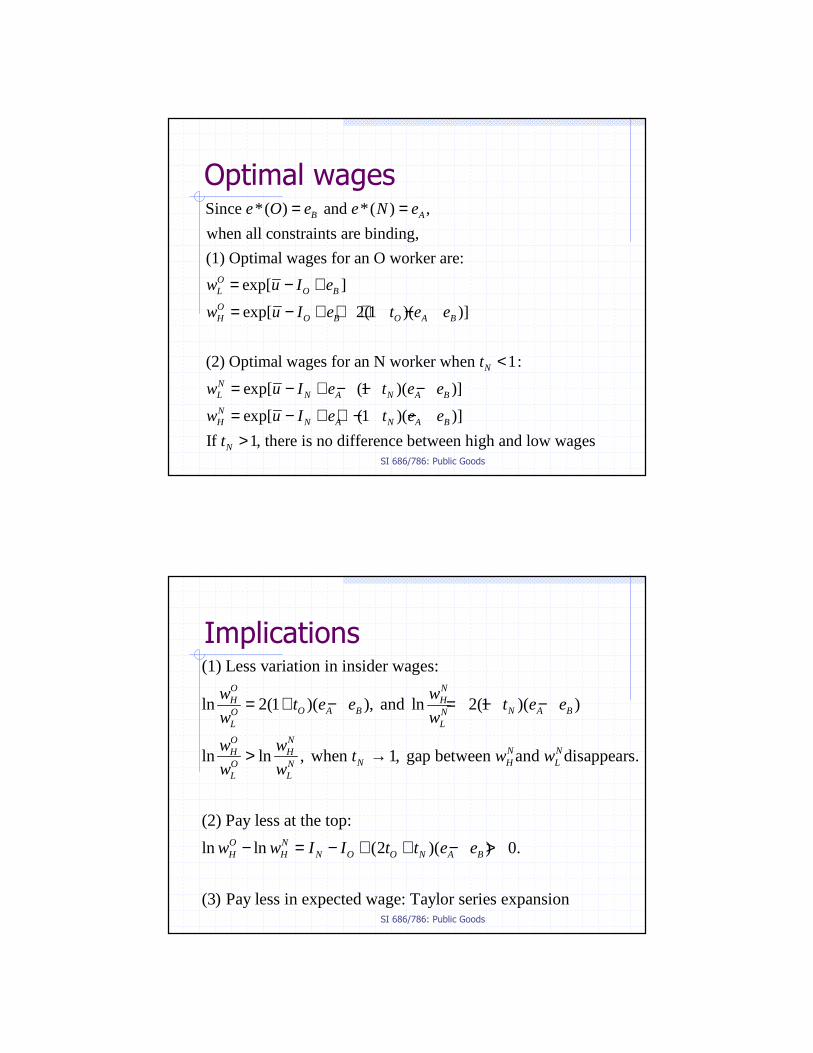
Optimal wagesSince *( ) and *( ) ,
when all constraints are binding,
(1) Optimal wages for an O worker are:
exp[ ]
exp[ 2(1 )( )]
(2) Optimal wages for an N worker when 1:
exp[
B A
OL O B
OH O B O A B
N
NL
e O e e N e
w u I e
w u I e t e e
t
w u
= =
= − +
= − + + + −
<
= (1 )( )]
exp[ (1 )( )]
If 1, there is no difference between high and low wages
N A N A B
NH N A N A B
N
I e t e e
w u I e t e e
t
− + − − −
= − + + − −>
SI 686/786: Public Goods
Implications(1) Less variation in insider wages:
ln 2(1 )( ), and ln 2(1 )( )
ln ln , when 1, gap between and disappears.
(2) Pay less at the top:
ln ln (2
O NH H
O A B N A BO NL L
O NN NH H
N H LO NL L
O NH H N O O
w wt e e t e e
w w
w wt w w
w w
w w I I t
= + − = − −
> →
− = − + )( ) 0.
(3) Pay less in expected wage: Taylor series expansion
N A Bt e e+ − >

SI 686/786: Public Goods
Motivational capital of the firm
Suppose a firm pays q to change workers from outsider to insiders
Let r be the interest rate
The benefit of investing in motivational capital is the discounted stream of the increased profits
The Potential of Social Identity
Yan ChenThe University of Michigan
2008
Outline
• What is social identity?
• Group identity and social preferences– Chen and Li (2009)
• The potential
• Social identity and equilibrium selection– Chen and Chen (2008)
• Social identity and public goods provision

What is social identity?
• A person’s sense of self derived from group membership
• Multi-dimensional, dynamic– Race
– Gender
– Occupation
– etc.
Social Identity Changes Behavior
• Method: Priming natural identities
• Derive self-esteem from group membership
• Conform to stereotypes – Shih, Pittinsky and Ambady (1999)
– Benjamin, Choi and Strickland (2006)
5
Social Identity Theory (Tajfel and Turner 1979)
• The minimal group paradigm (MGP)
(1) random assignment to groups based on trivial tasks(2) no social interaction(3) anonymous group membership(4) no link b/w self interest and choices
• MGP => Ingroup favoritism, outgroup discrimination
• Economic games: almost always violate (4)
• (1), (2), (3) => near-minimal
Why should economists care?Identity expands economic analysis …
• Identity can explain behavior that appears detrimental or irrational
– Gentlemanly terrorists (Ghosh 2005)• Identity reveals a new way that preferences can be
changed• Choice of identity may be the most important
“economic” decision people make– Education (Akerlof and Kranton 2002)
• Identity and mechanism design: limit of monetary incentives
– Akerlof and Kranton (2005)

Models of social identity
• Beliefs– Benabou and Tirole (2006)
• Preferences– exogenous norm
• Akerlof and Kranton (2000, 2002, 2005)
• “The incorporation of such endogeneity is the next step.”(Akerlof 2007)
– Preference classes: varying weight on social preference• Basu (2006)
• McLeish and Oxoby (2006)
• Chen and Li (forthcoming)
8
Group Identity and Social Preferences
Yan Chen Sherry Xin Li

9
Research Questions
• Effects of identity on social preferences• Distribution preference • Reciprocity• Social welfare maximization
• What creates group effects• Categorization • Helping
10
Experimental Design
• Original treatment: 3 stages I. Group assignment II. Enhancing identity: problem solvingIII. Other-other allocationIV. 2-person sequential games (self-other allocation)
• Control: No group-identity induced
• Additional treatments: take out one component at a time
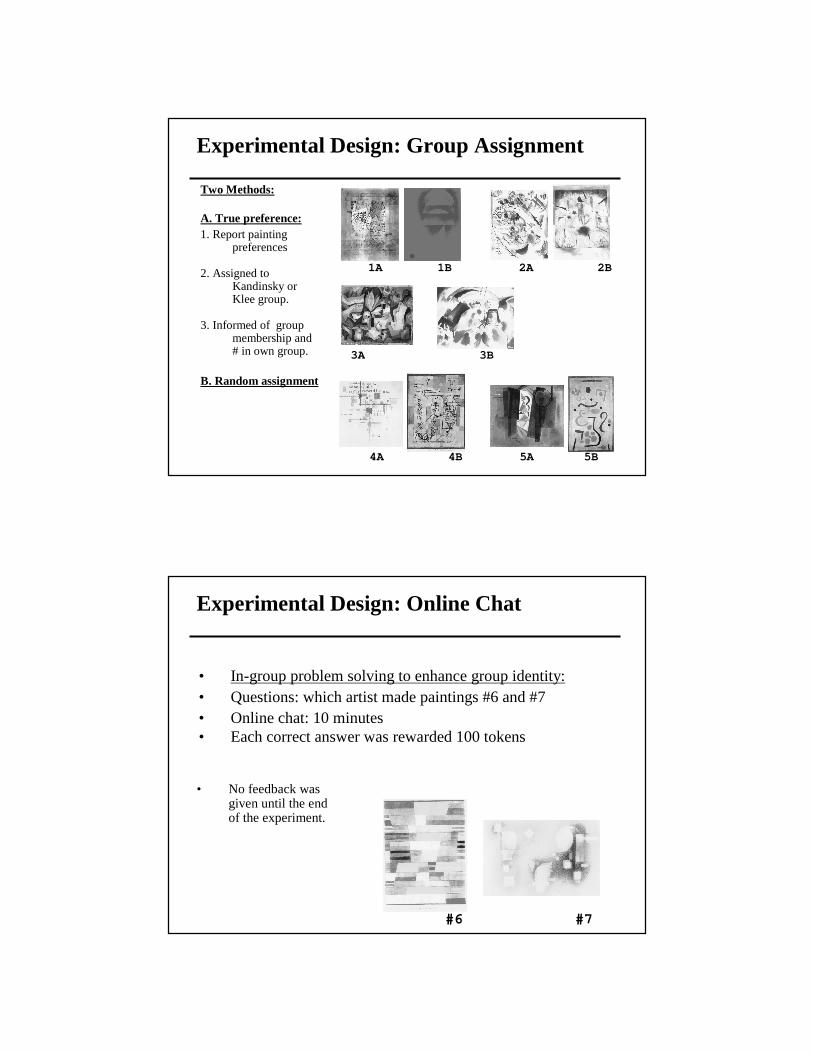
Experimental Design: Group Assignment
1A 1B 2A 2B
3A 3B
4A 4B 5A 5B
Two Methods:
A. True preference: 1. Report painting
preferences
2. Assigned to Kandinsky or Klee group.
3. Informed of group membership and # in own group.
B. Random assignment
Experimental Design: Online Chat
• In-group problem solving to enhance group identity:• Questions: which artist made paintings #6 and #7• Online chat: 10 minutes• Each correct answer was rewarded 100 tokens
#6 #7
• No feedback was given until the end of the experiment.

13
• Token allocation to two other anonymous participants• No tokens to self • # tokens increased from 200 to 400 with an increment of 50 from round 1
to round 5• Strategy method, 3 scenarios
• Findings:• Scenario i) and ii): 50/50 allocations • Scenario iii): twice as many tokens to ingroup as to outgroup member
Experimental Design: Other-other allocation
A from your own group B from your own group i) ( ) + ( ) = 200 tokens A from the other group B from the other group ii) ( ) + ( ) = 200 tokens A from your own group B from the other group iii) ( ) + ( ) = 200 tokens
Example: Round 1
Other-Other Allocation Results
•Replicated in-group favoritism and out-group discrimination.
Two Ingroup members
0
50
100
150
200
250
300
350
0 1 2 3 4 5
Round
To
ken
s
Two Out-Group Members
0
50
100
150
200
250
300
350
0 1 2 3 4 5
Round
In-group versus Out-group
0
50
100
150
200
250
300
350
0 1 2 3 4 5
Round
Tokens to the in-group other
Tokens to the out-group other
15
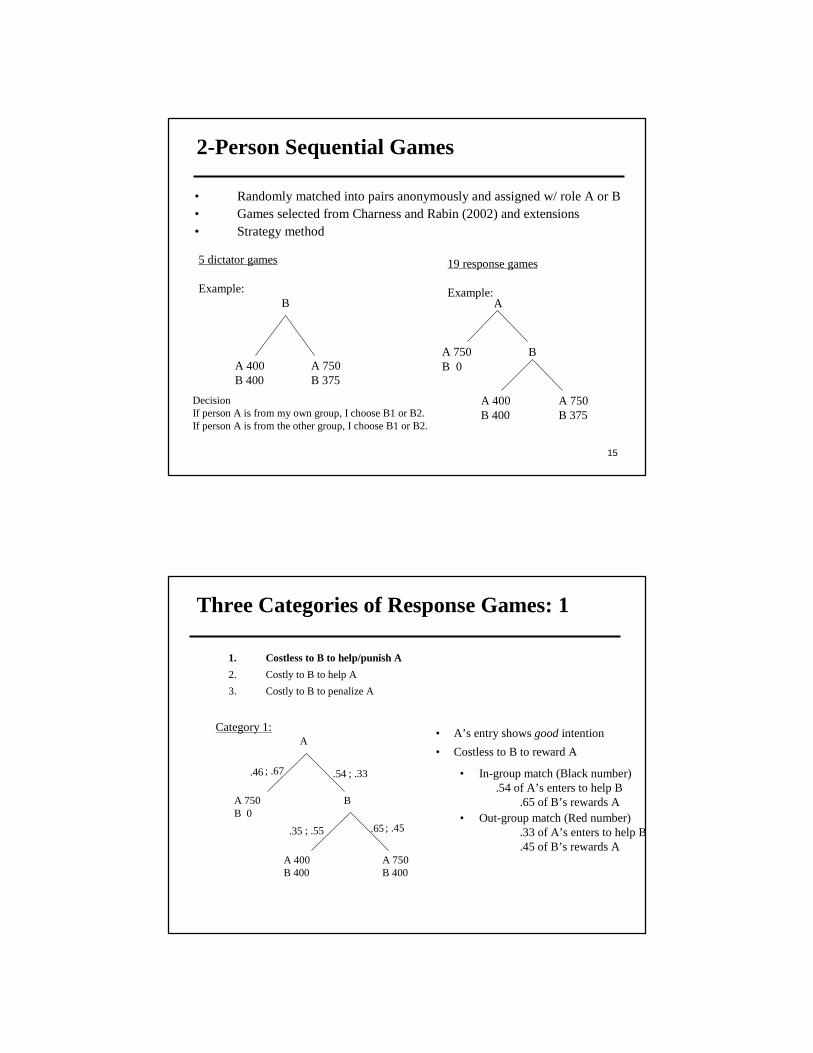
2-Person Sequential Games
• Randomly matched into pairs anonymously and assigned w/ role A or B• Games selected from Charness and Rabin (2002) and extensions• Strategy method
DecisionIf person A is from my own group, I choose B1 or B2.If person A is from the other group, I choose B1 or B2.
A 400 B 400
B
A 750 B 375
5 dictator games
Example:
A 750B 0
A
A 400 B 400
B
A 750 B 375
19 response games
Example:
Three Categories of Response Games: 1
1. Costless to B to help/punish A
2. Costly to B to help A
3. Costly to B to penalize A
.46 .54
.35 .65
Category 1: • A’s entry shows good intention
• Costless to B to reward A
• In-group match (Black number).54 of A’s enters to help B
.65 of B’s rewards A• Out-group match (Red number)
.33 of A’s enters to help B
.45 of B’s rewards A
; .67 ; .33
; .55 ; .45
A
A 750B 0
A 400 B 400
B
A 750 B 400

Three Categories of Response Games: 2
1. Costless to B to help/punish A2. Costly to B to reward A3. Costly to B to penalize A
A
A 800B 0
A 0 B 800
B
A 400 B 400
.78 .22
.38 .62
Category 2: • A’s entry shows good intention
• Costly to B to reward A
• In-group match (Black number).22 of A’s enters to help B
.62 of B’s rewards A• Out-group match (Red number)
.1 of A’s enters to help B
.44 of B’s rewards A
; .9 ; .1
; .56 ; .44
Three Categories of Response Games: 3
1. Costless to B to help/punish A2. Costly to B to reward A3. Costly to B to penalize A
.79 .21
.97 .03
A
A 400B 1200
A 400 B 200
B
A 0 B 0
Category 3: • A’s entry shows bad intention
• Costly to B to penalize A
• In-group match (Black number).21 of A’s enters to hurt B.03 of B’s punishes A
• Out-group match (Red number).36 of A’s enters to hurt B.10 of B’s punishes A
; .64 ; .36
; .90 ; .10
19
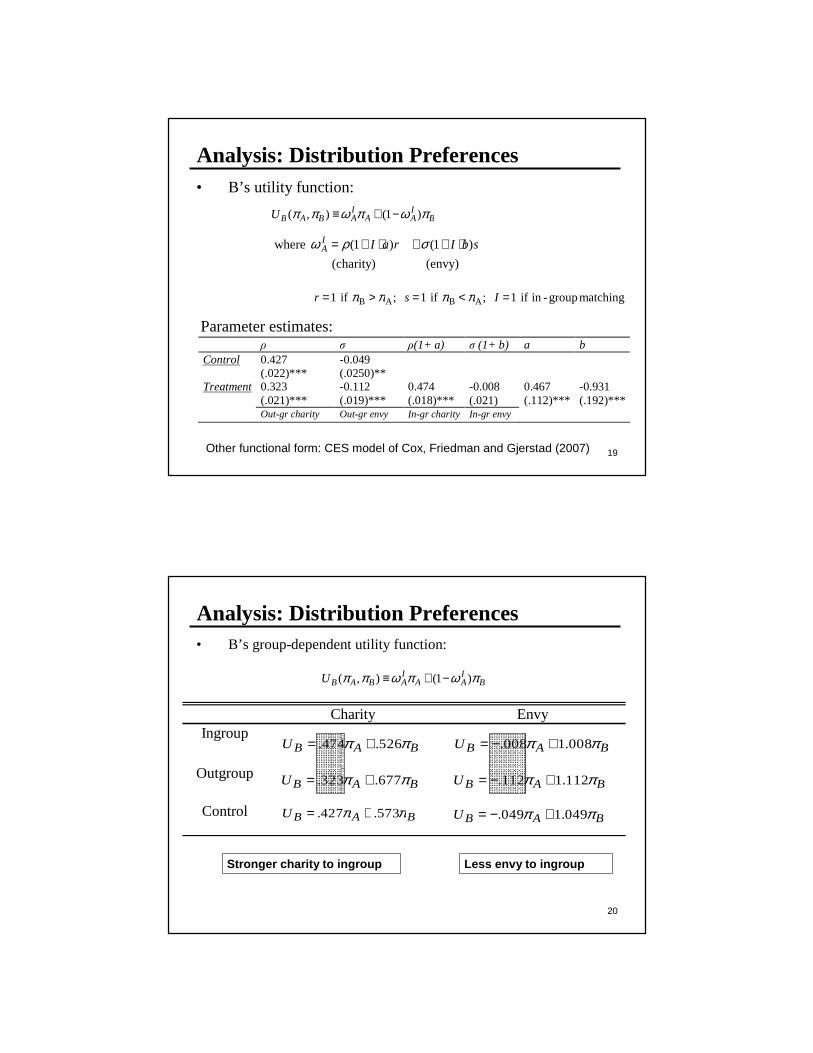
Analysis: Distribution Preferences• B’s utility function:
BIAA
IABABU πϖπϖππ )1(),( −+≡
(envy) (charity)
)1( )1( where sbIraIIA ⋅++⋅+= σρϖ
matching group-in if 1 ; if 1 ; if 1 ABAB =<=>= Isr ππππ
ρ σ ρ(1+ a) σ (1+ b) a b Control 0.427 -0.049
(.022)*** (.0250)** Treatment 0.323 -0.112 0.474 -0.008 0.467 -0.931
(.021)*** (.019)*** (.018)*** (.021) (.112)*** (.192)*** Out-gr charity Out-gr envy In-gr charity In-gr envy
Parameter estimates:
Other functional form: CES model of Cox, Friedman and Gjerstad (2007)
20
Analysis: Distribution Preferences• B’s group-dependent utility function:
BIAA
IABABU πϖπϖππ )1(),( −+≡
Charity EnvyIngroup
Outgroup
Control
BABU ππ 526.474. +=
BABU ππ 677.323. +=
BABU ππ 573.427. +=
BABU ππ 008.1008. +−=
BABU ππ 112.1112. +−=
BABU ππ 049.1049. +−=
Stronger charity to ingroup Less envy to ingroup
21
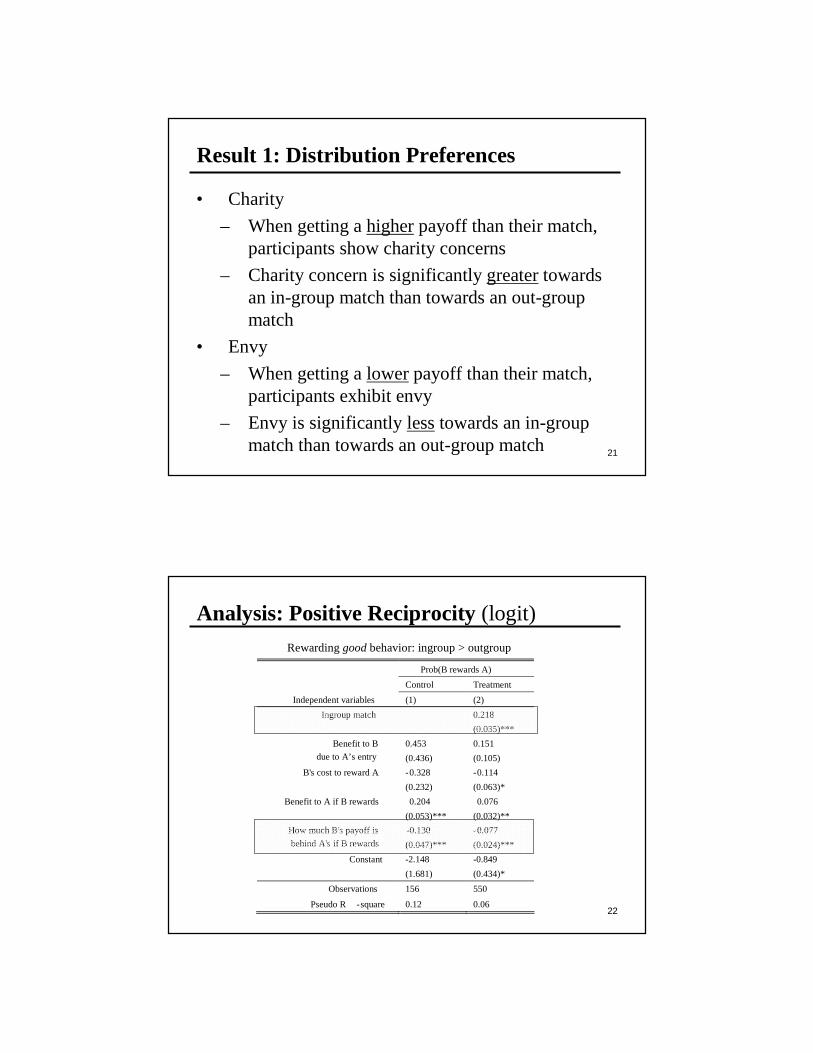
Result 1: Distribution Preferences
• Charity
– When getting a higherpayoff than their match, participants show charity concerns
– Charity concern is significantly greatertowards an in-group match than towards an out-group match
• Envy
– When getting a lowerpayoff than their match, participants exhibit envy
– Envy is significantly lesstowards an in-group match than towards an out-group match
22
Analysis: Positive Reciprocity (logit)
Rewarding good behavior: ingroup > outgroup
Prob(B rewards A)
Control Treatment
Independent variables (1) (2)
Ingroup match 0.218
(0.035)***
Benefit to B 0.453 0.151
due to A’s entry (0.436) (0.105)
B's cost to reward A -0.328 -0.114
(0.232) (0.063)*
Benefit to A if B rewards 0.204 0.076
(0.053)*** (0.032)**
How much B's payoff is -0.130 -0.077
behind A's if B rewards (0.047)*** (0.024)***
Constant -2.148 -0.849
(1.681) (0.434)*
Observations 156 550
Pseudo R -square 0.12 0.06

23
Analysis: Negative Reciprocity (logit)
Punishing misbehavior: ingroup < outgroup
Prob(B punishes A)
Control Treatment
Independent variables (1) (2 )
Ingroup match -0.128
(0.027)***
Damage to B 0.018 -0.001
due to A's entry (0.018) (0.009)
B's cost to punish A -0.265 -0.316
(0.071 )*** (0.047)***
Damage to A if B punishes 0.040 0.042
(0.019)** (0.009)***
How much B's payoff -0.171 -0.103
is ahead of A's if B punishes (0.070)** (0.029)***
Constant -0.211 -0.049
(0.100)** (0.053)
Observations 250 874
Pseudo R -square 0.13 0 .19
24
Result 2: Reciprocity
• Reciprocal preference is significantly different between in-group and out-group matches
• Good intention
– Significantly more likely to reward an in-group than an out-group match for their good behavior
• Bad intention
– Significantly more likely to forgive misbehaviors from an in-group match compared to an out-group match
25
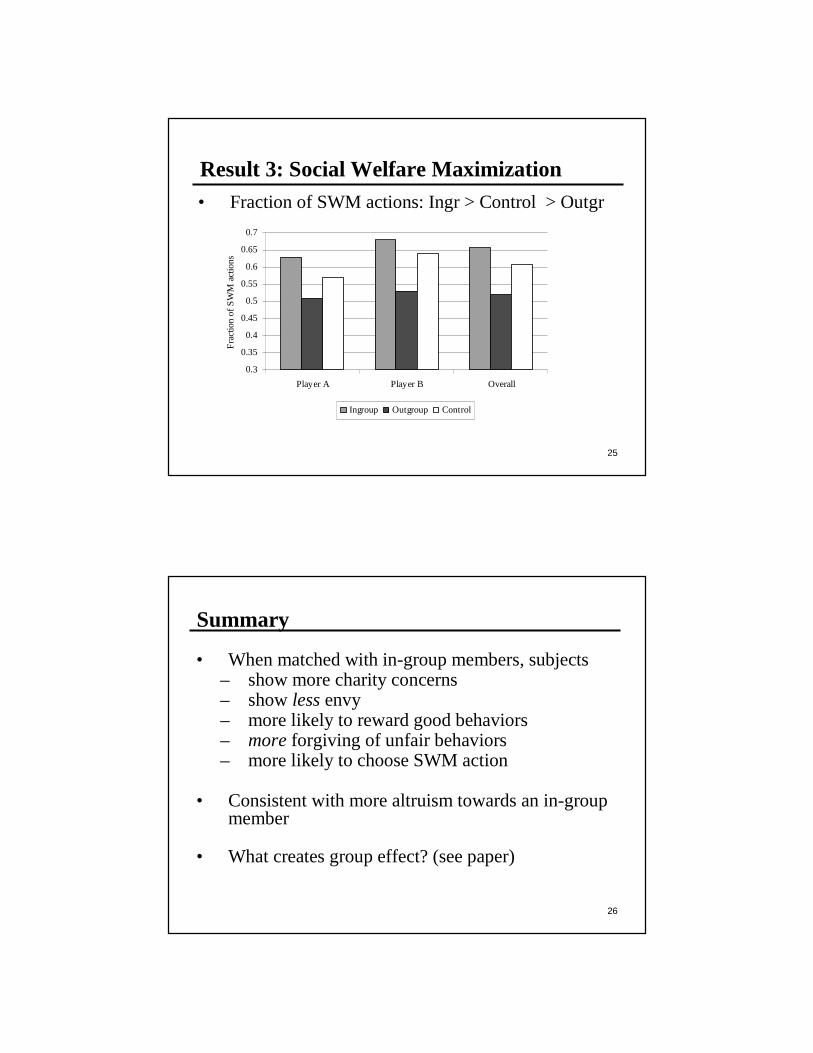
Result 3: Social Welfare Maximization• Fraction of SWM actions: Ingr > Control > Outgr
0.3
0.35
0.4
0.45
0.5
0.55
0.6
0.65
0.7
Player A Player B Overall
Fra
ctio
n of
SW
M a
ctio
ns
Ingroup Outgroup Control
26
Summary
• When matched with in-group members, subjects– show more charity concerns– showless envy– more likely to reward good behaviors– more forgiving of unfair behaviors– more likely to choose SWM action
• Consistent with more altruism towards an in-group member
• What creates group effect? (see paper)

Social Identity Experiments in Economics
• Social Identity and social preference– Chen and Li (forthcoming)– McLeish and Oxoby (2006)
• Social identity and public goods (VCM)– Brown-Kruse and Hummels (1993)– Cadsby and Maynes (1998)– Solow and Kirkland (2002)– Eckel and Grossman (2005)
• Social identity and equilibrium selection– Cadsby and Maynes (1998)– Croson, Marks and Snyder (2003)– Charness, Rigotti and Rustichini (2007)– Chen and Chen (2008)
A Unifying Framework: the Potential
• Definition– Potential
– Potential function
• Group identity changes the potential function– Games with a unique equilibrium:
changes equilibrium prediction
– Games with multiple equilibria:changes equilibrium selection

The Potential
1 2
-
- -
( , , ..., ): a normal form game with n players
: strategy set of player i
(1) A function, : is an for ,
if for every and for every
( , ) ( , ) 0 iff
ordinal potential
n
i
i i
i i i i
u u u
Y
P Y R
i N y Y
u y x u y z P
−
Γ
→ Γ∈ ∈
− > - -( , ) ( , ) 0
for every , .
(2) Suppose : are continuously differentiable. Then
P is a potential for iff P is continuously differentiable, and
for every
i i i i
i
i i
i
i i
y x P y z
x z Y
u Y R
u Pi
y y
− >∈
→Γ
∂ ∂= ∈∂ ∂
.N
Potential Games
• A game that possesses a potential is a potential game
• Properties– Every potential game has a pure-strategy
equilibrium (Rosenthal 1973)– Better reply learning dynamics converges to
equilibrium (Blume 1993, Monderer and Shapley 1996)
– argmax set of potential function refines equilibrium set
31
The Potential of Social Identity for Equilibrium Selection
Roy Chen Yan Chen
How does social identity affect equilibrium selection?
• Battle of Sexes– Charness, Rigotti and Rustichini (2007)
– Salient group identity: better coordination
• Provision point mechanism– Cadsby and Maynes (1998): priming
– Croson, Marks and Snyder (2003)
– Women: increase coordination and efficiency
• Minimum effort game
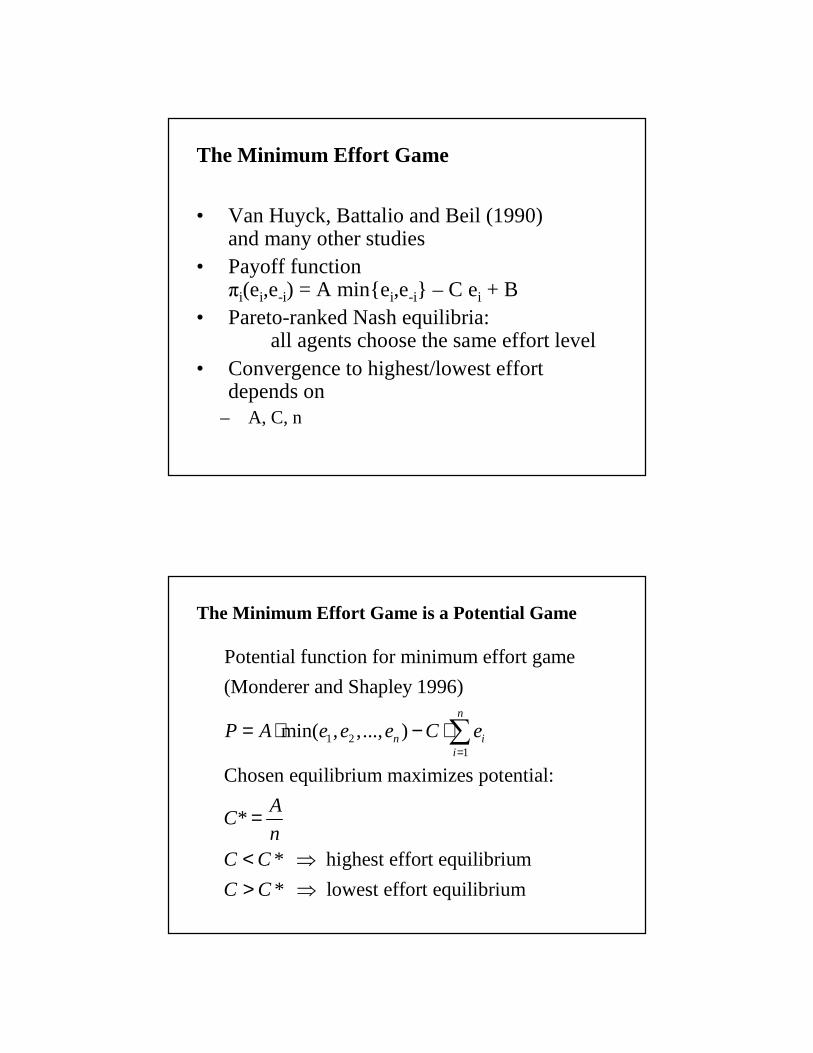
The Minimum Effort Game
• Van Huyck, Battalio and Beil (1990) and many other studies
• Payoff functionπi(ei,e-i) = A min{ei,e-i} – C ei + B
• Pareto-ranked Nash equilibria: all agents choose the same effort level
• Convergence to highest/lowest effort depends on
– A, C, n
The Minimum Effort Game is a Potential Game
1 21
Potential function for minimum effort game
(Monderer and Shapley 1996)
min( , ,..., )
Chosen equilibrium maximizes potential:
*
* highest effort equilibrium
* lowest effort e
n
n ii
P A e e e C e
AC
nC C
C C
=
= ⋅ − ⋅
=
< ⇒
> ⇒
∑
quilibrium

Goeree and Holt (2005)
• Continuous effort from [110, 170]
• A = 1, B = 0, n = 2
• C* = 0.5
• For low C (0.25), converged to highest effort
• For high C (0.75), converged to low effort
• Maximizing stochastic potential
Goeree and Holt (2005)
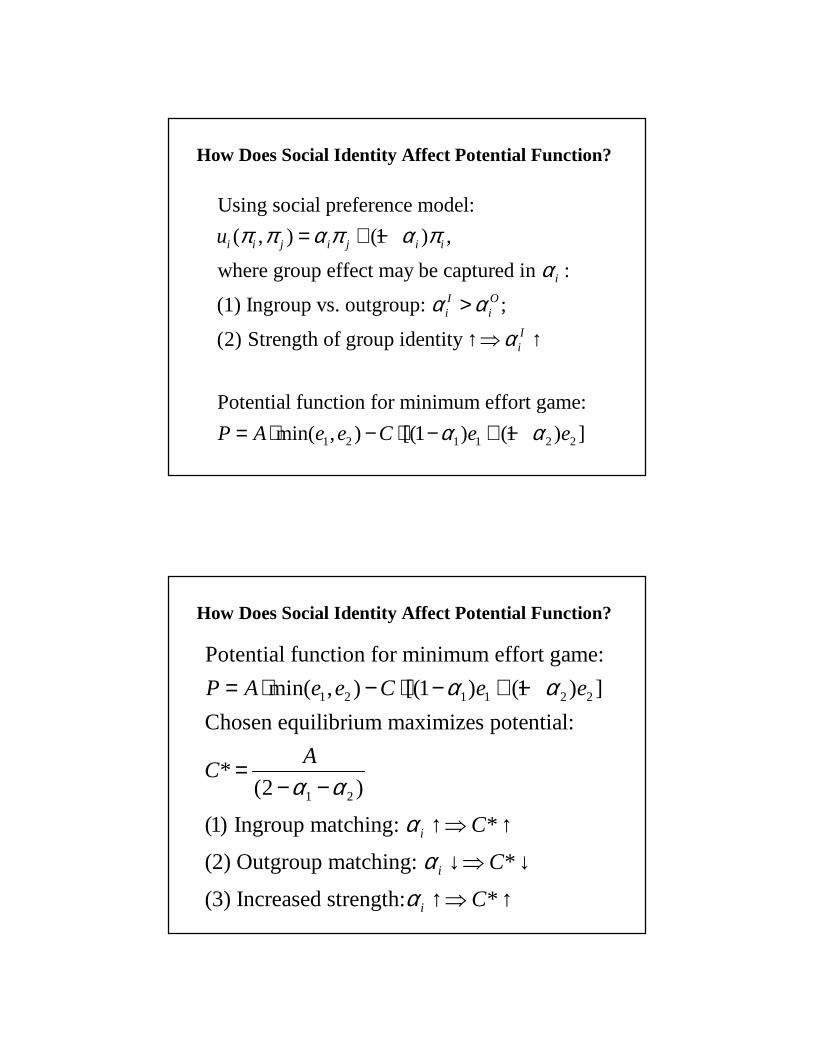
How Does Social Identity Affect Potential Function?
Using social preference model:
( , ) (1 ) ,
where group effect may be captured in :
(1) Ingroup vs. outgroup: ;
(2) Strength of group identity
Potential function for minimum eff
i i j i j i i
i
I Oi i
Ii
u π π α π α πα
α αα
= + −
>
↑⇒ ↑
1 2 1 1 2 2
ort game:
min( , ) [(1 ) (1 ) ]P A e e C e eα α= ⋅ − ⋅ − + −
How Does Social Identity Affect Potential Function?
1 2 1 1 2 2
1 2
Potential function for minimum effort game:
min( , ) [(1 ) (1 ) ]
Chosen equilibrium maximizes potential:
*(2 )
(1) Ingroup matching: *
(2) Outgroup matching: *
(3) Increa
i
i
P A e e C e e
AC
C
C
α α
α αα
α
= ⋅ − ⋅ − + −
=− −
↑⇒ ↑
↓⇒ ↓
sed strength: *i Cα ↑⇒ ↑
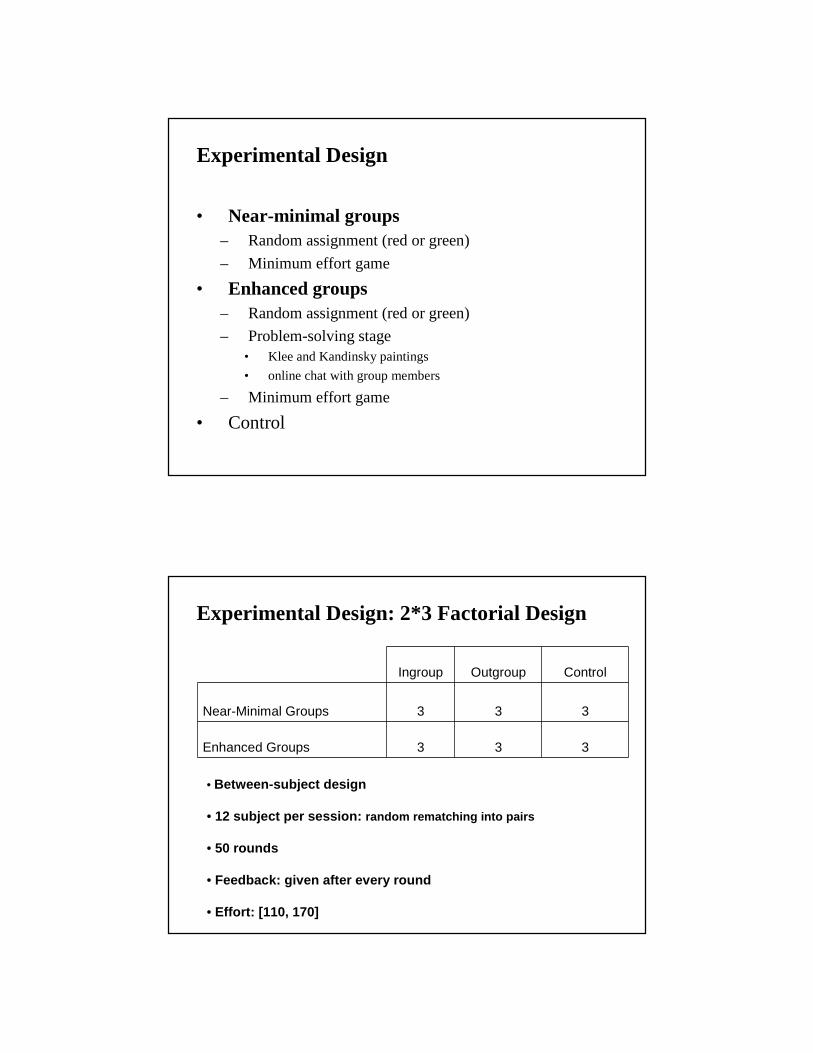
Experimental Design
• Near-minimal groups– Random assignment (red or green)
– Minimum effort game
• Enhanced groups– Random assignment (red or green)
– Problem-solving stage• Klee and Kandinsky paintings
• online chat with group members
– Minimum effort game
• Control
Experimental Design: 2*3 Factorial Design
Ingroup Outgroup Control
Near-Minimal Groups 3 3 3
Enhanced Groups 3 3 3
• Between-subject design
• 12 subject per session: random rematching into pairs
• 50 rounds
• Feedback: given after every round
• Effort: [110, 170]
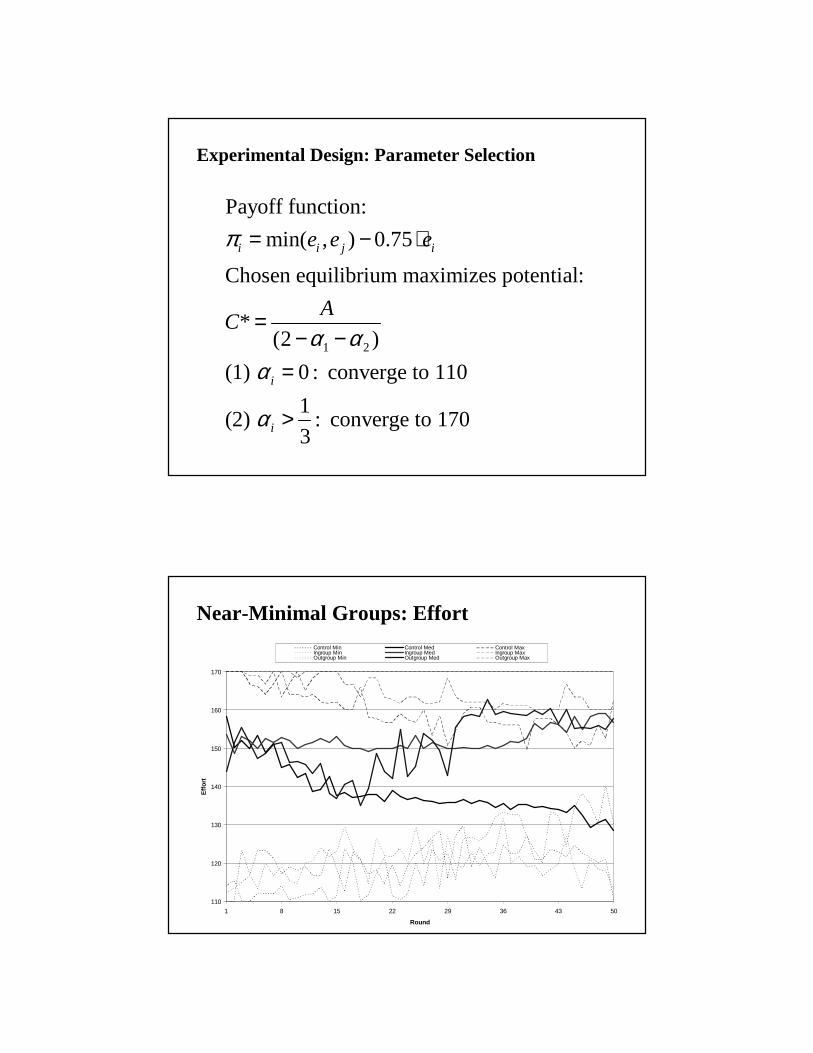
Experimental Design: Parameter Selection
1 2
Payoff function:
min( , ) 0.75
Chosen equilibrium maximizes potential:
*(2 )
(1) 0 : converge to 110
1(2) : converge to 170
3
i i j i
i
i
e e e
AC
π
α αα
α
= − ⋅
=− −
=
>
Near-Minimal Groups: Effort
110
120
130
140
150
160
170
1 8 15 22 29 36 43 50
Round
Eff
ort
Control Min Control Med Control MaxIngroup Min Ingroup Med Ingroup MaxOutgroup Min Outgroup Med Outgroup Max
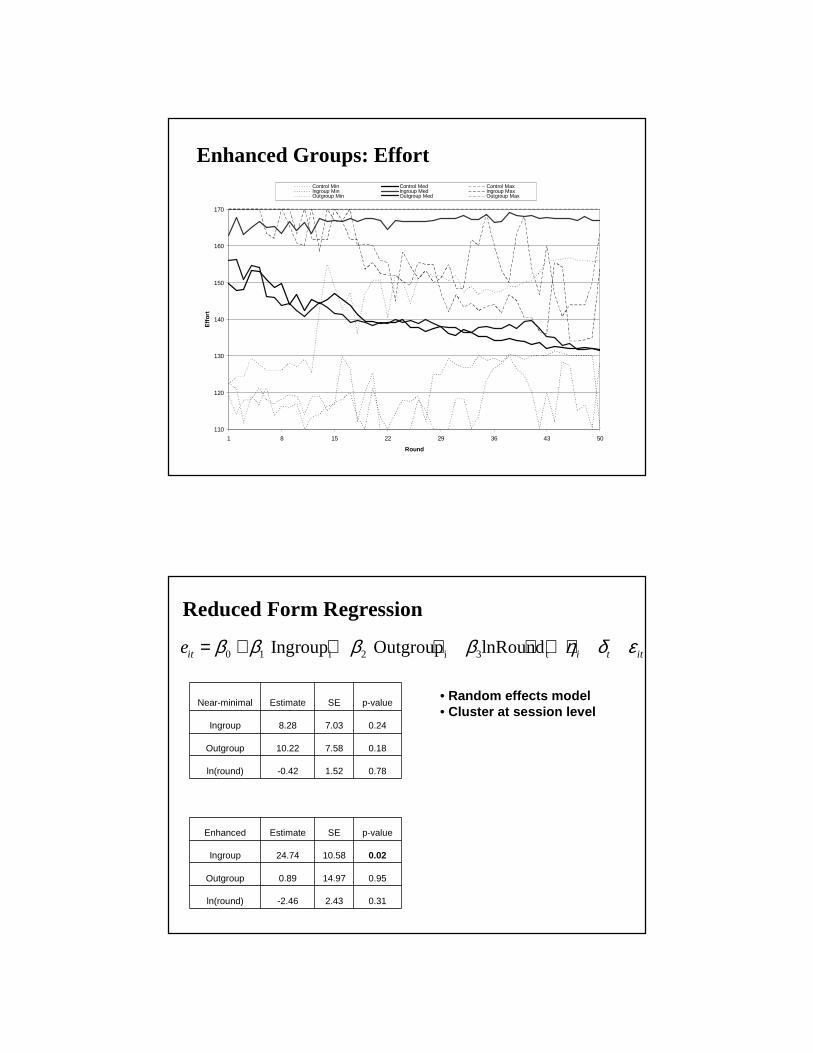
Enhanced Groups: Effort
110
120
130
140
150
160
170
1 8 15 22 29 36 43 50
Round
Eff
ort
Control Min Control Med Control MaxIngroup Min Ingroup Med Ingroup MaxOutgroup Min Outgroup Med Outgroup Max
Reduced Form Regression
Near-minimal Estimate SE p-value
Ingroup 8.28 7.03 0.24
Outgroup 10.22 7.58 0.18
ln(round) -0.42 1.52 0.78
Enhanced Estimate SE p-value
Ingroup 24.74 10.58 0.02
Outgroup 0.89 14.97 0.95
ln(round) -2.46 2.43 0.31
0 1 i 2 i 3 t Ingroup Outgroup lnRoundit i t ite β β β β η δ ε= + + + + + +
• Random effects model• Cluster at session level

Near-Minimal Groups: Efficiency
0.0
0.1
0.2
0.3
0.4
0.5
0.6
0.7
0.8
0.9
1.0
1 8 15 22 29 36 43 50
Round
Eff
icie
ncy
Control Avg Ingroup Avg Outgroup Avg
Enhanced Groups: Efficiency
0.0
0.1
0.2
0.3
0.4
0.5
0.6
0.7
0.8
0.9
1.0
1 8 15 22 29 36 43 50
Round
Eff
icie
ncy
Control Avg Ingroup Avg Outgroup Avg

Summary
• Near-minimal groups: no group effect
• Enhanced groups– Significant ingroup favoritism
– No outgroup discrimination
– Brewer (1999): asymmetry
• Group identity changes the potential function and potential maximizing strategies, if the induced or primed identity is strong enough
More on Groups and Equilibrium Selection
• Bornstein, Gneezy and Nagel (2002)– A=20, C=10, n=7: C* = 3
– Group competition
– Some groups converged to highest effort
• Weber (2006)– A=0.2, C=0.1, n = 2 to 12: C*=0.1 to 0.017
– Group initiation
– Convergence to 5 with slow growth
• These can be seen as increasing group identity
49
The Potential of Social Identity for Public Goods Provision
Effect of Group Identity on Contribution in VCM
• Primed natural identity – Solow and Kirkwood (2002)
• Induced identity– Eckel and Grossman (2005)
• Real social groups– Goette, Huffman and Meier (2006)– Bernhard, Fehr and Fischbacher (2006)
• Findings– Sometimes: no effect– Ingroup: more cooperative– Stronger identity increases contribution
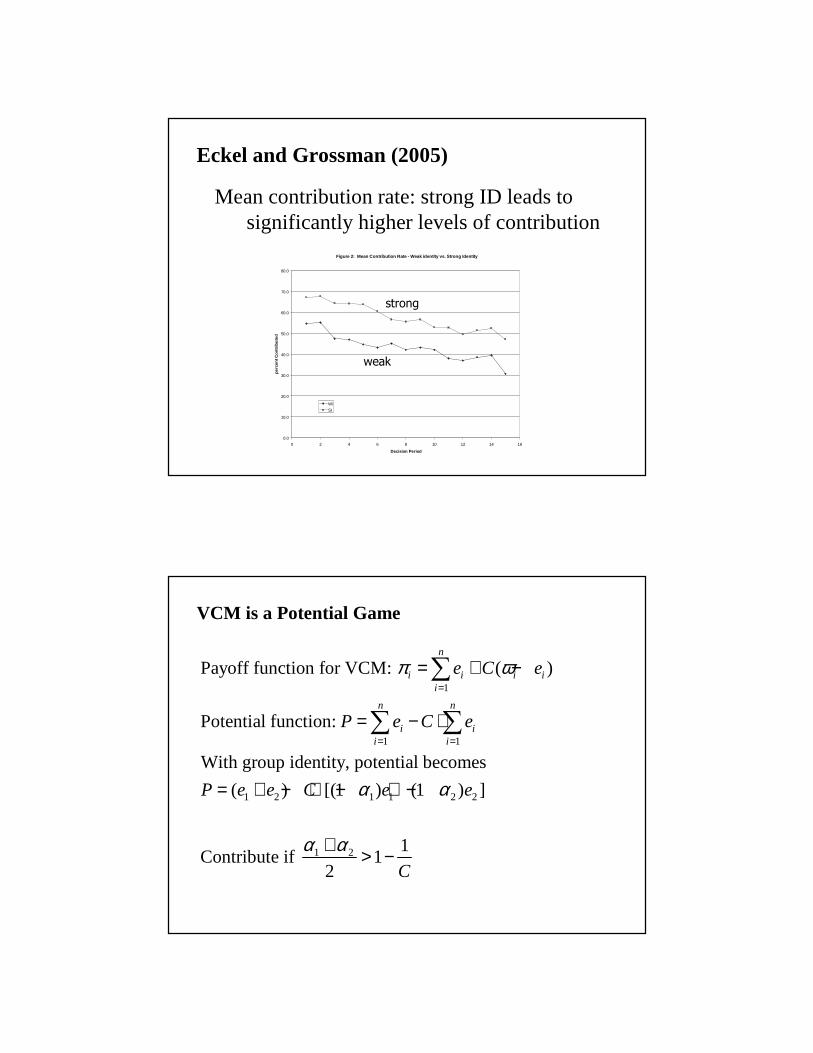
Eckel and Grossman (2005)
Mean contribution rate: strong ID leads to significantly higher levels of contribution
Figure 2: Mean Contribution Rate - Weak identity vs. Strong Identity
0.0
10.0
20.0
30.0
40.0
50.0
60.0
70.0
80.0
0 2 4 6 8 10 12 14 16
Decision Period
perc
ent C
on
trib
ute
d
WI
SI
strong
weak
VCM is a Potential Game
1
1 1
1 2 1 1 2 2
1 2
Payoff function for VCM: ( )
Potential function:
With group identity, potential becomes
( ) [(1 ) (1 ) ]
1Contribute if 1
2
n
i i i ii
n n
i ii i
e C e
P e C e
P e e C e e
C
π ω
α α
α α
=
= =
= + −
= − ⋅
= + − ⋅ − + −
+ > −
∑
∑ ∑

Summary and Open Questions
• Group identity influences social preference– More altruistic towards ingroup members
• Changes potential function
• Changes potential maximizing equilibrium
• Implications for organization design