7 Probability - University of British Columbia · is the probability of getting 3 heads in 5 coin...
24
7 Probability 7.1 Determine the probability of each of the following events assuming that the dice has equal probability of landing on each one of the six sides marked by 1 to 6 dots and that the coin has equal probability to land on head (H) and tail (T). (a) The probability of rolling a 1, followed by a 4, in two consecutive rolls. (b) The probability of NOT rolling either a 2 or a 3 in one roll. (c) The probability of tossing a coin 3 times and get TTH. (d) The probability of getting any combination other than TT in two consecutive rolls. (e) The probability of getting a coin landing on H and a dice landing on 6 with one toss of coin and one roll of dice. Solution (a) 1 6 · 1 6 = 1 36 (b) 1 - 1 6 - 1 6 = 2 3 (c) ( 1 2 ) 3 = 1 8 (d) 1 - ( 1 2 ) 2 = 3 4 (e) 1 2 · 1 6 = 1 12 7.2 (a) Four athletes from four different countries compete in the final of 500 m speed skating. How many possible outcomes are there? (Assume that they all complete the race and that simultaneous arrival does not occur). (b) How many ways are there to seat six people at a dining table with six fixed seats? (c) How many ways are there to get 3 times H and 2 times T by tossing a coin 5 times? What is the probability of getting 3 heads in 5 coin tosses? (d) How many ways are there to get a total of 8 by tossing two dice simultaneously ? (consider that a 2 for dice #1 and a 6 for dice #2 is different from a 6 for dice #1 and a 2 for dice #2) Solution (a) 4! = 24 1
Transcript of 7 Probability - University of British Columbia · is the probability of getting 3 heads in 5 coin...
7 Probability
7.1
Determine the probability of each of the following events assuming that the dice has equalprobability of landing on each one of the six sides marked by 1 to 6 dots and that the coin hasequal probability to land on head (H) and tail (T).
(a) The probability of rolling a 1, followed by a 4, in two consecutive rolls.
(b) The probability of NOT rolling either a 2 or a 3 in one roll.
(c) The probability of tossing a coin 3 times and get TTH.
(d) The probability of getting any combination other than TT in two consecutive rolls.
(e) The probability of getting a coin landing on H and a dice landing on 6 with one toss of coinand one roll of dice.
Solution
(a)1
6· 1
6=
1
36
(b) 1 − 1
6− 1
6=
2
3
(c) (1
2)3 =
1
8
(d) 1 − (1
2)2 =
3
4
(e)1
2· 1
6=
1
12
7.2
(a) Four athletes from four different countries compete in the final of 500 m speed skating.How many possible outcomes are there? (Assume that they all complete the race and thatsimultaneous arrival does not occur).
(b) How many ways are there to seat six people at a dining table with six fixed seats?
(c) How many ways are there to get 3 times H and 2 times T by tossing a coin 5 times? Whatis the probability of getting 3 heads in 5 coin tosses?
(d) How many ways are there to get a total of 8 by tossing two dice simultaneously ? (considerthat a 2 for dice #1 and a 6 for dice #2 is different from a 6 for dice #1 and a 2 for dice #2)
Solution
(a) 4! = 24
1
(b) 6! = 720
(c) The number of ways of getting 3 heads in 5 coin tosses is C(5, 3) = 5!/(3!2!) = 10. Theprobability of getting 3 Heads in 5 tosses is: C(5, 3)( 1
2)5 = 10 1
32= 0.3125 where C(5, 3) is the
binomial coefficient.
(d) If the first dice is a 1, then there is no way to get a total of 8. If the first dice is a 2, thesecond one must be a 6. If the first dice is a 3, then the second one must be 5, and so on. Intotal, there are 5 different ways, (2,6), (3,5), (4,4), (5,3), and (6,2), to get a total of 8.
7.3
(a) Write out in full all possible outcomes of tossing 4 coins. How many such outcomes are there?
(b) Determine the probability of tossing 0, 1, 2, 3, 4 heads.
(c) Find the expected number of heads.
Solution
(a) 0 heads: TTTT1 Head: HTTT, THTT, TTHT, TTTH2 heads HHTT, HTHT, HTTH, THHT, THTH, TTHH3 Heads: HHHT, HHTH, HTHH, THHH4 heads: HHHHThere are 16 events.
(b) p(0) = 116
= p(4), p(1) = 416
= 14
= p(3), p(2) = 616
= 38.
(c) x̄ =∑4
i=0 xip(xi) = 0( 116
) + 1(14) + 2(3
8) + 3(1
4) + 4( 1
16) = 1
4+ 3
4+ 3
4+ 1
4= 2.
7.4
A coin was tossed 8 times by a group of people. The number of people, N(x), who got a total ofx heads were as follows: (x = 0, N = 0), (x = 1, N = 3), (x = 2, N = 10), (x = 3, N = 16), (x =4, N = 25), (x = 5, N = 21), (x = 6, N = 6), (x = 7, N = 2), (x = 8, N = 2).
(a) Based on this experimental data, determine the (empirical) probability of obtaining x headsout of 8 coin tosses for x = 0, 1, . . . 8.
(b) Find x̄, the expected number of heads given the above data.
(c) Compare your results with the expected value of heads in a theoretical distribution in whichthe probability of H and T are equal.
Solution
(a) The total number of people is 85 (seen by adding up the numbers of people who got any ofthe results) so the probabilities are simply p(x) = N(x)/85. These are shown in the table below.
2
Number of heads x Number of people N(x) probability p(x)0 0 0.00001 3 0.03532 10 0.11763 16 0.18824 25 0.29415 21 0.24716 6 0.07067 2 0.02358 2 0.0235
(b) To find x̄ we form:
x̄ =N∑
i=0
xip(xi)
So
x̄ = 0 ·0+1 ·0.0353+2 ·0.1176+3 ·0.1882+4 ·0.2941+5 ·0.2471+6 ·0.0706+7 ·0.0235+8 ·0.0235
x̄ = 0.0353 + 0.2352 + 0.5646 + 1.1764 + 1.2355 + 0.4236 + 0.1645 + 0.188 = 4.0231
(c) In 8 tosses, with p(H) = p(T ) = 0.5 the expected value of number of heads is 4.
7.5
(a) Find the probability of randomly selecting 4 aces from a well-shuffled deck of 52 cards.
(b) Find the probability of randomly selecting 4 hearts (of any value) from a well-shuffled deckof 52 cards. (Note: a full deck of cards contains 13 hearts.)
(c) What is the probability of randomly selecting the sequence of cards of value “King”, “Queen”Jack” (of any suite or combination of suites) from a well-shuffled deck of 52 cards.
Solution
(a)
p(4 aces) =4
52· 3
51· 2
50· 1
49= 3.7 × 10⁻⁶
(b)
p(4 hearts) =13
52· 12
51· 11
50· 10
49= 0.002641
(c)
p(KQJ) =4
52· 4
51· 4
50= 0.0004827
3
7.6
(a) Find terms in Pascal’s triangle down to the level that represents the coefficients C(10, k).
(b) Use this to form the binomial expansion of the product
(p + q)10
(c) What is the probability of getting exactly 7 heads in 10 tosses if the coin is fair?
(d) What is the probability of getting exactly 7 heads in 10 tosses if p(H) = 0.49 ?
Solution
(a)1
1 1
1 2 1
1 3 3 1
1 4 6 4 1
1 5 10 10 5 1
1 6 15 20 15 6 1
1 7 21 35 35 21 7 1
1 8 28 56 70 56 28 8 1
1 9 36 84 126 126 84 36 9 1
1 10 45 120 210 252 210 120 45 10 1
(b)
(p+q)10 = p10+10p9q+45p8q2+120p7q3+210p6q4+252p5q5+210p4q6+120p3q7+45p2q8+10pq9+q9
(c) The probability of getting exactly 7 heads is 120p7q3. If the coin is fair, and p(H) = p(T )then p = q = 0.5 so this is simply
p(7H) = 120(0.5)10 =120
1024= 0.117
(d) If the coin is not fair and p(H) = 0.49 = p then q = 0.51 and
p(7H) = 120(0.49)7(0.51)3 = 120 · 0.0067822 · 0.13265 = 0.1079
4

7.7
(a) Find the expanded form of the expression (a + b)10.
(b) Draw the probability density distribution for the probability of obtaining m = 0, 1, 2, · · · , 10heads when tossing a coin 10 times (i.e. n = 10). Recall that 210 = 1024.
Solution
(a)(a + b)10 =10∑
k=0C10
k a10−kbk
(Recall that each term is of the form Cnmambn−m where Cn
m is the “binomial coefficients”.)
(b) See Figure 1.
0 1 2 3 4 5 6 7 8 9 100
0.05
0.1
0.15
0.2
0.25
Number of heads
Pro
babi
lity
of to
ssin
g m
hea
ds
Figure 1: Probability density distribution for problem 7.7 (b) solution
7.8
A drawer contains 3 pairs of black socks, 2 pairs of white socks, 1 pair of green socks, and 2 pairof blue socks. Two socks are pulled out at random from the drawer. (Assume each sock has thesame probability of being selected).
(a) What is the probability that the pair pulled out consists of two black socks?
(b) What is the probability that the pair pulled out is either black or blue?
(c) What is the probability that a matching pair of any color is obtained?
(d) What is the probability that the pair pulled out of the drawer do not match?
Solution There are a total of 2 · (3 + 2 + 1 + 2) = 16 socks to choose from, and 6 are black, 4white, 2 green, and 4 are blue.
(a) The probability of pulling out the first black sock is 6/16 and the second black sock 5/15, soin all
p(2 black) =6
16· 5
15= 0.125
5

(b) We have the probability that the pair of black (0.125). Now the probability that both socksturn out to be blue is
p(2 blue) =4
16· 3
15= 0.05
Thus, the probability that the pair is either black or blue is
p({2 black} ∪ {2 blue}) = 0.125 + 0.05 = 0.175
(c) We add together the probabilities of the pair selected being both black (0.125), both blue(0.05), both white (0.05), or both green (0.0083). (The latter two computed as in parts a andb). We get
p(matching pair) = 0.125 + 0.05 + 0.05 + 0.0083 = 0.233
(d) We know that
p(pair does not match) = 1 − p(matching pair) = 1 − 0.233 = 0.766
7.9
A child’s toy consists of a clear plastic box containing five coloured spheres (red, green, blue,yellow, and white) and five coloured sockets. After shaking the box, the spheres tend to randomlysettle into the sockets one by one, with equal probability for a given sphere settling into anyunoccupied socket. At the end of “one experiment” each sphere occupies exactly one socket, andall sockets are occupied.
(a) What is the probability that the red sphere will settle into the red socket?
(b) What is the probability that either the red sphere will settle into the red socket or the bluesphere will settle into the blue socket?
(c) What is the probability that the red sphere will settle into the red socket and also the bluesphere will settle into the blue socket?
(d) What is the probability that all the spheres settle into the matching sockets?
Solution
(a) Since there are five spheres, with equal probability of settling into the socket, the probabilityis p(red − red) = 1/5 = 0.2.
(b)p(red − red) = 1/5 and also p(blue − blue) = 1/5. Thus p({red − red} ∪ {blue − blue}) =2/5 = 0.4.
(c) Once the red sphere is settled, there are four left, each one equally likely to settle into theblue socket. We use the multiplicative principle to get p = (1/5)(1/4) = 1/20 = 0.05.
(d) The probability that each sphere in turn “chooses” the right socket is 1/(number of socketsleft), so that p = (1/5)(1/4)(1/3)(1/2) = 1/5! = 1/120 = 0.00833.
6

7.10
Consider a gene that codes for an essential protein (such as hemoglobin). Let the “normal” allelefor this gene be represented by a and the defective allele by A. Suppose that individuals of typeaa and aA are both healthy, and can mate and have progeny, but that any individual of genotypeAA will not survive beyond birth. Assume that mating is random (with respect to this gene)and that each allele in a parent is equally likely to be passed to the progeny. If the fraction oftype a alleles in the population is p = 0.9 and the fraction of type A alleles in the population isq = 0.1, what fraction of the progeny inherit the fatal form AA?
Solution
We see the results of the random mating in the table below. A progeny arises in 1/4 of thecases when both parents are of type aA. The probability that any individual is of type aAis pq. The probability that both parents are of this type is (by the multiplicative property)(pq)(pq) = p2q2 = (0.9 · 0.1)2 = 0.0081. Thus the probability of a fatal genotype AA occurring isp(AA) = p2q2/4 = 0.0081/4 = .00202, i.e in about 0.202% of the pregnancies, this fatal form ofgenetic disease will occur.
Mother: aA aapq pp
FatheraA pq aa, 2aA, AA aa, aAaa pp aa, aA aa
7.11
Consider the two probability density functions p1(x) = c(1 − |x|) and p2(x) = c(1 − x2) on theinterval [−1, 1]. (See Figure 2 for a sketch.)
p1(x)
–1 1
x
p2(x)
–1 1
x
Figure 2: For problem 7.11
7
(a) Find the value for the constant c in each case so that the probability distribution is normal-
ized (i.e. the total probability is 1).
(b) Find the average value (mean) for both of these functions. (Note: a careful use of symmetrywill simplify your task.)
(c) Find the median for each distribution.
Solution
(a) For p1(x), the area under the curve on the interval [−1, 1] is just the area of the trianglewith base 2 and height c1, so A1 = c1 = 1 so we must have the constant c1 = 1 to normalize thedistribution. For p2(x) we calculate
A2 =∫ 1
−1p2(x)dx = c
∫ 1
−1(1 − x2)dx = 2c(x − x3
3)|10 = 2c(1 − (1/3)) = (4/3)c.
Thus, for this to equal 1 we must set c = 3/4. Thus p1(x) = (1− |x|) and p2(x) = (3/4)(1− x2).
(b) Both shapes are symmetric, with mass equally distributed to the left and the right of theorigin. Thus the mean in both cases is 0.
(c) Half the mass is to the right and half to the left of the origin. Thus the median is also at theorigin for both distributions.
7.12
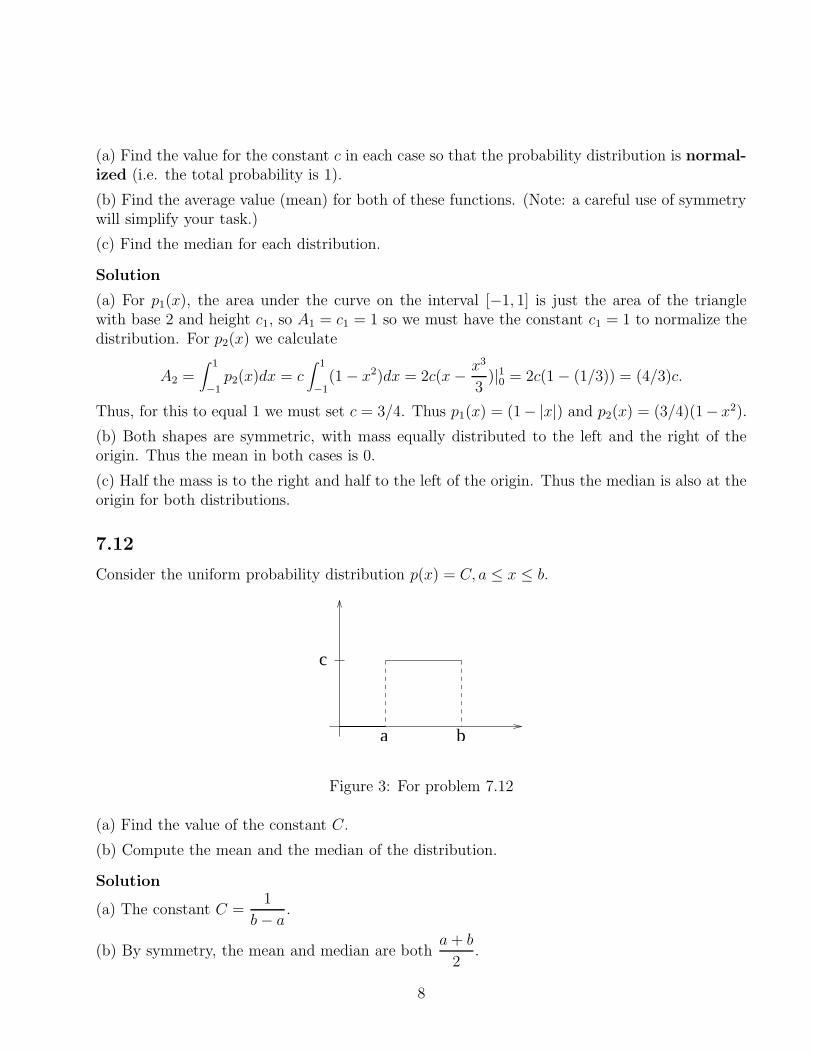
Consider the uniform probability distribution p(x) = C, a ≤ x ≤ b.
a b
c
Figure 3: For problem 7.12
(a) Find the value of the constant C.
(b) Compute the mean and the median of the distribution.
Solution
(a) The constant C =1
b − a.
(b) By symmetry, the mean and median are botha + b
2.
8

7.13
Consider the function p1(x), −b ≤ x ≤ b, which is made up of the two straight line segmentswhich connect (−b, 0) to (0, c) and (0, c) to (b, 0), where b, c are both positive.
(a) Graph p1(x) and determine a formula for p1(x).
(b) Determine c so that p1(x) is a probability distribution.
(c) Find the mean and median for p1(x).
Solution
(a) See Figure 4. The function p1(x) is made up of two straight line segments. A formula is
p1(x) =
{
cbx + c if − b ≤ x ≤ 0
− cbx + c if 0 ≤ x ≤ b
−b b
c
Figure 4: Plot of p1(x) for problem 7.13
(b) The area under this function is simply A = cb. This must be 1 in order that p1(x) be aprobability density function:
cb = 1 ⇒ c = 1/b.
(c) The mean and median are both 0 because of symmetry.
7.14
Consider a function y = f(x) > 0 defined on some interval [a, b]. The median of f is defined tobe the value of the independent variable, x, say x = m, which splits the area under f(x) betweena and b into two equal portions, i.e. such that
∫ m
af(x)dx =
∫ b
mf(x)dx =
1
2
∫ b
af(x)dx
9
Use this definition to find the median of the following functions on the indicated interval.
(a) f(x) = 1 − x2, − 1 < x < 1
(b) f(x) = |1 − x|, − 1 < x < 1
(c) f(x) = 5 − x, 0 < x < 5
(d) f(x) = sin(2x) 0 < x < π/4
[Remark: it may help you to sketch the given function and interval and use considerations ofsymmetry for some of these examples.]
Solution
(a)∫ m
−1(1 − x2)dx = (x − x3/3)|m−1 = (m − m3/3) + 2/3.
In particular, we get∫ 1
−1(1 − x2)dx = 4/3.
Thus we have to find m such that m − m3/3 + 2/3 = (1/2)(4/3) = 2/3. Clearly, this holds form = 0, a solution we could of course have found by simple symmetry considerations!
(b) Note that f(x) = |1 − x| = 1 − x in the interval considered, hence
∫ m
−1f(x)dx = (x − x2/2)|m−1 = (m − m2/2) + 3/2.
In particular,∫ 1−1(1− x)dx = 2, hence we have to find m such that (m−m2/2) + 3/2 = 1. Thus
we have to solve the quadratic equation m2/2−m−1/2 = 0, which has the solutions 1+√
2 and1−
√2. Of those only the latter is in the x-interval considered, hence the solution is m = 1−
√2.
(c)∫ m
0(5 − x)dx = (5x − x2/2)|m0 = (5m − m2/2).
In particular,∫ 5
0(5 − x)dx = 12.5
Hence we have to find m such that 5m − m2/2 = 6.25. Using a similar method to (b), we getm = 5 −
√12.5.
(d)∫ m
0f(x)dx =
∫ m
0sin(2x)dx = −1
2cos(2x)
∣
∣
∣
∣
m
0= −1
2cos(2m) +
1
2.
Also, we have that∫ π/4
0sin(2x)dx = −1
2cos(π/2) +
1
2=
1
2.
10

Thus we solve
−1
2cos(2m) +
1
2=
1
2(1
2) =
1
4.
cos(2m) =1
2.
We get 2m = π/3, 5π/3..., and m = π/6, 5π/6.... But because we are only concerned with theinterval 0 < x < π/4, we find that m = π/6.
7.15
According to L. Glass and M. Mackey, the authors of a recent book From clocks to chaos; the
rhythms of life p 44, “The probability that a cell drawn at random from a large population hasdivided at time t ≥ 20 (minutes) after birth is p(t) = Re−R(t−20), t ≥ 20, where R > 0 is someconstant. (They assume that cells never divide before time t = 20 min.)
(a) Find the mean time for division.
(b) What fraction of the cells have not divided by time t = 40 min?
Solution
(a) The mean time (in minutes) is
µ = R∫ ∞
20te−R(t−20)dt = −
(
te−R(t−20))
|∞20 +∫ ∞
20e−R(t−20)dt = 20 +
e−R(t−20)
−R|∞20 = 20 +
1
R.
(b) The fraction is R∫ ∞
40e−R(t−20)dt = −e−R(t−20)|∞40 = e−20R.
7.16
Figure 5 shows the result of an experiment with three groups of people. In each group, everyperson was asked to throw a ball. The distance x was recorded. The probability pi(x) of throwinga given distance is shown for each of the groups i = 1, 2, 3.
xd
p (x)1
xd
2p (x)
xd
p (x)3
Figure 5: For problem 7.16
11

(a) Compare the average (mean) distance thrown in the three groups.
(b) Compare the median distances thrown in the three cases. Is the median less than or greaterthan the mean distance thrown in these cases?
Solution
(a) The three distributions can be described as linear, concave up, and concave down. We canthink of the probability density distributions p being analogous to a mass density, so that themean distance thrown corresponds to the center of mass of the given distribution. For the concaveup distribution, the most of the “mass” is concentrated close to the origin, and there is very little“mass” further along the x axis, so we expect the center of mass to be closest to the origin. Thelinear distribution would have its center of mass a little further to the right, and the concavedown distribution would have its center of mass yet further to the right, since more of the massis to the right.
(b) The medians are the points at which half of the “mass” is to the right, and half to the left,or correspondingly, at which the area under the given curve is cut into two equal portions. Themedians would satisfy a relationship similar to the means in this case.
7.17
For the following probability density functions, find the constant C and the cumulative distribu-tion function, F (x).
(a) p(x) = C (−b ≤ x ≤ b)
(b) p(x) = −C(x2 − b2) (−b ≤ x ≤ b)
Solution
(a) C = 1/(2b), F (x) = (x + b)/(2b).
(b) C=3/(4b3), F (x) = 3(x + b)/(4b) − (x3 + b3)/(4b3).
7.18
The probability that the height of a basketball player is x meters is given by the probabilitydensity distribution p(x) = Cxe−x/2 where 0 < x < 3.
(a) What is the constant C?
(b) What is the most probable height?
(c) What is the mean height?
Solution
(a) To find C set
I =∫ 3
0p(x)dx = 1.
12

The integral (using Integration by Parts with u = x, dv = e−x/2dx) comes to
I = C(
−2xe−x/2|30 +∫ 3
02e−x/2dx
)
= C(−2xe−x/2 − 4e−x/2)|30 = C(4 − 10e−3/2).
Thus
C =1
4 − 10e−3/2= 0.5654.
(b) The most probable height is the height at which p(x) has a peak, and we find this by setting
dp/dx = 0, getting e−x/2 − (x/2)e−x/2 = 0 which leads to x = 2. This is easily seen to be amaximum from the graph of this function or from the fact that the second derivative is (−1/2e),i.e. negative at x = 2.
(c) The mean height is
x̄ =∫ 3
0xp(x)dx = C
∫ 3
0x2e−x/2dx
where C is as calculated above. This integral requires integration by parts twice. We get
x̄ = C(−2x2 − 8x − 16)e−x/2|30 = C(−58e−3/2 + 16) = 1.73.
7.19
Suppose F (x) is the cumulative distribution function for the height, x, of North American adultmales (in cm), and suppose p(x) is the probability density.
(a) Interpret the meaning of the following: F (200) = 0.9,∫ 160150 p(x)dx = 0.2.
(b) Suppose that F (200) and F (202) differ by 0.013. Which one is bigger? Use this informationto estimate the value of p(200).
Solution
(a) F (200) = 0.9 means that 90% of all adult males are 200 cm or shorter.∫ 160150 p(x)dx = 0.2
means that 20% of adult males are between 150 and 160 cm in height.
(b) F (202) is bigger since it also includes all those people in F (200), i.e. F (202) = 0.913.p(200) ≈ (F (202) − F (200))/(202− 200) = 0.013/2 = 0.0065
7.20
Mortality is often highly age dependent. Suppose that the probability of dying per year at agex (in years) is p(x) = C(1 + (x − 20)2) where 0 ≤ x ≤ 100.
(a) Find the constant C.
(b) Find the fraction of the population that has died by age 20.
(c) Find the fraction of the population that has died by age 80.
13

(d) What is the mean lifetime in this population?
Solution
(a) The constant C is determined by the equation
C∫ 100
0
(
1 + (x − 20)2)
dx = 1.
That is
C(
x +1
3(x − 20)3
)
|1000 = C(
100 +1
3(803 + 203)
)
= 1 =⇒ C =3
520300≈ 5.7659 × 10⁻⁶.
(b) The probability of dying by 20 is
C∫ 200 (1 + (x − 20)2) dx = C
(
x + 13(x − 20)3
)
|200C(
20 + 13· 203
)
= C × 80603
≈ 1.549 × 10⁻²
(c) The fraction is C∫ 80
0
(
1 + (x − 20)2)
dx = C
(
80 +(x − 20)3
3|800)
≈ 0.43.
(d) The mean is given by
µ = C∫ 100
0x(
1 + (x − 20)2)
dx = C(∫ 100
0x dx +
∫ 100
0x(x − 20)2dx
)
= C
(
1002
2+ x
(x − 20)3
3
∣
∣
∣
∣
100
0−∫ 100
0
(x − 20)3
3dx
)
= C
(
5000 + 100803
3− (x − 20)4
12
∣
∣
∣
∣
100
0
)
= C
(
5000 + 100803
3− 804
12+
204
12
)
≈ 78.83.
7.21
Shown below is the probability density function which describes how much of the Earth’s surfaceis at a given elevation (negative elevation means below sea level).
(a) Is more of the Earth’s surface above or below sea level? Use the concept of “median” toexplain.
(b) Estimate what fraction of the Earth’s surface is below sea level.
Solution
(a) More of the earth’s surface is below sea level than above since the diagram suggests that themedian is negative.
(b) The fraction below sea level is the amount of area to the left of the origin, and this wouldappear to be about 3/4.
14
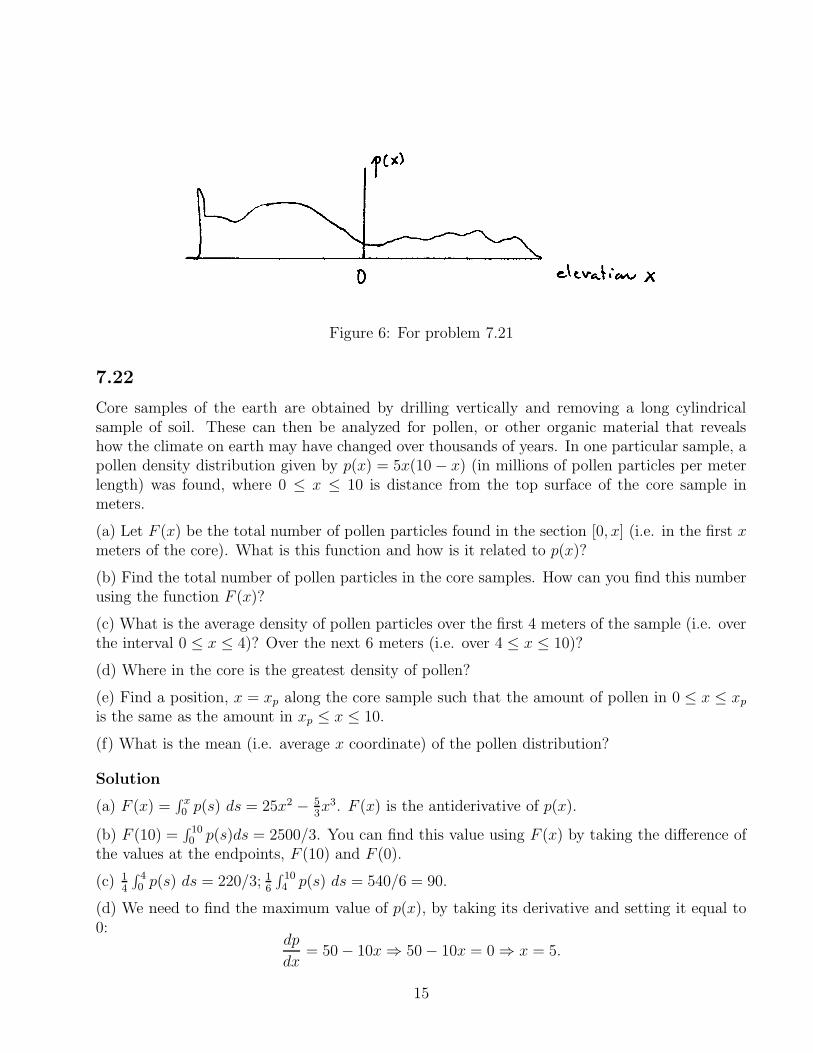
Figure 6: For problem 7.21
7.22
Core samples of the earth are obtained by drilling vertically and removing a long cylindricalsample of soil. These can then be analyzed for pollen, or other organic material that revealshow the climate on earth may have changed over thousands of years. In one particular sample, apollen density distribution given by p(x) = 5x(10 − x) (in millions of pollen particles per meterlength) was found, where 0 ≤ x ≤ 10 is distance from the top surface of the core sample inmeters.
(a) Let F (x) be the total number of pollen particles found in the section [0, x] (i.e. in the first xmeters of the core). What is this function and how is it related to p(x)?
(b) Find the total number of pollen particles in the core samples. How can you find this numberusing the function F (x)?
(c) What is the average density of pollen particles over the first 4 meters of the sample (i.e. overthe interval 0 ≤ x ≤ 4)? Over the next 6 meters (i.e. over 4 ≤ x ≤ 10)?
(d) Where in the core is the greatest density of pollen?
(e) Find a position, x = xp along the core sample such that the amount of pollen in 0 ≤ x ≤ xp
is the same as the amount in xp ≤ x ≤ 10.
(f) What is the mean (i.e. average x coordinate) of the pollen distribution?
Solution
(a) F (x) =∫ x0 p(s) ds = 25x2 − 5
3x3. F (x) is the antiderivative of p(x).
(b) F (10) =∫ 100 p(s)ds = 2500/3. You can find this value using F (x) by taking the difference of
the values at the endpoints, F (10) and F (0).
(c) 14
∫ 40 p(s) ds = 220/3; 1
6
∫ 104 p(s) ds = 540/6 = 90.
(d) We need to find the maximum value of p(x), by taking its derivative and setting it equal to0:
dp
dx= 50 − 10x ⇒ 50 − 10x = 0 ⇒ x = 5.
15

(e) By symmetry it is also at x = 5.
(f) By symmetry it is also at x = 5.
7.23
The probability that seeds will be dispersed at distance x, 0 ≤ x ≤ 10, from a tree is p(x) =Ce−x/10.
(a) Determine the constant C so that p(x) is a probability density function.
(b) Determine the mean and median distances of dispersal.
Solution
(a) C must satisfy the equation∫ 100 Ce−x/10 dx = 1:
∫ 10
0Ce−x/10 dx = C
(
e−x/10
−1/10
)
∣
∣
∣
10
0= −10C(e−1 − 1) = 1 =⇒ C =
1
10(1 − e−1)≈ 0.1582
(b) The mean distance is given by
µ =∫ 10
0Cxe−x/10 dx = C
(
x
(
e−x/10
−1/10
)
∣
∣
∣
10
0−∫ 10
0
e−x/10
−1/10dx
)
= C(
−100e−1 + 10∫ 10
0e−x/10 dx
)
= C
(
−100e−1 + 10
(
e−x/10
−1/10
)
∣
∣
∣
10
0
)
= C(
−100e−1 − 100(e−1 − 1))
= 100C(1 − 2e−1) =10(1 − 2e−1)
1 − e−1≈ 4.180
The median distance of dispersal is that value of m so that∫ m
0Ce−x/10 dx =
1
2:
∫ m
0Ce−x/10 dx = C
(
e−x/10
−1/10
)
∣
∣
∣
m
0=⇒ 10C(1 − e−m/10) =
1
2
=⇒ 1 − e−m/10 =1
20C=⇒ e−m/10 =
1
2(1 + e−1)
=⇒ m = 10 ln(
2
1 + e−1
)
≈ 3.799
7.24
Suppose p(x) is the probability that a student in Math 102 gets a grade x. The median of p(x)is that value of x for which a typical student is equally likely to score above as below.
(a) Suppose the range of scores is a ≤ x ≤ b and denote the median by m. Explain why∫ m
ap(x) dx =
∫ b
mp(x) dx =
1
2
16

(b) Suppose that the students’ marks are described by the constant probability density functionp(x) = 1
100on the interval 0 ≤ x ≤ 100. Find the average mark and the median mark. What is
the chance that a typical student scores better than the average mark? better than the median?Was the course easy or hard for these students?
(c) Now suppose that the students’ marks are described by p(x) = Cx on the interval 0 ≤ x ≤ 100.What is the constant C? Find the average mark and the median. What is the chance that atypical student scores better than the average mark? better than the median? In this case wasthe course “easier” or “harder” than in part (b). Explain why.
Solution
(a) By definition, the median is the coordinate at which the area under the distribution is cutinto two equal portions, thus
∫ m
ap(x) dx =
∫ b
mp(x) dx
Since the total area under a probability distribution is always 1, this area must be equal to 1/2:
∫ m
ap(x) dx =
∫ b
mp(x) dx =
1
2.
(b) For p(x) = 1100
, 0 ≤ x ≤ 100 the distribution is constant and symmetric about x = 50 so
both mean and median are at x = 50. The chance that a student scores better than the meanor median is
Px>x̄ =1
100
∫ 100
50dx = (100 − 50)/100 = 0.5.
A mean at 50% is generally considered fairly low, so many students found this class hard.
(c) For p(x) = Cx we first note that C∫ 1000 p(x) dx = 1 which tells us that C 1002
2= 5000C = 1
so C = 15000
. The mean (average) mark is
x̄ =1
5000
∫ 100
0x x dx = 200/3 = 66.66
To find the median we must find the value of s such that
1
5000
∫ s
0x dx = 1/2
i.e. such that 15000
s2
2= 1
2. We get s =
√5000 = 70.71. This is the median since half the class did
better than 70.71 and half scored below this value. This course was thus “easier” than the onein part (a). The chance that the student did better than the mean in this course was
Px>x̄ =∫ 100
66.66p(x)dx = 0.55.
The chance that the student did better than the median is Px>median = 0.5. (Remark: thisfollows directly from the definition of median, and no integration needed here to calculate this.)
17

7.25
The probability density function of a light bulb failing at time t, 0 ≤ t < ∞, is given byp(t) = Ce−(0.1)t, where t is in days.
(a) Determine the constant C so that p(t) is a probability density function. In other wordsdetermine C so that
∫∞0 Ce−(0.1)t dt = 1.
(b) Find the function that describes the fraction of light bulbs failing by time t.
(c) What fraction of light bulbs are working after 20 days?
(d) Determine the mean and median times of failure.
Solution
(a) We must have∫∞0 Ce−(0.1)t dt = 1 for a probability density function:
∫ ∞
0Ce−(0.1)t dt = C
(
e−(0.1)t
−(0.1)
)
∣
∣
∣
∞
0= −10C(0 − 1) = 10C =⇒ C =
1
10
(b) The fraction of light bulbs failing by time t is
F (t) =∫ t
0Ce−(0.1)s ds =
1
10
(
e−(0.1)s
−(0.1)
)
∣
∣
∣
t
0= −1(e−(0.1)t − 1) = 1 − e−(0.1)t
(c) The fraction of light bulbs working after 20 days is
∫ ∞
20Ce−(0.1)t dt =
1
10
(
e−(0.1)t
−(0.1)
)
∣
∣
∣
∞
20= −1(0 − e−2) = e−2 ≈ 0.1353
(d) The mean time of failure is given by
µ =1
10
∫ ∞
0te−(0.1)t dt =
t
10
(
e−(0.1)t
−(0.1)
)
∣
∣
∣
∞
0+
1
10
∫ ∞
0
e−(0.1)t
−(0.1)dt = −10e−(0.1)t
∣
∣
∣
∞
0= 10
The median time is that value m so that 110
∫m0 e−(0.1)t dt = 1
2:
1
10
∫ m
0e−(0.1)t dt =
1
10
(
e−(0.1)t
−(0.1)
)
∣
∣
∣
m
0= −e−(0.1)t
∣
∣
∣
m
0= 1 − e−(0.1)m
Finally,
1 − e−(0.1)m =1
2⇐⇒ m = 10 ln 2 ≈ 6.931
18
7.26
A random bulb from a batch of light bulbs has the probability D(t) = 1 − e−rt of failing beforet hours. If the mean lifetime of such bulbs is 1000 hours, what is the value of r?
Solution
D(t) is the cumulative distribution function (CDF). Thus, p(t) = D′(t) = re−rt. The mean
lifetime:∞∫
0tp(t)dt = 1/r. Thus, 1/r = 1000, r = 0.001 hr−1.
7.27
Let M(t) be the amount of a certain radioactive substance left at time t. Then
M(t) = Moe−kt
for some positive constant k, where M0 is the initial amount. The cumulative amount that hasdecayed in the first t years is
F (t) = Mo(1 − e−kt)
(a) If k = ln(2)/1000, show that F (1000) = Mo/2.
(b) Show that the function
p(t) =F ′(t)
F (1000)
satisfies all the requirements of a probability density distribution for 0 ≤ t ≤ 1000.
(c) Sketch the functions M(t), F (t), F ′(t).
(d) Use integration by parts to calculate the mean time t̄ of decay.
Solution
(a) F (1000) = M0(1 − e−1000k) = M0(1 − e− ln 2) = M0/2.
(b) F (t) = M0(1 − e−kt) = M0 − M0e−kt =⇒ F ′(t) = kM0e
−kt, and so p(t) =F ′(t)
F (1000)=
kM0e−kt
M0/2= 2ke−kt ≥ 0 for 0 ≤ t ≤ 1000. Also
∫ 1000
0p(t) dt = 2k
∫ 1000
0e−kt dt = 2k
e−kt
−k
∣
∣
∣
1000
0= −2e−1000k + 2 = 2 − 2e− ln 2 = 1
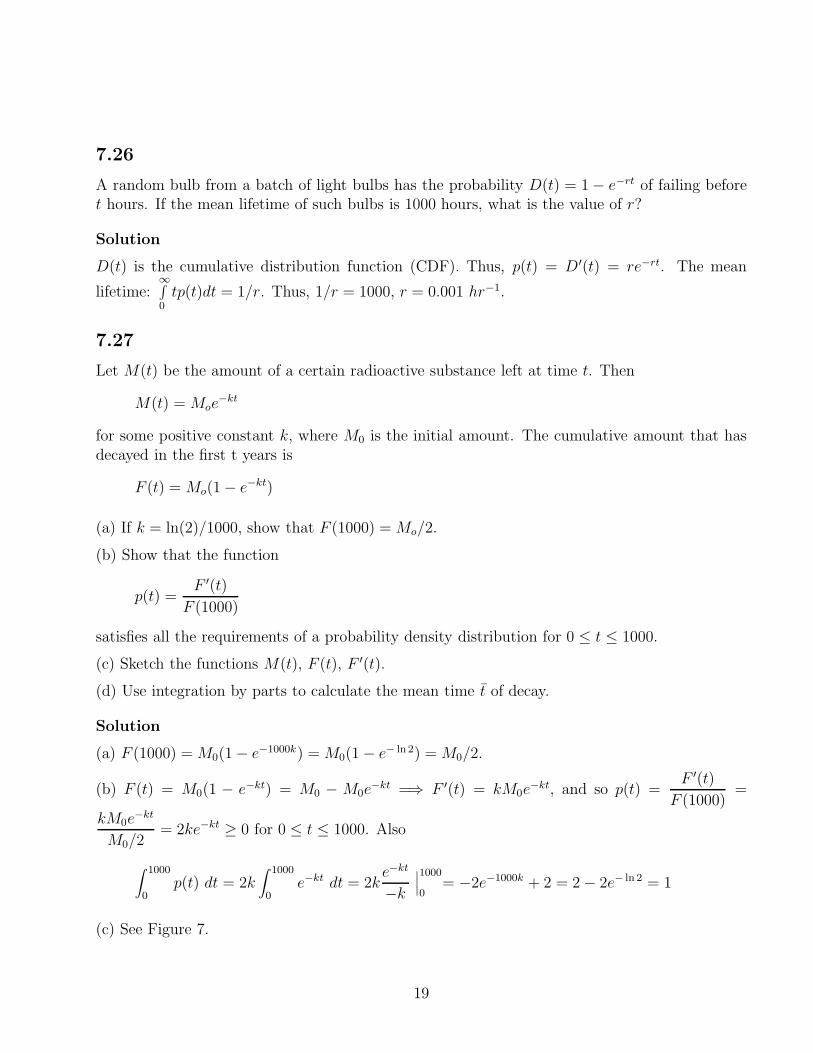
(c) See Figure 7.
19

Mo
t
M(t)
t
F(t)
Mo
t
F′(t)
Moln(2)/1000
Figure 7: Plot of M(t), F (t), F ′(t) for problem 7.27
(d) The mean time of decay is given by
t̄ = 2k∫ 1000
0te−kt dt = 2k
(
te−kt
−k
∣
∣
∣
1000
0−∫ 1000
0
e−kt
−kdt
)
= −2000e−1000k + 2∫ 1000
0e−ktdt
= −2000e−1000k + 2e−kt
−k
∣
∣
∣
1000
0= −2000e−1000k − 2
k(e−1000k − 1)
= −1000 − 2
k
(
1
2− 1
)
= −1000 +1
k=
1 − 1000k
k=
1000(1 − ln 2)
ln 2≈ 442.6950408
7.28
If p(x) is a probability density distribution on [a, b] then its “First moment” M1, is just its mean,
M1 = x̄ =b∫
axp(x)dx, and its “Second moment” M2 is defined by M2 =
b∫
ax2p(x)dx. We also
define the variance, V , and standard deviation, σ, as follows: V = M2 − (M1)2 and σ =
√V .
Use these definitions to compute the mean, variance, and standard deviation of the followingprobability density functions:
(a)
p(x) =
{
C, 0 ≤ x ≤ b0 otherwise
(b) p(x) = ke−kx (x ≥ 0).
(c) p(x) = 2(1 − x) (0 ≤ x ≤ 1).
Solution
(a) C=1/b. Mean=b/2. M2 = b2/3, V = b2/12, σ = b/(2√
3).
(b) Mean = x̄ = k∫∞0 xe−ktdx. By Integration by Parts, we find x̄ = 1
k.
M2 = k∫∞0 x2e−ktdx. Using Integration by Parts twice, M2 = 2
k2 .
Therefore, V = 2k2 − 1
k2 = 1k2 , and σ =
√
1k2 = 1
k.
20

(c) Mean = x̄ =∫ 10 (2x − 2x2)dx =
(
x2 − 2x3
3
) ∣
∣
∣
1
0= 1
3.
M2 =∫ 10 (2x2 − 2x3)dx =
(
2x3
3− x4
2
) ∣
∣
∣
1
0= 1
6.
Therefore, V = 16− 1
9= 3
18− 2
18= 1
18, and σ =
√
118
= 13√
2.
7.29
Consider the uniform probability distribution p(x) = C, a ≤ x ≤ b. (See Figure 3).
(a) Find the variance and the standard deviation.
(b) Find cumulative distribution function, F (x) for this probability density.
Solution
(a) First we must find C such that p(x) is a probability density function:
∫ b
aC dx = 1 ⇒ (b − a) C = 1 ⇒ C =
1
b − a.
To find the variance and the standard deviation, we need to find both M1 and M2.
M1 = µ =1
b − a
∫ b
ax dx =
1
b − a
(
b2 − a2
2
)
=b + a
2.
M2 =1
b − a
∫ b
ax2 dx =
b3 − a3
3(b − a)=
b2 + ab + a2
3.
Therefore, by some elementary algebra:
V = M2 − µ2 =b2 + ab + a2
3−(
a + b
2
)2
=4b2 + 4ab + 4a2 − 3(a2 + 2ab + b2)
12
=b2 − 2ab + a2
12=
(b − a)2
12.
Finally the standard deviation is
σ =√
V =b − a√
12=
b − a
2√
3.
(b) The cumulative distribution function is F (x) =∫ x
a
1
b − adt =
x − a
b − a.
21

7.30
Consider the function p1(x), −b ≤ x ≤ b, which is given by
p1(x) =
{
cbx + c if − b ≤ x ≤ 0
− cbx + c if 0 ≤ x ≤ b
Find the variance and the standard deviation for p1(x).
Solution
We use the formula V = M2 − µ2 to calculate the variance and standard deviation.
V =
(
cb3
6
)2
− 02 =
(
cb3
6
)2
=b4
36, σ =
√V =
cb3
6=
b2
6.
7.31
The function
p(x) = C sin(
π
6x)
, 0 ≤ x ≤ 6,
is the probability density function for a random jump of x units at some large track meet.
(a) Determine the constant C.
(b) Find the zero’th, the first, and the second moments of this probability distribution, i.e.calculate
I0 =∫ 6
0p(x) dx, I1 =
∫ 6
0x p(x) dx, I2 =
∫ 6
0x2 p(x) dx
(c) Use the results of (b) to determine the mean, the variance, and the standard deviation of thejump distance.
Solution
(a)
∫ 6
0C sin
(
π
6x)
dx = −6C
πcos
(
πx
6
)
∣
∣
∣
6
0=
12C
π=⇒ C =
π
12.
(b) We use integration by parts:
I0 = 1 by the definition of probability density functions.
I1 = C∫ 6
0x sin
(
πx
6
)
dx = C[
−6x
πcos
(
πx
6
)
+36
π2sin
(
πx
6
)] ∣
∣
∣
∣
6
0=
π
12· 36
π= 3
22

I2 = C∫ 6
0x2 sin
(
πx
6
)
dx = C216
π3
(
−π2
36x2 cos
(
πx
6
)
+ 2 cos(
πx
6
)
+1
3πx sin
(
πx
6
)
)
∣
∣
∣
∣
6
0
=π
12· 216
π3· (π2 − 2 − 2) =
18(π2 − 4)
π2≈ 10.70
Note: I1 = 3 by symmetry of p(x).
(c) By symmetry we have µ = 3. We use the formulas V = I2 − µ2 and σ =√
V to calculate thevariance and standard deviation:
V =18(π2 − 4)
π2− 9 =
9π2 − 72
π2≈ 1.705, σ =
√V =
√
9π2 − 72
π2=
√9π2 − 72
π≈ 1.306.
7.32
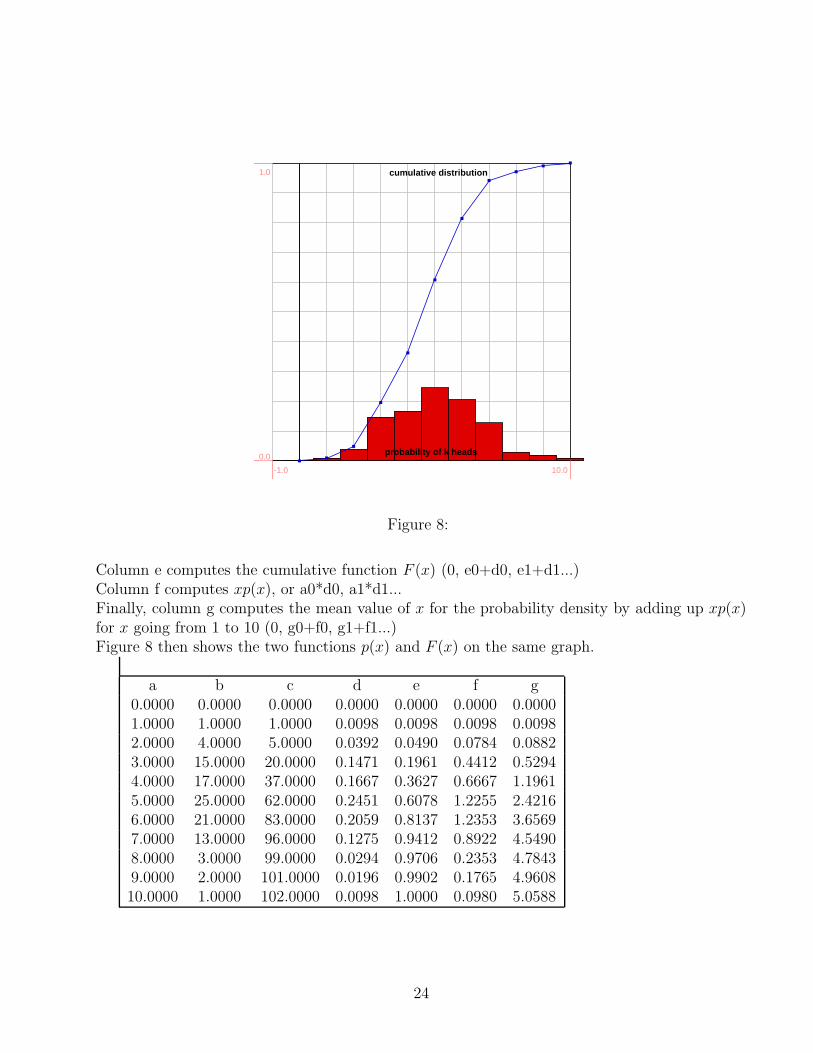
Given below is the distribution of the number of heads (H) obtained by a group of people in anexperiment in which each person tossed the coin ten times. (N(x)=number of people who got xheads.) Use the spreadsheet to plot the (empirical) probability distribution of obtaining x headsin 10 tosses based on this data and the cumulative distribution (of obtaining up to k heads) onthe same graph. Use the spreadsheet to calculate the expected number of heads based on thesame data. Submit a graph of the probability distribution and cumulative distribution on whichthe calculated expected value is given.
num heads x num people N(x)0 01 12 43 154 175 256 217 138 39 210 1
Solution
We show below how the data is organized in the spreadsheet:Column a contains the number x of heads from 1 to 10.Column b contains the number of people who got x heads.Column c totals up the size of the group of people. (There were 102 people in all).The numbers in column d are then the fraction of the group that got a given number of heads,which is a0/102, b0/102... This is the probability p(x) of getting x heads.
23
probability of k heads
cumulative distribution
-1.0 10.0
0.0
1.0
Figure 8:
Column e computes the cumulative function F (x) (0, e0+d0, e1+d1...)Column f computes xp(x), or a0*d0, a1*d1...Finally, column g computes the mean value of x for the probability density by adding up xp(x)for x going from 1 to 10 (0, g0+f0, g1+f1...)Figure 8 then shows the two functions p(x) and F (x) on the same graph.
a b c d e f g0.0000 0.0000 0.0000 0.0000 0.0000 0.0000 0.00001.0000 1.0000 1.0000 0.0098 0.0098 0.0098 0.00982.0000 4.0000 5.0000 0.0392 0.0490 0.0784 0.08823.0000 15.0000 20.0000 0.1471 0.1961 0.4412 0.52944.0000 17.0000 37.0000 0.1667 0.3627 0.6667 1.19615.0000 25.0000 62.0000 0.2451 0.6078 1.2255 2.42166.0000 21.0000 83.0000 0.2059 0.8137 1.2353 3.65697.0000 13.0000 96.0000 0.1275 0.9412 0.8922 4.54908.0000 3.0000 99.0000 0.0294 0.9706 0.2353 4.78439.0000 2.0000 101.0000 0.0196 0.9902 0.1765 4.960810.0000 1.0000 102.0000 0.0098 1.0000 0.0980 5.0588
24


![topical-Math-SL-2011-2017-Statistics and Probability · 2018. 10. 14. · First Marble Red Blue Find the probability that both marbles are blue. Second Marble Red Blue Red Blue [3]](https://static.fdocuments.in/doc/165x107/5feb59e40c584e1f5e29256e/topical-math-sl-2011-2017-statistics-and-probability-2018-10-14-first-marble.jpg)