7. ANALYTICAL METHODS · PDF filePCBs 597 7. ANALYTICAL METHODS (EPA 1999k). Estimated...
20
PCBs 595 7. ANALYTICAL METHODS The purpose of this chapter is to describe the analytical methods that are available for detecting, and/or measuring, and/or monitoring PCBs, its metabolites, and other biomarkers of exposure and effect to PCBs. The intent is not to provide an exhaustive list of analytical methods. Rather, the intention is to identify well-established methods that are used as the standard methods of analysis. Many of the analytical methods used for environmental samples are the methods approved by federal agencies and organizations such as EPA and the National Institute for Occupational Safety and Health (NIOSH). Other methods presented in this chapter are those that are approved by groups such as the Association of Official Analytical Chemists (AOAC) and the American Public Health Association (APHA). Additionally, analytical methods are included that modify previously used methods to obtain lower detection limits, and/or to improve accuracy and precision. Methodology for PCB analysis includes several steps: sample collection and storage, extraction, cleanup, and determination (EPA 1995c, 1999k; Hess et al. 1995). Care must be taken to assure that the sample collection follows quality assurance protocols and that equipment and containers are free from contamination. Most sample collections are by grab sampling; however, PCBs may be concentrated from water or air onto sorbents. PCBs are typically separated from the sample matrix by solid-phase extraction (SPE), separatory funnel extraction, continuous liquid/liquid extraction (CLLE), Soxhlet extraction, or Soxhlet/Dean-Stark extraction. PCBs may be difficult to extract from oily matrices in which they are soluble. Some problems that may occur during extraction include evaporative losses during concentration, sorption onto labware, and contamination of samples. Cleanup steps are necessary to remove compounds that may interfere with the determination. Chromatography (e.g., gel permeation, silica gel, Florisil, activated carbon, high-performance liquid) is often used to remove matrix interferences, and sometimes to fractionate PCBs into several groups. Cleanup by chromatography has been used extensively to separate the non-ortho and the mono-ortho CBs from the remaining congeners before quantitative analysis (Hess et al. 1995). The identification and quantitation of PCBs are most often accomplished by gas chromatographic (GC) techniques. Capillary or high resolution gas chromatography (HRGC) columns capable of separating a substantial proportion of the congeners are indispensable, and GC detectors possessing high selectivity and sensitivity for the PCBs are required. The more universal and less sensitive flame-ionization detector (FID) is used much less often than the electron capture detector (ECD), which has exceptional sensitivity to multiply chlorinated compounds. The mass spectrometer-selected-ion-monitoring (MS-SIM) or ion-trap mass spectrometer (ITMS) detectors have sensitivities somewhat lower than ECD, and they have even greater selectivity for PCBs and can
Transcript of 7. ANALYTICAL METHODS · PDF filePCBs 597 7. ANALYTICAL METHODS (EPA 1999k). Estimated...
PCBs 595
7 ANALYTICAL METHODS
The purpose of this chapter is to describe the analytical methods that are available for detecting andor
measuring andor monitoring PCBs its metabolites and other biomarkers of exposure and effect to
PCBs The intent is not to provide an exhaustive list of analytical methods Rather the intention is to
identify well-established methods that are used as the standard methods of analysis Many of the
analytical methods used for environmental samples are the methods approved by federal agencies and
organizations such as EPA and the National Institute for Occupational Safety and Health (NIOSH) Other
methods presented in this chapter are those that are approved by groups such as the Association of
Official Analytical Chemists (AOAC) and the American Public Health Association (APHA)
Additionally analytical methods are included that modify previously used methods to obtain lower
detection limits andor to improve accuracy and precision
Methodology for PCB analysis includes several steps sample collection and storage extraction cleanup
and determination (EPA 1995c 1999k Hess et al 1995) Care must be taken to assure that the sample
collection follows quality assurance protocols and that equipment and containers are free from
contamination Most sample collections are by grab sampling however PCBs may be concentrated from
water or air onto sorbents PCBs are typically separated from the sample matrix by solid-phase extraction
(SPE) separatory funnel extraction continuous liquidliquid extraction (CLLE) Soxhlet extraction or
SoxhletDean-Stark extraction PCBs may be difficult to extract from oily matrices in which they are
soluble Some problems that may occur during extraction include evaporative losses during
concentration sorption onto labware and contamination of samples Cleanup steps are necessary to
remove compounds that may interfere with the determination Chromatography (eg gel permeation
silica gel Florisil activated carbon high-performance liquid) is often used to remove matrix
interferences and sometimes to fractionate PCBs into several groups Cleanup by chromatography has
been used extensively to separate the non-ortho and the mono-ortho CBs from the remaining congeners
before quantitative analysis (Hess et al 1995) The identification and quantitation of PCBs are most often
accomplished by gas chromatographic (GC) techniques Capillary or high resolution gas chromatography
(HRGC) columns capable of separating a substantial proportion of the congeners are indispensable and
GC detectors possessing high selectivity and sensitivity for the PCBs are required The more universal
and less sensitive flame-ionization detector (FID) is used much less often than the electron capture
detector (ECD) which has exceptional sensitivity to multiply chlorinated compounds The mass
spectrometer-selected-ion-monitoring (MS-SIM) or ion-trap mass spectrometer (ITMS) detectors have
sensitivities somewhat lower than ECD and they have even greater selectivity for PCBs and can
PCBs 596
7 ANALYTICAL METHODS
distinguish and individually measure homologs that may coelute on a particular HRGC column (EPA
1999k)
Some methods in use are multi-residue methods in which PCBs along with many other analytes such as
pesticides are determined In general PCB methods analyze for Aroclor mixtures PCB homologs or
individual PCB congeners Until recently packed column GCECD was used most often for the
determination of PCBs as Aroclor mixtures The Webb-McCall technique was used for quantitation The
weight percent and homolog identification were determined for several Aroclors Response factors were
generated to calculate the amount in each sample peak with packed columns each peak contains several
congeners The amounts found in each sample peak were then summed (Webb-McCall 1973)
Alternately the total area in the Aroclor region of the chromatogram was used for quantitation However
Aroclor analyses are estimations that are prone to error as a result of the subjective assignment of Aroclor
speciation and response factors Also the practice of comparing CB patterns in environmental samples
with those of technical mixtures can be misleading since mixtures emanating from different sources are
mixed at differing rates by diffusion evaporation and adsorption onto solids Many congeners are
metabolized while others bioconcentrate in lipophilic material Therefore the final pattern in the
environment is often highly modified and may not resemble the original commercial formulation or
mixture of formulations (Draper et al 1991 Duinker and Hillebrand 1979 Hess et al 1995) The
maximum detection limits (MCLs) for Aroclors vary in the range of 0054ndash090 microgL in water and
57ndash70 microgkg in soils (EPA 1995c) Another approach is to determine PCBs by level of chlorination (or
homolog group) One PCB for each homolog (isomer group) is typically used for calibration Total PCB
concentration is obtained by summing isomer group concentrations (Alford-Stevens et al 1986)
However since the congener distribution is not determined with this method an accurate calculation of
PCB toxic equivalency (TEQ) can not be accessed Recently capillary or HRGC has made it possible to
achieve lower detection limits and better separation of individual PCB congeners for quantitation (Frame
1997 Mullin et al 1984 Newman et al 1998) although complete separation of all PCB congeners on a
single column has not yet been achieved (Duebeleis et al 1989) The commonly used capillary columns
(DB-5 C-18 DB-1701 SE-54 SIL-8 SP-2330 and CP-SIL-8) provide poor or no resolution for the
following groups of congeners 1518 2831 4952 6695 77110 8490101 118149 138163164
105132153 170190 and 182187 (Liem 1999 Schantz et al 1993b) Nevertheless the trend is toward
congener-specific analysis by HRGC Recent advances include analytical methods that are able to
quantify individual PCBs congeners to enable TEQ calculations (EPA 1999k Frame 1999 Patterson et
al 1994) EPA Method 1668 (Revision A ) is the current methodology used to measure individual PCB
congeners in water soil sediment and tissue by HRGChigh resolution mass spectrometry (HRMS)
PCBs 597
7 ANALYTICAL METHODS
(EPA 1999k) Estimated detection limits (EDL) of selected PCB congeners range from 109 to 193 pgL
for water and 11ndash19 ngkg for soil tissue and mixed-phase samples EDLs are listed in Table 7-1 for
EPA Method 1668 (Revision A EPA 1999k) This method has been used to measure specific PCBs in
EPA projects such as the assessment of PCBs in fish consumed by four Native American tribes in the
Columbia River Basin in Washington state (EPA 1996f) As for all analytical methods determining the
quality and usability of Aroclor PCB homolog or specific congener data by formal data validation
procedures is recommended EPA has developed data validation guidelines for HRGCECD Aroclor data
and HRGCLRMS (low resolution mass spectrometry) PCB specific congener data (EPA 1994h 1995g)
71 BIOLOGICAL SAMPLES
The quantitation of PCBs in biological samples usually consists of three distinct steps extraction of PCBs
from the sample matrix by a solvent or a combination of solvents cleanup of PCBs from impurities on
single or multiple columns and finally quantitation by GC with a suitable detector A summary of some
available methods for biological samples is shown in Table 7-2
PCBs are extracted from blood or serum by solvent extraction techniques using hexane (EPA 1980
Needham et al 1980) benzene (Mes et al 1994 1995a 1995b 1995c) or mixed solvents such as
hexaneethyl ether (Koopman-Esseboom et al 1994b Luotamo et al 1985 Needham et al 1981) or by
solid phase micro-extraction techniques (Poon et al 1999) A variety of adsorbents may be used for
cleanup andor fractionation of extracts deactivated silica gel (Burse et al 1989) Florisil (Mes et al
1994 1995a 1995b 1995c) alumina (Koopman-Esseboom et al 1994b) or multiple columns (Patterson
et al 1989) GCECD is used most often for determination of biological samples (Burse et al 1989 Mes
et al 1994 1995a 1995b NIOSH 1984b Schantz et al 1994) Confirmation by mass spectrometry is
recommended (Burse et al 1994 Mes et al 1994) Detection limits are in the low- to sub-ppb range
(Luotamo et al 1985 Mes et al 1994 1995a 1995b Needham et al 1981 NIOSH 1984b Poon et al
1999) Recovery where reported ranges from 80 to 96 (Koopman-Esseboom et al 1994b Mes et al
1994 Needham et al 1980 1981 NIOSH 1984b Poon et al 1999) The accuracy and precision of the
results of PCB analysis in serum using a packed column GCECD method were studied in a collaborative
study The mean recovery (for Aroclor 1254) was 822 inter-laboratory precision was lt21 for
samples spiked at 10ndash100 ngmL (Burse et al 1989) Cord blood which is the most direct marker of fetal
exposure requires especially sensitive analytical methods for accurate PCB analysis because of its
PCBs 598
7 ANALYTICAL METHODS
Table 7-1 EPA Method 1668-Estimated Method Detection Limits (EMDL) and Estimated Minimal Levels (EML) of Selected PCB Congenersab
Detection limits and minimal levels-matrix and concentrationc
Water (pgL) Otherd (ngkg) Extract (pgmicroL)
Congener EMDL EML EMDL EML EML
77 169 500 17 50 20
105 109 200 11 20 10
114 120 500 12 50 20
118 193 500 19 50 20
123 150 500 15 50 20
126 136 500 14 50 20
156 132 500 13 50 20
157 132 500 13 50 20
167 115 500 11 50 20
169 161 500 16 50 20
180 136 500 14 50 20
189 177 500 18 50 20
aSource EPA 1999k bfor SPB-Octyl gas chromatography column cEMDLs and EMLs with common laboratory interferences present Without interferences EMDLs and EMLs will be respectively 5 and 10 pgL for aqueous samples and 05 and 10 ngkg for soil tissue and mixed-phase samples and EMLs for extracts will be 05 pgmicroLdsoil tissue and mixed-phase samples
EMDL = estimated method detection limits EML = estimated minimal levels EPA = US Environmental Protection Agency
Table 7-2 Analytical Methods for Determining Polychlorinated Biphenyls in Biological Samples
Analytical method Sample Percent Sample matrix Preparation method detection limit recovery Reference
Serum Extraction with mixed solvents treatment with methanolic KOH extraction with hexane cleanup on silica gel column
HRGCECD 10 ngmL on 1 mL sample
gt80 at 25ndash400 ngmL NIOSH 1984b (method 8004)
Serum Extraction with mixed solvents cleanup on silica gel column
GCECD No data 822 (average) Burse et al 1989
Serum Solvent extraction cleanup on 10 silver nitrate on silica gel column
GCECD No data 937 at 41 microgL Needham et al 1980
Serum Extraction with mixed solvents cleanup on hydrated silica gel column for separation of PCBs from PBBs
GCECD 25 ngmL 953 at 100 microgL and 105ndash127 at 10 microgL
Needham et al 1981
Serum Extraction with diethyl ether and hexane wash of extract with
HRGCEC 01 ngmL 85 at 25ndash125 ngmL Luotamo et al 1985
sulfuric acid cleanup on silica column
Serum (congener specific)
Addition of surrogate congener standard PCB 46 and 142 extraction with hexane cleanup with Florisil
HRGCECD 1 pgg (PCB 200) - 634 pgg (PCB 99)
951plusmn125 (PCB 153) Greizerstein et al 1997
Serum Extraction with SPME thermal desorption of PCBs into GC column
GCECD 10 ppb (total PCBs)
lt93 Poon et al 1999
Blood Solvent extraction cleanup on Florisil
GCECD confirmation by HRGCMS-SIM
2 ngg 81ndash96 Mes et al 1994
Plasma Solvent extraction cleanup on alumina
Dual column HRGCECD
001 ngg gt95 Koopman-Esseboom et al 1994b
PCBs
599 7 AN
ALYTICAL M
ETHO
DS
Table 7-2 Analytical Methods for Determining Polychlorinated Biphenyls in Biological Samples (continued)
Analytical method Sample Percent Sample matrix Preparation method detection limit recovery Reference
Serum (congener Extraction of 13C-labeled PCBshy HRGCNICIMS 2 ppq 605 for PCB-77a 48 for Patterson et al specific) spiked sample with ethanol and IDMS PCB-126 and 16 for 1989
hexane wash of extract with PCB-169 concentrated sulfuric acid cleanup and fractionation by multi-column chromatography
Blood Methanolic KOH hydrolysis GCECD 2 pg 100plusmn4 at 109ndash109 ngg Que Hee et al extraction with hexane cleanup on 1983 silica gel and alumina column if necessary
Adipose tissue Solvent extraction cleanup on GCECD No data 91ndash93 at 3 microgg Smrek and sulfuric acidsilica gel and 10 Needham 1982 silver nitratesilica gel columns
Adipose tissue Extraction with acetonehexane Two dimensional No data gt80 at 10ndash500 ngg Le Bel and fractionation by GPC cleanup on HRGCMS Williams 1986 Florisil column
Adipose tissue Extraction of 13C-labeled PCBshy HRGCIDHRMS No data No data Patterson et al and serum spiked sample with ethanol 1994 (congener hexane wash of extract with specific) concentrated sulfuric acid cleanup
and fractionation by multi-column chromatography
Human milk Extraction with mixed solvents HRGCECD No data 94 at ngmL Mes et al 1984 cleanup on Florisil-silicic acid Safe et al 1985b column
Human milk Extraction with ethanolhexane HRGCECD 3 pgg 90ndash104 Hong et al (congener clean up on Florisil column 1992a specific) fractionation on porous graphitic
carbon Human milk Addition of surrogate congener HRGCECD 1 pgg (PCB No data Greizerstein et (congener standard PCB 46 and 142 200) - 129 pgg al 1997 specific) extraction with hexane cleanup (PCB 48)
with Florisil
PCBs
600 7 AN
ALYTICAL M
ETHO
DS
Table 7-2 Analytical Methods for Determining Polychlorinated Biphenyls in Biological Samples (continued)
Sample matrix Preparation method Analytical method Sample
detection limit Percent recovery Reference
Human milk Fat separation cleanup on adsorption columns
HRGCECD 04 ngg fat No data Abraham et al 1994
Human hair (congener specific)
Ultrasonic extraction with acetonehexane wash of extract with concentrated sulfuric acid and alkaline hydrolysis cleanup on Florisil column fractionation on carbon column
HRGCECD No data No data Zupancic-Kralj et al 1992
Liver kidney brain tissue (Rhesus monkeys)
Homogenization solvent extraction cleanup on Florisil
GCECD 12ndash33 ngg 78ndash100 (corn oil) Mes et al 1995a 1995b
Tissue (congener specific)
Homogenized extracted in methylen chloridehexane (11) using Soxhlet extractor cleanup using sulfuric acid and chromatography
HRGCHRMS See Table 7-1 No data EPA 1999k (method 1668)
aThe high recovery for PCB 77 was due to interference from other congeners The low recovery for PCB 126 and PCB-169 is not critical since IDMS makes correction for recovery unnecessary
ECD = electron capture detector GC = gas chromatography GPC = gel permeation chromatography HRGC = high resolution gas chromatography HRMS=high resolution mass spectroscopy IDHRMS = isotope dilution high resolution mass spectrometry IDMS = isotope dilution mass spectrometry KOH = potassium hydroxide MS = mass spectrometry MS-SIM = mass spectrometer-selected-ion-monitoring NICIMS = negative ion chemical ionization mass spectrometry PBBs = polybrominated biphenyls PCBs = polychlorinated biphenyls
PCBs
601 7 AN
ALYTICAL M
ETHO
DS
PCBs 602
7 ANALYTICAL METHODS
relatively low fat content Analysis of breast milk does not present this difficulty While analytical
techniques have improved enormously in recent years the low concentration of fat in cord blood may still
present difficulties in achieving accurate and reliable PCB levels
Methods for determining PCBs in adipose tissue are similar to those for blood Solvent extraction is used
to separate the PCBs along with other soluble organics from the tissue The PCBs are then separated
from the lipids usually by column chromatographic techniques Most procedures include a step for
determining the percent fat since results are often reported on a percent fat basis Very little performance
data are available for PCBs in adipose tissue Detection limits of 51ndash144 ngg have been reported for
adipose tissue from Rhesus monkeys (Mes et al 1994 1995b)
A congener-specific analysis of a commercial PCB preparation and the PCB composition of a human milk
sample were reported originally by Safe et al (1985b) Recent studies have demonstrated the analysis of
non-ortho coplanar and mono-ortho coplanar PCBs in breast milk (Dewailly et al 1991) and coplanar
PCBs in serum and adipose tissue (Patterson et al 1994) Determination of these congeners (PCBs 77
126 169) is useful in assessing the toxic potential of breast milk for infants
Recently supercritical fluid extraction (SFE) has been utilized for extraction and cleanup of biological
samples The procedure is quick and avoids the use of flammable or toxic organic solvents (Anitescu and
Tavlarides 1998 Djordjevic et al 1994) Packed-column GC techniques are still widely used however
HRGC has made it possible to achieve better separation of PCB congeners for quantitation (Ballschmiter
and Zell 1980 Mullin et al 1984)
The congeners to be determined in samples may be selected on the basis of their abundance in the
samples their toxicity or the availability of analytical standards The coplanar non-ortho-substituted
congeners are PCB-77 PCB-126 and PCB-169 The mono-ortho-substituted congeners PCB-28
PCB-74 PCB-105 PCB-118 and PCB-156 are also frequently determined along with the non-ortho shy
substituted PCB congeners PCBs 138 153 and 180 are frequently measured in higher amounts than
other congeners (Safe 1993 Schecter et al 1994) and are often included in sets of congeners for
quantitation
Variables in sampling methods greatly influence results For example PCB levels in milk fat may
decrease during lactation with maternal age and weight and with number of children born (Jensen 1987)
It has been shown by Lawton et al (1985b) that random error inter-laboratory variations in procedure
PCBs 603
7 ANALYTICAL METHODS
and methods used for reporting data may have considerable impact on the reported PCB levels in human
tissues Caution should be exercised when comparing exposure estimates or health effect studies reported
by different investigators unless similar analysis methodologies are employed Also without the
separation and quantitation of individual PCB congeners during analysis PCB concentrations can not be
directly correlated to toxic equivalency Currently EPA Method 1668 (Revision A) is a standard method
for analysis of individual PCB congeners in biological tissues (EPA 1999k)
72 ENVIRONMENTAL SAMPLES
An overview of PCB analysis including sampling technique extraction cleanup procedures and
quantification is reported in EPA Method 1668 (Revision A EPA 1999k) A summary of representative
methods is shown in Table 7-3 The table includes methods that have been standardized by NIOSH
EPA American Society for Testing and Materials (ASTM) AOAC and Food and Drug Administration
(FDA) Most of these methods were developed for the determination of Aroclors (noncongener-specific
PCBs) in environmental samples
Air samples are usually collected by pumping air through a sampler containing a glass fiber filter and
adsorbent trap to separate the particle bound and vapor phase fractions Adsorbents used most often
include Florisil (Lin and Que Hee 1985 1987 NIOSH 1984a) XAD-2 (EPA 1988b Hippelein et al
1993) and polyurethane foam (PUF) (Bremle and Larsson 1998 EPA 1988b) Florisil traps are solvent
desorbed (Lin and Que Hee 1985 1987 NIOSH 1984a) and XAD-2 traps are Soxhlet extracted (Bremle
and Larsson 1998 EPA 1988b Hippelein et al 1993) PCBs are determined by GCECD (Bremle and
Larsson 1998 EPA 1988b Irvine and Loganathan 1998 Lin and Que Hee 1985 1987 NIOSH 1984a) or
HRGCMS (Hippelein et al 1993) Detection limits depend upon the volume of air sampled however
detection limits in the low ngm3 (EPA 1988b) to low pgm3 (Hippelein et al 1993) have been reported
Recovery where reported is good (gt80) (Bremle and Larsson 1998 Brownlow and Que Hee 1985
EPA 1988b Irvine and Loganathan 1998 Lee et al 1996 Lin and Que Hee 1985 1987)
EPA Method 1668 (Revision A ) is the current methodology used to measure specific toxic dioxin-like
PCB congeners in surface ground and drinking water by HRGCHRMS (EPA 1999k) Drinking water
samples are typically extracted with solvent prior to analysis by GCECD HRGCECD and
HRGCHRMS (EPA 1989c 1999k) Detection limits are in the sub-ppb range and recovery is good
(gt80) (EPA 1989c) Preconcentration techniques may be used for extraction of large water volumes
thus lowering the method detection limit (Leister and Baker 1994 Swackhamer and Armstrong 1987)
Table 7-3 Analytical Methods for Determining Polychlorinated Biphenyls in Environmental Samples
Sample detection Percent Sample matrix Preparation method Analytical method limit recovery Reference Air (occupational) Adsorption on glass fiber filter and Florisil GCECD 00006 mgm3 for No data NIOSH 1984a
hexane desorption 50 L sample (method 5503) Air Adsorption on water-deactivated Florisil
hexane desorption perchlorination GCECD No data 84ndash103 at
4ndash49 microgm3 Lin and Que Hee 1985 1987
Air Adsorption on Florisil or Chromosorb 102 or GCECD 10 microgm3 for gt80 at 300 microgm3 Brownlow and Tenax GC or XAD-2 hexane desorption 4 L sample Que Hee 1985
Ambient Air Sample collection on glass fiber filter and GCECD gt1 ngm3 36ndash94 EPA 1988b (method PUF cartridge Soxhlet extraction alumina TO-4) column cleanup
Ambient air Sample collection on glass fiber filter and HRGCMS low pgm3 No data Hippelein et al 1993 (target XAD-2 trap Soxhlet extraction adsorption (calculated) congeners) column cleanup and fractionation Water (congener Extracted using SPE SFE CLLE cleanup HRGCHRMS See Table 7-1 No data EPA 1999k (method specific) using sulfuric acid and chromatography 1668) Drinking water Extraction with hexane HRGCECD 008ndash015 microgL 84ndash97 (tap water) EPA 1989c (method
505) Finished drinking Extraction with methylene chloride solvent GCECD or No data No data EPA 1989c (method water and exchange to methyl tert-butyl ether HRGCECD 508) groundwater Drinking water Extraction with methylene chloride solvent GCECD or 014ndash023 microgL 82ndash136 ngg EPA 1989c (method (screening) exchange to chloroform perchlorination to HRGCECD 508A)
decachlorobiphenyl Drinking water Extraction on SPE cartridges or disks HRGCMS 0045ndash024 microgL 65ndash100 EPA 1987f (method
elution with methylene chloride 525) Drinking water Sample spiked with 13C-labeled PCBs HRGCHRMS 002ndash004 pgL No data Miyata et al 1993 (congener solvent extraction of sample (filtered water specific) and particles) cleanup and fractionation by
adsorption chromatography
PCBs
604 7 AN
ALYTICAL M
ETHO
DS
Table 7-3 Analytical Methods for Determining Polychlorinated Biphenyls in Environmental Samples (continued)
Sample detection Percent Sample matrix Preparation method Analytical method limit recovery Reference Rain water Passage through filter and XAD-2 resin 2-dimensional lt1ndash30 pgL 79ndash83 Leister and Baker (congener solvent extraction cleanup on Florisil HRGCECD 1994 specific) column Waste water Extraction with methylene chloride GCECD 0065 microgL 88ndash96 at EPA 1982a 1988b
exchange to hexane cleanup on Florisil (PCB-1242) 25ndash110 microgL (method 608) column removal of elemental sulfur if necessary
Waste water Extraction with methylene chloride GCMS 30ndash36 microgL 77ndash80 at EPA 1982a (method (PCB-1221 1254) 5ndash2400 microgL 625)
Lake water Passage through glass fiber filter and HRGCECD No data 93 Swackhamer and XAD-2 Soxhlet extraction cleanup on Armstrong 1987 alumina and silica gel column
Sea water Collection of particulate and filtered water in HRGCECD 01ndash30 ngL 67ndash106 Kelly et al 1993 (congener a pressurized extraction-filtration system specific) cleanup with sodium hydroxide alumina
and silica column Soil sediments Extraction with hexaneacetone cleanup on GCECD lt1 microgg No data EPA 1994f (method and other solid Florisil column desulfurization if necessary 8080A)c
sample matrices Soil sediments Filtered and homogenized extracted using HRGCHRMS See Table 7-1 No data EPA 1999k (method and other solid SoxhletDean-Stark extractor cleanup 1668) sample matrices using sulfuric acid and chromatography (congener specific) Solid wastes Soxhlet extraction sulfuric acidpotassium HRGDECD 57ndash70 microgkg (soil) 62ndash125 (multiple EPA 1995c (Method (Aroclors or permanganate cleanup confirmation on lab) 8082)c
congeners) second column Hazardous Extraction with hexaneacetone cleanup on HRGCECD 60ndash70 microgkg 104ndash107 (for soil) Lopez-Avila et al wastes silica gel column desulfurization by copper 1988
or mercury if necessary
PCBs
605 7 AN
ALYTICAL M
ETHO
DS
Table 7-3 Analytical Methods for Determining Polychlorinated Biphenyls in Environmental Samples (continued)
Sample detection Percent Sample matrix Preparation method Analytical method limit recovery Reference Soilsediment Extraction with methylene chlorideacetone GCECD 80 microgkg (required No data EPA 1987a (CLP)b
(low level) (11) cleanup by gel permeation and microshy quantitation limit) alumina column
Sediment Ultrasonic extraction with acetonehexane HRGCECD No data 70ndash93 Fuoco et al 1993 (congener sulfur removal cleanup on Florisil specific) fractionation by HPLC Sediment Supercritical fluid extraction mini-Florisil HRGCECD No data 90 Lee and Peart 1994
column cleanup sulfur removal confirmation by MS Railcar paint Extraction with 90 methylene HRGCECD 1 mgkg 74ndash86 Welsh 1995 scrapings chloride10 methanol cleanup on Florisil
column Fly ash Soxhlet extraction optional column cleanup GCECD or GCMS- No data 80ndash100 Kohellipan et al 1994
SIM Fish (congener Extraction of homogenized tissue with HRGCNICIMS 02ndash3 pg 65ndash115 Schmidt and specific) petroleum etherethyl acetate cleanup by Hesselberg 1992
gel permeation chromatography Fish (congener Homogenized extracted in methylene HRGCHRMS See Table 7-1 No Data EPA 1999k (method specific) chloridehexane (11) using Soxhlet 1668)
extractor cleanup using sulfuric acid and chromatography
Fish fish egg Extraction of homogenized 13C-PCB labeled HRGCECD 01ndash073 ngg 62ndash92 Schwartz et al 1993 and bird egg tissues with methylene chloride removal of (lipid) (congener lipid by gel permeation or dialysis cleanup specific) by multi-layer and multiple chromatography
fractionation by HPLC Mammal blubber Sample ground solvent extraction micro- dual column 30 microgkg 952 (mean) Newman et al 1994
Florisil column cleanup HRGCECD Marine animals Microextraction GCECD 1 ng 95 (Aroclor 1254) Wirth et al 1994 Cows milk Mixing of sample fortified with 13C-labeled HRGCMS 01ndash05 pgg (fat) 50ndash60 Van der Velde et al (congener PCBs with sodium oxalate and methanol for tetra- to hexashy 1994 specific) solvent extraction cleanup and congeners of PCB
fractionation by porous carbon and alumina
PCBs
606 7 AN
ALYTICAL M
ETHO
DS
Table 7-3 Analytical Methods for Determining Polychlorinated Biphenyls in Environmental Samples (continued)
Sample matrix Preparation method Analytical method Sample detection limit
Percent recovery Reference
Eggs fish Supercritical fluid extraction combined with Florisil separation
GCECD No data 91ndash95 Alley and Lu 1995
Fatty foods Solvent extraction liquid-liquid partitioning cleanup on Florisil column
GCECD No data No data AOAC 1990
aThis method converts the different congeners to decachlorobiphenyl and cannot differentiate between commercial mixtures (eg Aroclor 1242 1260)bAs required by Contract Laboratory Program cMethod 8080A is proposed for deletion from SW-846 method 8082 is proposed for inclusion in SW-846
CLLE = continuous liquidliquid extraction ECD = electron capture detection GC = gas chromatography HPLC = high performance liquid chromatography HRGC = high resolution gas chromatography HRMS = high resolution mass spectrometry MS = mass spectrometry NICIMS = negative ion chemical ionization mass spectrometry ng = nanogram (10-9 g) pg = picogram (10-12 g) PUF = polyurethane foam SIM = selected ion monitoring SFE= separatory funnel extraction SPE = solid phase extraction
PCBs
607 7 AN
ALYTICAL M
ETHO
DS
PCBs 608
7 ANALYTICAL METHODS
Detection limits in the low pgL range have been reported (Leister and Baker 1994) Some of the
methods are noncongener-specific that is the results are reported as PCB mixtures (Aroclors) (EPA
1982a 1989c) and some are congener-specific (EPA 1987f 1999k Kelly et al 1993 Leister and Baker
1994 Miyata et al 1993) EPA Method 508A which converts all of the PCBs to decachlorobiphenyl is
a screening method for quantifying total PCBs (EPA 1989c) The method is likely to show interference
due to perchlorination of biphenyl or related compounds (EPA 1991b) and the method cannot quantify
individual commercial Aroclors in a PCB mixture Some waters particularly surface and waste waters
may require cleanup on adsorption columns prior to analysis (EPA 1982a 1988b Miyata et al 1993)
SPE media may be used reducing the use of flammable or toxic solvents (EPA 1987f)
Soil sediment and solid waste samples are usually Soxhlet extracted (EPA 1994f 1995c 1999k)
Ultrasonic extraction with various solvent combinations (Fuoco et al 1993) and SFE (Lee and Peart
1994) are utilized as well Recoveries using these methods are comparable to Soxhlet extraction
(80ndash100) Cleanup procedures include sulfur removal (EPA 1994f Fuoco et al 1993 Lee and Peart
1994 Lopez-Avila et al 1988) and separation on adsorbent columns (Bandh et al 1996 EPA 1994f
Fuoco et al 1993 Lee and Peart 1994 Lopez-Avila et al 1988) HRGCECD is used most often for
determination of PCBs (Fuoco et al 1993 Lee and Peart 1994 Lopez-Avila et al 1988) Detection limits
are generally in the ppb range (60ndash80 microgkg) (EPA 1987a 1995c Lopez-Avila et al 1988) Recovery of
62ndash125 of PCBs in clay and soil samples has been reported for a multiple lab study (EPA 1995c)
Methods using the enzyme-linked immunosorbent assay are commercially available for screening PCB
contamination in soils (Baek 1993 EPA 1995d) These methods are inexpensive and have a fast
turnaround time
Methods are available for measuring the concentration of PCBs in fish and animal tissues Tissues are
homogenized and then dried by blending with anhydrous sodium sulfate prior to Soxhlet or column
extraction (EPA 1999k Newman et al 1994) Direct extraction has also been utilized (Schwartz et al
1993) After cleanup PCBs are determined by HRGCECD (Schwartz et al 1993) dual column
HRGCECD (Newman et al 1994) or HRGCMS (Schmidt and Hesselberg 1992) A micro extraction
method for very small sample masses (25 microg) has been developed (Wirth et al 1994) A limit of
detection of 1 ngkg sample and good recovery (95) and precision were reported (Wirth et al 1994)
Few methods are available for the determination of PCBs in foods Little performance data have been
reported as well A method is available for the determination of Aroclors in poultry fat fish and dairy
products (AOAC 1990)
PCBs 609
7 ANALYTICAL METHODS
A number of Standard Reference Materials (SRMs) with certified PCB congener concentrations are
available from the National Institute of Standards and Technology (NIST) these include SRM 1588
PCBs in Cod Liver Oil SRM 1939 PCBs in River Sediment SRM 1941 PCBs in Marine Sediment and
SRM 1974 PCBs in Mussel Tissue (Schantz et al 1993a 1993b) These SRMs are useful in validating
the accuracy of methods for the determination of PCBs and for verifying that the method remains within
acceptable levels of error in during analysis A summary of available SRMs with certified PCB
concentrations is shown in Table 7-4 SRMs with non-certified concentration data for PCBs are included
in the table as well
73 ADEQUACY OF THE DATABASE
Section 104(i)(5) of CERCLA as amended directs the Administrator of ATSDR (in consultation with the
Administrator of EPA and agencies and programs of the Public Health Service) to assess whether
adequate information on the health effects of PCBs is available Where adequate information is not
available ATSDR in conjunction with the National Toxicology Program (NTP) is required to assure the
initiation of a program of research designed to determine the health effects (and techniques for developing
methods to determine such health effects) of PCBs
The following categories of possible data needs have been identified by a joint team of scientists from
ATSDR NTP and EPA They are defined as substance-specific informational needs that if met would
reduce the uncertainties of human health assessment This definition should not be interpreted to mean
that all data needs discussed in this section must be filled In the future the identified data needs will be
evaluated and prioritized and a substance-specific research agenda will be proposed
731 Identification of Data Needs
Methods for Determining Biomarkers of Exposure and Effect Several investigators have
used whole blood serum breast milk and hair as biomarkers for environmental exposure to PCBs
(Brown and Lawton 1984 Fait et al 1989 Furst et al 1994 Luotamo 1988 Safe et al 1985b Zupancic-
Kralj et al 1992) Consequently levels of PCBs in these media can provide estimates of exposure to
PCBs Analytical methods of satisfactory accuracy are available for determining congener- and
noncongener-specific PCBs in blood serum breast milk and human hair these methods are shown in
Table 7-2 Some methods for determining biomarkers are shown in Table 7-5 The method developed by
several investigators can be used for the determination of the three non-ortho substituted PCB congeners
Table 7-4 NIST Standard Reference Materials for the Determination of Polychlorinated Biphenyls (PCBs)a
SRM Description PCBs certified PCBs quantified
1589 PCBs (as Aroclor 1260) in human serum 1b
1588 Organics in cod liver oil Surrogate for a tissue extract with high lipid 4 43 content
1649 Urban dustorganics Air particulate material 10
1939 PCB congeners in river sediment Sediment with high levels of PCB congeners 3 17
1941a Organics in marine sediment Collected in Baltimore Harbor 15
1974 Organics in mussel tissue Frozen powder-like homogenate 13
1945 Whale blubber Frozen blubber homogenate 26
aSource Schantz et al 1993a bcertified as Aroclor 1260
NIST = National Institute of Standards and Technology
PCBs
610 7 AN
ALYTICAL M
ETHO
DS
Table 7-5 Analytical Methods for Determining Biomarkers for Polychlorinated Biphenyls
Analytical Sample detection Percent
Sample matrix Preparation method method limit recovery Reference Liver and adipose Homogenization extraction with HRGCECNIMS No data No data Buser et al 1992 tissue of gray seal methylene chloridecyclohexane (methyl sulfone removal of lipids by dialysis metabolite) cleanup by gel permeation
chromatography fractionation on carbon and Florisil columns
Serum (major Solvent extraction methylation HRGCECD and No data low nmolmL Morse et al 1995 metabolites of partition with H2SO4 HRGCMS PCB-77)
ECD = electron capture detection ECNI = electron capture negative ionization HRGC = high resolution gas chromatography MS = mass spectrometry
PCBs
611 7 AN
ALYTICAL M
ETHO
DS
PCBs 612
7 ANALYTICAL METHODS
(77 126 and 169) in human milk adipose tissue and serum at levels normally found in these tissues of
control population (Harrad et al 1992 Hong et al 1992a Patterson et al 1989 1994)
While blood serum breast milk adipose tissue and hair have been used as biomarkers of exposure the
possible equivalency of these biomarkers has not been intensively investigated At least two of these
biomarkers serum and breast milk did not appear to give equivalent measures of exposure even when
expressed on a lipid basis (The theory of equivalency is based on the assumption that the steady state
concentration of a persistent lipophilic substance in different body compartments is the same when
expressed on a lipid basis) Greizerstein et al (1999) compared levels of PCB congeners between serum
and milk from seven women in the New York Angler Study The congener profiles for serum and milk
samples were similar for each individual but different among all subjects The sum of the congener
concentrations was used to estimate the total PCB concentration The ratio of serum to milk
concentrations in the women ranged from 018 to 166 with a mean of 065plusmn049 showing no consistency
among individuals Considerable differences were also found in the lipid-adjusted concentrations of
PCBs among individuals The range of lipid-adjusted serum-to-milk ratios was 11ndash28 with a mean of
19plusmn05 The lipid-adjusted serum levels were also gt1 for the most abundant congeners PCBs 118 153
138 and 180 The lipid-adjusted ratios of these four non-planar congeners in serum and milk were
similar to those found by Koopman-Esseboom et al (1994b) in a study involving 418 mother-infant pairs
This latter study found that correlation coefficients between PCB congener levels (PCBs 118 138 153
and 180) in maternal plasma human milk (lipid-basis) and cord plasma were highly significant within
one biological sample (071ndash098) as well as between different biological samples However the
correlation between other PCB congeners in human milk varied considerably The study by Greizerstein
et al (1999) was small and collection of blood and milk samples was not uniform for all subjects
Therefore more data are needed to establish whether equivalency factors can be established between
various measures of body burden so as to allow normalization of measurements between different studies
Biomarkers of effects of exposure to PCBs are detailed Chapter 3 (Section 381) No single effect or
combination of effects that could be used specifically as an indicator of exposure to PCBs are being
developed to screen large numbers of food samples for PCBs and related compounds (JK Huwe et al of
Agricultural Research Service Fargo North Dakota) New screening methods for trace detection of
PCBs in the environment and feeds are being developed by M Franek et al (Ministerstvo Zemedelstvi
Czech Republic) Development and application of semipermeable membrane devices (SPMDs) as
environmental dosimeters for PCB contaminants in water air sediment and soil is the subject of ongoing
PCBs 613
7 ANALYTICAL METHODS
research by Huckins and Petty at Columbia Environmental Research Center in Missouri Also at the
Columbia Environmental Research Center C Orazio et al are developing analytical methods for
determining PCBs in environmental matrices A reliable method for continuous monitoring of PCBs in
incinerator stack gas emissions using resonance-enhanced multiphoton ionization spectroscopy in
conjunction with time-of-flight mass spectroscopy (REMPITOFMS) is the topic of current research by
TA Cool at Cornell University No additional information or ongoing studies regarding analytical
methods for determining PCBs in environmental and biological samples resulting from exposure were
located Accordingly new and improved analytical methods for trace detection of PCBs that could be
used specifically as indicators of exposure in environmental and biological samples to PCBs are needed
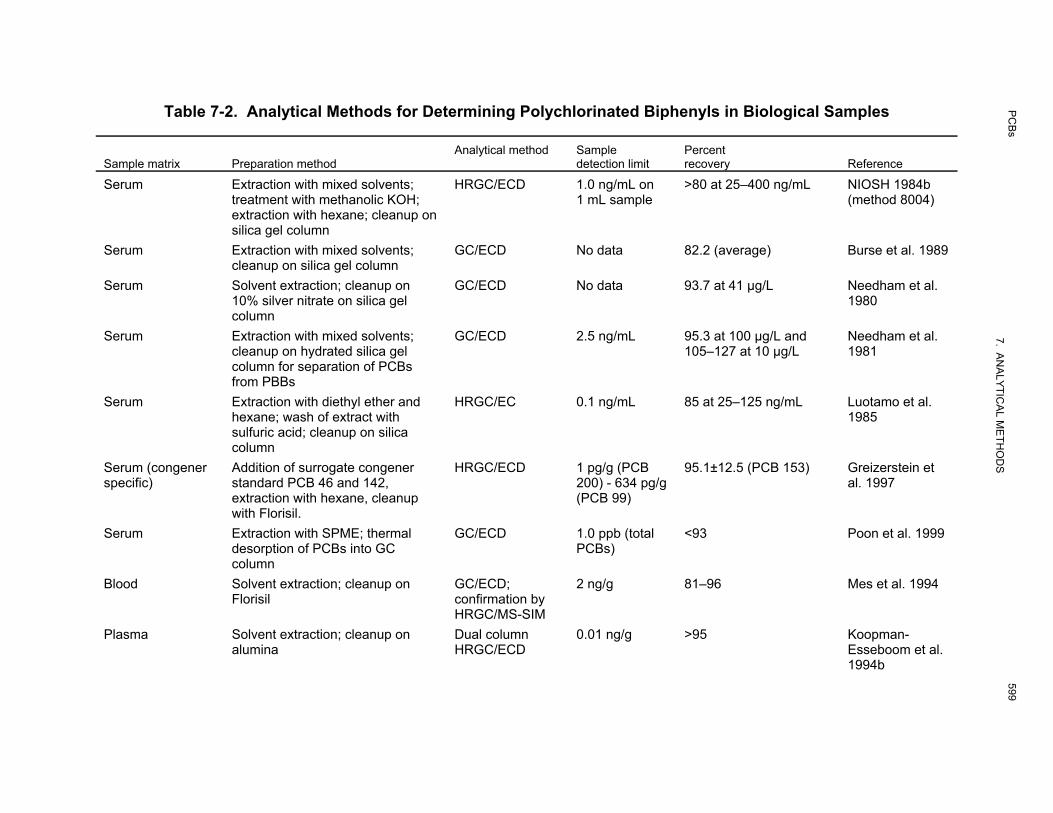
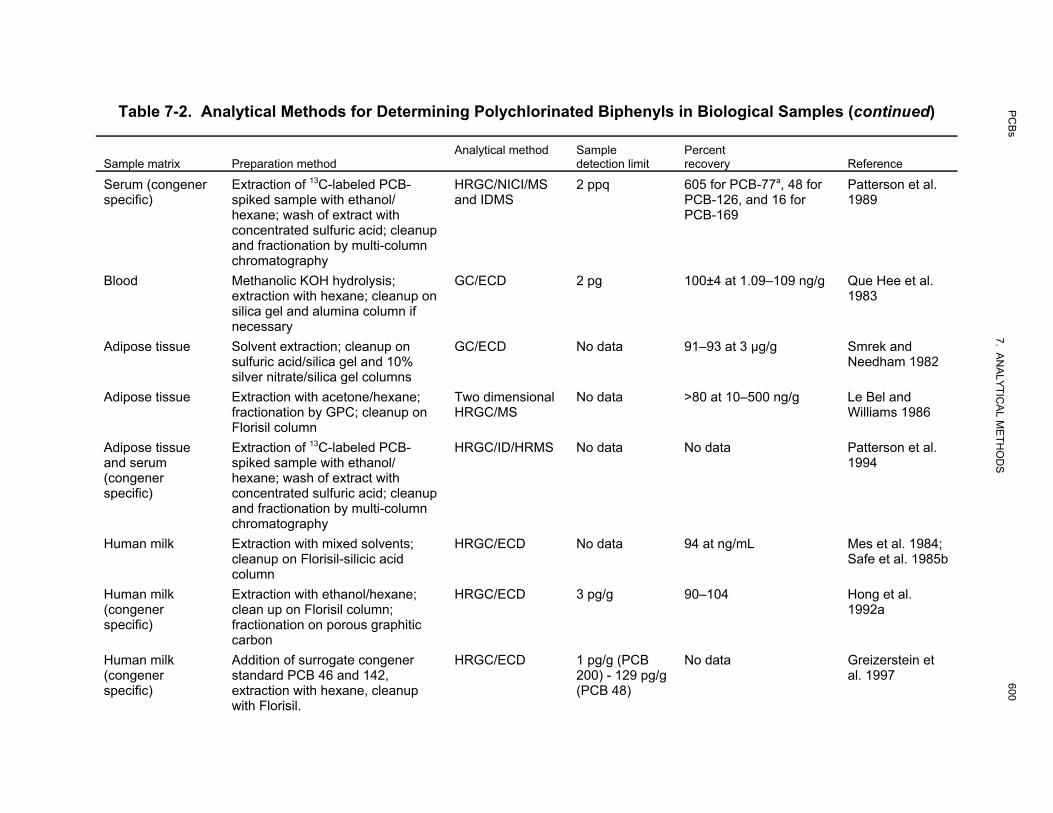
Table 7-2 Analytical Methods for Determining Polychlorinated Biphenyls in Biological Samples (continued)
Analytical method Sample Percent Sample matrix Preparation method detection limit recovery Reference
Serum (congener Extraction of 13C-labeled PCBshy HRGCNICIMS 2 ppq 605 for PCB-77a 48 for Patterson et al specific) spiked sample with ethanol and IDMS PCB-126 and 16 for 1989
hexane wash of extract with PCB-169 concentrated sulfuric acid cleanup and fractionation by multi-column chromatography
Blood Methanolic KOH hydrolysis GCECD 2 pg 100plusmn4 at 109ndash109 ngg Que Hee et al extraction with hexane cleanup on 1983 silica gel and alumina column if necessary
Adipose tissue Solvent extraction cleanup on GCECD No data 91ndash93 at 3 microgg Smrek and sulfuric acidsilica gel and 10 Needham 1982 silver nitratesilica gel columns
Adipose tissue Extraction with acetonehexane Two dimensional No data gt80 at 10ndash500 ngg Le Bel and fractionation by GPC cleanup on HRGCMS Williams 1986 Florisil column
Adipose tissue Extraction of 13C-labeled PCBshy HRGCIDHRMS No data No data Patterson et al and serum spiked sample with ethanol 1994 (congener hexane wash of extract with specific) concentrated sulfuric acid cleanup
and fractionation by multi-column chromatography
Human milk Extraction with mixed solvents HRGCECD No data 94 at ngmL Mes et al 1984 cleanup on Florisil-silicic acid Safe et al 1985b column
Human milk Extraction with ethanolhexane HRGCECD 3 pgg 90ndash104 Hong et al (congener clean up on Florisil column 1992a specific) fractionation on porous graphitic
carbon Human milk Addition of surrogate congener HRGCECD 1 pgg (PCB No data Greizerstein et (congener standard PCB 46 and 142 200) - 129 pgg al 1997 specific) extraction with hexane cleanup (PCB 48)
with Florisil
PCBs
600 7 AN
ALYTICAL M
ETHO
DS
Table 7-2 Analytical Methods for Determining Polychlorinated Biphenyls in Biological Samples (continued)
Sample matrix Preparation method Analytical method Sample
detection limit Percent recovery Reference
Human milk Fat separation cleanup on adsorption columns
HRGCECD 04 ngg fat No data Abraham et al 1994
Human hair (congener specific)
Ultrasonic extraction with acetonehexane wash of extract with concentrated sulfuric acid and alkaline hydrolysis cleanup on Florisil column fractionation on carbon column
HRGCECD No data No data Zupancic-Kralj et al 1992
Liver kidney brain tissue (Rhesus monkeys)
Homogenization solvent extraction cleanup on Florisil
GCECD 12ndash33 ngg 78ndash100 (corn oil) Mes et al 1995a 1995b
Tissue (congener specific)
Homogenized extracted in methylen chloridehexane (11) using Soxhlet extractor cleanup using sulfuric acid and chromatography
HRGCHRMS See Table 7-1 No data EPA 1999k (method 1668)
aThe high recovery for PCB 77 was due to interference from other congeners The low recovery for PCB 126 and PCB-169 is not critical since IDMS makes correction for recovery unnecessary
ECD = electron capture detector GC = gas chromatography GPC = gel permeation chromatography HRGC = high resolution gas chromatography HRMS=high resolution mass spectroscopy IDHRMS = isotope dilution high resolution mass spectrometry IDMS = isotope dilution mass spectrometry KOH = potassium hydroxide MS = mass spectrometry MS-SIM = mass spectrometer-selected-ion-monitoring NICIMS = negative ion chemical ionization mass spectrometry PBBs = polybrominated biphenyls PCBs = polychlorinated biphenyls
PCBs
601 7 AN
ALYTICAL M
ETHO
DS
PCBs 602
7 ANALYTICAL METHODS
relatively low fat content Analysis of breast milk does not present this difficulty While analytical
techniques have improved enormously in recent years the low concentration of fat in cord blood may still
present difficulties in achieving accurate and reliable PCB levels
Methods for determining PCBs in adipose tissue are similar to those for blood Solvent extraction is used
to separate the PCBs along with other soluble organics from the tissue The PCBs are then separated
from the lipids usually by column chromatographic techniques Most procedures include a step for
determining the percent fat since results are often reported on a percent fat basis Very little performance
data are available for PCBs in adipose tissue Detection limits of 51ndash144 ngg have been reported for
adipose tissue from Rhesus monkeys (Mes et al 1994 1995b)
A congener-specific analysis of a commercial PCB preparation and the PCB composition of a human milk
sample were reported originally by Safe et al (1985b) Recent studies have demonstrated the analysis of
non-ortho coplanar and mono-ortho coplanar PCBs in breast milk (Dewailly et al 1991) and coplanar
PCBs in serum and adipose tissue (Patterson et al 1994) Determination of these congeners (PCBs 77
126 169) is useful in assessing the toxic potential of breast milk for infants
Recently supercritical fluid extraction (SFE) has been utilized for extraction and cleanup of biological
samples The procedure is quick and avoids the use of flammable or toxic organic solvents (Anitescu and
Tavlarides 1998 Djordjevic et al 1994) Packed-column GC techniques are still widely used however
HRGC has made it possible to achieve better separation of PCB congeners for quantitation (Ballschmiter
and Zell 1980 Mullin et al 1984)
The congeners to be determined in samples may be selected on the basis of their abundance in the
samples their toxicity or the availability of analytical standards The coplanar non-ortho-substituted
congeners are PCB-77 PCB-126 and PCB-169 The mono-ortho-substituted congeners PCB-28
PCB-74 PCB-105 PCB-118 and PCB-156 are also frequently determined along with the non-ortho shy
substituted PCB congeners PCBs 138 153 and 180 are frequently measured in higher amounts than
other congeners (Safe 1993 Schecter et al 1994) and are often included in sets of congeners for
quantitation
Variables in sampling methods greatly influence results For example PCB levels in milk fat may
decrease during lactation with maternal age and weight and with number of children born (Jensen 1987)
It has been shown by Lawton et al (1985b) that random error inter-laboratory variations in procedure
PCBs 603
7 ANALYTICAL METHODS
and methods used for reporting data may have considerable impact on the reported PCB levels in human
tissues Caution should be exercised when comparing exposure estimates or health effect studies reported
by different investigators unless similar analysis methodologies are employed Also without the
separation and quantitation of individual PCB congeners during analysis PCB concentrations can not be
directly correlated to toxic equivalency Currently EPA Method 1668 (Revision A) is a standard method
for analysis of individual PCB congeners in biological tissues (EPA 1999k)
72 ENVIRONMENTAL SAMPLES
An overview of PCB analysis including sampling technique extraction cleanup procedures and
quantification is reported in EPA Method 1668 (Revision A EPA 1999k) A summary of representative
methods is shown in Table 7-3 The table includes methods that have been standardized by NIOSH
EPA American Society for Testing and Materials (ASTM) AOAC and Food and Drug Administration
(FDA) Most of these methods were developed for the determination of Aroclors (noncongener-specific
PCBs) in environmental samples
Air samples are usually collected by pumping air through a sampler containing a glass fiber filter and
adsorbent trap to separate the particle bound and vapor phase fractions Adsorbents used most often
include Florisil (Lin and Que Hee 1985 1987 NIOSH 1984a) XAD-2 (EPA 1988b Hippelein et al
1993) and polyurethane foam (PUF) (Bremle and Larsson 1998 EPA 1988b) Florisil traps are solvent
desorbed (Lin and Que Hee 1985 1987 NIOSH 1984a) and XAD-2 traps are Soxhlet extracted (Bremle
and Larsson 1998 EPA 1988b Hippelein et al 1993) PCBs are determined by GCECD (Bremle and
Larsson 1998 EPA 1988b Irvine and Loganathan 1998 Lin and Que Hee 1985 1987 NIOSH 1984a) or
HRGCMS (Hippelein et al 1993) Detection limits depend upon the volume of air sampled however
detection limits in the low ngm3 (EPA 1988b) to low pgm3 (Hippelein et al 1993) have been reported
Recovery where reported is good (gt80) (Bremle and Larsson 1998 Brownlow and Que Hee 1985
EPA 1988b Irvine and Loganathan 1998 Lee et al 1996 Lin and Que Hee 1985 1987)
EPA Method 1668 (Revision A ) is the current methodology used to measure specific toxic dioxin-like
PCB congeners in surface ground and drinking water by HRGCHRMS (EPA 1999k) Drinking water
samples are typically extracted with solvent prior to analysis by GCECD HRGCECD and
HRGCHRMS (EPA 1989c 1999k) Detection limits are in the sub-ppb range and recovery is good
(gt80) (EPA 1989c) Preconcentration techniques may be used for extraction of large water volumes
thus lowering the method detection limit (Leister and Baker 1994 Swackhamer and Armstrong 1987)
Table 7-3 Analytical Methods for Determining Polychlorinated Biphenyls in Environmental Samples
Sample detection Percent Sample matrix Preparation method Analytical method limit recovery Reference Air (occupational) Adsorption on glass fiber filter and Florisil GCECD 00006 mgm3 for No data NIOSH 1984a
hexane desorption 50 L sample (method 5503) Air Adsorption on water-deactivated Florisil
hexane desorption perchlorination GCECD No data 84ndash103 at
4ndash49 microgm3 Lin and Que Hee 1985 1987
Air Adsorption on Florisil or Chromosorb 102 or GCECD 10 microgm3 for gt80 at 300 microgm3 Brownlow and Tenax GC or XAD-2 hexane desorption 4 L sample Que Hee 1985
Ambient Air Sample collection on glass fiber filter and GCECD gt1 ngm3 36ndash94 EPA 1988b (method PUF cartridge Soxhlet extraction alumina TO-4) column cleanup
Ambient air Sample collection on glass fiber filter and HRGCMS low pgm3 No data Hippelein et al 1993 (target XAD-2 trap Soxhlet extraction adsorption (calculated) congeners) column cleanup and fractionation Water (congener Extracted using SPE SFE CLLE cleanup HRGCHRMS See Table 7-1 No data EPA 1999k (method specific) using sulfuric acid and chromatography 1668) Drinking water Extraction with hexane HRGCECD 008ndash015 microgL 84ndash97 (tap water) EPA 1989c (method
505) Finished drinking Extraction with methylene chloride solvent GCECD or No data No data EPA 1989c (method water and exchange to methyl tert-butyl ether HRGCECD 508) groundwater Drinking water Extraction with methylene chloride solvent GCECD or 014ndash023 microgL 82ndash136 ngg EPA 1989c (method (screening) exchange to chloroform perchlorination to HRGCECD 508A)
decachlorobiphenyl Drinking water Extraction on SPE cartridges or disks HRGCMS 0045ndash024 microgL 65ndash100 EPA 1987f (method
elution with methylene chloride 525) Drinking water Sample spiked with 13C-labeled PCBs HRGCHRMS 002ndash004 pgL No data Miyata et al 1993 (congener solvent extraction of sample (filtered water specific) and particles) cleanup and fractionation by
adsorption chromatography
PCBs
604 7 AN
ALYTICAL M
ETHO
DS
Table 7-3 Analytical Methods for Determining Polychlorinated Biphenyls in Environmental Samples (continued)
Sample detection Percent Sample matrix Preparation method Analytical method limit recovery Reference Rain water Passage through filter and XAD-2 resin 2-dimensional lt1ndash30 pgL 79ndash83 Leister and Baker (congener solvent extraction cleanup on Florisil HRGCECD 1994 specific) column Waste water Extraction with methylene chloride GCECD 0065 microgL 88ndash96 at EPA 1982a 1988b
exchange to hexane cleanup on Florisil (PCB-1242) 25ndash110 microgL (method 608) column removal of elemental sulfur if necessary
Waste water Extraction with methylene chloride GCMS 30ndash36 microgL 77ndash80 at EPA 1982a (method (PCB-1221 1254) 5ndash2400 microgL 625)
Lake water Passage through glass fiber filter and HRGCECD No data 93 Swackhamer and XAD-2 Soxhlet extraction cleanup on Armstrong 1987 alumina and silica gel column
Sea water Collection of particulate and filtered water in HRGCECD 01ndash30 ngL 67ndash106 Kelly et al 1993 (congener a pressurized extraction-filtration system specific) cleanup with sodium hydroxide alumina
and silica column Soil sediments Extraction with hexaneacetone cleanup on GCECD lt1 microgg No data EPA 1994f (method and other solid Florisil column desulfurization if necessary 8080A)c
sample matrices Soil sediments Filtered and homogenized extracted using HRGCHRMS See Table 7-1 No data EPA 1999k (method and other solid SoxhletDean-Stark extractor cleanup 1668) sample matrices using sulfuric acid and chromatography (congener specific) Solid wastes Soxhlet extraction sulfuric acidpotassium HRGDECD 57ndash70 microgkg (soil) 62ndash125 (multiple EPA 1995c (Method (Aroclors or permanganate cleanup confirmation on lab) 8082)c
congeners) second column Hazardous Extraction with hexaneacetone cleanup on HRGCECD 60ndash70 microgkg 104ndash107 (for soil) Lopez-Avila et al wastes silica gel column desulfurization by copper 1988
or mercury if necessary
PCBs
605 7 AN
ALYTICAL M
ETHO
DS
Table 7-3 Analytical Methods for Determining Polychlorinated Biphenyls in Environmental Samples (continued)
Sample detection Percent Sample matrix Preparation method Analytical method limit recovery Reference Soilsediment Extraction with methylene chlorideacetone GCECD 80 microgkg (required No data EPA 1987a (CLP)b
(low level) (11) cleanup by gel permeation and microshy quantitation limit) alumina column
Sediment Ultrasonic extraction with acetonehexane HRGCECD No data 70ndash93 Fuoco et al 1993 (congener sulfur removal cleanup on Florisil specific) fractionation by HPLC Sediment Supercritical fluid extraction mini-Florisil HRGCECD No data 90 Lee and Peart 1994
column cleanup sulfur removal confirmation by MS Railcar paint Extraction with 90 methylene HRGCECD 1 mgkg 74ndash86 Welsh 1995 scrapings chloride10 methanol cleanup on Florisil
column Fly ash Soxhlet extraction optional column cleanup GCECD or GCMS- No data 80ndash100 Kohellipan et al 1994
SIM Fish (congener Extraction of homogenized tissue with HRGCNICIMS 02ndash3 pg 65ndash115 Schmidt and specific) petroleum etherethyl acetate cleanup by Hesselberg 1992
gel permeation chromatography Fish (congener Homogenized extracted in methylene HRGCHRMS See Table 7-1 No Data EPA 1999k (method specific) chloridehexane (11) using Soxhlet 1668)
extractor cleanup using sulfuric acid and chromatography
Fish fish egg Extraction of homogenized 13C-PCB labeled HRGCECD 01ndash073 ngg 62ndash92 Schwartz et al 1993 and bird egg tissues with methylene chloride removal of (lipid) (congener lipid by gel permeation or dialysis cleanup specific) by multi-layer and multiple chromatography
fractionation by HPLC Mammal blubber Sample ground solvent extraction micro- dual column 30 microgkg 952 (mean) Newman et al 1994
Florisil column cleanup HRGCECD Marine animals Microextraction GCECD 1 ng 95 (Aroclor 1254) Wirth et al 1994 Cows milk Mixing of sample fortified with 13C-labeled HRGCMS 01ndash05 pgg (fat) 50ndash60 Van der Velde et al (congener PCBs with sodium oxalate and methanol for tetra- to hexashy 1994 specific) solvent extraction cleanup and congeners of PCB
fractionation by porous carbon and alumina
PCBs
606 7 AN
ALYTICAL M
ETHO
DS
Table 7-3 Analytical Methods for Determining Polychlorinated Biphenyls in Environmental Samples (continued)
Sample matrix Preparation method Analytical method Sample detection limit
Percent recovery Reference
Eggs fish Supercritical fluid extraction combined with Florisil separation
GCECD No data 91ndash95 Alley and Lu 1995
Fatty foods Solvent extraction liquid-liquid partitioning cleanup on Florisil column
GCECD No data No data AOAC 1990
aThis method converts the different congeners to decachlorobiphenyl and cannot differentiate between commercial mixtures (eg Aroclor 1242 1260)bAs required by Contract Laboratory Program cMethod 8080A is proposed for deletion from SW-846 method 8082 is proposed for inclusion in SW-846
CLLE = continuous liquidliquid extraction ECD = electron capture detection GC = gas chromatography HPLC = high performance liquid chromatography HRGC = high resolution gas chromatography HRMS = high resolution mass spectrometry MS = mass spectrometry NICIMS = negative ion chemical ionization mass spectrometry ng = nanogram (10-9 g) pg = picogram (10-12 g) PUF = polyurethane foam SIM = selected ion monitoring SFE= separatory funnel extraction SPE = solid phase extraction
PCBs
607 7 AN
ALYTICAL M
ETHO
DS
PCBs 608
7 ANALYTICAL METHODS
Detection limits in the low pgL range have been reported (Leister and Baker 1994) Some of the
methods are noncongener-specific that is the results are reported as PCB mixtures (Aroclors) (EPA
1982a 1989c) and some are congener-specific (EPA 1987f 1999k Kelly et al 1993 Leister and Baker
1994 Miyata et al 1993) EPA Method 508A which converts all of the PCBs to decachlorobiphenyl is
a screening method for quantifying total PCBs (EPA 1989c) The method is likely to show interference
due to perchlorination of biphenyl or related compounds (EPA 1991b) and the method cannot quantify
individual commercial Aroclors in a PCB mixture Some waters particularly surface and waste waters
may require cleanup on adsorption columns prior to analysis (EPA 1982a 1988b Miyata et al 1993)
SPE media may be used reducing the use of flammable or toxic solvents (EPA 1987f)
Soil sediment and solid waste samples are usually Soxhlet extracted (EPA 1994f 1995c 1999k)
Ultrasonic extraction with various solvent combinations (Fuoco et al 1993) and SFE (Lee and Peart
1994) are utilized as well Recoveries using these methods are comparable to Soxhlet extraction
(80ndash100) Cleanup procedures include sulfur removal (EPA 1994f Fuoco et al 1993 Lee and Peart
1994 Lopez-Avila et al 1988) and separation on adsorbent columns (Bandh et al 1996 EPA 1994f
Fuoco et al 1993 Lee and Peart 1994 Lopez-Avila et al 1988) HRGCECD is used most often for
determination of PCBs (Fuoco et al 1993 Lee and Peart 1994 Lopez-Avila et al 1988) Detection limits
are generally in the ppb range (60ndash80 microgkg) (EPA 1987a 1995c Lopez-Avila et al 1988) Recovery of
62ndash125 of PCBs in clay and soil samples has been reported for a multiple lab study (EPA 1995c)
Methods using the enzyme-linked immunosorbent assay are commercially available for screening PCB
contamination in soils (Baek 1993 EPA 1995d) These methods are inexpensive and have a fast
turnaround time
Methods are available for measuring the concentration of PCBs in fish and animal tissues Tissues are
homogenized and then dried by blending with anhydrous sodium sulfate prior to Soxhlet or column
extraction (EPA 1999k Newman et al 1994) Direct extraction has also been utilized (Schwartz et al
1993) After cleanup PCBs are determined by HRGCECD (Schwartz et al 1993) dual column
HRGCECD (Newman et al 1994) or HRGCMS (Schmidt and Hesselberg 1992) A micro extraction
method for very small sample masses (25 microg) has been developed (Wirth et al 1994) A limit of
detection of 1 ngkg sample and good recovery (95) and precision were reported (Wirth et al 1994)
Few methods are available for the determination of PCBs in foods Little performance data have been
reported as well A method is available for the determination of Aroclors in poultry fat fish and dairy
products (AOAC 1990)
PCBs 609
7 ANALYTICAL METHODS
A number of Standard Reference Materials (SRMs) with certified PCB congener concentrations are
available from the National Institute of Standards and Technology (NIST) these include SRM 1588
PCBs in Cod Liver Oil SRM 1939 PCBs in River Sediment SRM 1941 PCBs in Marine Sediment and
SRM 1974 PCBs in Mussel Tissue (Schantz et al 1993a 1993b) These SRMs are useful in validating
the accuracy of methods for the determination of PCBs and for verifying that the method remains within
acceptable levels of error in during analysis A summary of available SRMs with certified PCB
concentrations is shown in Table 7-4 SRMs with non-certified concentration data for PCBs are included
in the table as well
73 ADEQUACY OF THE DATABASE
Section 104(i)(5) of CERCLA as amended directs the Administrator of ATSDR (in consultation with the
Administrator of EPA and agencies and programs of the Public Health Service) to assess whether
adequate information on the health effects of PCBs is available Where adequate information is not
available ATSDR in conjunction with the National Toxicology Program (NTP) is required to assure the
initiation of a program of research designed to determine the health effects (and techniques for developing
methods to determine such health effects) of PCBs
The following categories of possible data needs have been identified by a joint team of scientists from
ATSDR NTP and EPA They are defined as substance-specific informational needs that if met would
reduce the uncertainties of human health assessment This definition should not be interpreted to mean
that all data needs discussed in this section must be filled In the future the identified data needs will be
evaluated and prioritized and a substance-specific research agenda will be proposed
731 Identification of Data Needs
Methods for Determining Biomarkers of Exposure and Effect Several investigators have
used whole blood serum breast milk and hair as biomarkers for environmental exposure to PCBs
(Brown and Lawton 1984 Fait et al 1989 Furst et al 1994 Luotamo 1988 Safe et al 1985b Zupancic-
Kralj et al 1992) Consequently levels of PCBs in these media can provide estimates of exposure to
PCBs Analytical methods of satisfactory accuracy are available for determining congener- and
noncongener-specific PCBs in blood serum breast milk and human hair these methods are shown in
Table 7-2 Some methods for determining biomarkers are shown in Table 7-5 The method developed by
several investigators can be used for the determination of the three non-ortho substituted PCB congeners
Table 7-4 NIST Standard Reference Materials for the Determination of Polychlorinated Biphenyls (PCBs)a
SRM Description PCBs certified PCBs quantified
1589 PCBs (as Aroclor 1260) in human serum 1b
1588 Organics in cod liver oil Surrogate for a tissue extract with high lipid 4 43 content
1649 Urban dustorganics Air particulate material 10
1939 PCB congeners in river sediment Sediment with high levels of PCB congeners 3 17
1941a Organics in marine sediment Collected in Baltimore Harbor 15
1974 Organics in mussel tissue Frozen powder-like homogenate 13
1945 Whale blubber Frozen blubber homogenate 26
aSource Schantz et al 1993a bcertified as Aroclor 1260
NIST = National Institute of Standards and Technology
PCBs
610 7 AN
ALYTICAL M
ETHO
DS
Table 7-5 Analytical Methods for Determining Biomarkers for Polychlorinated Biphenyls
Analytical Sample detection Percent
Sample matrix Preparation method method limit recovery Reference Liver and adipose Homogenization extraction with HRGCECNIMS No data No data Buser et al 1992 tissue of gray seal methylene chloridecyclohexane (methyl sulfone removal of lipids by dialysis metabolite) cleanup by gel permeation
chromatography fractionation on carbon and Florisil columns
Serum (major Solvent extraction methylation HRGCECD and No data low nmolmL Morse et al 1995 metabolites of partition with H2SO4 HRGCMS PCB-77)
ECD = electron capture detection ECNI = electron capture negative ionization HRGC = high resolution gas chromatography MS = mass spectrometry
PCBs
611 7 AN
ALYTICAL M
ETHO
DS
PCBs 612
7 ANALYTICAL METHODS
(77 126 and 169) in human milk adipose tissue and serum at levels normally found in these tissues of
control population (Harrad et al 1992 Hong et al 1992a Patterson et al 1989 1994)
While blood serum breast milk adipose tissue and hair have been used as biomarkers of exposure the
possible equivalency of these biomarkers has not been intensively investigated At least two of these
biomarkers serum and breast milk did not appear to give equivalent measures of exposure even when
expressed on a lipid basis (The theory of equivalency is based on the assumption that the steady state
concentration of a persistent lipophilic substance in different body compartments is the same when
expressed on a lipid basis) Greizerstein et al (1999) compared levels of PCB congeners between serum
and milk from seven women in the New York Angler Study The congener profiles for serum and milk
samples were similar for each individual but different among all subjects The sum of the congener
concentrations was used to estimate the total PCB concentration The ratio of serum to milk
concentrations in the women ranged from 018 to 166 with a mean of 065plusmn049 showing no consistency
among individuals Considerable differences were also found in the lipid-adjusted concentrations of
PCBs among individuals The range of lipid-adjusted serum-to-milk ratios was 11ndash28 with a mean of
19plusmn05 The lipid-adjusted serum levels were also gt1 for the most abundant congeners PCBs 118 153
138 and 180 The lipid-adjusted ratios of these four non-planar congeners in serum and milk were
similar to those found by Koopman-Esseboom et al (1994b) in a study involving 418 mother-infant pairs
This latter study found that correlation coefficients between PCB congener levels (PCBs 118 138 153
and 180) in maternal plasma human milk (lipid-basis) and cord plasma were highly significant within
one biological sample (071ndash098) as well as between different biological samples However the
correlation between other PCB congeners in human milk varied considerably The study by Greizerstein
et al (1999) was small and collection of blood and milk samples was not uniform for all subjects
Therefore more data are needed to establish whether equivalency factors can be established between
various measures of body burden so as to allow normalization of measurements between different studies
Biomarkers of effects of exposure to PCBs are detailed Chapter 3 (Section 381) No single effect or
combination of effects that could be used specifically as an indicator of exposure to PCBs are being
developed to screen large numbers of food samples for PCBs and related compounds (JK Huwe et al of
Agricultural Research Service Fargo North Dakota) New screening methods for trace detection of
PCBs in the environment and feeds are being developed by M Franek et al (Ministerstvo Zemedelstvi
Czech Republic) Development and application of semipermeable membrane devices (SPMDs) as
environmental dosimeters for PCB contaminants in water air sediment and soil is the subject of ongoing
PCBs 613
7 ANALYTICAL METHODS
research by Huckins and Petty at Columbia Environmental Research Center in Missouri Also at the
Columbia Environmental Research Center C Orazio et al are developing analytical methods for
determining PCBs in environmental matrices A reliable method for continuous monitoring of PCBs in
incinerator stack gas emissions using resonance-enhanced multiphoton ionization spectroscopy in
conjunction with time-of-flight mass spectroscopy (REMPITOFMS) is the topic of current research by
TA Cool at Cornell University No additional information or ongoing studies regarding analytical
methods for determining PCBs in environmental and biological samples resulting from exposure were
located Accordingly new and improved analytical methods for trace detection of PCBs that could be
used specifically as indicators of exposure in environmental and biological samples to PCBs are needed
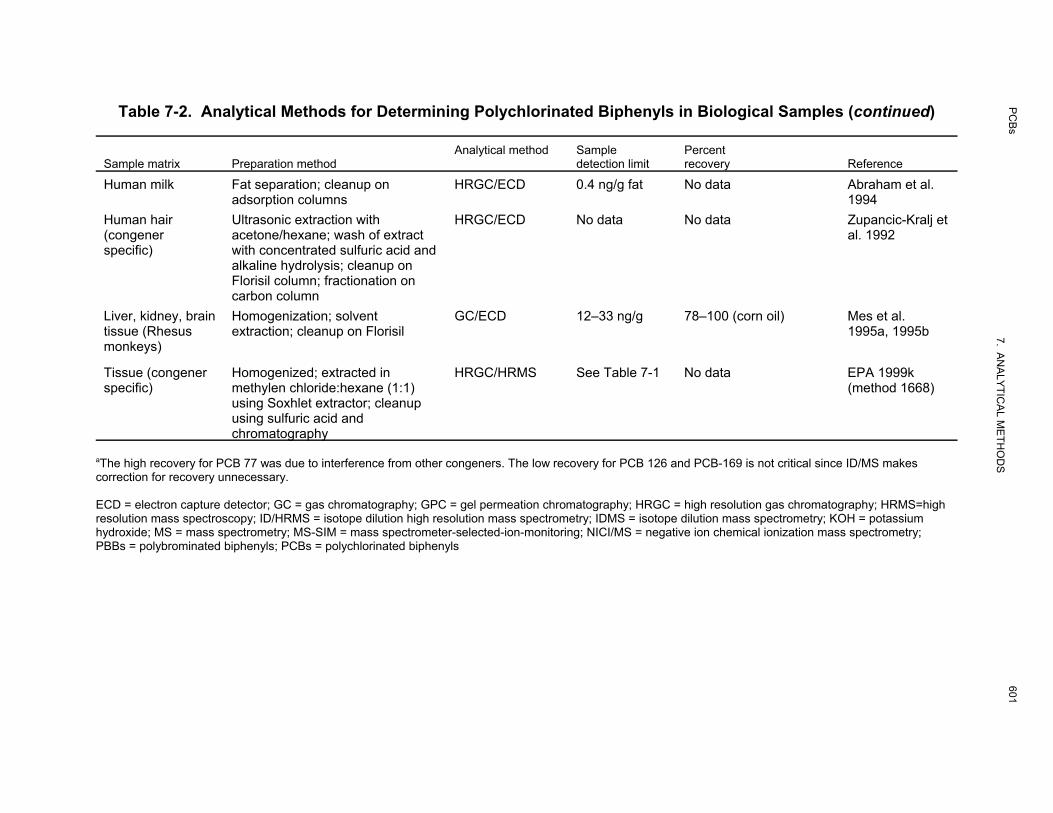
Table 7-2 Analytical Methods for Determining Polychlorinated Biphenyls in Biological Samples (continued)
Sample matrix Preparation method Analytical method Sample
detection limit Percent recovery Reference
Human milk Fat separation cleanup on adsorption columns
HRGCECD 04 ngg fat No data Abraham et al 1994
Human hair (congener specific)
Ultrasonic extraction with acetonehexane wash of extract with concentrated sulfuric acid and alkaline hydrolysis cleanup on Florisil column fractionation on carbon column
HRGCECD No data No data Zupancic-Kralj et al 1992
Liver kidney brain tissue (Rhesus monkeys)
Homogenization solvent extraction cleanup on Florisil
GCECD 12ndash33 ngg 78ndash100 (corn oil) Mes et al 1995a 1995b
Tissue (congener specific)
Homogenized extracted in methylen chloridehexane (11) using Soxhlet extractor cleanup using sulfuric acid and chromatography
HRGCHRMS See Table 7-1 No data EPA 1999k (method 1668)
aThe high recovery for PCB 77 was due to interference from other congeners The low recovery for PCB 126 and PCB-169 is not critical since IDMS makes correction for recovery unnecessary
ECD = electron capture detector GC = gas chromatography GPC = gel permeation chromatography HRGC = high resolution gas chromatography HRMS=high resolution mass spectroscopy IDHRMS = isotope dilution high resolution mass spectrometry IDMS = isotope dilution mass spectrometry KOH = potassium hydroxide MS = mass spectrometry MS-SIM = mass spectrometer-selected-ion-monitoring NICIMS = negative ion chemical ionization mass spectrometry PBBs = polybrominated biphenyls PCBs = polychlorinated biphenyls
PCBs
601 7 AN
ALYTICAL M
ETHO
DS
PCBs 602
7 ANALYTICAL METHODS
relatively low fat content Analysis of breast milk does not present this difficulty While analytical
techniques have improved enormously in recent years the low concentration of fat in cord blood may still
present difficulties in achieving accurate and reliable PCB levels
Methods for determining PCBs in adipose tissue are similar to those for blood Solvent extraction is used
to separate the PCBs along with other soluble organics from the tissue The PCBs are then separated
from the lipids usually by column chromatographic techniques Most procedures include a step for
determining the percent fat since results are often reported on a percent fat basis Very little performance
data are available for PCBs in adipose tissue Detection limits of 51ndash144 ngg have been reported for
adipose tissue from Rhesus monkeys (Mes et al 1994 1995b)
A congener-specific analysis of a commercial PCB preparation and the PCB composition of a human milk
sample were reported originally by Safe et al (1985b) Recent studies have demonstrated the analysis of
non-ortho coplanar and mono-ortho coplanar PCBs in breast milk (Dewailly et al 1991) and coplanar
PCBs in serum and adipose tissue (Patterson et al 1994) Determination of these congeners (PCBs 77
126 169) is useful in assessing the toxic potential of breast milk for infants
Recently supercritical fluid extraction (SFE) has been utilized for extraction and cleanup of biological
samples The procedure is quick and avoids the use of flammable or toxic organic solvents (Anitescu and
Tavlarides 1998 Djordjevic et al 1994) Packed-column GC techniques are still widely used however
HRGC has made it possible to achieve better separation of PCB congeners for quantitation (Ballschmiter
and Zell 1980 Mullin et al 1984)
The congeners to be determined in samples may be selected on the basis of their abundance in the
samples their toxicity or the availability of analytical standards The coplanar non-ortho-substituted
congeners are PCB-77 PCB-126 and PCB-169 The mono-ortho-substituted congeners PCB-28
PCB-74 PCB-105 PCB-118 and PCB-156 are also frequently determined along with the non-ortho shy
substituted PCB congeners PCBs 138 153 and 180 are frequently measured in higher amounts than
other congeners (Safe 1993 Schecter et al 1994) and are often included in sets of congeners for
quantitation
Variables in sampling methods greatly influence results For example PCB levels in milk fat may
decrease during lactation with maternal age and weight and with number of children born (Jensen 1987)
It has been shown by Lawton et al (1985b) that random error inter-laboratory variations in procedure
PCBs 603
7 ANALYTICAL METHODS
and methods used for reporting data may have considerable impact on the reported PCB levels in human
tissues Caution should be exercised when comparing exposure estimates or health effect studies reported
by different investigators unless similar analysis methodologies are employed Also without the
separation and quantitation of individual PCB congeners during analysis PCB concentrations can not be
directly correlated to toxic equivalency Currently EPA Method 1668 (Revision A) is a standard method
for analysis of individual PCB congeners in biological tissues (EPA 1999k)
72 ENVIRONMENTAL SAMPLES
An overview of PCB analysis including sampling technique extraction cleanup procedures and
quantification is reported in EPA Method 1668 (Revision A EPA 1999k) A summary of representative
methods is shown in Table 7-3 The table includes methods that have been standardized by NIOSH
EPA American Society for Testing and Materials (ASTM) AOAC and Food and Drug Administration
(FDA) Most of these methods were developed for the determination of Aroclors (noncongener-specific
PCBs) in environmental samples
Air samples are usually collected by pumping air through a sampler containing a glass fiber filter and
adsorbent trap to separate the particle bound and vapor phase fractions Adsorbents used most often
include Florisil (Lin and Que Hee 1985 1987 NIOSH 1984a) XAD-2 (EPA 1988b Hippelein et al
1993) and polyurethane foam (PUF) (Bremle and Larsson 1998 EPA 1988b) Florisil traps are solvent
desorbed (Lin and Que Hee 1985 1987 NIOSH 1984a) and XAD-2 traps are Soxhlet extracted (Bremle
and Larsson 1998 EPA 1988b Hippelein et al 1993) PCBs are determined by GCECD (Bremle and
Larsson 1998 EPA 1988b Irvine and Loganathan 1998 Lin and Que Hee 1985 1987 NIOSH 1984a) or
HRGCMS (Hippelein et al 1993) Detection limits depend upon the volume of air sampled however
detection limits in the low ngm3 (EPA 1988b) to low pgm3 (Hippelein et al 1993) have been reported
Recovery where reported is good (gt80) (Bremle and Larsson 1998 Brownlow and Que Hee 1985
EPA 1988b Irvine and Loganathan 1998 Lee et al 1996 Lin and Que Hee 1985 1987)
EPA Method 1668 (Revision A ) is the current methodology used to measure specific toxic dioxin-like
PCB congeners in surface ground and drinking water by HRGCHRMS (EPA 1999k) Drinking water
samples are typically extracted with solvent prior to analysis by GCECD HRGCECD and
HRGCHRMS (EPA 1989c 1999k) Detection limits are in the sub-ppb range and recovery is good
(gt80) (EPA 1989c) Preconcentration techniques may be used for extraction of large water volumes
thus lowering the method detection limit (Leister and Baker 1994 Swackhamer and Armstrong 1987)
Table 7-3 Analytical Methods for Determining Polychlorinated Biphenyls in Environmental Samples
Sample detection Percent Sample matrix Preparation method Analytical method limit recovery Reference Air (occupational) Adsorption on glass fiber filter and Florisil GCECD 00006 mgm3 for No data NIOSH 1984a
hexane desorption 50 L sample (method 5503) Air Adsorption on water-deactivated Florisil
hexane desorption perchlorination GCECD No data 84ndash103 at
4ndash49 microgm3 Lin and Que Hee 1985 1987
Air Adsorption on Florisil or Chromosorb 102 or GCECD 10 microgm3 for gt80 at 300 microgm3 Brownlow and Tenax GC or XAD-2 hexane desorption 4 L sample Que Hee 1985
Ambient Air Sample collection on glass fiber filter and GCECD gt1 ngm3 36ndash94 EPA 1988b (method PUF cartridge Soxhlet extraction alumina TO-4) column cleanup
Ambient air Sample collection on glass fiber filter and HRGCMS low pgm3 No data Hippelein et al 1993 (target XAD-2 trap Soxhlet extraction adsorption (calculated) congeners) column cleanup and fractionation Water (congener Extracted using SPE SFE CLLE cleanup HRGCHRMS See Table 7-1 No data EPA 1999k (method specific) using sulfuric acid and chromatography 1668) Drinking water Extraction with hexane HRGCECD 008ndash015 microgL 84ndash97 (tap water) EPA 1989c (method
505) Finished drinking Extraction with methylene chloride solvent GCECD or No data No data EPA 1989c (method water and exchange to methyl tert-butyl ether HRGCECD 508) groundwater Drinking water Extraction with methylene chloride solvent GCECD or 014ndash023 microgL 82ndash136 ngg EPA 1989c (method (screening) exchange to chloroform perchlorination to HRGCECD 508A)
decachlorobiphenyl Drinking water Extraction on SPE cartridges or disks HRGCMS 0045ndash024 microgL 65ndash100 EPA 1987f (method
elution with methylene chloride 525) Drinking water Sample spiked with 13C-labeled PCBs HRGCHRMS 002ndash004 pgL No data Miyata et al 1993 (congener solvent extraction of sample (filtered water specific) and particles) cleanup and fractionation by
adsorption chromatography
PCBs
604 7 AN
ALYTICAL M
ETHO
DS
Table 7-3 Analytical Methods for Determining Polychlorinated Biphenyls in Environmental Samples (continued)
Sample detection Percent Sample matrix Preparation method Analytical method limit recovery Reference Rain water Passage through filter and XAD-2 resin 2-dimensional lt1ndash30 pgL 79ndash83 Leister and Baker (congener solvent extraction cleanup on Florisil HRGCECD 1994 specific) column Waste water Extraction with methylene chloride GCECD 0065 microgL 88ndash96 at EPA 1982a 1988b
exchange to hexane cleanup on Florisil (PCB-1242) 25ndash110 microgL (method 608) column removal of elemental sulfur if necessary
Waste water Extraction with methylene chloride GCMS 30ndash36 microgL 77ndash80 at EPA 1982a (method (PCB-1221 1254) 5ndash2400 microgL 625)
Lake water Passage through glass fiber filter and HRGCECD No data 93 Swackhamer and XAD-2 Soxhlet extraction cleanup on Armstrong 1987 alumina and silica gel column
Sea water Collection of particulate and filtered water in HRGCECD 01ndash30 ngL 67ndash106 Kelly et al 1993 (congener a pressurized extraction-filtration system specific) cleanup with sodium hydroxide alumina
and silica column Soil sediments Extraction with hexaneacetone cleanup on GCECD lt1 microgg No data EPA 1994f (method and other solid Florisil column desulfurization if necessary 8080A)c
sample matrices Soil sediments Filtered and homogenized extracted using HRGCHRMS See Table 7-1 No data EPA 1999k (method and other solid SoxhletDean-Stark extractor cleanup 1668) sample matrices using sulfuric acid and chromatography (congener specific) Solid wastes Soxhlet extraction sulfuric acidpotassium HRGDECD 57ndash70 microgkg (soil) 62ndash125 (multiple EPA 1995c (Method (Aroclors or permanganate cleanup confirmation on lab) 8082)c
congeners) second column Hazardous Extraction with hexaneacetone cleanup on HRGCECD 60ndash70 microgkg 104ndash107 (for soil) Lopez-Avila et al wastes silica gel column desulfurization by copper 1988
or mercury if necessary
PCBs
605 7 AN
ALYTICAL M
ETHO
DS
Table 7-3 Analytical Methods for Determining Polychlorinated Biphenyls in Environmental Samples (continued)
Sample detection Percent Sample matrix Preparation method Analytical method limit recovery Reference Soilsediment Extraction with methylene chlorideacetone GCECD 80 microgkg (required No data EPA 1987a (CLP)b
(low level) (11) cleanup by gel permeation and microshy quantitation limit) alumina column
Sediment Ultrasonic extraction with acetonehexane HRGCECD No data 70ndash93 Fuoco et al 1993 (congener sulfur removal cleanup on Florisil specific) fractionation by HPLC Sediment Supercritical fluid extraction mini-Florisil HRGCECD No data 90 Lee and Peart 1994
column cleanup sulfur removal confirmation by MS Railcar paint Extraction with 90 methylene HRGCECD 1 mgkg 74ndash86 Welsh 1995 scrapings chloride10 methanol cleanup on Florisil
column Fly ash Soxhlet extraction optional column cleanup GCECD or GCMS- No data 80ndash100 Kohellipan et al 1994
SIM Fish (congener Extraction of homogenized tissue with HRGCNICIMS 02ndash3 pg 65ndash115 Schmidt and specific) petroleum etherethyl acetate cleanup by Hesselberg 1992
gel permeation chromatography Fish (congener Homogenized extracted in methylene HRGCHRMS See Table 7-1 No Data EPA 1999k (method specific) chloridehexane (11) using Soxhlet 1668)
extractor cleanup using sulfuric acid and chromatography
Fish fish egg Extraction of homogenized 13C-PCB labeled HRGCECD 01ndash073 ngg 62ndash92 Schwartz et al 1993 and bird egg tissues with methylene chloride removal of (lipid) (congener lipid by gel permeation or dialysis cleanup specific) by multi-layer and multiple chromatography
fractionation by HPLC Mammal blubber Sample ground solvent extraction micro- dual column 30 microgkg 952 (mean) Newman et al 1994
Florisil column cleanup HRGCECD Marine animals Microextraction GCECD 1 ng 95 (Aroclor 1254) Wirth et al 1994 Cows milk Mixing of sample fortified with 13C-labeled HRGCMS 01ndash05 pgg (fat) 50ndash60 Van der Velde et al (congener PCBs with sodium oxalate and methanol for tetra- to hexashy 1994 specific) solvent extraction cleanup and congeners of PCB
fractionation by porous carbon and alumina
PCBs
606 7 AN
ALYTICAL M
ETHO
DS
Table 7-3 Analytical Methods for Determining Polychlorinated Biphenyls in Environmental Samples (continued)
Sample matrix Preparation method Analytical method Sample detection limit
Percent recovery Reference
Eggs fish Supercritical fluid extraction combined with Florisil separation
GCECD No data 91ndash95 Alley and Lu 1995
Fatty foods Solvent extraction liquid-liquid partitioning cleanup on Florisil column
GCECD No data No data AOAC 1990
aThis method converts the different congeners to decachlorobiphenyl and cannot differentiate between commercial mixtures (eg Aroclor 1242 1260)bAs required by Contract Laboratory Program cMethod 8080A is proposed for deletion from SW-846 method 8082 is proposed for inclusion in SW-846
CLLE = continuous liquidliquid extraction ECD = electron capture detection GC = gas chromatography HPLC = high performance liquid chromatography HRGC = high resolution gas chromatography HRMS = high resolution mass spectrometry MS = mass spectrometry NICIMS = negative ion chemical ionization mass spectrometry ng = nanogram (10-9 g) pg = picogram (10-12 g) PUF = polyurethane foam SIM = selected ion monitoring SFE= separatory funnel extraction SPE = solid phase extraction
PCBs
607 7 AN
ALYTICAL M
ETHO
DS
PCBs 608
7 ANALYTICAL METHODS
Detection limits in the low pgL range have been reported (Leister and Baker 1994) Some of the
methods are noncongener-specific that is the results are reported as PCB mixtures (Aroclors) (EPA
1982a 1989c) and some are congener-specific (EPA 1987f 1999k Kelly et al 1993 Leister and Baker
1994 Miyata et al 1993) EPA Method 508A which converts all of the PCBs to decachlorobiphenyl is
a screening method for quantifying total PCBs (EPA 1989c) The method is likely to show interference
due to perchlorination of biphenyl or related compounds (EPA 1991b) and the method cannot quantify
individual commercial Aroclors in a PCB mixture Some waters particularly surface and waste waters
may require cleanup on adsorption columns prior to analysis (EPA 1982a 1988b Miyata et al 1993)
SPE media may be used reducing the use of flammable or toxic solvents (EPA 1987f)
Soil sediment and solid waste samples are usually Soxhlet extracted (EPA 1994f 1995c 1999k)
Ultrasonic extraction with various solvent combinations (Fuoco et al 1993) and SFE (Lee and Peart
1994) are utilized as well Recoveries using these methods are comparable to Soxhlet extraction
(80ndash100) Cleanup procedures include sulfur removal (EPA 1994f Fuoco et al 1993 Lee and Peart
1994 Lopez-Avila et al 1988) and separation on adsorbent columns (Bandh et al 1996 EPA 1994f
Fuoco et al 1993 Lee and Peart 1994 Lopez-Avila et al 1988) HRGCECD is used most often for
determination of PCBs (Fuoco et al 1993 Lee and Peart 1994 Lopez-Avila et al 1988) Detection limits
are generally in the ppb range (60ndash80 microgkg) (EPA 1987a 1995c Lopez-Avila et al 1988) Recovery of
62ndash125 of PCBs in clay and soil samples has been reported for a multiple lab study (EPA 1995c)
Methods using the enzyme-linked immunosorbent assay are commercially available for screening PCB
contamination in soils (Baek 1993 EPA 1995d) These methods are inexpensive and have a fast
turnaround time
Methods are available for measuring the concentration of PCBs in fish and animal tissues Tissues are
homogenized and then dried by blending with anhydrous sodium sulfate prior to Soxhlet or column
extraction (EPA 1999k Newman et al 1994) Direct extraction has also been utilized (Schwartz et al
1993) After cleanup PCBs are determined by HRGCECD (Schwartz et al 1993) dual column
HRGCECD (Newman et al 1994) or HRGCMS (Schmidt and Hesselberg 1992) A micro extraction
method for very small sample masses (25 microg) has been developed (Wirth et al 1994) A limit of
detection of 1 ngkg sample and good recovery (95) and precision were reported (Wirth et al 1994)
Few methods are available for the determination of PCBs in foods Little performance data have been
reported as well A method is available for the determination of Aroclors in poultry fat fish and dairy
products (AOAC 1990)
PCBs 609
7 ANALYTICAL METHODS
A number of Standard Reference Materials (SRMs) with certified PCB congener concentrations are
available from the National Institute of Standards and Technology (NIST) these include SRM 1588
PCBs in Cod Liver Oil SRM 1939 PCBs in River Sediment SRM 1941 PCBs in Marine Sediment and
SRM 1974 PCBs in Mussel Tissue (Schantz et al 1993a 1993b) These SRMs are useful in validating
the accuracy of methods for the determination of PCBs and for verifying that the method remains within
acceptable levels of error in during analysis A summary of available SRMs with certified PCB
concentrations is shown in Table 7-4 SRMs with non-certified concentration data for PCBs are included
in the table as well
73 ADEQUACY OF THE DATABASE
Section 104(i)(5) of CERCLA as amended directs the Administrator of ATSDR (in consultation with the
Administrator of EPA and agencies and programs of the Public Health Service) to assess whether
adequate information on the health effects of PCBs is available Where adequate information is not
available ATSDR in conjunction with the National Toxicology Program (NTP) is required to assure the
initiation of a program of research designed to determine the health effects (and techniques for developing
methods to determine such health effects) of PCBs
The following categories of possible data needs have been identified by a joint team of scientists from
ATSDR NTP and EPA They are defined as substance-specific informational needs that if met would
reduce the uncertainties of human health assessment This definition should not be interpreted to mean
that all data needs discussed in this section must be filled In the future the identified data needs will be
evaluated and prioritized and a substance-specific research agenda will be proposed
731 Identification of Data Needs
Methods for Determining Biomarkers of Exposure and Effect Several investigators have
used whole blood serum breast milk and hair as biomarkers for environmental exposure to PCBs
(Brown and Lawton 1984 Fait et al 1989 Furst et al 1994 Luotamo 1988 Safe et al 1985b Zupancic-
Kralj et al 1992) Consequently levels of PCBs in these media can provide estimates of exposure to
PCBs Analytical methods of satisfactory accuracy are available for determining congener- and
noncongener-specific PCBs in blood serum breast milk and human hair these methods are shown in
Table 7-2 Some methods for determining biomarkers are shown in Table 7-5 The method developed by
several investigators can be used for the determination of the three non-ortho substituted PCB congeners
Table 7-4 NIST Standard Reference Materials for the Determination of Polychlorinated Biphenyls (PCBs)a
SRM Description PCBs certified PCBs quantified
1589 PCBs (as Aroclor 1260) in human serum 1b
1588 Organics in cod liver oil Surrogate for a tissue extract with high lipid 4 43 content
1649 Urban dustorganics Air particulate material 10
1939 PCB congeners in river sediment Sediment with high levels of PCB congeners 3 17
1941a Organics in marine sediment Collected in Baltimore Harbor 15
1974 Organics in mussel tissue Frozen powder-like homogenate 13
1945 Whale blubber Frozen blubber homogenate 26
aSource Schantz et al 1993a bcertified as Aroclor 1260
NIST = National Institute of Standards and Technology
PCBs
610 7 AN
ALYTICAL M
ETHO
DS
Table 7-5 Analytical Methods for Determining Biomarkers for Polychlorinated Biphenyls
Analytical Sample detection Percent
Sample matrix Preparation method method limit recovery Reference Liver and adipose Homogenization extraction with HRGCECNIMS No data No data Buser et al 1992 tissue of gray seal methylene chloridecyclohexane (methyl sulfone removal of lipids by dialysis metabolite) cleanup by gel permeation
chromatography fractionation on carbon and Florisil columns
Serum (major Solvent extraction methylation HRGCECD and No data low nmolmL Morse et al 1995 metabolites of partition with H2SO4 HRGCMS PCB-77)
ECD = electron capture detection ECNI = electron capture negative ionization HRGC = high resolution gas chromatography MS = mass spectrometry
PCBs
611 7 AN
ALYTICAL M
ETHO
DS
PCBs 612
7 ANALYTICAL METHODS
(77 126 and 169) in human milk adipose tissue and serum at levels normally found in these tissues of
control population (Harrad et al 1992 Hong et al 1992a Patterson et al 1989 1994)
While blood serum breast milk adipose tissue and hair have been used as biomarkers of exposure the
possible equivalency of these biomarkers has not been intensively investigated At least two of these
biomarkers serum and breast milk did not appear to give equivalent measures of exposure even when
expressed on a lipid basis (The theory of equivalency is based on the assumption that the steady state
concentration of a persistent lipophilic substance in different body compartments is the same when
expressed on a lipid basis) Greizerstein et al (1999) compared levels of PCB congeners between serum
and milk from seven women in the New York Angler Study The congener profiles for serum and milk
samples were similar for each individual but different among all subjects The sum of the congener
concentrations was used to estimate the total PCB concentration The ratio of serum to milk
concentrations in the women ranged from 018 to 166 with a mean of 065plusmn049 showing no consistency
among individuals Considerable differences were also found in the lipid-adjusted concentrations of
PCBs among individuals The range of lipid-adjusted serum-to-milk ratios was 11ndash28 with a mean of
19plusmn05 The lipid-adjusted serum levels were also gt1 for the most abundant congeners PCBs 118 153
138 and 180 The lipid-adjusted ratios of these four non-planar congeners in serum and milk were
similar to those found by Koopman-Esseboom et al (1994b) in a study involving 418 mother-infant pairs
This latter study found that correlation coefficients between PCB congener levels (PCBs 118 138 153
and 180) in maternal plasma human milk (lipid-basis) and cord plasma were highly significant within
one biological sample (071ndash098) as well as between different biological samples However the
correlation between other PCB congeners in human milk varied considerably The study by Greizerstein
et al (1999) was small and collection of blood and milk samples was not uniform for all subjects
Therefore more data are needed to establish whether equivalency factors can be established between
various measures of body burden so as to allow normalization of measurements between different studies
Biomarkers of effects of exposure to PCBs are detailed Chapter 3 (Section 381) No single effect or
combination of effects that could be used specifically as an indicator of exposure to PCBs are being
developed to screen large numbers of food samples for PCBs and related compounds (JK Huwe et al of
Agricultural Research Service Fargo North Dakota) New screening methods for trace detection of
PCBs in the environment and feeds are being developed by M Franek et al (Ministerstvo Zemedelstvi
Czech Republic) Development and application of semipermeable membrane devices (SPMDs) as
environmental dosimeters for PCB contaminants in water air sediment and soil is the subject of ongoing
PCBs 613
7 ANALYTICAL METHODS
research by Huckins and Petty at Columbia Environmental Research Center in Missouri Also at the
Columbia Environmental Research Center C Orazio et al are developing analytical methods for
determining PCBs in environmental matrices A reliable method for continuous monitoring of PCBs in
incinerator stack gas emissions using resonance-enhanced multiphoton ionization spectroscopy in
conjunction with time-of-flight mass spectroscopy (REMPITOFMS) is the topic of current research by
TA Cool at Cornell University No additional information or ongoing studies regarding analytical
methods for determining PCBs in environmental and biological samples resulting from exposure were
located Accordingly new and improved analytical methods for trace detection of PCBs that could be
used specifically as indicators of exposure in environmental and biological samples to PCBs are needed
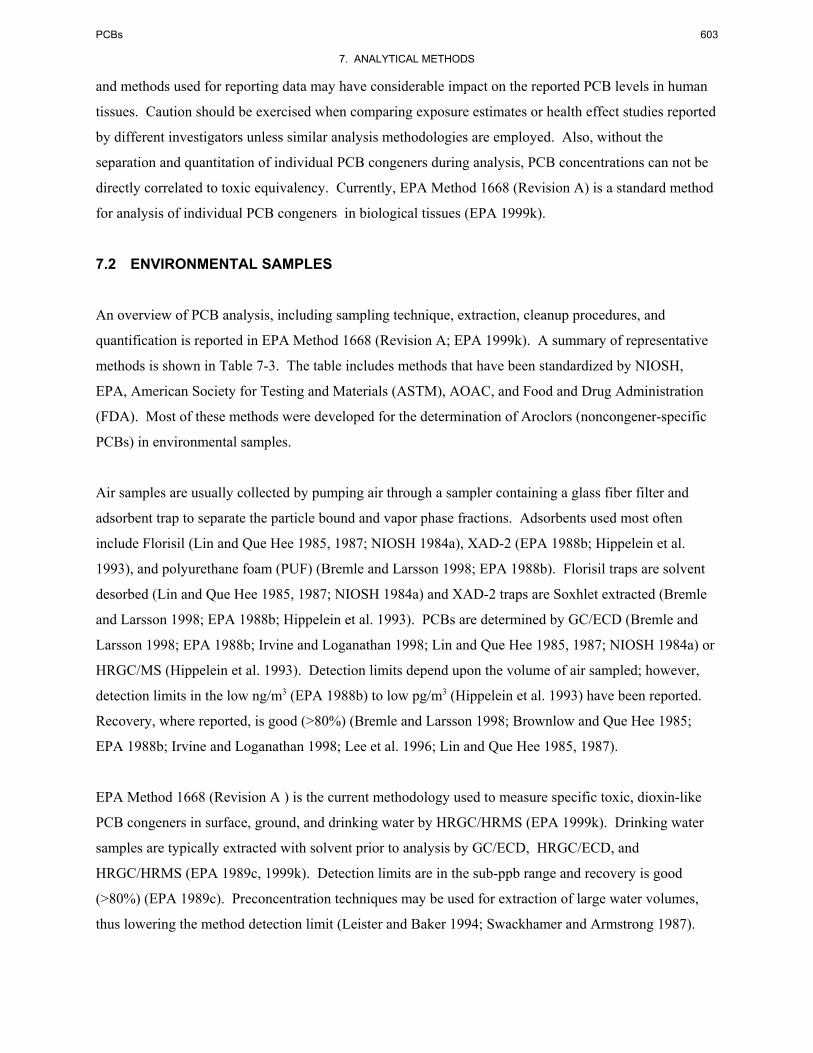
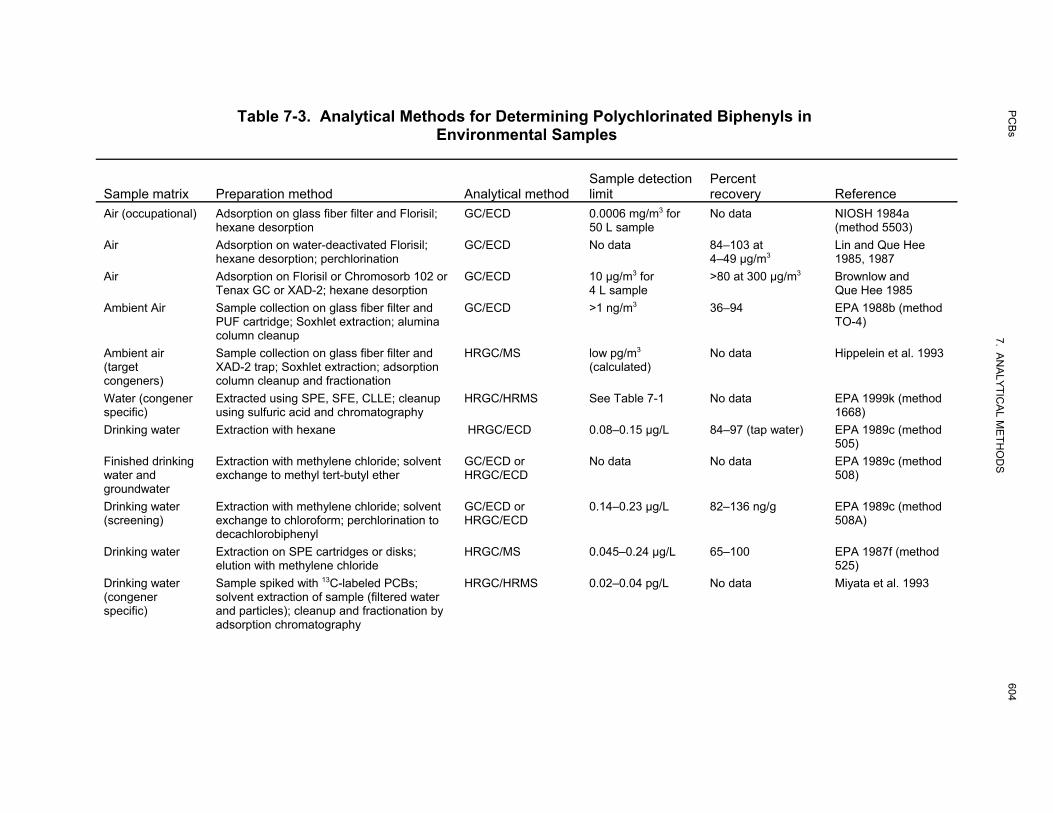
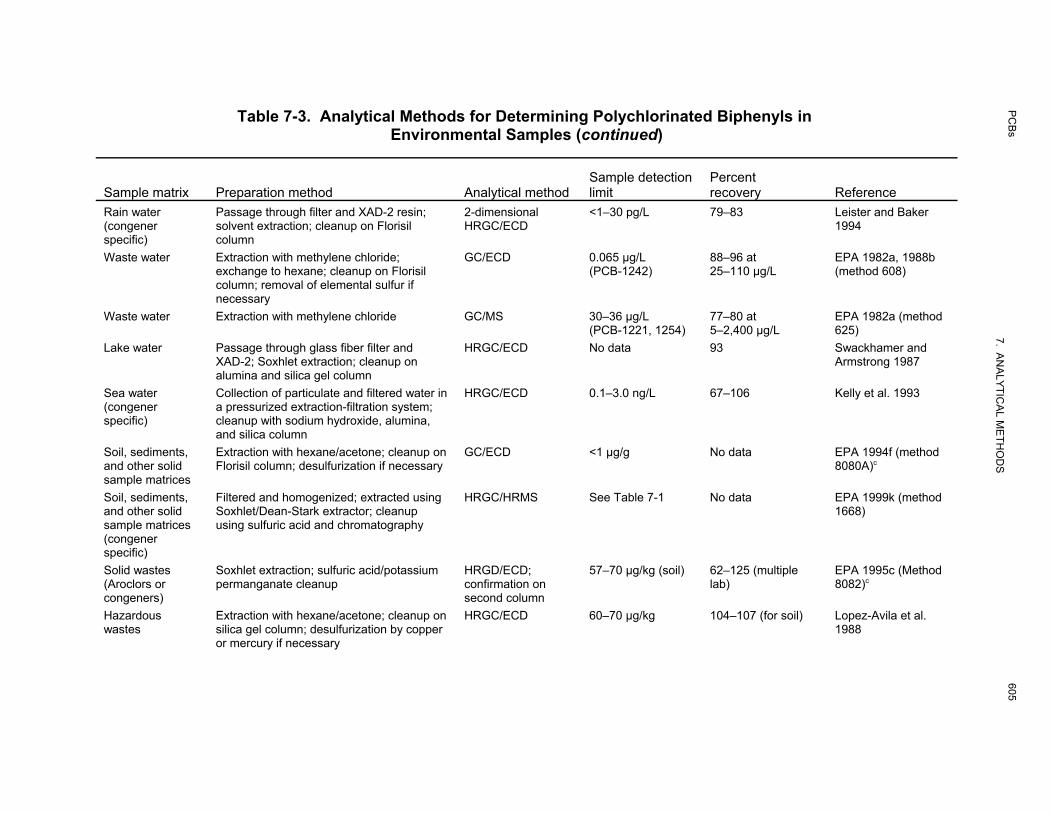
Table 7-3 Analytical Methods for Determining Polychlorinated Biphenyls in Environmental Samples (continued)
Sample detection Percent Sample matrix Preparation method Analytical method limit recovery Reference Soilsediment Extraction with methylene chlorideacetone GCECD 80 microgkg (required No data EPA 1987a (CLP)b
(low level) (11) cleanup by gel permeation and microshy quantitation limit) alumina column
Sediment Ultrasonic extraction with acetonehexane HRGCECD No data 70ndash93 Fuoco et al 1993 (congener sulfur removal cleanup on Florisil specific) fractionation by HPLC Sediment Supercritical fluid extraction mini-Florisil HRGCECD No data 90 Lee and Peart 1994
column cleanup sulfur removal confirmation by MS Railcar paint Extraction with 90 methylene HRGCECD 1 mgkg 74ndash86 Welsh 1995 scrapings chloride10 methanol cleanup on Florisil
column Fly ash Soxhlet extraction optional column cleanup GCECD or GCMS- No data 80ndash100 Kohellipan et al 1994
SIM Fish (congener Extraction of homogenized tissue with HRGCNICIMS 02ndash3 pg 65ndash115 Schmidt and specific) petroleum etherethyl acetate cleanup by Hesselberg 1992
gel permeation chromatography Fish (congener Homogenized extracted in methylene HRGCHRMS See Table 7-1 No Data EPA 1999k (method specific) chloridehexane (11) using Soxhlet 1668)
extractor cleanup using sulfuric acid and chromatography
Fish fish egg Extraction of homogenized 13C-PCB labeled HRGCECD 01ndash073 ngg 62ndash92 Schwartz et al 1993 and bird egg tissues with methylene chloride removal of (lipid) (congener lipid by gel permeation or dialysis cleanup specific) by multi-layer and multiple chromatography
fractionation by HPLC Mammal blubber Sample ground solvent extraction micro- dual column 30 microgkg 952 (mean) Newman et al 1994
Florisil column cleanup HRGCECD Marine animals Microextraction GCECD 1 ng 95 (Aroclor 1254) Wirth et al 1994 Cows milk Mixing of sample fortified with 13C-labeled HRGCMS 01ndash05 pgg (fat) 50ndash60 Van der Velde et al (congener PCBs with sodium oxalate and methanol for tetra- to hexashy 1994 specific) solvent extraction cleanup and congeners of PCB
fractionation by porous carbon and alumina
PCBs
606 7 AN
ALYTICAL M
ETHO
DS
Table 7-3 Analytical Methods for Determining Polychlorinated Biphenyls in Environmental Samples (continued)
Sample matrix Preparation method Analytical method Sample detection limit
Percent recovery Reference
Eggs fish Supercritical fluid extraction combined with Florisil separation
GCECD No data 91ndash95 Alley and Lu 1995
Fatty foods Solvent extraction liquid-liquid partitioning cleanup on Florisil column
GCECD No data No data AOAC 1990
aThis method converts the different congeners to decachlorobiphenyl and cannot differentiate between commercial mixtures (eg Aroclor 1242 1260)bAs required by Contract Laboratory Program cMethod 8080A is proposed for deletion from SW-846 method 8082 is proposed for inclusion in SW-846
CLLE = continuous liquidliquid extraction ECD = electron capture detection GC = gas chromatography HPLC = high performance liquid chromatography HRGC = high resolution gas chromatography HRMS = high resolution mass spectrometry MS = mass spectrometry NICIMS = negative ion chemical ionization mass spectrometry ng = nanogram (10-9 g) pg = picogram (10-12 g) PUF = polyurethane foam SIM = selected ion monitoring SFE= separatory funnel extraction SPE = solid phase extraction
PCBs
607 7 AN
ALYTICAL M
ETHO
DS
PCBs 608
7 ANALYTICAL METHODS
Detection limits in the low pgL range have been reported (Leister and Baker 1994) Some of the
methods are noncongener-specific that is the results are reported as PCB mixtures (Aroclors) (EPA
1982a 1989c) and some are congener-specific (EPA 1987f 1999k Kelly et al 1993 Leister and Baker
1994 Miyata et al 1993) EPA Method 508A which converts all of the PCBs to decachlorobiphenyl is
a screening method for quantifying total PCBs (EPA 1989c) The method is likely to show interference
due to perchlorination of biphenyl or related compounds (EPA 1991b) and the method cannot quantify
individual commercial Aroclors in a PCB mixture Some waters particularly surface and waste waters
may require cleanup on adsorption columns prior to analysis (EPA 1982a 1988b Miyata et al 1993)
SPE media may be used reducing the use of flammable or toxic solvents (EPA 1987f)
Soil sediment and solid waste samples are usually Soxhlet extracted (EPA 1994f 1995c 1999k)
Ultrasonic extraction with various solvent combinations (Fuoco et al 1993) and SFE (Lee and Peart
1994) are utilized as well Recoveries using these methods are comparable to Soxhlet extraction
(80ndash100) Cleanup procedures include sulfur removal (EPA 1994f Fuoco et al 1993 Lee and Peart
1994 Lopez-Avila et al 1988) and separation on adsorbent columns (Bandh et al 1996 EPA 1994f
Fuoco et al 1993 Lee and Peart 1994 Lopez-Avila et al 1988) HRGCECD is used most often for
determination of PCBs (Fuoco et al 1993 Lee and Peart 1994 Lopez-Avila et al 1988) Detection limits
are generally in the ppb range (60ndash80 microgkg) (EPA 1987a 1995c Lopez-Avila et al 1988) Recovery of
62ndash125 of PCBs in clay and soil samples has been reported for a multiple lab study (EPA 1995c)
Methods using the enzyme-linked immunosorbent assay are commercially available for screening PCB
contamination in soils (Baek 1993 EPA 1995d) These methods are inexpensive and have a fast
turnaround time
Methods are available for measuring the concentration of PCBs in fish and animal tissues Tissues are
homogenized and then dried by blending with anhydrous sodium sulfate prior to Soxhlet or column
extraction (EPA 1999k Newman et al 1994) Direct extraction has also been utilized (Schwartz et al
1993) After cleanup PCBs are determined by HRGCECD (Schwartz et al 1993) dual column
HRGCECD (Newman et al 1994) or HRGCMS (Schmidt and Hesselberg 1992) A micro extraction
method for very small sample masses (25 microg) has been developed (Wirth et al 1994) A limit of
detection of 1 ngkg sample and good recovery (95) and precision were reported (Wirth et al 1994)
Few methods are available for the determination of PCBs in foods Little performance data have been
reported as well A method is available for the determination of Aroclors in poultry fat fish and dairy
products (AOAC 1990)
PCBs 609
7 ANALYTICAL METHODS
A number of Standard Reference Materials (SRMs) with certified PCB congener concentrations are
available from the National Institute of Standards and Technology (NIST) these include SRM 1588
PCBs in Cod Liver Oil SRM 1939 PCBs in River Sediment SRM 1941 PCBs in Marine Sediment and
SRM 1974 PCBs in Mussel Tissue (Schantz et al 1993a 1993b) These SRMs are useful in validating
the accuracy of methods for the determination of PCBs and for verifying that the method remains within
acceptable levels of error in during analysis A summary of available SRMs with certified PCB
concentrations is shown in Table 7-4 SRMs with non-certified concentration data for PCBs are included
in the table as well
73 ADEQUACY OF THE DATABASE
Section 104(i)(5) of CERCLA as amended directs the Administrator of ATSDR (in consultation with the
Administrator of EPA and agencies and programs of the Public Health Service) to assess whether
adequate information on the health effects of PCBs is available Where adequate information is not
available ATSDR in conjunction with the National Toxicology Program (NTP) is required to assure the
initiation of a program of research designed to determine the health effects (and techniques for developing
methods to determine such health effects) of PCBs
The following categories of possible data needs have been identified by a joint team of scientists from
ATSDR NTP and EPA They are defined as substance-specific informational needs that if met would
reduce the uncertainties of human health assessment This definition should not be interpreted to mean
that all data needs discussed in this section must be filled In the future the identified data needs will be
evaluated and prioritized and a substance-specific research agenda will be proposed
731 Identification of Data Needs
Methods for Determining Biomarkers of Exposure and Effect Several investigators have
used whole blood serum breast milk and hair as biomarkers for environmental exposure to PCBs
(Brown and Lawton 1984 Fait et al 1989 Furst et al 1994 Luotamo 1988 Safe et al 1985b Zupancic-
Kralj et al 1992) Consequently levels of PCBs in these media can provide estimates of exposure to
PCBs Analytical methods of satisfactory accuracy are available for determining congener- and
noncongener-specific PCBs in blood serum breast milk and human hair these methods are shown in
Table 7-2 Some methods for determining biomarkers are shown in Table 7-5 The method developed by
several investigators can be used for the determination of the three non-ortho substituted PCB congeners
Table 7-4 NIST Standard Reference Materials for the Determination of Polychlorinated Biphenyls (PCBs)a
SRM Description PCBs certified PCBs quantified
1589 PCBs (as Aroclor 1260) in human serum 1b
1588 Organics in cod liver oil Surrogate for a tissue extract with high lipid 4 43 content
1649 Urban dustorganics Air particulate material 10
1939 PCB congeners in river sediment Sediment with high levels of PCB congeners 3 17
1941a Organics in marine sediment Collected in Baltimore Harbor 15
1974 Organics in mussel tissue Frozen powder-like homogenate 13
1945 Whale blubber Frozen blubber homogenate 26
aSource Schantz et al 1993a bcertified as Aroclor 1260
NIST = National Institute of Standards and Technology
PCBs
610 7 AN
ALYTICAL M
ETHO
DS
Table 7-5 Analytical Methods for Determining Biomarkers for Polychlorinated Biphenyls
Analytical Sample detection Percent
Sample matrix Preparation method method limit recovery Reference Liver and adipose Homogenization extraction with HRGCECNIMS No data No data Buser et al 1992 tissue of gray seal methylene chloridecyclohexane (methyl sulfone removal of lipids by dialysis metabolite) cleanup by gel permeation
chromatography fractionation on carbon and Florisil columns
Serum (major Solvent extraction methylation HRGCECD and No data low nmolmL Morse et al 1995 metabolites of partition with H2SO4 HRGCMS PCB-77)
ECD = electron capture detection ECNI = electron capture negative ionization HRGC = high resolution gas chromatography MS = mass spectrometry
PCBs
611 7 AN
ALYTICAL M
ETHO
DS
PCBs 612
7 ANALYTICAL METHODS
(77 126 and 169) in human milk adipose tissue and serum at levels normally found in these tissues of
control population (Harrad et al 1992 Hong et al 1992a Patterson et al 1989 1994)
While blood serum breast milk adipose tissue and hair have been used as biomarkers of exposure the
possible equivalency of these biomarkers has not been intensively investigated At least two of these
biomarkers serum and breast milk did not appear to give equivalent measures of exposure even when
expressed on a lipid basis (The theory of equivalency is based on the assumption that the steady state
concentration of a persistent lipophilic substance in different body compartments is the same when
expressed on a lipid basis) Greizerstein et al (1999) compared levels of PCB congeners between serum
and milk from seven women in the New York Angler Study The congener profiles for serum and milk
samples were similar for each individual but different among all subjects The sum of the congener
concentrations was used to estimate the total PCB concentration The ratio of serum to milk
concentrations in the women ranged from 018 to 166 with a mean of 065plusmn049 showing no consistency
among individuals Considerable differences were also found in the lipid-adjusted concentrations of
PCBs among individuals The range of lipid-adjusted serum-to-milk ratios was 11ndash28 with a mean of
19plusmn05 The lipid-adjusted serum levels were also gt1 for the most abundant congeners PCBs 118 153
138 and 180 The lipid-adjusted ratios of these four non-planar congeners in serum and milk were
similar to those found by Koopman-Esseboom et al (1994b) in a study involving 418 mother-infant pairs
This latter study found that correlation coefficients between PCB congener levels (PCBs 118 138 153
and 180) in maternal plasma human milk (lipid-basis) and cord plasma were highly significant within
one biological sample (071ndash098) as well as between different biological samples However the
correlation between other PCB congeners in human milk varied considerably The study by Greizerstein
et al (1999) was small and collection of blood and milk samples was not uniform for all subjects
Therefore more data are needed to establish whether equivalency factors can be established between
various measures of body burden so as to allow normalization of measurements between different studies
Biomarkers of effects of exposure to PCBs are detailed Chapter 3 (Section 381) No single effect or
combination of effects that could be used specifically as an indicator of exposure to PCBs are being
developed to screen large numbers of food samples for PCBs and related compounds (JK Huwe et al of
Agricultural Research Service Fargo North Dakota) New screening methods for trace detection of
PCBs in the environment and feeds are being developed by M Franek et al (Ministerstvo Zemedelstvi
Czech Republic) Development and application of semipermeable membrane devices (SPMDs) as
environmental dosimeters for PCB contaminants in water air sediment and soil is the subject of ongoing
PCBs 613
7 ANALYTICAL METHODS
research by Huckins and Petty at Columbia Environmental Research Center in Missouri Also at the
Columbia Environmental Research Center C Orazio et al are developing analytical methods for
determining PCBs in environmental matrices A reliable method for continuous monitoring of PCBs in
incinerator stack gas emissions using resonance-enhanced multiphoton ionization spectroscopy in
conjunction with time-of-flight mass spectroscopy (REMPITOFMS) is the topic of current research by
TA Cool at Cornell University No additional information or ongoing studies regarding analytical
methods for determining PCBs in environmental and biological samples resulting from exposure were
located Accordingly new and improved analytical methods for trace detection of PCBs that could be
used specifically as indicators of exposure in environmental and biological samples to PCBs are needed
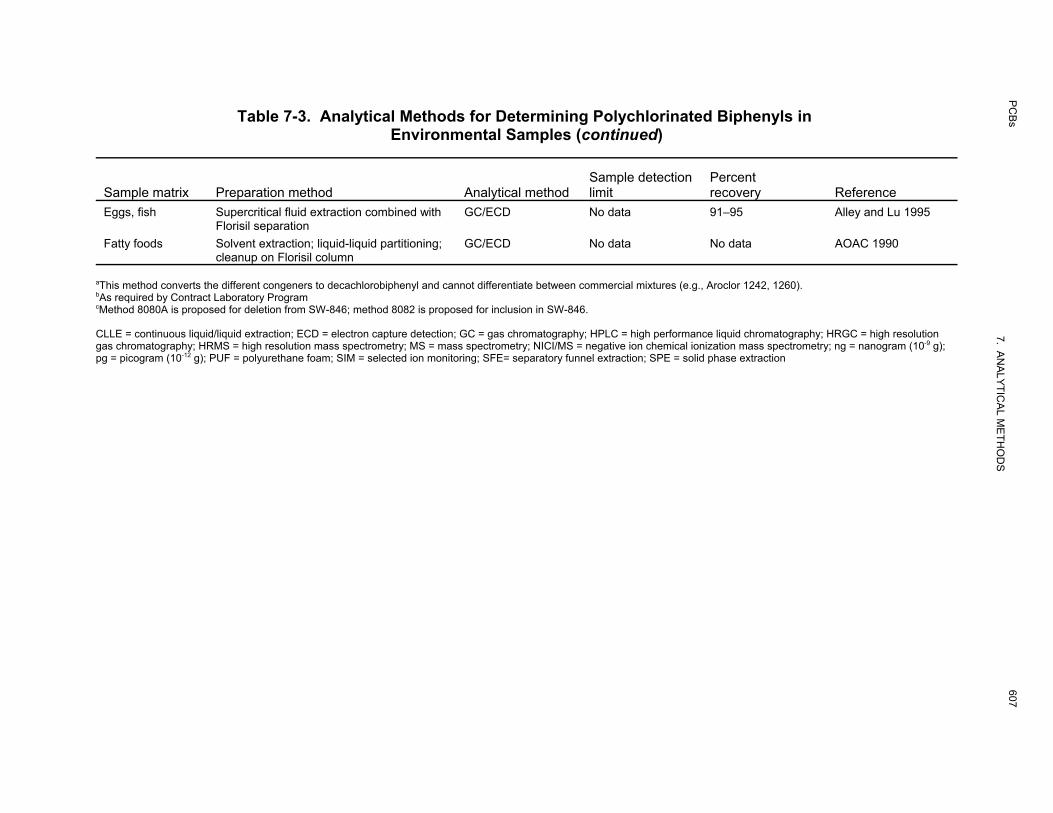
Table 7-3 Analytical Methods for Determining Polychlorinated Biphenyls in Environmental Samples (continued)
Sample matrix Preparation method Analytical method Sample detection limit
Percent recovery Reference
Eggs fish Supercritical fluid extraction combined with Florisil separation
GCECD No data 91ndash95 Alley and Lu 1995
Fatty foods Solvent extraction liquid-liquid partitioning cleanup on Florisil column
GCECD No data No data AOAC 1990
aThis method converts the different congeners to decachlorobiphenyl and cannot differentiate between commercial mixtures (eg Aroclor 1242 1260)bAs required by Contract Laboratory Program cMethod 8080A is proposed for deletion from SW-846 method 8082 is proposed for inclusion in SW-846
CLLE = continuous liquidliquid extraction ECD = electron capture detection GC = gas chromatography HPLC = high performance liquid chromatography HRGC = high resolution gas chromatography HRMS = high resolution mass spectrometry MS = mass spectrometry NICIMS = negative ion chemical ionization mass spectrometry ng = nanogram (10-9 g) pg = picogram (10-12 g) PUF = polyurethane foam SIM = selected ion monitoring SFE= separatory funnel extraction SPE = solid phase extraction
PCBs
607 7 AN
ALYTICAL M
ETHO
DS
PCBs 608
7 ANALYTICAL METHODS
Detection limits in the low pgL range have been reported (Leister and Baker 1994) Some of the
methods are noncongener-specific that is the results are reported as PCB mixtures (Aroclors) (EPA
1982a 1989c) and some are congener-specific (EPA 1987f 1999k Kelly et al 1993 Leister and Baker
1994 Miyata et al 1993) EPA Method 508A which converts all of the PCBs to decachlorobiphenyl is
a screening method for quantifying total PCBs (EPA 1989c) The method is likely to show interference
due to perchlorination of biphenyl or related compounds (EPA 1991b) and the method cannot quantify
individual commercial Aroclors in a PCB mixture Some waters particularly surface and waste waters
may require cleanup on adsorption columns prior to analysis (EPA 1982a 1988b Miyata et al 1993)
SPE media may be used reducing the use of flammable or toxic solvents (EPA 1987f)
Soil sediment and solid waste samples are usually Soxhlet extracted (EPA 1994f 1995c 1999k)
Ultrasonic extraction with various solvent combinations (Fuoco et al 1993) and SFE (Lee and Peart
1994) are utilized as well Recoveries using these methods are comparable to Soxhlet extraction
(80ndash100) Cleanup procedures include sulfur removal (EPA 1994f Fuoco et al 1993 Lee and Peart
1994 Lopez-Avila et al 1988) and separation on adsorbent columns (Bandh et al 1996 EPA 1994f
Fuoco et al 1993 Lee and Peart 1994 Lopez-Avila et al 1988) HRGCECD is used most often for
determination of PCBs (Fuoco et al 1993 Lee and Peart 1994 Lopez-Avila et al 1988) Detection limits
are generally in the ppb range (60ndash80 microgkg) (EPA 1987a 1995c Lopez-Avila et al 1988) Recovery of
62ndash125 of PCBs in clay and soil samples has been reported for a multiple lab study (EPA 1995c)
Methods using the enzyme-linked immunosorbent assay are commercially available for screening PCB
contamination in soils (Baek 1993 EPA 1995d) These methods are inexpensive and have a fast
turnaround time
Methods are available for measuring the concentration of PCBs in fish and animal tissues Tissues are
homogenized and then dried by blending with anhydrous sodium sulfate prior to Soxhlet or column
extraction (EPA 1999k Newman et al 1994) Direct extraction has also been utilized (Schwartz et al
1993) After cleanup PCBs are determined by HRGCECD (Schwartz et al 1993) dual column
HRGCECD (Newman et al 1994) or HRGCMS (Schmidt and Hesselberg 1992) A micro extraction
method for very small sample masses (25 microg) has been developed (Wirth et al 1994) A limit of
detection of 1 ngkg sample and good recovery (95) and precision were reported (Wirth et al 1994)
Few methods are available for the determination of PCBs in foods Little performance data have been
reported as well A method is available for the determination of Aroclors in poultry fat fish and dairy
products (AOAC 1990)
PCBs 609
7 ANALYTICAL METHODS
A number of Standard Reference Materials (SRMs) with certified PCB congener concentrations are
available from the National Institute of Standards and Technology (NIST) these include SRM 1588
PCBs in Cod Liver Oil SRM 1939 PCBs in River Sediment SRM 1941 PCBs in Marine Sediment and
SRM 1974 PCBs in Mussel Tissue (Schantz et al 1993a 1993b) These SRMs are useful in validating
the accuracy of methods for the determination of PCBs and for verifying that the method remains within
acceptable levels of error in during analysis A summary of available SRMs with certified PCB
concentrations is shown in Table 7-4 SRMs with non-certified concentration data for PCBs are included
in the table as well
73 ADEQUACY OF THE DATABASE
Section 104(i)(5) of CERCLA as amended directs the Administrator of ATSDR (in consultation with the
Administrator of EPA and agencies and programs of the Public Health Service) to assess whether
adequate information on the health effects of PCBs is available Where adequate information is not
available ATSDR in conjunction with the National Toxicology Program (NTP) is required to assure the
initiation of a program of research designed to determine the health effects (and techniques for developing
methods to determine such health effects) of PCBs
The following categories of possible data needs have been identified by a joint team of scientists from
ATSDR NTP and EPA They are defined as substance-specific informational needs that if met would
reduce the uncertainties of human health assessment This definition should not be interpreted to mean
that all data needs discussed in this section must be filled In the future the identified data needs will be
evaluated and prioritized and a substance-specific research agenda will be proposed
731 Identification of Data Needs
Methods for Determining Biomarkers of Exposure and Effect Several investigators have
used whole blood serum breast milk and hair as biomarkers for environmental exposure to PCBs
(Brown and Lawton 1984 Fait et al 1989 Furst et al 1994 Luotamo 1988 Safe et al 1985b Zupancic-
Kralj et al 1992) Consequently levels of PCBs in these media can provide estimates of exposure to
PCBs Analytical methods of satisfactory accuracy are available for determining congener- and
noncongener-specific PCBs in blood serum breast milk and human hair these methods are shown in
Table 7-2 Some methods for determining biomarkers are shown in Table 7-5 The method developed by
several investigators can be used for the determination of the three non-ortho substituted PCB congeners
Table 7-4 NIST Standard Reference Materials for the Determination of Polychlorinated Biphenyls (PCBs)a
SRM Description PCBs certified PCBs quantified
1589 PCBs (as Aroclor 1260) in human serum 1b
1588 Organics in cod liver oil Surrogate for a tissue extract with high lipid 4 43 content
1649 Urban dustorganics Air particulate material 10
1939 PCB congeners in river sediment Sediment with high levels of PCB congeners 3 17
1941a Organics in marine sediment Collected in Baltimore Harbor 15
1974 Organics in mussel tissue Frozen powder-like homogenate 13
1945 Whale blubber Frozen blubber homogenate 26
aSource Schantz et al 1993a bcertified as Aroclor 1260
NIST = National Institute of Standards and Technology
PCBs
610 7 AN
ALYTICAL M
ETHO
DS
Table 7-5 Analytical Methods for Determining Biomarkers for Polychlorinated Biphenyls
Analytical Sample detection Percent
Sample matrix Preparation method method limit recovery Reference Liver and adipose Homogenization extraction with HRGCECNIMS No data No data Buser et al 1992 tissue of gray seal methylene chloridecyclohexane (methyl sulfone removal of lipids by dialysis metabolite) cleanup by gel permeation
chromatography fractionation on carbon and Florisil columns
Serum (major Solvent extraction methylation HRGCECD and No data low nmolmL Morse et al 1995 metabolites of partition with H2SO4 HRGCMS PCB-77)
ECD = electron capture detection ECNI = electron capture negative ionization HRGC = high resolution gas chromatography MS = mass spectrometry
PCBs
611 7 AN
ALYTICAL M
ETHO
DS
PCBs 612
7 ANALYTICAL METHODS
(77 126 and 169) in human milk adipose tissue and serum at levels normally found in these tissues of
control population (Harrad et al 1992 Hong et al 1992a Patterson et al 1989 1994)
While blood serum breast milk adipose tissue and hair have been used as biomarkers of exposure the
possible equivalency of these biomarkers has not been intensively investigated At least two of these
biomarkers serum and breast milk did not appear to give equivalent measures of exposure even when
expressed on a lipid basis (The theory of equivalency is based on the assumption that the steady state
concentration of a persistent lipophilic substance in different body compartments is the same when
expressed on a lipid basis) Greizerstein et al (1999) compared levels of PCB congeners between serum
and milk from seven women in the New York Angler Study The congener profiles for serum and milk
samples were similar for each individual but different among all subjects The sum of the congener
concentrations was used to estimate the total PCB concentration The ratio of serum to milk
concentrations in the women ranged from 018 to 166 with a mean of 065plusmn049 showing no consistency
among individuals Considerable differences were also found in the lipid-adjusted concentrations of
PCBs among individuals The range of lipid-adjusted serum-to-milk ratios was 11ndash28 with a mean of
19plusmn05 The lipid-adjusted serum levels were also gt1 for the most abundant congeners PCBs 118 153
138 and 180 The lipid-adjusted ratios of these four non-planar congeners in serum and milk were
similar to those found by Koopman-Esseboom et al (1994b) in a study involving 418 mother-infant pairs
This latter study found that correlation coefficients between PCB congener levels (PCBs 118 138 153
and 180) in maternal plasma human milk (lipid-basis) and cord plasma were highly significant within
one biological sample (071ndash098) as well as between different biological samples However the
correlation between other PCB congeners in human milk varied considerably The study by Greizerstein
et al (1999) was small and collection of blood and milk samples was not uniform for all subjects
Therefore more data are needed to establish whether equivalency factors can be established between
various measures of body burden so as to allow normalization of measurements between different studies
Biomarkers of effects of exposure to PCBs are detailed Chapter 3 (Section 381) No single effect or
combination of effects that could be used specifically as an indicator of exposure to PCBs are being
developed to screen large numbers of food samples for PCBs and related compounds (JK Huwe et al of
Agricultural Research Service Fargo North Dakota) New screening methods for trace detection of
PCBs in the environment and feeds are being developed by M Franek et al (Ministerstvo Zemedelstvi
Czech Republic) Development and application of semipermeable membrane devices (SPMDs) as
environmental dosimeters for PCB contaminants in water air sediment and soil is the subject of ongoing
PCBs 613
7 ANALYTICAL METHODS
research by Huckins and Petty at Columbia Environmental Research Center in Missouri Also at the
Columbia Environmental Research Center C Orazio et al are developing analytical methods for
determining PCBs in environmental matrices A reliable method for continuous monitoring of PCBs in
incinerator stack gas emissions using resonance-enhanced multiphoton ionization spectroscopy in
conjunction with time-of-flight mass spectroscopy (REMPITOFMS) is the topic of current research by
TA Cool at Cornell University No additional information or ongoing studies regarding analytical
methods for determining PCBs in environmental and biological samples resulting from exposure were
located Accordingly new and improved analytical methods for trace detection of PCBs that could be
used specifically as indicators of exposure in environmental and biological samples to PCBs are needed
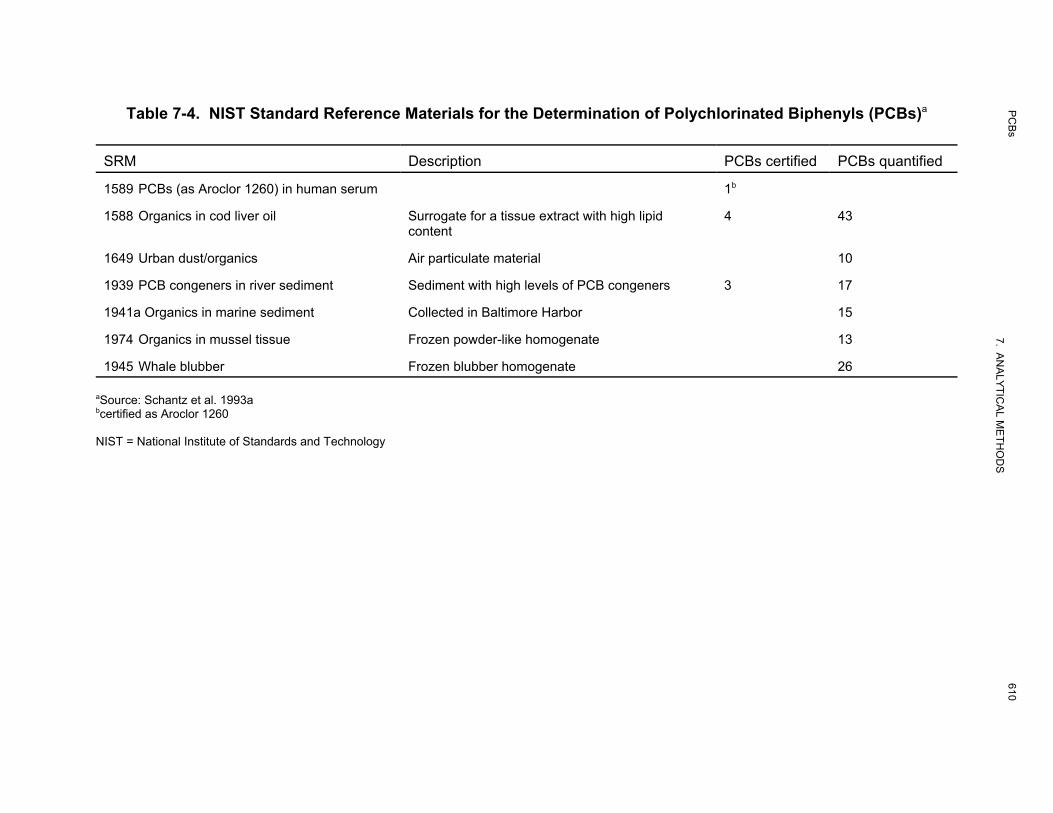
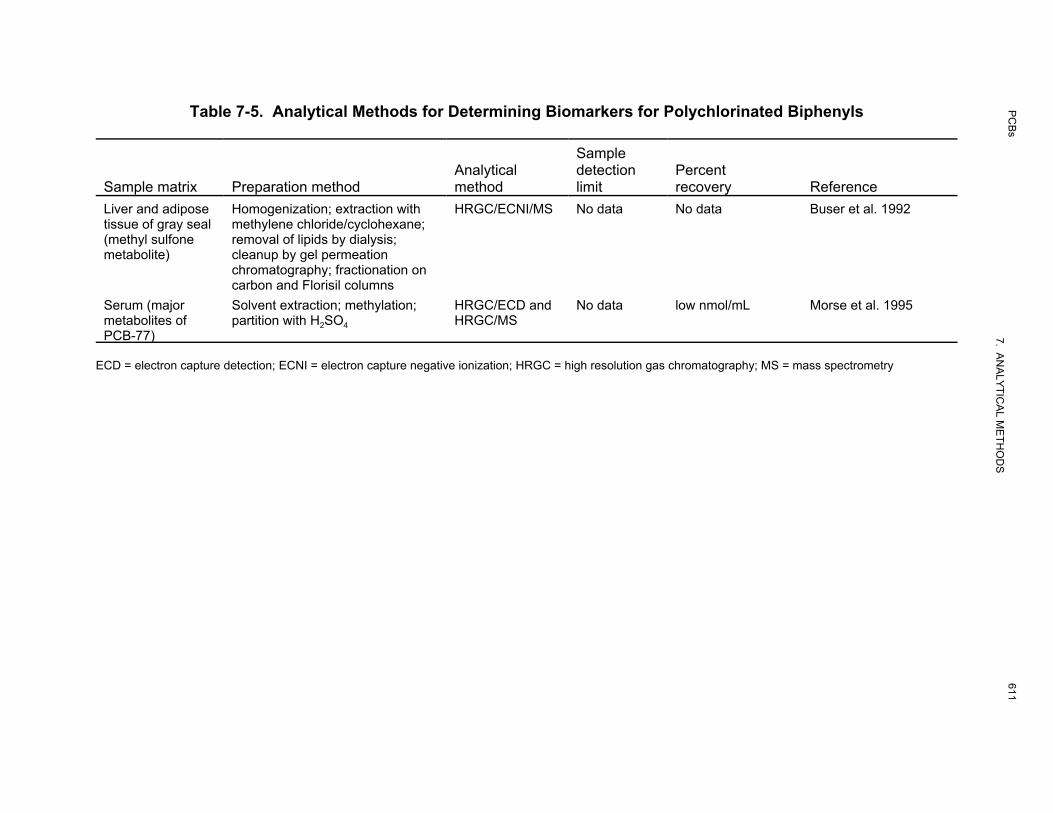


![7. ANALYTICAL METHODS · 7. ANALYTICAL METHODS ... [SRM] 4200, 60,000 Bq [1.6 µCi] CESIUM 164 7. ANALYTICAL METHODS . and SRM 4207, 300,000 Bq …](https://static.fdocuments.in/doc/165x107/5ae8481b7f8b9aee078f554f/7-analytical-methods-analytical-methods-srm-4200-60000-bq-16-ci-cesium.jpg)