Analysis of bph Operon from the Polychlorinated Biphenyl ...
Method 1668C Chlorinated Biphenyl Congeners in Water, Soil, Sediment, Biosolids, and Tissue by HRGC/HRMS
April 2010
U.S. Environmental Protection Agency Office of Water
Office of Science and Technology Engineering and Analysis Division (4303T)
1200 Pennsylvania Avenue, NW Washington, DC 20460
EPA-820-R-10-005
EPA Method 1668C ii April 2010

Method 1668C Chlorinated Biphenyl Congeners in Water, Soil, Sediment, Biosolids, and Tissue by HRGC/HRMS April 2010
The Office of Science and Technology (OST) in EPA’s Office of Water developed Method 1668C (Method 1668C; the “Method”) for use in Clean Water Act (CWA) programs. EPA is publishing this Method for users who wish to measure PCBs as congeners now, and in 2010, EPA expects to publish a proposal in the Federal Register for public comment to add this Method to other CWA Methods published at 40 CFR Part 136.
This Method determines chlorinated biphenyl congeners in environmental samples by isotope dilution and internal standard high-resolution gas chromatography/high-resolution mass spectrometry, HRGC/HRMS. EPA developed this Method for use in wastewater, surface water, soil, sediment, biosolids and tissue matrices. Other applications and matrices may be possible, which may or may not require modifications of sample preparation, chromatography, etc.
EPA used the results of an interlaboratory validation study of Method 1668A, a peer review of that study, user suggestions and additional interlaboratory data to write this version, 1668C, of Method 1668. Method 1668C, the validation study report, Method1668A Interlaboratory Validation Study Report (EPA821-08-021), and the addendum describing the revised QC acceptance criteria, Method 1668A Interlab Study Report Addendum, are available at EPA’s CWA methods website at www.epa.gov/waterscience/methods.
This “C” version of Method 1668 revises the quality control (QC) acceptance criteria in EPA Method 1668B to allow the upper recovery limit for some congeners to be above 100 percent, to revise the estimated method detection limits (EMDLs) and estimated minimum levels of quantitation (EMLs) to MDLs and MLs, and to makes other changes summarized below. The QC acceptance criteria developed in the interlaboratory method validation study of 1668A, and published in version B of the Method, did not allow the upper recovery limit for some congeners to be above 100 percent. The criteria have been revised based on data from the interlaboratory study and data from two laboratories with extensive experience in use of Method 1668A. TestAmerica, Knoxville, Tennessee and AXYS Analytical Services, Ltd., Sidney, British Columbia, Canada provided this new data. These two laboratories and Battelle-Columbus provided MDLs for the congeners and congener groups, which EPA pooled and used to replace the EMDLs and EMLs in Table 2 of Method 1668B with the MDLs and MLs in Method 1668C.
The detection limits and quantitation levels in this Method are usually dependent on the level of interferences and laboratory background levels rather than instrumental limitations. The method detection limits (MDLs) and minimum levels of quantitation (MLs) in Table 2 are concentrations at which a congener can be measured with no interferences present. In water, MDLs range from approximately 7 to 30 parts per quadrillion (picograms per liter, pg/L).
Interface, Inc. and CSC prepared this Method under EPA Contract EP-C-06-085. AXYS Analytical provided the single-lab data in Method 1668A that was later replaced by multi-lab data from laboratories that participated in EPA's inter-laboratory validation of 1668A (six labs for water and tissue, four for biosolids).
Summary of changes between EPA Method 1668B (January 2009) and 1668C (April 2010)
• Additional information on the concentration of extracts has been included in Section 4.2.
• The following note has been added to Section 10.1, “RTs, RRTs, and RRT limits may differ slightly from those in Table 2.” This statement has also been added to the footnotes to Table 2.
EPA Method 1668C iii April 2010
• The note in Section 10.2.1 has been modified to inform the analyst that careful selection of the grade and purity of PFK may help minimize interferences with the dichlorobiphenyl secondary quantitation ion.
• The diluted combined 209 congener solution is now used for calibration verification, in place of the VER-3 solution. This allows all verification tests to be performed with a single solution.
• Section 17.2.1 has been changed to clarify that concentrations of native compounds other than those in the native toxics/LOC standard, in the labeled cleanup standard, and in the labeled injection internal standard (except for labeled CB 178) should be determined using the response factors from Section 10.5 or Section 15.4.2.3.
• Section 17.6.5 has been added to provide information on the use of optional data qualifier flags for reporting coeluting congeners.
• Based on data from the interlab validation study and data from two laboratories, the QC acceptance criteria in Table 6 have been revised to be consistent among tests for calibration verification (VER), initial precision and recovery (IPR), on-going precision and recovery (OPR), and labeled compound recovery from samples.
• Reference 22 has been added to cite the Addendum to the interlaboratory validation study report.
• Sections 1.3, 4.1, 4.6, 9.1.2.1, 9.5.2, 10.3.3, 17.6.1.4.1, 17.6.1.4.2, 17.6.1.4.3, and Table 2 been revised to change estimated method detection limits (EMDLs) and estimated minimum levels of quantitation (EMLs) to MDLs and MLs.
• Reference 23 has been added to cite the MDL data from AXYS, TestAmerica-Knoxville, and Battelle-Columbus, and to explain how these data were processed to produce the pooled MDLs in Table 2.
• A sentence was added to Section 11.4.2.1 to require weighing the sample bottle after emptying, and to determine the volume using the density of water.
• ML definition revised to cite the ML procedure.
• A note was added to Section 10.3.3 to state that MDLs and MLs lower than those in Table 2 may be established per Section 17.6.1.4.1.
• Section 17.6.1.4.1 expanded to state how MDLs and MLs lower than those in Table 2 may be established.
• A footnote was added to Table 2 to cite Reference 23.
Summary of changes between EPA Method 1668A (8-20-03) and 1668B (January 2009) (excluding typographical and grammatical error corrections, and section insertions or deletions necessitated by the following changes).
• Based on the interlaboratory validation study, single-laboratory QC acceptance criteria are replaced with interlaboratory criteria (Table 6). A new footnote 1 to Table 6 references the EPA interlaboratory study report, and the other footnote numbers are incremented.
EPA Method 1668C iv April 2010
• Section 1.5, the performance-based discussion, describes additional flexibility to modify CWA Methods that is allowed by 40 CFR Part 136.6.
• Section 2.5.2 now indicates that internal standards are the labeled congeners spiked into the sample.
• Section 2.5.3 now indicates that injection internal standards are labeled compounds spiked into the extract.
• Section 5.4 is an added section on biohazards.
• Section 7.8 notes that Method 1668A part numbers are valid for Method 1668B.
• Section 8.1 allows use of alternate sample collection techniques, if documented.
• Section 8.2 adds that one liter, or a larger or smaller volume of sample, may be collected.
• Section 12.3 adds a note to indicate that SDS extraction may cause loss of some mono- through trichloro congeners.
• Section 12.5.6 states that a macro concentration device is to be used to concentrate extracts, and deletes the requirement for collection of the extract in a round-bottom flask because any macro concentration device may be used.
• Section 16.2 requires an expert spectrometrist to determine analyte presence when an interference precludes meeting the signal-to-noise requirement for dichloro-CB congeners.
• Section 21 cites the validation studies, and that performance data are in the interlaboratory validation study report.
• Reference 1 was updated to the 2006 World Health Organization paper on toxicity equivalency factors.
• References 4 and 17 add titles to the papers in these references.
• Reference 21 cites the Method 1668A Interlaboratory Validation Study Report.
• Tables 2 and A-1 revised the elution order for congeners 107-109.
• Table 4 defines the solutions containing congeners 107, 108, and 109.
• Table 6 contains revised QC acceptance criteria for performance tests, and footnote 1 to Table 6 references the Method 1668A Interlaboratory Validation Study Report.
• Table 7 adds footnote 2 to require meeting the 10:1 signal-to-noise specification at the CS-2 calibration level.
EPA Method 1668C v April 2010
Summary of corrections and changes to EPA Method 1668A as of August 20, 2003 (excluding typographical and grammatical error corrections, and section insertions or deletions necessitated by the following changes).
• Throughout: All references to IUPAC have been deleted. We have been informed that IUPAC does not assign congener numbers. Therefore, all references to congeners by number are to “congener number.” The congener naming system given by Guitart, et al. (Guitart R., Puig P., Gomez-Catalan J., Chemosphere 27 1451-1459, 1993) has been used in EPA Method 1668A since its inception and continues in this version.
• Sections 2.1.3, 12.4.2., 12.4.3, 12.4.5, and 12.4.9: Hexane has be deleted from the extraction solvent for fish and other tissue to preclude loss of the more volatile CBs.
• Section 7.7: A note has been added to reference the two known suppliers of labeled compounds.
• Section 7.15: A statement has been added to include certified reference materials (CRMs) from the National Resource Council of Canada.
• Sections 8.2.3, 8.3.2, and 8.4.2: The preservation temperature for shipment of samples has been changed to <6 °C to encompass the 4 ± 2 °C used by some organizations (e.g., USGS).
• Section 8.2.3: The requirement to preserve aqueous samples with sulfuric acid has been deleted because PCBs are stable in environmental samples, and the storage temperature for aqueous samples has been changed to <6 °C.
• Section 9.1.2.1: A statement has been added that a modification may be used routinely after it has been demonstrated to meet the QC acceptance criteria of the performance tests, so long as the other requirements in the Method are met (e.g., labeled compound recovery).
• Section 10.1.2.3: The word “approximately” has been inserted in the requirement to meet the retention times in Table 2 to reflect that slight changes in GC columns will produce slightly different retention times.
• Section 10.1.2.4: A statement has been added to indicate that the absolute and relative retention times in Table 2 were obtained under the GC conditions given in Section 10.1.1.
• Section 10.2.2: The text has been changed to clarify that the deviation between each monitored exact m/z and the theoretical m/z (Table 7) must be less than 5 ppm.
• Section 10.5: The text has been corrected to state that the diluted combined 209 congener solution (Section 7.10.2.2 and Table 5) is used for single-point calibration of the Native Toxics/LOC CBs.
• Section 12.4: A note has been added to allow use of a separate aliquot for percent lipid determination.
• Section 12.4.1: The minimum time required to dry the sample has been reduced from 12-24 hours to 30 minutes.
• Section 15.6: A requirement has been added to analyze one or more aliquots of solvent after the OPR if the CBs would be carried into the Method blank.
EPA Method 1668C vi April 2010
• Section 16.4: RRT QC limits may be based on the limits in Table 2 or limits developed from calibration data.
• Section 17.2.2: The units have been corrected to ng/mL
• Section 17.4: A multiplier of 1000 has been inserted in the equation to convert ng in extract to pg in sample.
• Section 18.5: A section has been added to suggest that the carbon column should be used if interferences preclude identification and/or quantitation of the Toxics.
• Table 2: The relative retention times have been changed to correct errors and reference each compound to the correct retention time and quantitation reference. The RT and RRT windows have been adjusted to attempt to unambiguously identify each congener in the presence of other congeners. Footnotes 7 and 8 have been revised to reflect this changes.
• Table 3: Units for the diluted combined 209 congener solution have been corrected to ng/mL as have the concentrations of the native compounds in the diluted combined 209 congener solution.
• Table 6: The lower QC acceptance criteria limit for the labeled monochloro- and dichloro-CBs has been lowered for the IPR, OPR, and recovery from samples to reflect that these compounds can be lost by evaporation.
• Table 7: Cl-3 scan descriptors have been added to Function 2 and the m/z types for the 13C12 Cl-4 PCBs have been corrected in Function 4.
• Table 8: The m/z’s forming the ratio, the ratio, and the QC limits have been corrected for decachlorobiphenyl.
• Table A1: The header has been corrected to delete reference to EMDLs and EMLs.
EPA Method 1668C vii April 2010
Disclaimer
Mention of trade names or commercial products does not constitute endorsement or recommendation for use.
Contact
Please address questions, comments, or suggestions to:
Richard Reding or Brian Englert c/o The OST CWA Methods Team Engineering and Analytical Support Branch Engineering and Analysis Division (4303T) Office of Science and Technology U.S. Environmental Protection Agency 1200 Pennsylvania Avenue Washington, DC 20460
E-mail: [email protected]
EPA Method 1668C viii April 2010
Method 1668C Chlorinated Biphenyl Congeners in Water, Soil, Sediment, Biosolids,
and Tissue by HRGC/HRMS
April 2010
1.0 Scope and Application
1.1 Method 1668C (the Method) is for determination of chlorinated biphenyl congeners (CBs) in wastewater and other matrices by high-resolution gas chromatography/high resolution mass spectrometry (HRGC/HRMS).
1.1.1 The CBs that can be determined by this Method are the 12 polychlorinated biphenyls (PCBs) designated as toxic by the World Health Organization (WHO): congeners 77, 81, 105, 114, 118, 123, 126, 156, 157, 167, 169, and 189. The Method also determines the remaining 197 CBs, approximately 125 of which are resolved adequately on an SPB-octyl gas chromatographic column to be determined as individual congeners. The remaining approximately 70 congeners are determined as mixtures of isomers (co-elutions).
1.1.2 The 12 PCBs designated as toxic by WHO (the “Toxics”; also known as dioxin-like PCBs; DLPCBs), and the earliest and latest eluted congener at each level of chlorination are determined by the isotope dilution quantitation technique; the remaining congeners are determined by the internal standard quantitation technique.
1.1.3 This Method allows determination of the PCB toxicity equivalent (TEQPCB) for the Toxics in a sample using toxicity equivalency factors (TEFs; Reference 1) and allows unique determination of 19 of 21 CBs of interest to the National Oceanic and Atmospheric Administration (NOAA; Reference 2). A second-column option is provided for resolution of the two toxic PCB congeners (congener 156 and 157) that are not resolved on the SPBoctyl column and for resolution of other CB congeners.
1.1.4 This Method also allows estimation of homolog totals by level of chlorination (LOC) and estimation of total CBs in a sample by summation of the concentrations of the CB congeners and congener groups.
1.1.5 The list of 209 CBs (Table 1) identifies the Toxics, the CBs of interest to NOAA, and the LOC CBs.
1.2 EPA developed this Method for use in Clean Water Act (CWA) programs and for wastewater, surface water, soil, sediment, biosolids and tissue matrices. Other applications and matrices may be possible, which may or may not require modifications of sample preparation, chromatographic conditions, etc. Method 1668C is a revision of previous versions of Method 1668 all of which are based on a compilation of methods from the technical literature (References 3 and 4), and EPA’s dioxins and furans Method, Method 1613.
1.3 The detection limits and quantitation levels in this Method are usually dependent on the level of interferences and laboratory background levels rather than instrumental limitations. The method detection limits (MDLs; 40 CFR 136, appendix B) and minimum levels of quantitation (MLs; 68 FR 11790) in Table 2 are the levels at which the CBs can be determined with no interferences present. The MDL for CB 126 in water is 16 pg/L (picograms-per-liter; parts-per-quadrillion).
EPA Method 1668C 1 April 2010
1.4 The GC/MS portions of this Method are for use only by analysts experienced with HRGC/HRMS or under the close supervision of such qualified persons. Each laboratory that uses this Method must demonstrate the ability to generate acceptable results using the procedure in Section 9.2.
1.5 This Method is “performance-based,” which means that you may make modifications without additional EPA review to improve performance (e.g., overcome interferences, or improve the sensitivity, accuracy or precision of the results) provided that you meet all performance criteria in this Method. Requirements for establishing equivalency are in Section 9.1.2, and include 9.1.2.2.3 – explaining the reason for your modifications. For CWA uses, additional flexibility is described at 40 CFR 136.6. You must document changes in performance, sensitivity, selectivity, precision, recovery, etc., that result from modifications within the scope of Part 136.6, and Section 9 of this Method, and how these modifications compare to the specifications in this Method. Changes outside the scope of Part 136.6 and Section 9 of this Method may require prior review or approval.
2.0 Summary of Method
Flow charts summarize procedures for sample preparation, extraction, and analysis for aqueous and solid samples, multi-phase samples, and tissue samples (Figures 1, 2 and 3, respectively.)
2.1 Extraction
2.1.1 Aqueous samples (samples containing less than one percent solids) – Stable isotopically labeled analogs of the Toxics and labeled LOC CBs are spiked into a 1-L sample. The sample is extracted using solid-phase extraction (SPE), separatory funnel extraction (SFE), or continuous liquid/liquid extraction (CLLE).
2.1.2 Solid, semi-solid, and multi-phase samples (excluding tissue) – The labeled compounds are spiked into a sample containing 10 g (dry weight) of solids. Samples containing multiple phases are pressure filtered and any aqueous liquid is discarded. Coarse solids are ground or homogenized. Any non-aqueous liquid from multi-phase samples is combined with the solids and extracted in a Soxhlet/Dean-Stark (SDS) extractor. The extract is concentrated for cleanup.
2.1.3 Fish and other tissue – A 20-g aliquot of sample is homogenized, and a 10-g aliquot is spiked with the labeled compounds. The sample is mixed with anhydrous sodium sulfate, allowed to dry for 12 - 24 hours, and extracted for 18-24 hours using methylene chloride in a Soxhlet extractor. The extract is evaporated to dryness, and the lipid content is determined.
2.2 After extraction, a labeled cleanup standard is spiked into the extract which is then cleaned up using back-extraction with sulfuric acid and/or base, and gel permeation, silica gel, or Florisil chromatography. Activated carbon and high-performance liquid chromatography (HPLC) can be used for further isolation of specific congener groups. Prior to the cleanup procedures cited above, tissue extracts are cleaned up using an anthropogenic isolation column.
2.3 After cleanup, the extract is concentrated to 20 µL. Immediately prior to injection, labeled injection internal standards are added to each extract and an aliquot of the extract is injected into the gas chromatograph (GC). The analytes are separated by the GC and detected by a high-resolution (≥10,000) mass spectrometer. Two exact m/z’s are monitored at each level of chlorination (LOC) throughout a pre-determined retention time window.
EPA Method 1668C 2 April 2010
2.4 An individual CB congener is identified by comparing the GC retention time and ion-abundance ratio of two exact m/z’s with the corresponding retention time of an authentic standard and the theoretical or acquired ion-abundance ratio of the two exact m/z’s. Isomer specificity for certain of the CB congeners is achieved using GC columns that resolve these congeners.
2.5 Quantitative analysis is performed in one of two ways using selected ion current profile (SICP) areas:
2.5.1 For the Toxics and the LOC CBs, the GC/MS is multi-point calibrated and the concentration is determined using the isotope dilution technique.
2.5.2 For all congeners other than the Toxics and LOC CBs, the GC/MS is calibrated at a single concentration and the concentrations are determined using the internal standard technique. The internal standards are the labeled congeners spiked into the sample, thus affording recovery correction for all congeners.
2.5.3 For the labeled Toxics, labeled LOC CBs, and the cleanup standards, the GC/MS is calibrated using replicates at a single concentration and the concentrations of these labeled compounds are determined using the internal standard technique. The labeled injection internal standards are determined using the internal standard technique.
2.6 The quality of the analysis is assured through reproducible calibration and testing of the extraction, cleanup, and HRGC/HRMS systems.
3.0 Definitions
Definitions are in the glossary at the end of this Method.
4.0 Contamination and interferences
4.1 Solvents, reagents, glassware, and other sample processing hardware may yield artifacts, elevated baselines, and/or lock-mass suppression causing misinterpretation of chromatograms. Specific selection of reagents and purification of solvents by distillation in all-glass systems may be required. Where possible, reagents are cleaned by extraction or solvent rinse. Environmentally abundant CBs have been shown to be very difficult to completely eliminate from the laboratory at levels lower than the MDLs in this Method (Table 2), and baking of glassware in a kiln or furnace at 450 - 500 ºC may be necessary to remove these and other contaminants.
4.2 Proper cleaning of glassware is extremely important, because glassware may not only contaminate the samples but may also remove the analytes of interest by adsorption on the glass surface.
4.2.1 Glassware should be rinsed with solvent and washed with a detergent solution as soon after use as is practical. Sonication of glassware containing a detergent solution for approximately 30 seconds may aid in cleaning. Glassware with removable parts, particularly separatory funnels with fluoropolymer stopcocks, must be disassembled prior to detergent washing.
4.2.2 After detergent washing, glassware should be rinsed immediately, first with methanol, then with hot tap water. The tap water rinse is followed by another methanol rinse, then acetone, and then methylene chloride.
EPA Method 1668C 3 April 2010
4.2.3 Baking of glassware in a kiln or other high temperature furnace (300 - 500 ºC) may be warranted after particularly dirty samples are encountered. The kiln or furnace should be vented to prevent laboratory contamination by CB vapors. Baking should be minimized, as repeated baking of glassware may cause active sites on the glass surface that may irreversibly adsorb CBs.
4.2.4 Immediately prior to use, the Soxhlet apparatus should be pre-extracted with toluene for approximately 3 hours (see Sections 12.3.1-12.3.3). The extraction apparatus (Section 6.4) should be rinsed with methylene chloride/toluene (80/20 mixture).
4.2.5 A separate set of glassware may to necessary to effectively preclude contamination when low-level samples are analyzed.
4.2.6 Concentration of extracts by Kuderna-Danish (K-D) concentrator and/or final concentration using nitrogen evaporation may help reduce levels of background PCBs in samples.
4.3 All materials used in the analysis must be demonstrated to be free from interferences by running reference matrix Method blanks (Section 9.5) initially and with each sample batch (samples started through the extraction process on a given 12-hour shift, to a maximum of 20 samples).
4.3.1 The reference matrix must simulate, as closely as possible, the sample matrix under test. Ideally, the reference matrix should not contain the CBs in detectable amounts, but should contain potential interferents in the concentrations expected to be found in the samples to be analyzed.
4.3.2 When a reference matrix that simulates the sample matrix under test is not available, reagent water (Section 7.6.1) can be used to simulate water samples; playground sand (Section 7.6.2) or white quartz sand (Section 7.3.2) can be used to simulate soils; filter paper (Section 7.6.3) can be used to simulate papers and similar materials; and corn oil (Section 7.6.4) can be used to simulate tissues.
4.4 Interferences co-extracted from samples will vary considerably from source to source, depending on the diversity of the site being sampled. Interfering compounds may be present at concentrations several orders of magnitude higher than the CBs. The most frequently encountered interferences are chlorinated dioxins and dibenzofurans, methoxy biphenyls, hydroxydiphenyl ethers, benzylphenyl ethers, brominated diphenyl ethers, polynuclear aromatics, polychlorinated naphthalenes, and pesticides. Because very low levels of CBs are measured by this Method, elimination of interferences is essential. The cleanup steps given in Section 13 can be used to reduce or eliminate these interferences and thereby permit reliable determination of the CBs at the levels shown in Table 2.
4.5 Each piece of reusable glassware should be numbered to associate that glassware with the processing of a particular sample. This will assist the laboratory in tracking possible sources of contamination for individual samples, identifying glassware associated with highly contaminated samples that may require extra cleaning, and determining when glassware should be discarded.
4.6 Contamination of calibration solutions – The MDLs and MLs in Table 2 are the levels that can be achieved in the absence of laboratory backgrounds. Many of the MLs are greater than the equivalent concentrations of the calibration solutions. To prevent contamination, calibration solutions must be prepared in an area free from CB contamination using glassware free from contamination. If these requirements cannot be met or are difficult to meet in the laboratory, the
EPA Method 1668C 4 April 2010

laboratory should prepare the calibration solutions in a contamination-free facility or have a vendor prepare the calibration standards and guarantee freedom from contamination.
4.7 Cleanup of tissue – The natural lipid content of tissue can interfere in the analysis of tissue samples for the CBs. The lipid contents of different species and portions of tissue can vary widely. Lipids are soluble to varying degrees in various organic solvents and may be present in sufficient quantity to overwhelm the column chromatographic cleanup procedures used for cleanup of sample extracts. Lipids must be removed by the anthropogenic isolation column procedure in Section 13.6, followed by the gel permeation chromatography procedure in Section 13.2. Florisil (Section 13.7) is recommended as an additional cleanup step.
4.8 If the laboratory air is a potential source of CB contamination, samples, reagents, glassware, and other materials should be dried in a glove box or other area free from contamination.
5.0 Safety
5.1 The toxicity or carcinogenicity of each chemical used in this Method has not been precisely determined; however, each compound should be treated as a potential health hazard. Exposure to these compounds should be reduced to the lowest possible level.
5.1.1 PCBs have been tentatively classified as known or suspected human or mammalian carcinogens. On the basis of the available toxicological and physical properties of the CBs, pure standards should be handled only by highly trained personnel thoroughly familiar with handling and cautionary procedures and the associated risks.
5.1.2 It is recommended that the laboratory purchase dilute standard solutions of the analytes in this Method. However, if primary solutions are prepared, they must be prepared in a hood, and a NIOSH/MESA approved toxic gas respirator must be worn when high concentrations are handled.
5.2 The laboratory is responsible for maintaining a current awareness file of OSHA regulations regarding the safe handling of the chemicals specified in this Method. A reference file of material safety data sheets (MSDSs) should also be made available to all personnel involved in these analyses. It is also suggested that the laboratory perform personal hygiene monitoring of each analyst who uses this Method and that the results of this monitoring be made available to the analyst. Additional information on laboratory safety can be found in References 5-8. The references and bibliography at the end of Reference 7 are particularly comprehensive in dealing with the general subject of laboratory safety.
5.3 The pure CBs and samples suspected to contain these compounds are handled using essentially the same techniques employed in handling radioactive or infectious materials. Well-ventilated, controlled access laboratories are required. Assistance in evaluating the health hazards of particular laboratory conditions may be obtained from certain consulting laboratories and from State Departments of Health or Labor, many of which have an industrial health service. Each laboratory must develop a strict safety program for handling these compounds. The practices in Reference 9 for handling chlorinated dibenzo-p-dioxins and dibenzofurans (CDDs/CDFs) are also recommended for handling the CBs.
5.3.1 Facility – When finely divided samples (dusts, soils, dry chemicals) are handled, all operations (including removal of samples from sample containers, weighing, transferring, and mixing) should be performed in a glove box demonstrated to be leak tight or in a fume
EPA Method 1668C 5 April 2010
hood demonstrated to have adequate air flow. Gross losses to the laboratory ventilation system must not be allowed. Handling of the dilute solutions normally used in analytical and animal work presents no inhalation hazards except in the case of an accident.
5.3.2 Protective equipment – Disposable plastic gloves, apron or lab coat, safety glasses or mask, and a glove box or fume hood adequate for radioactive work should be used. During analytical operations that may give rise to aerosols or dusts, personnel should wear respirators equipped with activated carbon filters. Eye protection (preferably full face shields) must be worn while working with exposed samples or pure analytical standards. Latex gloves are commonly used to reduce exposure of the hands. When handling samples suspected or known to contain high concentrations of the CBs, an additional set of gloves can also be worn beneath the latex gloves.
5.3.3 Training – Workers must be trained in the proper method of removing contaminated gloves and clothing without contacting the exterior surfaces.
5.3.4 Personal hygiene – Hands and forearms should be washed thoroughly after each manipulation and before breaks (coffee, lunch, and shift).
5.3.5 Confinement – Isolated work areas posted with signs, segregated glassware and tools, and plastic absorbent paper on bench tops will aid in confining contamination.
5.3.6 Effluent vapors – The effluent of the sample splitter from the gas chromatograph (GC) and from roughing pumps on the mass spectrometer (MS) should pass through either a column of activated charcoal or be bubbled through a trap containing oil or high-boiling alcohols to condense CB vapors.
5.3.7 Waste Handling – Good technique includes minimizing contaminated waste. Plastic bag liners should be used in waste cans. Janitors and other personnel should be trained in the safe handling of waste.
5.3.8 Decontamination
5.3.8.1 Decontamination of personnel – Use any mild soap with plenty of scrubbing action.
5.3.8.2 Glassware, tools, and surfaces – Chlorothene NU Solvent is a less toxic solvent that should be effective in removing CBs. Satisfactory cleaning may be accomplished by rinsing with Chlorothene, then washing with any detergent and water. If glassware is first rinsed with solvent, the wash water may be disposed of in the sewer. Given the cost of disposal, it is prudent to minimize solvent wastes.
5.3.9 Laundry – Clothing known to be contaminated should be collected in plastic bags. Persons that convey the bags and launder the clothing should be advised of the hazard and trained in proper handling. The clothing may be put into a washer without contact if the launderer knows of the potential problem. The washer should be run through a cycle before being used again for other clothing.
5.3.10 Wipe tests – A useful method of determining cleanliness of work surfaces and tools is to perform a wipe test of the surface suspected of being contaminated.
EPA Method 1668C 6 April 2010
5.3.10.1 Using a piece of filter paper moistened with Chlorothene or other solvent, wipe an area approximately 10 x 10 cm.
5.3.10.2 Extract and analyze the wipe by GC with an electron capture detector (ECD) or by this Method.
5.3.10.3 Using the area wiped (e.g., 10 x 10 cm = 0.01 m2), calculate the concentration in µg/m2. A concentration less than 1 µg/m2 indicates acceptable cleanliness; anything higher warrants further cleaning. More than 100 µg/m2 constitutes an acute hazard and requires prompt cleaning before further use of the equipment or work space, and indicates that unacceptable work practices have been employed.
5.4 Biosolids samples may contain high concentrations of biohazards, and must be handled with gloves and opened in a hood or biological safety cabinet to prevent exposure. Laboratory staff should know and observe the safety procedures required in a microbiology laboratory that handles pathogenic organisms when handling biosolids samples.
6.0 Apparatus and materials
Note: Brand names, suppliers, and part numbers are for illustration purposes only and no endorsement is implied. Equivalent performance may be achieved using apparatus and materials other than those specified here. Meeting the performance requirements of this Method is the responsibility of the laboratory.
6.1 Sampling equipment for discrete or composite sampling
6.1.1 Sample bottles and caps
6.1.1.1 Liquid samples (waters, sludges and similar materials containing 5 percent solids or less) – Sample bottle, amber glass, 1.1-L minimum, with screw cap.
6.1.1.2 Solid samples (soils, sediments, sludges, paper pulps, filter cake, compost, and similar materials that contain more than 5 percent solids) – Sample bottle, wide mouth, amber glass, 500-mL minimum.
6.1.1.3 If amber bottles are not available, samples must be protected from light.
6.1.1.4 Bottle caps – Threaded to fit sample bottles. Caps must be lined with fluoropolymer.
6.1.1.5 Cleaning
6.1.1.5.1 Bottles are detergent water washed, then solvent rinsed before use.
6.1.1.5.2 Liners are detergent water washed and rinsed with reagent water (Section 7.6.1).
6.1.2 Compositing equipment – Automatic or manual compositing system incorporating glass containers cleaned per bottle cleaning procedure above. Only glass or fluoropolymer tub-
EPA Method 1668C 7 April 2010
ing must be used. If the sampler uses a peristaltic pump, a minimum length of compressible silicone rubber tubing may be used in the pump only. Before use, the tubing must be thoroughly rinsed with methanol, followed by repeated rinsing with reagent water to minimize sample contamination. An integrating flow meter is used to collect proportional composite samples.
6.2 Equipment for glassware cleaning
Note: If blanks from bottles or other glassware or with fewer cleaning steps than required above show no detectable CB contamination, unnecessary cleaning steps and equipment may be eliminated.
6.2.1 Laboratory sink with overhead fume hood
6.2.2 Kiln – Capable of reaching 450 ºC within 2 hours and maintaining 450 - 500 ºC within ±10 ºC, with temperature controller and safety switch (Cress Manufacturing Co., Santa Fe Springs, CA, B31H, X31TS, or equivalent). See the precautions in Section 4.2.3.
6.3 Equipment for sample preparation
6.3.1 Laboratory fume hood of sufficient size to contain the sample preparation equipment listed below.
6.3.2 Glove box (optional)
6.3.3 Tissue homogenizer – VirTis Model 45 Macro homogenizer (American Scientific Products H-3515, or equivalent) with stainless steel Macro-shaft and Turbo-shear blade.
6.3.4 Meat grinder – Hobart, or equivalent, with 3- to 5-mm holes in inner plate.
6.3.5 Equipment for determining percent moisture
6.3.5.1 Oven – Capable of maintaining a temperature of 110 ±5 ºC
6.3.5.2 Desiccator
6.3.6 Balances
6.3.6.1 Analytical – Capable of weighing 0.1 mg
6.3.6.2 Top loading – Capable of weighing 10 mg
6.4 Extraction apparatus
6.4.1 Water samples
6.4.1.1 pH meter, with combination glass electrode
6.4.1.2 pH paper, wide range (Hydrion Papers, or equivalent)
6.4.1.3 Graduated cylinder, 1-L capacity
EPA Method 1668C 8 April 2010
6.4.1.4 Liquid/liquid extraction – Separatory funnels, 250-, 500-, and 2000-mL, with fluoropolymer stopcocks
6.4.1.5 Solid-phase extraction
6.4.1.5.1 1-L filtration apparatus, including glass funnel, frit support, clamp, adapter, stopper, filtration flask, and vacuum tubing (Figure 4). For wastewater samples, the apparatus should accept 90 or 144 mm disks. For drinking water or other samples containing low solids, smaller disks may be used.
6.4.1.5.2 Vacuum source – Capable of maintaining 25 in. Hg, equipped with shutoff valve and vacuum gauge
6.4.1.5.3 Glass-fiber filter – Whatman GMF 150 (or equivalent), 1 micron pore size, to fit filtration apparatus in Section 6.4.1.5.1
6.4.1.5.4 Solid-phase extraction disk containing octadecyl (C18) bonded silica uniformly enmeshed in an inert matrix – Fisher Scientific 14378F (or equivalent), to fit filtration apparatus in Section 6.4.1.5.1
6.4.1.6 Continuous liquid/liquid extraction (CLLE) – Fluoropolymer or glass connecting joints and stopcocks without lubrication, 1.5-2 L capacity (Hershberg-Wolf Extractor, Cal-Glass, Costa Mesa, California, 1000 mL or 2000 mL, or equivalent).
6.4.2 Soxhlet/Dean-Stark (SDS) extractor (Figure 5 and Reference 10) for filters and solid/sludge samples
6.4.2.1 Soxhlet – 50-mm ID, 200-mL capacity with 500-mL flask (Cal-Glass LG-6900, or equivalent, except substitute 500-mL round-bottom flask for 300-mL flat-bottom flask)
6.4.2.2 Thimble – 43 × 123 to fit Soxhlet (Cal-Glass LG-6901-122, or equivalent)
6.4.2.3 Moisture trap – Dean Stark or Barret with fluoropolymer stopcock, to fit Soxhlet
6.4.2.4 Heating mantle – Hemispherical, to fit 500-mL round-bottom flask (Cal-Glass LG-8801-112, or equivalent)
6.4.2.5 Variable transformer – Powerstat (or equivalent), 110-volt, 10-amp
6.4.3 Beakers – 400- to 500-mL
6.4.4 Spatulas – Stainless steel
6.5 Filtration apparatus
6.5.1 Pyrex glass wool – Solvent-extracted using a Soxhlet or SDS extractor for 3 hours minimum
6.5.2 Glass funnel – 125- to 250-mL
EPA Method 1668C 9 April 2010
6.5.3 Glass-fiber filter paper – Whatman GF/D (or equivalent), to fit glass funnel in Section 6.5.2.
6.5.4 Drying column – 15- to 20-mm ID Pyrex chromatographic column equipped with coarse-glass frit or glass-wool plug
6.5.5 Buchner funnel – 15-cm
6.5.6 Glass-fiber filter paper for Buchner funnel above
6.5.7 Filtration flasks – 1.5- to 2.0-L, with side arm
6.5.8 Pressure filtration apparatus – Millipore YT30 142 HW, or equivalent
6.6 Centrifuge apparatus
6.6.1 Centrifuge – Capable of rotating 500-mL centrifuge bottles or 15-mL centrifuge tubes at 5,000 rpm minimum
6.6.2 Centrifuge bottles – 500-mL, with screw-caps, to fit centrifuge
6.6.3 Centrifuge tubes – 12- to 15-mL, with screw-caps, to fit centrifuge
6.7 Cleanup apparatus
6.7.1 Automated gel permeation chromatograph (Analytical Biochemical Labs, Inc, Columbia, MO, Model GPC Autoprep 1002, or equivalent)
6.7.1.1 Column – 600-700 mm long × 25 mm ID glass, packed with 70 g of 200-400 mesh SX-3 Bio-beads (Bio-Rad Laboratories, Richmond, CA, or equivalent)
6.7.1.2 Syringe – 10-mL, with Luer fitting
6.7.1.3 Syringe filter holder – stainless steel, and glass-fiber or fluoropolymer filters (Gelman 4310, or equivalent)
6.7.1.4 UV detectors – 254-nm, preparative or semi-preparative flow cell (Isco, Inc., Type 6; Schmadzu, 5-mm path length; Beckman-Altex 152W, 8-µL micro-prep flow cell, 2-mm path; Pharmacia UV-1, 3-mm flow cell; LDC Milton-Roy UV3, monitor #1203; or equivalent).
6.7.2 Reverse-phase high-performance liquid chromatograph (Reference 4)
6.7.2.1 Pump – Perkin-Elmer Series 410, or equivalent
6.7.2.2 Injector – Perkin-Elmer ISS-100 Autosampler, or equivalent
6.7.2.3 6-Port switching valve – Valco N60, or equivalent
6.7.2.4 Column – Hypercarb, 100 x 4.6 mm, 5 µm particle size, Keystone Scientific, or equivalent
EPA Method 1668C 10 April 2010
6.7.2.5 Detector – Altex 110A (or equivalent) operated at 0.02 AUFS at 235 nm
6.7.2.6 Fraction collector – Isco Foxy II, or equivalent
6.7.3 Pipets
6.7.3.1 Disposable, Pasteur, 150-mm long x 5-mm ID (Fisher Scientific 13-678-6A, or equivalent)
6.7.3.2 Disposable, serological, 50-mL (8- to 10- mm ID)
6.7.4 Glass chromatographic columns
6.7.4.1 150-mm long x 8-mm ID, (Kontes K-420155, or equivalent) with coarse-glass frit or glass-wool plug and 250-mL reservoir
6.7.4.2 200-mm long x 15-mm ID, with coarse-glass frit or glass-wool plug and 250mL reservoir
6.7.4.3 300-mm long x 22-mm ID, with coarse-glass frit, 300-mL reservoir, and glass or fluoropolymer stopcock
6.7.5 Oven – For baking and storage of adsorbents, capable of maintaining a constant temperature ( ± 5 ºC) in the range of 105-250 ºC
6.8 Concentration apparatus
6.8.1 Rotary evaporator – Buchi/Brinkman-American Scientific No. E5045-10 or equivalent, equipped with a variable temperature water bath
6.8.1.1 Vacuum source for rotary evaporator equipped with shutoff valve at the evaporator and vacuum gauge
6.8.1.2 A recirculating water pump and chiller are recommended, as use of tap water for cooling the evaporator wastes large volumes of water and can lead to inconsistent performance as water temperatures and pressures vary.
6.8.1.3 Round-bottom flask – 100-mL and 500-mL or larger, with ground-glass fitting compatible with the rotary evaporator
6.8.2 Kuderna-Danish (K-D) concentrator
6.8.2.1 Concentrator tube – 10-mL, graduated (Kontes K-570050-1025, or equivalent) with calibration verified. Ground-glass stopper (size 19/22 joint) is used to prevent evaporation of extracts.
6.8.2.2 Evaporation flask – 500-mL (Kontes K-570001-0500, or equivalent), attached to concentrator tube with springs (Kontes K-662750-0012 or equivalent)
6.8.2.3 Snyder column – Three-ball macro (Kontes K-503000-0232, or equivalent)
EPA Method 1668C 11 April 2010
6.8.2.4 Boiling chips
6.8.2.4.1 Glass or silicon carbide – Approximately 10/40 mesh, extracted with methylene chloride and baked at 450 ºC for one hour minimum
6.8.2.4.2 Fluoropolymer (optional) – Extracted with methylene chloride
6.8.2.5 Water bath – Heated, with concentric ring cover, capable of maintaining a temperature within ± 2 ºC, installed in a fume hood
6.8.3 Nitrogen evaporation apparatus – Equipped with water bath controlled in the range of 30 60 ºC (N-Evap, Organomation Associates, Inc., South Berlin, MA, or equivalent), installed in a fume hood
6.8.4 Sample vials
6.8.4.1 Amber glass, 2- to 5-mL with fluoropolymer-lined screw-cap
6.8.4.2 Glass, 0.3-mL, conical, with fluoropolymer-lined screw or crimp cap
6.9 Gas chromatograph – Must have splitless or on-column injection port for capillary column, temperature program with isothermal hold, and must meet all of the performance specifications in Section 10.
6.9.1 GC column – Any GC column or column system (2 or more columns) that provides unique resolution and identification of the Toxics for determination of a TEQPCB using TEFs (Reference 1). Isomers may be unresolved so long as they have the same TEF and response factor and so long as these unresolved isomers are uniquely resolved from all other congeners. For example, the SPB-octyl column (Section 6.9.1.3) achieves unique GC resolution of all Toxics except congeners with congener numbers 156 and 157. This isomeric pair is uniquely resolved from all other congeners and these congeners have the same TEF and response factor.
6.9.1.1 If an SPB-octyl column is used, it must meet the specification in Section 6.9.1 and the following additional specifications:
6.9.1.1.1 The retention time for decachlorobiphenyl (DeCB; PCB 209) must be greater than 55 minutes.
6.9.1.1.2 The column must uniquely resolve congeners 34 from 23 and 187 from 182, and congeners 156 and 157 must co-elute within 2 seconds at the peak maximum. Unique resolution means a valley height less than 40 percent of the shorter of the two peaks that result when the Diluted combined 209 congener solution (Section 7.10.2.2) is analyzed (see Figures 6 and 7).
6.9.1.1.3 The column must be replaced when any of the criteria in Sections 6.9.1 - 6.9.1.1.2 are not met.
6.9.1.2 If a column or column system alternate to the SPB-octyl column is used, specifications similar to those for the SPB-octyl column (Sections 6.9.1 -
EPA Method 1668C 12 April 2010
6.9.1.1.2) must be developed and be functionally equivalent to those specifications.
6.9.1.3 Suggested column – 30 ± 5-m long x 0.25 ± 0.02-mm ID; 0.25-µm film SPBoctyl (Supelco 2-4218, or equivalent). This column is capable of meeting the requirements in Sections 6.9.1 - 6.9.1.1.2.
Note: The SPB-octyl column is subject to rapid degradation when exposed to oxygen. The analyst should exclude oxygen from the carrier gas, should eliminate air leaks, and should cool the injector, column, and transfer line before opening the column to the atmosphere. For further information on precluding oxidation, contact the column manufacturer.
6.9.1.4 Column for resolution of additional congeners – See Appendix A for details on the DB-1 column. The DB-1 column is optional and is capable of uniquely resolving the congener pair with congener numbers 156 and 157. When used in combination with the SPB-octyl column (Section 6.9.1.3), the two-column system is capable of resolving a total of approximately 180 CB congeners.
6.10 Mass spectrometer – 28- to 40-eV electron impact ionization, must be capable of selectively monitoring a minimum of 22 exact m/z’s minimum at high resolution (≥10,000) during a period less than 1.5 seconds, and must meet all of the performance specifications in Section 10.
6.11 GC/MS interface – The mass spectrometer (MS) must be interfaced to the GC such that the end of the capillary column terminates within 1 cm of the ion source but does not intercept the electron or ion beams.
6.12 Data system – Capable of collecting, recording, storing, and processing MS data
6.12.1 Data acquisition – The signal at each exact m/z must be collected repetitively throughout the monitoring period and stored on a mass storage device.
6.12.2 Response factors and multipoint calibrations – The data system must record and maintain lists of response factors (response ratios for isotope dilution) and multipoint calibrations. Computations of relative standard deviation (RSD) are be used to test calibration linearity. Statistics on initial (Section 9.4) and ongoing (Section 15.5.4) performance should be computed and maintained, either on the instrument data system, or on a separate computer system.
7.0 Reagents and standards
7.1 pH adjustment and back-extraction
7.1.1 Potassium hydroxide – Dissolve 20 g reagent grade KOH in 100 mL reagent water.
7.1.2 Sulfuric acid – Reagent grade (specific gravity 1.84)
7.1.3 Hydrochloric acid – Reagent grade, 6N
7.1.4 Sodium chloride – Reagent grade, prepare at 5% (w/v) solution in reagent water
EPA Method 1668C 13 April 2010
7.2 Solution drying and evaporation
7.2.1 Solution drying – Sodium sulfate, reagent grade, granular, anhydrous (Baker 3375, or equivalent), rinsed with methylene chloride (20 mL/g), baked at 400 ºC for 1 hour minimum, cooled in a desiccator, and stored in a pre-cleaned glass bottle with screw-cap that prevents moisture from entering. If, after heating, the sodium sulfate develops a noticeable grayish cast (due to the presence of carbon in the crystal matrix), that batch of reagent is not suitable for use and should be discarded. Extraction with methylene chloride (as opposed to simple rinsing) and baking at a lower temperature may produce sodium sulfate that is suitable for use.
7.2.2 Tissue drying – Sodium sulfate, reagent grade, powdered, treated and stored as in Section 7.2.1
7.2.3 Prepurified nitrogen
7.3 Extraction
7.3.1 Solvents – Acetone, toluene, cyclohexane, hexane, methanol, methylene chloride, isooctane, and nonane; distilled in glass, pesticide quality, lot-certified to be free of interferences
Note: Some solvents; e.g., isooctane and nonane, may need to be re-distilled to eliminate CB backgrounds.
7.3.2 White quartz sand, 60/70 mesh – For Soxhlet/Dean-Stark extraction (Aldrich Chemical, Cat. No. 27-437-9, or equivalent). Bake at 450 ºC for 4 hour minimum.
7.4 GPC calibration solution – Prepare a solution containing 2.5 mg/mL corn oil, 0.05 mg/mL bis(2ethylhexyl) phthalate (BEHP), 0.01 mg/mL methoxychlor, 0.002 mg/mL perylene, and 0.008 mg/mL sulfur, or at concentrations appropriate to the response of the detector.
7.5 Adsorbents for sample cleanup
7.5.1 Silica gel
7.5.1.1 Activated silica gel – 100-200 mesh, Supelco 1-3651 (or equivalent), 100-200 mesh, rinsed with methylene chloride, baked at 180 ºC for a minimum of 1 hour, cooled in a desiccator, and stored in a precleaned glass bottle with screw-cap that prevents moisture from entering.
7.5.1.2 Acid silica gel (30% w/w) – Thoroughly mix 44 g of concentrated sulfuric acid with 100 g of activated silica gel in a clean container. Break up aggregates with a stirring rod until a uniform mixture is obtained. Store in a screw-capped bottle with fluoropolymer-lined cap.
7.5.1.3 Basic silica gel – Thoroughly mix 30 g of 1N sodium hydroxide with 100 g of activated silica gel in a clean container. Break up aggregates with a stirring rod until a uniform mixture is obtained. Store in a screw-capped bottle with fluoropolymer-lined cap.
EPA Method 1668C 14 April 2010
7.5.1.4 Potassium silicate
7.5.1.4.1 Dissolve 56 g of high purity potassium hydroxide (Aldrich, or equivalent) in 300 mL of methanol in a 750- to 1000-mL flat-bottom flask.
7.5.1.4.2 Add 100 g of activated silica gel (Section 7.5.1.1) and a stirring bar, and stir on an explosion-proof hot plate at 60-70 ºC for 1-2 hours.
7.5.1.4.3 Decant the liquid and rinse the potassium silicate twice with 100mL portions of methanol, followed by a single rinse with 100 mL of methylene chloride.
7.5.1.4.4 Spread the potassium silicate on solvent-rinsed aluminum foil and dry for 2-4 hours in a hood. Observe the precaution in Section 4.8.
7.5.1.4.5 Activate overnight at 200-250 ºC prior to use.
7.5.2 Carbon
7.5.2.1 Carbopak C – (Supelco 1-0258, or equivalent)
7.5.2.2 Celite 545 – (Supelco 2-0199, or equivalent)
7.5.2.3 Thoroughly mix 18.0 g Carbopak C and 18.0 g Celite 545 to produce a 50% w/w mixture. Activate the mixture at 130 ºC for a minimum of 6 hours. Store in a desiccator.
Note: The carbon column has been included in this Method to allow separation of co-planar congeners 77, 126, and 169 from other congeners and interferences, should such separation be desired.
7.5.3 Anthropogenic isolation column – Pack the column in Section 6.7.4.3 from bottom to top with the following:
7.5.3.1 2 g silica gel (Section 7.5.1.1)
7.5.3.2 2 g potassium silicate (Section 7.5.1.4)
7.5.3.3 2 g granular anhydrous sodium sulfate (Section 7.2.1)
7.5.3.4 10 g acid silica gel (Section 7.5.1.2)
7.5.3.5 2 g granular anhydrous sodium sulfate
7.5.4 Florisil column
7.5.4.1 Florisil – PR grade, 60-100 mesh (U.S. Silica Corp, Berkeley Springs, WV, or equivalent). Alternatively, prepacked Florisil columns may be used. Use the following procedure for Florisil activation and column packing.
EPA Method 1668C 15 April 2010
7.5.4.1.1 Fill a clean 1- to 2-L bottle ½ to 2/3 full with Florisil and place in an oven at 130-150 ºC for a minimum of three days to activate the Florisil.
7.5.4.1.2 Immediately prior to use, dry pack a 300-mm x 22-mm ID glass column (Section 6.7.4.3) bottom to top with 0.5-1.0 cm of warm to hot anhydrous sodium sulfate (Section 7.2.1), 10-10.5 cm of warm to hot activated Florisil (Section 7.5.4.1.1), and 1-2 cm of warm to hot anhydrous sodium sulfate. Allow the column to cool and wet immediately with 100 mL of n-hexane to prevent water from entering.
7.5.4.2 Using the procedure in Section 13.7.3, establish the elution pattern for each carton of Florisil or each lot of Florisil columns received.
7.6 Reference matrices – Matrices in which the CBs and interfering compounds are not detected by this Method
7.6.1 Reagent water – Bottled water purchased locally, or prepared by passage through activated carbon
7.6.2 High-solids reference matrix – Playground sand or similar material. Prepared by extraction with methylene chloride and/or baking at 450 ºC for a minimum of 4 hours.
7.6.3 Paper reference matrix – Glass-fiber filter, Gelman type A, or equivalent. Cut paper to simulate the surface area of the paper sample being tested.
7.6.4 Tissue reference matrix – Corn or other vegetable oil.
7.6.5 Other matrices – This Method may be verified on any reference matrix by performing the tests in Section 9.2. Ideally, the matrix should be free of the CBs, but in no case must the background level of the CBs in the reference matrix exceed the minimum levels in Table 2. If low background levels of the CBs are present in the reference matrix, the spike level of the analytes used in Section 9.2 should be increased to provide a spike-to-background ratio of approximately 5 (Reference 11).
7.7 Standard solutions – Prepare from materials of known purity and composition or purchase as solutions or mixtures with certification to their purity, concentration, and authenticity. If the chemical purity is 98 % or greater, the weight may be used without correction to calculate the concentration of the standard. Observe the safety precautions in Section 5 and the recommendation in Section 5.1.2.
Note: Native PCB standards are available from several suppliers. 13C12-labeled congeners are available from Cambridge Isotope Laboratories and Wellington Laboratories, and may be available from other suppliers. Listing of these suppliers does not constitute a recommendation or endorsement for use. Part numbers are for reference only.
7.7.1 For preparation of stock solutions from neat materials, dissolve an appropriate amount of assayed reference material in solvent. For example, weigh 10 to 20 mg of PCB 126 to three significant figures in a 10-mL ground-glass-stoppered volumetric flask and fill to the mark with nonane. After the compound is completely dissolved, transfer the solution to a clean 15-mL vial with fluoropolymer-lined cap.
EPA Method 1668C 16 April 2010
7.7.2 When not being used, store standard solutions in the dark at room temperature in screw-capped vials with fluoropolymer-lined caps. Place a mark on the vial at the level of the solution so that solvent loss by evaporation can be detected. Replace the solution if solvent loss has occurred.
7.8 Native (unlabeled) stock solutions
Note: Some of the part numbers for solutions described below contain the identifier “1668A.” These part numbers remain valid for Method 1668C.
7.8.1 Native Toxics/LOC stock solution – Prepare to contain the native Toxics and LOC CBs at the concentrations shown in Table 3, or purchase Accu-Standard M1668A-C-NT-LOCWD-GCPC, or equivalent. If additional CBs are to be determined by isotope dilution (e.g., 170 and 180), include the additional native compounds in this stock solution.
7.8.2 Native 209 CB congener stock solutions – Solutions containing CB congeners to calibrate the SPB-octyl column.
Note: If a column other than the SPB-octyl column is used, solutions that will allow separation of all 209 congeners on that column must be prepared.
7.8.2.1 Native congener mix stock solutions for separation of individual congeners on the SPB-octyl column – Prepare the five solutions with the congeners listed in Table 4 at the concentrations shown in Table 3 or purchase Accu-Standard M1668A-1, M-1668A-2, M-1668A-3, M-1668-4, and M-1668-5, or equivalent.
7.8.2.2 Combined 209 congener stock solution – Combine equal volumes of the standards in Section 7.8.2.1 to form a stock solution containing all CB congeners. This solution will be at 1/5 the concentration of the 5 individual solutions.
7.8.3 Stock solutions should be checked for signs of degradation prior to preparation of calibration or performance test standards. Reference standards that can be used to determine the accuracy of standard solutions are available from several vendors.
7.9 Labeled compound stock solutions (Table 3)
7.9.1 Labeled Toxics/LOC/window-defining stock solution – Prepare in isooctane or nonane at the concentrations in Table 3 or purchase Cambridge Isotope Laboratories (CIL) EC-4977, or equivalent. If additional CBs are to be determined by isotope dilution (e.g., 170 and 180), include the additional labeled compounds in this stock solution.
7.9.2 Labeled cleanup standard stock solution – Prepare labeled CBs 28, 111, and 178 in isooctane or nonane at the concentration shown in Table 3 or purchase CIL EC-4978, or equivalent.
7.9.3 Labeled injection internal standard stock solution – Prepare labeled CBs 9, 52, 101, 138, and 194 in nonane or isooctane at the concentrations shown in Table 3, or purchase CIL EC-4979, or equivalent.
EPA Method 1668C 17 April 2010
7.10 Calibration standards
7.10.1 Calibration standards – Combine and dilute the solutions in Sections 7.8.1 and 7.9 to produce the calibration solutions in Table 5 or purchase CIL EC-4976, or equivalent, for the CS-1 to CS-5 set of calibration solutions. If a 6-point calibration is used, prepare the CS-0.2 solution or purchase CIL EC-4976-0.2, or equivalent. These solutions permit the relative response (labeled to native) and response factor to be measured as a function of concentration. The CS-3 standard (CIL EC-4976-3, or equivalent) is used for calibration verification (VER).
7.10.2 Solutions of congener mixes
7.10.2.1 Diluted individual solutions
7.10.2.1.1 The 5 individual solutions, when analyzed individually, allow resolution of all 209 congeners on the SPB-octyl column, and are used for establishing retention time and other data for each congener. The elution order of the congeners present in each of the 5 solutions (Section 7.8.2.1) is given in Table 4.
7.10.2.1.2 Individually combine an aliquot of each individual mix stock solution (Section 7.8.2.1) with an aliquot of the Labeled Toxics/LOC/window-defining stock solution (Section 7.9.1), the Labeled cleanup standard stock solution (Section 7.9.2), and the Labeled injection internal standard stock solution (7.9.3) to produce concentrations of 100 ng/mL for the labeled compounds and 25, 50, and 75 ng/mL for the MoCB-TrCB, TeCB-HpCB, and OcCB-DeCB congeners, respectively, as shown in Table 3.
7.10.2.2 Diluted combined 209 congener solution
7.10.2.2.1 This solution combines the 5 individual mixes with the labeled compounds to allow single-point calibration of the congeners not included in the multi-point calibration, and establishes an average response factor for the co-eluting isomeric congeners.
7.10.2.2.2 Combine an aliquot of the combined 209 congener solution (Section 7.8.2.2) with an aliquot of the Labeled Toxics/LOC/window-defining stock solution (Section 7.9.1), the Labeled cleanup standard stock solution (Section 7.9.2), and the Labeled injection internal standard stock solution (7.9.3) to produce the same concentrations as in the diluted individual mix solutions (Section 7.10.2.1.2 and Table 3).
7.11 Native Toxics/LOC standard spiking solution – Used for determining initial precision and recovery (IPR; Section 9.2) and ongoing precision and recovery (OPR; Section 15.5). Dilute the Native Toxics/LOC stock solution (Section 7.8.1) with acetone to produce a concentration of the Toxics at 1 ng/mL, as shown in Table 3. When 1 mL of this solution spiked into the IPR (Section 9.2.1) or OPR (Section 15.5) and concentrated to a final volume of 20 µL, the concentration in the final volume will be 50 ng/mL (50 pg/µL). Prepare only the amount necessary for each reference matrix with each sample batch.
EPA Method 1668C 18 April 2010
7.12 Labeled Toxics/LOC/window-defining standard spiking solution – This solution is spiked into each sample (Section 9.3) and into the IPR (Section 9.2.1), OPR (Section 15.5), and blank (Section 9.5) to measure recovery. Dilute the Labeled Toxics/LOC/window-defining stock solution (Section 7.9.1) with acetone to produce a concentration of the labeled compounds at 2 ng/mL, as shown in Table 3. When 1 mL of this solution is spiked into an IPR, OPR, blank, or sample and concentrated to a final extract volume of 20 µL, the concentration in the final extract volume will be 100 ng/mL (100 pg/µL). Prepare only the amount necessary for each reference matrix with each sample batch.
7.13 Labeled cleanup standard spiking solution – This solution is spiked into each extract prior to cleanup to measure the efficiency of the cleanup process. Dilute the Labeled cleanup standard stock solution (Section 7.9.2) in methylene chloride to produce a concentration of the cleanup standards at 2 ng/mL, as shown in Table 3. When 1 mL of this solution is spiked into a sample extract and concentrated to a final volume of 20 µL, the concentration in the final volume will be 100 ng/mL (100 pg/µL).
7.14 Labeled injection internal standard spiking solution – This solution is added to each concentrated extract prior to injection into the HRGC/HRMS. Dilute the Labeled injection internal standard stock solution (Section 7.9.3) in nonane to produce a concentration of the injection internal standards at 1000 ng/mL, as shown in Table 3. When 2 µL of this solution is spiked into a 20 µL extract, the concentration of each injection internal standard will be nominally 100 ng/mL (100 pg/µL).
Note: The addition of 2 µL of the Labeled injection internal standard spiking solution to a 20-µL final extract has the effect of diluting the concentration of the components in the extract by 10%. Provided all calibration solutions and all extracts undergo this dilution as a result of adding the Labeled injection internal standard spiking solution, the effect of the 10% solution is compensated, and correction for this dilution should not be made.
7.15 QC Check Sample – A QC Check Sample should be obtained from a source independent of the calibration standards. Ideally, this check sample would be a certified Standard Reference Material (SRM) containing the CBs in known concentrations in a sample matrix similar to the matrix under test. The National Institute of Standards and Technology (NIST) in Gaithersburg, Maryland has SRMs, and the Institute for National Measurement Standards of the National Research Council of Canada in Ottawa has certified reference materials (CRMs) for CBs in various matrices.
7.16 Stability of solutions – Standard solutions used for quantitative purposes (Sections 7.9 through 7.14) should be assayed periodically (e.g., every 6 months) against SRMs from NIST (if available), or certified reference materials from a source that will attest to the authenticity and concentration, to assure that the composition and concentrations have not changed.
8.0 Sample collection, preservation, storage, and holding times
8.1 Collect samples in amber glass containers following conventional sampling practices (Reference 12). Other sample collection techniques, or sample volumes may be used, if documented.
8.2 Aqueous samples
8.2.1 Samples that flow freely are collected as grab samples or in refrigerated bottles using automatic sampling equipment. Collect one liter (or a larger or smaller volume) of sample sufficient to meet project needs.
EPA Method 1668C 19 April 2010
8.2.2 If residual chlorine is present, add 80 mg sodium thiosulfate per liter of water. EPA Methods 330.4 and 330.5 may be used to measure residual chlorine (Reference 13).
8.2.3 Maintain aqueous samples in the dark at less than 6 ºC from the time of collection until receipt at the laboratory. If the sample will be frozen, allow room for expansion. Store in the dark at less than 6 ºC.
8.3 Solid, mixed-phase, semi-solid, and oily samples, excluding tissue.
8.3.1 Collect samples as grab samples using wide-mouth jars.
8.3.2 Maintain solid, semi-solid, oily, and mixed-phase samples in the dark at less than 6 ºC from the time of collection until receipt at the laboratory. Store solid, semi-solid, oily, and mixed-phase samples in the dark at less than -10 ºC.
8.4 Fish and other tissue samples
8.4.1 Fish may be cleaned, filleted, or processed in other ways in the field, such that the laboratory may expect to receive whole fish, fish fillets, or other tissues for analysis.
8.4.2 Collect fish, wrap in aluminum foil, and maintain at less than 6 ºC from the time of collection until receipt at the laboratory, to a maximum time of 24 hours. If a longer transport time is necessary, freeze the sample. Ideally, fish should be frozen upon collection and shipped to the laboratory on dry ice.
8.4.3 Freeze tissue samples upon receipt at the laboratory and maintain them in the dark at less than -10 ºC until prepared. Maintain unused sample in the dark at less than -10 ºC.
8.5 Holding times
8.5.1 There are no demonstrated maximum holding times associated with the CBs in aqueous, solid, semi-solid, tissue, or other sample matrices. If stored in the dark at less than 6 ºC, aqueous samples may be stored for up to one year. Similarly, if stored in the dark at less than -10 ºC, solid, semi-solid, multi-phase, and tissue samples may be stored for up to one year.
8.5.2 Store sample extracts in the dark at less than -10 ºC until analyzed. If stored in the dark at less than -10 ºC, sample extracts may be stored for one year.
9.0 Quality assurance/quality control
9.1 Each laboratory that uses this Method is required to operate a formal quality assurance program (Reference 14). The minimum requirements of this program consist of an initial demonstration of laboratory capability, analysis of samples spiked with labeled compounds to evaluate and document data quality, and analysis of standards and blanks as tests of continued performance. Laboratory performance is compared to established performance criteria to determine if the results of analyses meet the performance characteristics of the Method.
If the Method is to be applied to sample matrix other than water (e.g., soils, filter cake, compost, tissue) the most appropriate alternate reference matrix (Sections 7.6.2 - 7.6.5 and 7.15) is substituted for the reagent water matrix (Section 7.6.1) in all performance tests.
EPA Method 1668C 20 April 2010
9.1.1 The laboratory must make an initial demonstration of the ability to generate acceptable precision and recovery with this Method. This demonstration is given in Section 9.2.
9.1.2 In recognition of advances that are occurring in analytical technology, and to overcome matrix interferences, the laboratory is permitted certain options to improve separations or lower the costs of measurements. These options include alternate extraction, concentration, and cleanup procedures, and changes in sample volumes, columns and detectors. Alternate determinative techniques, such as substitution of spectroscopic or immunoassay techniques for HRGC/HRMS technology, and changes that degrade Method performance, are not allowed without prior review and approval. If an analytical technique other than the techniques specified in this Method is used, that technique must have a specificity equal to or greater than the specificity of the techniques in this Method for the analytes of interest. (Note: For additional flexibility to make modifications without prior EPA review see 40 CFR Part 136.6.)
9.1.2.1 Each time a modification is made to this Method, the laboratory is required to repeat the procedure in Section 9.2. If MDLs would be affected by the change, the laboratory is required to demonstrate that the MDLs (40 CFR Part 136, Appendix B) are lower than one-third the regulatory compliance level or lower than five times the MDLs in this Method, whichever are greater. If calibration will be affected by the change, the instrument must be recalibrated per Section 10. Once the modification is demonstrated to produce results equivalent or superior to results produced by this Method as written, that modification may be used routinely thereafter, so long as the other requirements in this Method are met (e.g., labeled compound recovery).
9.1.2.2 The laboratory is required to maintain records of modifications made to this Method. These records include the following, at a minimum:
9.1.2.2.1 The names, titles, addresses, and telephone numbers of the analyst(s) that performed the analyses and modification, and of the quality control officer that witnessed and will verify the analyses and modifications.
9.1.2.2.2 A listing of pollutant(s) measured, by name and CAS Registry number.
9.1.2.2.3 A narrative stating reason(s) for the modifications (see Section 1.5).
9.1.2.2.4 Results from all quality control (QC) tests comparing the modified method to this Method, including:
a) Calibration (Section 10). b) Calibration verification (Section 15.3). c) Initial precision and recovery (Section 9.2). d) Labeled compound recovery (Section 9.3). e) Analysis of blanks (Section 9.5). f) Accuracy assessment (Section 9.4).
EPA Method 1668C 21 April 2010
9.1.2.2.5 Data that will allow an independent reviewer to validate each determination by tracing the instrument output (peak height, area, or other signal) to the final result. These data are to include:
a) Sample numbers and other identifiers. b) Extraction dates. c) Analysis dates and times. d) Analysis sequence/run chronology. e) Sample weight or volume (Section 11). f) Extract volume prior to each cleanup step (Section 13). g) Extract volume after each cleanup step (Section 13). h) Final extract volume prior to injection (Section 14). i) Injection volume (Section 14.3). j) Dilution data, differentiating between dilution of a sample or
extract (Section 17.5). k) Instrument and operating conditions. l) Column (dimensions, liquid phase, solid support, film
thickness, etc). m) Operating conditions (temperatures, temperature program, flow
rates). n) Detector (type, operating conditions, etc). o) Chromatograms, printer tapes, and other recordings of raw data. p) Quantitation reports, data system outputs, and other data to link
the raw data to the results reported.
9.1.2.3 Alternate HRGC columns and column systems – See Sections 6.9.1. If a column or column system alternate to those specified in this Method is used, that column or column system must meet the requirements in Section 6.9.1 - 6.9.1.1.3.
9.1.3 Analyses of Method blanks are required to demonstrate freedom from contamination (Section 4.3). The procedures and criteria for analysis of a Method blank are described in Sections 9.5 and 15.6.
9.1.4 The laboratory must spike all samples with labeled compounds to monitor Method performance. This test is described in Section 9.3. When results of these spikes indicate atypical Method performance for samples, the samples are diluted to bring Method performance within acceptable limits. Procedures for dilution are given in Section 17.5.
9.1.5 The laboratory must, on an ongoing basis, demonstrate through calibration verification and the analysis of the ongoing precision and recovery standard (OPR) and blanks that the analytical system is in control. These procedures are given in Sections 15.1 through 15.6.
9.1.6 The laboratory should maintain records to define the quality of data generated. Development of accuracy statements is described in Section 9.4.
9.2 Initial precision and recovery (IPR) – To establish the ability to generate acceptable precision and recovery, the laboratory must perform the following operations.
9.2.1 For low solids (aqueous) samples, extract, concentrate, and analyze four 1-L aliquots of reagent water spiked with 1 mL each of the Native Toxics/LOC spiking solution (Section 7.11), the Labeled Toxics/LOC/window-defining standard spiking solution (Section 7.12),
EPA Method 1668C 22 April 2010
and the Labeled cleanup standard spiking solution (Section 7.13), according to the procedures in Sections 11 through 18. For an alternative sample matrix, four aliquots of the alternative reference matrix (Section 7.6) are used. All sample processing steps that are to be used for processing samples, including preparation (Section 11), extraction (Section 12), and cleanup (Section 13), must be included in this test.
9.2.2 Using results of the set of four analyses, compute the average percent recovery (X) of the extracts and the relative standard deviation (RSD) of the concentration for each compound, by isotope dilution for CBs with a labeled analog, and by internal standard for CBs without a labeled analog and for the labeled compounds.
9.2.3 For each CB and labeled compound, compare RSD and X with the corresponding limits for initial precision and recovery in Table 6. If RSD and X for all compounds meet the acceptance criteria, system performance is acceptable and analysis of blanks and samples may begin. If, however, any individual RSD exceeds the precision limit or any individual X falls outside the range for recovery, system performance is unacceptable for that compound. Correct the problem and repeat the test (Section 9.2).
9.3 To assess Method performance on the sample matrix, the laboratory must spike all samples with the Labeled Toxics/LOC/window-defining standard spiking solution (Section 7.12) and all sample extracts with the Labeled cleanup standard spiking solution (Section 7.13).
9.3.1 Analyze each sample according to the procedures in Sections 11 through 18.
9.3.2 Compute the percent recovery of the labeled Toxics/LOC/window-defining congeners and the labeled cleanup congeners using the internal standard method (Section 17.2).
9.3.3 The recovery of each labeled compound must be within the limits in Table 6. If the recovery of any compound falls outside of these limits, Method performance is unacceptable for that compound in that sample. Additional cleanup procedures must then be employed to attempt to bring the recovery within the normal range. If the recovery cannot be brought within the normal range after all cleanup procedures have been employed, water samples are diluted and smaller amounts of soils, sludges, sediments, and other matrices are analyzed per Section 18.
9.4 It is suggested, but not required, that recovery of labeled compounds from samples be assessed and records maintained.
9.4.1 After the analysis of 30 samples of a given matrix type (water, soil, sludge, pulp, etc.) for which the labeled compounds pass the tests in Section 9.3, compute the average percent recovery (R) and the standard deviation of the percent recovery (SR) for the labeled compounds only. Express the assessment as a percent recovery interval from R - 2SR to R + 2SR for each matrix. For example, if R = 90% and SR = 10% for five analyses of pulp, the recovery interval is expressed as 70 to 110%.
9.4.2 Update the accuracy assessment for each labeled compound in each matrix on a regular basis (e.g., after each five to ten new measurements).
9.5 Method blanks – A reference matrix Method blank is analyzed with each sample batch (Section 4.3) to demonstrate freedom from contamination. The matrix for the Method blank must be similar to the sample matrix for the batch, e.g., a 1-L reagent water blank (Section 7.6.1), high-solids
EPA Method 1668C 23 April 2010
reference matrix blank (Section 7.6.2), paper matrix blank (Section 7.6.3); tissue blank (Section 7.6.4), or alternative reference matrix blank (Section 7.6.5).
9.5.1 Spike 1.0 mL each of the Labeled Toxics/LOC/window-defining standard spiking solution (Section 7.12), and the Labeled cleanup standard spiking solution (Section 7.13) into the Method blank, according to the procedures in Sections 11 through 18. Prepare, extract, clean up, and concentrate the Method blank. Analyze the blank immediately after analysis of the OPR (Section 15.5) to demonstrate freedom from contamination.
9.5.2 If any CB (Table 1) is found in the blank at greater than two times the minimum level (Table 2) or one-third the regulatory compliance limit, whichever is greater; or if any potentially interfering compound is found in the blank at the minimum level for each CB given in Table 2 (assuming a response factor of 1 relative to the quantitation reference in Table 2 at that level of chlorination for a potentially interfering compound; i.e., a compound not listed in this Method), analysis of samples must be halted until the sample batch is re-extracted and the extracts re-analyzed, and the blank associated with the sample batch shows no evidence of contamination at these levels. All samples must be associated with an uncontaminated Method blank before the results for those samples may be reported or used for permitting or regulatory compliance purposes.
9.6 QC Check Sample – Analyze the QC Check Sample (Section 7.15) periodically to assure the accuracy of calibration standards and the overall reliability of the analytical process. It is suggested that the QC Check Sample be analyzed at least quarterly.
9.7 The specifications contained in this Method can be met if the apparatus used is calibrated properly and then maintained in a calibrated state. The standards used for calibration (Section 10), calibration verification (Section 15.3), and for initial (Section 9.2) and ongoing (Section 15.5) precision and recovery should be identical, so that the most precise results will be obtained. A GC/MS instrument will provide the most reproducible results if dedicated to the settings and conditions required for determination of CBs by this Method.
9.8 Depending on specific program requirements, field replicates may be collected to determine the precision of the sampling technique, and spiked samples may be required to determine the accuracy of the analysis when the internal standard method is used.
10.0 Calibration
10.1 Establish the operating conditions necessary to meet the retention times (RTs) and relative retention times (RRTs) for the CBs in Table 2.
Note: RTs, RRTs, and RRT limits may differ slightly from those in Table 2.
10.1.1 Suggested GC operating conditions:
Injector temperature: 270 ºC Interface temperature: 290 ºC Initial temperature: 75 ºC Initial time: 2 minutes Temperature program: 75-150 ºC at 15 ºC/minute
150-290 ºC at 2.5 ºC/minute Final time: 1 minute
EPA Method 1668C 24 April 2010
Note: All portions of the column that connect the GC to the ion source should remain at or above the interface temperature specified above during analysis to preclude condensation of less volatile compounds.
The GC conditions may be optimized for compound separation and sensitivity. Once optimized, the same GC conditions must be used for the analysis of all standards, blanks, IPR and OPR standards, and samples.
10.1.2 Retention time calibration for the CB congeners
10.1.2.1 Separately inject each of the diluted individual congener solutions (Section 7.10.2.1.2). Establish the beginning and ending retention times for the scan descriptors in Table 7. Scan descriptors other than those listed in Table 7 may be used provided the MLs in Table 2 are met. Store the retention time (RT) and relative retention time (RRT) for each congener in the data system.
10.1.2.2 The absolute retention time of CB 209 must exceed 55 minutes on the SPBoctyl column; otherwise, the GC temperature program must be adjusted and this test repeated until the minimum retention time criterion is met. If a GC column or column system alternate to the SPB-octyl column is used, a similar minimum retention time specification must be established for the alternate column or column systems so that interferences that may be encountered in environmental samples will be resolved from the analytes of interest. This specification is deemed to be met if the retention time of CB 209 is greater than 55 minutes on such alternate column.
10.1.2.3 Inject the Diluted combined 209 congener solution (Section 7.10.2.2). Adjust the chromatographic conditions and scan descriptors until the RT and RRT for all congeners are approximately within the windows in Table 2 and the column performance specifications in Sections 6.9.1 - 6.9.1.2 are met. If an alternate column is used, adjust the conditions for that column. If column performance is unacceptable, optimize the analysis conditions or replace the column and repeat the performance tests. Confirm that the scan descriptor changes at times when CBs do not elute.
10.1.2.4 After the column performance tests are passed (Section 10.1.2.2 - 10.1.2.3), calculate and store the RT and RRT for the resolved congeners and the RT and RRT for the isomeric congeners that co-elute. The windows in Table 2 were developed based on the GC conditions given in Section 10.1.1.
10.2 Mass spectrometer (MS) resolution
10.2.1 Using perfluorokerosene (PFK) (or other reference substance) and a molecular leak, tune the instrument to meet the minimum required resolving power of 10,000 (10% valley) at m/z 330.9792 or any other significant PFK fragment in the range of 300 to 350. For each descriptor (Table 7), monitor and record the resolution and exact m/z’s of three to five reference peaks covering the mass range of the descriptor. The level of PFK (or other reference substance) metered into the HRMS during analyses should be adjusted so that the amplitude of the most intense selected lock-mass m/z signal (regardless of the descriptor number) does not exceed 10% of the full-scale deflection for a given set of detector
EPA Method 1668C 25 April 2010
parameters. Under those conditions, sensitivity changes that might occur during the analysis can be more effectively monitored.
Note: Different lots and types of PFK can contain varying levels of contamination, and excessive PFK (or other reference substance) may cause noise problems and contamination of the ion source necessitating increased frequency of source cleaning. A minor PFK mass (223.9872) is known to interfere with dichlorobiphenyl secondary quantitation ion (M+2). Careful selection of the grade and purity of PFK and minimization of the amount of PFK bled into the HRMS has been shown to correct this problem.
10.2.2 The analysis time for CBs may exceed the long-term mass stability of the mass spectrometer. Because the instrument is operated in the high-resolution mode, mass drifts of a few ppm (e.g., 5 ppm in mass) can have serious adverse effects on instrument performance. Therefore, mass-drift correction is mandatory and a lock-mass m/z from PFK or other reference substance is used for drift correction. The lock-mass m/z is dependent on the exact m/z’s monitored within each descriptor, as shown in Table 7. The deviation between each monitored exact m/z and the theoretical m/z (Table 7) must be less than 5 ppm.
10.2.3 Obtain a selected ion current profile (SICP) at the two exact m/z’s specified in Table 7 and at ≥10,000 resolving power at each LOC for the native congeners and congener groups and for the labeled congeners. Because of the extensive mass range covered in each function, it may not be possible to maintain 10,000 resolution throughout the mass range during the function. Therefore, resolution must be ≥8,000 throughout the mass range and must be ≥10,000 in the center of the mass range for each function.
10.2.4 If the HRMS has the capability to monitor resolution during the analysis, it is acceptable to terminate the analysis when the resolution falls below the minimum (Section 10.2.3) to save re-analysis time.
10.3 Ion abundance ratios, minimum levels, and signal-to-noise ratios. Choose an injection volume of either 1 or 2 µL, consistent with the capability of the HRGC/HRMS instrument. Inject a 1 or 2 µL aliquot of the CS-1 calibration solution (Table 5) using the GC conditions in Section 10.1.1.
10.3.1 Measure the SICP areas for each congener or congener group, and compute the ion abundance ratios at the exact m/z’s specified in Table 7. Compare the computed ratio to the theoretical ratio given in Table 8.
10.3.1.1 The exact m/z’s to be monitored in each descriptor are shown in Table 7. Each group or descriptor must be monitored in succession as a function of GC retention time to ensure that the CBs of interest are detected. Additional m/z’s may be monitored in each descriptor, and the m/z’s may be divided among more than the descriptors listed in Table 7, provided that the laboratory is able to monitor the m/z’s of all CBs that may elute from the GC in a given LOC window. The laboratory must also monitor exact m/z’s for congeners at higher levels of chlorination to determine if fragments will compromise measurement of congeners at lower levels of chlorination.
10.3.1.2 The mass spectrometer must be operated in a mass-drift correction mode, using PFK (or other reference substance) to provide lock m/z’s. The lock mass for each group of m/z’s is shown in Table 7. Each lock mass must be monitored and must not vary by more than ± 20% throughout its respective retention time
EPA Method 1668C 26 April 2010
window. Variations of lock mass by more than 20% indicate the presence of co-eluting interferences that raise the source pressure and may significantly reduce the sensitivity of the mass spectrometer. Re-injection of another aliquot of the sample extract may not resolve the problem and additional cleanup of the extract may be required to remove the interference. A lock mass interference or suppression in a retention time region in which CBs and labeled compounds do not elute may be ignored.
10.3.2 All CBs and labeled compounds in the CS-1 standard must be within the QC limits in Table 8 for their respective ion abundance ratios; otherwise, the mass spectrometer must be adjusted and this test repeated until the m/z ratios fall within the limits specified. If the adjustment alters the resolution of the mass spectrometer, resolution must be verified (Section 10.2.3) prior to repeat of the test.
10.3.3 Verify that the HRGC/HRMS instrument achieves a minimum level (ML) for each congener no greater than 2 times the MLs in Table 2. The peaks representing the CBs and labeled compounds in the CS-1 calibration standard must have signal-to-noise ratios (S/N) ≥ 10; otherwise, the mass spectrometer must be adjusted and this test repeated until the minimum levels in Table 2 are met.
Note: The MDLs and MLs in Table 2 are based on the levels of contamination normally found in laboratories. Lower levels may be readily achievable if segregation and extensive cleaning of glassware are employed. If lower levels are achievable, these lower levels must be established as described in Section 17.6.1.4.1.
10.4 Calibration by isotope dilution – Isotope dilution is used for calibration of the Toxics/LOC CBs. The reference compound for each native compound its labeled analog, as listed in Table 2. A 5- or 6-point calibration encompassing the concentration range is prepared for each native congener.
10.4.1 For the Toxics/LOC CBs determined by isotope dilution, the relative response (RR) (labeled to native) vs. concentration in the calibration solutions (Table 5) is computed over the calibration range according to the procedures described below. Five calibration points are employed for less-sensitive HRMS instruments (e.g., VG 70); five or six points may be employed for more-sensitive instruments (e.g., Micromass Autospec Ultima).
10.4.2 The response of each Toxics/LOC CB relative to its labeled analog is determined using the area responses of both the primary and secondary exact m/z’s specified in Table 7, for each calibration standard, as follows:
(A1 + A2 ) Cn n lRR =(A1 + A2 ) Cl l n
where: A1n and A2n = The measured areas at the primary and secondary m/z’s for the PCB
A1l and A2l = The measured areas at the primary and secondary m/z’s for the labeled compound
Cl = The concentration of the labeled compound in the calibration standard (Table 4)
Cn = The concentration of the native compound in the calibration standard (Table 4)
EPA Method 1668C 27 April 2010
10.4.3 To calibrate the analytical system by isotope dilution, inject calibration standards CS-1 through CS-5 (Section 7.10 and Table 5) for a less sensitive instrument or CS-0.2 through CS-5 for a more sensitive instrument. Use a volume identical to the volume chosen in Section 10.3, the procedure in Section 14, and the conditions in Section 10.1.1. Compute and store the relative response (RR) for each Native Toxics/LOC CB at each concentration. Compute the average (mean) RR and the RSD of the 5 (or 6) RRs.
10.4.4 Linearity – If the RR for any Native Toxics/LOC CB is constant (less than 20% RSD), the average RR may be used for that congener; otherwise, the complete calibration curve for that congener must be used over the calibration range.
10.5 Calibration by internal standard – Internal standard calibration is applied to determination of the native CBs for which a labeled compound is not available, determination of the Labeled Toxics/LOC/window-defining congeners and Labeled cleanup congeners for performance tests and intra-laboratory statistics (Sections 9.4 and 15.5.4), and determination of the Labeled injection internal standards except for CB 178. The reference compound for each compound is listed in Table 2. For the native congeners (other than the Native Toxics/LOC CBs), calibration is performed at a single point using the Diluted combined 209 congener solution (Section 7.10.2.2 and Table 5). For the labeled compounds, calibration is performed using data from the 5 (or 6) points in the calibration for the Native Toxics/LOC CBs (Section 10.4).
10.5.1 Response factors – Internal standard calibration requires the determination of response factors (RF) defined by the following equation:
(A1 + A2 ) Cs s isRF =(A1is + A2is ) Cs
where: A1s and A2s = The measured areas at the primary and secondary m/z’s for the PCB A1is and A2is = The measured areas at the primary and secondary m/z’s for the internal
standard Cis = The concentration of the internal standard (Table 5) Cs = The concentration of the compound in the calibration standard (Table 5)
10.5.2 To single-concentration calibrate the analytical system for native CBs other than the Native Toxics/LOC CBs by internal standard, inject the Diluted combined 209 congener solution (Section 7.10.2.2 and Table 3). Use a volume identical to the volume chosen in Section 10.3, the procedure in Section 14, and the conditions in Section 10.1.1.
10.5.3 Compute and store the response factor (RF) for all native CBs except the Native Toxics/LOC CBs. Use the average (mean) response of the labeled compounds at each level of chlorination (LOC) as the quantitation reference, to a maximum of 5 labeled congeners, as shown in Table 2. For the combinations of isomeric congeners that co-elute, compute a combined RF for the co-eluted group. For example, for congener 122, the areas at the two exact m/z’s for 104L, 105L, 114L, 118L, and 123L are summed and the total area is divided by 5 (because there are 5 congeners in the quantitation reference).
Note: All labeled congeners at each LOC are used as reference to reduce the effect of an interference if a single congener is used as reference. Other quantitation references and procedures may be used provided that the results produced are as accurate as results produced by the quantitation references and procedures described in this Section.
EPA Method 1668C 28 April 2010
EPA Method 1668C 29 April 2010
10.5.4 Compute and store the response factor (RF) for the labeled compounds, except CB 138. For the Labeled Toxics/LOC/window-defining compounds and the Labeled cleanup standards, use the nearest eluted Labeled injection internal standard as the quantitation reference, as given in Table 2. The Labeled injection internal standards are referenced to CB 138, as shown in Table 2.
11.0 Sample preparation
11.1 Sample preparation involves modifying the physical form of the sample so that the CBs can be extracted efficiently. In general, the samples must be in a liquid form or in the form of finely divided solids in order for efficient extraction to take place. Table 9 lists the phases and suggested quantities for extraction of various sample matrices.
For samples known or expected to contain high levels of the CBs, the smallest sample size representative of the entire sample should be used (see Section 18). For all samples, the blank and IPR/OPR aliquots must be processed through the same steps as the sample to check for contamination and losses in the preparation processes.
11.1.1 For samples that contain particles, percent solids and particle size are determined using the procedures in Sections 11.2 and 11.3, respectively.
11.1.2 Aqueous samples – Because CBs may be bound to suspended particles, the preparation of aqueous samples is dependent on the solids content of the sample.
11.1.2.1 Aqueous samples containing one percent solids or less are prepared per Section 11.4 and extracted directly using one of the extraction techniques in Section 12.2.
11.1.2.2 For aqueous samples containing greater than one percent solids, a sample aliquot sufficient to provide 10 g of dry solids is used, as described in Section 11.5.
11.1.3 Solid samples are prepared using the procedure described in Section 11.5 followed by extraction using the SDS procedure in Section 12.3.
11.1.4 Multi-phase samples – The phase(s) containing the CBs is separated from the non-CB phase using pressure filtration and centrifugation, as described in Section 11.6. The CBs will be in the organic phase in a multi-phase sample in which an organic phase exists.
11.1.5 Procedures for grinding, homogenization, and blending of various sample phases are given in Section 11.7.
11.1.6 Tissue samples – Preparation procedures for fish and other tissues are given in Section 11.8.
11.2 Determination of percent suspended solids
Note: This aliquot is used for determining solids content of the sample, not for determination of CBs.

11.2.1 Aqueous liquids and multi-phase samples consisting of mainly an aqueous phase
11.2.1.1 Desiccate and weigh a GF/D filter (Section 6.5.3) to three significant figures.
11.2.1.2 Filter 10.0 ± 0.02 mL of well-mixed sample through the filter.
11.2.1.3 Dry the filter a minimum of 12 hours at 110 ±5 ºC and cool in a desiccator.
11.2.1.4 Calculate percent solids as follows:
weight of sample aliquot after drying (g) - weight of filter (g)% solids = x 100
10 g 11.2.2 Non-aqueous liquids, solids, semi-solid samples, and multi-phase samples in which the
main phase is not aqueous; but not tissues
11.2.2.1 Weigh 5 to 10 g of sample to three significant figures in a tared beaker.
11.2.2.2 Dry a minimum of 12 hours at 110 ± 5 ºC, and cool in a desiccator.
11.2.2.3 Calculate percent solids as follows:
weight of sample aliquot after drying (g)% solids = x 100 weight of sample aliquot before drying (g)
11.3 Estimation of particle size
11.3.1 Spread the dried sample from Section 11.2.2.2 on a piece of filter paper or aluminum foil in a fume hood or glove box.
11.3.2 Estimate the size of the particles in the sample. If the size of the largest particles is greater than 1 mm, the particle size must be reduced to 1 mm or less prior to extraction using the procedures in Section 11.7.
11.4 Preparation of aqueous samples containing one percent suspended solids or less
11.4.1 Aqueous samples containing one percent suspended solids or less are prepared using the procedure below and extracted using the one of the extraction techniques in Section 12.2.
11.4.2 Preparation of sample and QC aliquots
11.4.2.1 Mark the original level of the sample on the sample bottle for reference. Weigh the sample plus bottle to ± 1 g. After extraction (Section 12.2), re-weigh the sample bottle and convert the weight to volume assuming a density of 1.00 g/mL.
11.4.2.2 Spike 1.0 mL of the Labeled Toxics/LOC/window-defining standard spiking solution (Section 7.12) into the sample bottle. Cap the bottle and mix the sample by careful shaking. Allow the sample to equilibrate for 1 to 2 hours, with occasional shaking.
EPA Method 1668C 30 April 2010
11.4.2.3 For each sample or sample batch (to a maximum of 20 samples) to be extracted during the same 12-hour shift, place two 1.0-L aliquots of reagent water in clean sample bottles or flasks.
11.4.2.4 Spike 1.0 mL of the Labeled Toxics/LOC/window-defining standard spiking solution (Section 7.12) into both reagent water aliquots. One of these aliquots will serve as the Method blank.
11.4.2.5 Spike 1.0 mL of the Native Toxics/LOC standard spiking solution (Section 7.11) into the remaining reagent water aliquot. This aliquot will serve as the OPR (Section 15.5).
11.4.2.6 For extraction using SPE, add 5 mL of methanol to the sample and QC aliquots. Cap and shake the sample and QC aliquots to mix thoroughly, and proceed to Section 12.2 for extraction.
11.5 Preparation of samples containing greater than one percent solids
11.5.1 Weigh a well-mixed aliquot of each sample (of the same matrix type) sufficient to provide 10 g of dry solids (based on the solids determination in Section 11.2) into a clean beaker or glass jar.
11.5.2 Spike 1.0 mL of the Labeled Toxics/LOC/window-defining standard spiking solution (Section 7.12) into the sample.
11.5.3 For each sample or sample batch (to a maximum of 20 samples) to be extracted during the same 12 hour shift, weigh two 10-g aliquots of the appropriate reference matrix (Section 7.6) into clean beakers or glass jars.
11.5.4 Spike 1.0 mL of the Labeled Toxics/LOC/window-defining standard spiking solution (Section 7.12) into both reference matrix aliquots. Spike 1.0 mL of the Native Toxics/LOC standard spiking solution (Section 7.11) into one reference matrix aliquot. This aliquot will serve as the OPR (Section 15.5). The other aliquot will serve as the Method blank.
11.5.5 Stir or tumble and equilibrate the aliquots for 1 to 2 hours.
11.5.6 Decant excess water. If necessary to remove water, filter the sample through a glass-fiber filter and discard the aqueous liquid.
11.5.7 If particles >1 mm are present in the sample (as determined in Section 11.3.2), spread the sample on clean aluminum foil in a hood. After the sample is dry, grind to reduce the particle size (Section 11.7).
11.5.8 Extract the sample and QC aliquots using the SDS procedure in Section 12.3.
11.6 Multi-phase samples
11.6.1 Using the percent solids determined in Section 11.2.1 or 11.2.2, determine the volume of sample that will provide 10 g of solids, up to 1 L of sample.
11.6.2 Spike 1.0 mL of the Labeled Toxics/LOC/window-defining standard spiking solution (Section 7.12) into the amount of sample determined in Section 11.6.1, and into the OPR
EPA Method 1668C 31 April 2010
and blank. Spike 1.0 mL of the Native Toxics/LOC standard spiking solution (Section 7.11) into the OPR. Pressure filter the sample, blank, and OPR through Whatman GF/D glass-fiber filter paper (Section 6.5.3). If necessary to separate the phases and/or settle the solids, centrifuge these aliquots prior to filtration.
11.6.3 Discard any aqueous phase (if present). Remove any non-aqueous liquid present and reserve the maximum amount filtered from the sample (Section 11.6.1) or 10 g, whichever is less, for combination with the solid phase (Section 12.3.5).
11.6.4 If particles >1 mm are present in the sample (as determined in Section 11.3.2) and the sample is capable of being dried, spread the sample and QC aliquots on clean aluminum foil in a hood. Observe the precaution in Section 4.8.
11.6.5 After the aliquots are dry or if the sample cannot be dried, reduce the particle size using the procedures in Section 11.7 and extract the reduced-size particles using the SDS procedure in Section 12.3. If particles >1 mm are not present, extract the particles and filter in the sample and QC aliquots directly using the SDS procedure in Section 12.3.
11.7 Sample grinding, homogenization, or blending – Samples with particle sizes greater than 1 mm (as determined in Section 11.3.2) are subjected to grinding, homogenization, or blending. The method of reducing particle size to less than 1 mm is matrix-dependent. In general, hard particles can be reduced by grinding with a mortar and pestle. Softer particles can be reduced by grinding in a Wiley mill or meat grinder, by homogenization, or in a blender.
11.7.1 Each size-reducing preparation procedure on each matrix must be verified by running the tests in Section 9.2 before the procedure is employed routinely.
11.7.2 The grinding, homogenization, or blending procedures must be carried out in a glove box or fume hood to prevent particles from contaminating the work environment.
11.7.3 Grinding – Certain papers and pulps, slurries, and amorphous solids can be ground in a Wiley mill or heavy duty meat grinder. In some cases, reducing the temperature of the sample to freezing or to dry ice or liquid nitrogen temperatures can aid in the grinding process. Grind the sample aliquots from Sections 11.5.7 or 11.6.5 in a clean grinder. Do not allow the sample temperature to exceed 50 ºC. Grind the blank and reference matrix aliquots using a clean grinder.
11.7.4 Homogenization or blending – Particles that are not ground effectively, or particles greater than 1 mm in size after grinding, can often be reduced in size by high speed homogenization or blending. Homogenize and/or blend the particles or filter from Sections 11.5.7 or 11.6.5 for the sample, blank, and OPR aliquots.
11.7.5 Extract the aliquots using the SDS procedure in Section 12.3.
11.8 Fish and other tissues – Prior to processing tissue samples, the laboratory must determine the exact tissue to be analyzed. Common requests for analysis of fish tissue include whole fish-skin on, whole fish-skin removed, edible fish fillets (filleted in the field or by the laboratory), specific organs, and other portions. Once the appropriate tissue has been determined, the sample must be homogenized.
EPA Method 1668C 32 April 2010
11.8.1 Homogenization
11.8.1.1 Samples are homogenized while still frozen, where practical. If the laboratory must dissect the whole fish to obtain the appropriate tissue for analysis, the unused tissues may be rapidly refrozen and stored in a clean glass jar for subsequent use.
11.8.1.2 Each analysis requires 10 g of tissue (wet weight). Therefore, the laboratory should homogenize at least 20 g of tissue to allow for re-extraction of a second aliquot of the same homogenized sample, if re-analysis is required. When whole fish analysis is necessary, the entire fish is homogenized.
11.8.1.3 Homogenize the sample in a tissue homogenizer (Section 6.3.3) or grind in a meat grinder (Section 6.3.4). Cut tissue that is too large to feed into the grinder into smaller pieces. To assure homogeneity, grind three times.
11.8.1.4 Transfer approximately 10 g (wet weight) of homogenized tissue to a clean, tared, 400- to 500-mL beaker.
11.8.1.5 Transfer the remaining homogenized tissue to a clean jar with a fluoropolymerlined lid. Seal the jar and store the tissue at less than -10 ºC. Return any tissue that was not homogenized to its original container and store at less than -10 ºC.
11.8.2 QC aliquots
11.8.2.1 Prepare a Method blank by adding approximately 1-2 g of the oily liquid reference matrix (Section 7.6.4) to a 400- to 500-mL beaker.
11.8.2.2 Prepare a precision and recovery aliquot by adding 1-2 g of the oily liquid reference matrix (Section 7.6.4) to a separate 400- to 500-mL beaker. Record the weight to the nearest 10 mg. If the initial precision and recovery test is to be performed, use four aliquots; if the ongoing precision and recovery test is to be performed, use a single aliquot.
11.8.3 Spiking
11.8.3.1 Spike 1.0 mL of the Labeled Toxics/LOC/window-defining standard spiking solution (Section 7.12) into the sample, blank, and OPR aliquot.
11.8.3.2 Spike 1.0 mL of the Native Toxics/LOC standard spiking solution (Section 7.11) into the OPR aliquot.
11.8.4 Extract the aliquots using the procedures in Section 12.4.
12.0 Extraction and concentration
12.1 Extraction procedures include: solid-phase (Section 12.2.1), separatory funnel (Section 12.2.2), and continuous liquid/liquid (Section 12.2.3) for aqueous liquids; Soxhlet/Dean-Stark (Section 12.3) for solids and filters; and Soxhlet extraction (Section 12.4) for tissues. Acid/base back-extraction (Section 12.5) is used for initial cleanup of extracts.
EPA Method 1668C 33 April 2010
Macro-concentration procedures include: rotary evaporation (Section 12.6.1), heating mantle (Section 12.6.2), and Kuderna-Danish (K-D) evaporation (Section 12.6.3). Micro-concentration uses nitrogen evaporation (Section 12.7).
12.2 Extraction of aqueous liquids
12.2.1 Solid-phase extraction of samples containing less than one percent solids
12.2.1.1 Disk preparation
12.2.1.1.1 Remove the test tube from the suction flask (Figure 4). Place an SPE disk on the base of the filter holder and wet with methylene chloride. While holding a GMF 150 filter above the SPE disk with tweezers, wet the filter with methylene chloride and lay the filter on the SPE disk, making sure that air is not trapped between the filter and disk. Clamp the filter and SPE disk between the 1-L glass reservoir and the vacuum filtration flask.
12.2.1.1.2 Rinse the sides of the reservoir with approx 15 mL of methylene chloride using a squeeze bottle or pipet. Apply vacuum momentarily until a few drops appear at the drip tip. Release the vacuum and allow the filter/disk to soak for approx one minute. Apply vacuum and draw all of the methylene chloride through the filter/disk. Repeat the wash step with approx 15 mL of acetone and allow the filter/disk to air dry.
12.2.1.2 Sample extraction
12.2.1.2.1 Pre-wet the disk by adding approx 20 mL of methanol to the reservoir. Pull most of the methanol through the filter/disk, retaining a layer of methanol approx 2 mm thick on the filter. Do not allow the filter/disk to go dry from this point until the extraction is completed.
12.2.1.2.2 Add approx 20 mL of reagent water to the reservoir and pull most through, leaving a layer approx 2 mm thick on the filter/disk.
12.2.1.2.3 Allow the sample (Section 11.4.2.6) to stand for 1-2 hours, if necessary, to settle the suspended particles. Decant the clear layer of the sample, the blank (Section 11.4.2.4), or IPR/OPR aliquot (Section 11.4.2.5) into its respective reservoir and turn on the vacuum to begin the extraction. Adjust the vacuum to complete the extraction in no less than 10 minutes. For samples containing a high concentration of particles (suspended solids), the extraction time may be an hour or longer.
12.2.1.2.4 Before all of the sample has been pulled through the filter/disk, add approx 50 mL of reagent water to the sample bottle, swirl to suspend the solids (if present), and pour into the reservoir. Pull through the filter/disk. Use additional reagent water rinses until all solids are removed.
EPA Method 1668C 34 April 2010
12.2.1.2.5 Before all of the sample and rinses have been pulled through the filter/disk, rinse the sides of the reservoir with small portions of reagent water.
12.2.1.2.6 Partially dry the filter/disk under vacuum for approx 3 minutes.
12.2.1.3 Elution of the filter/disk
12.2.1.3.1 Release the vacuum, remove the entire filter/disk/reservoir assembly from the vacuum flask, and empty the flask. Insert a test tube for eluant collection into the flask. The test tube should have sufficient capacity to contain the total volume of the elution solvent (approx 50 mL) and should fit around the drip tip. The drip tip should protrude into the test tube to preclude loss of sample from spattering when vacuum is applied. Reassemble the filter/disk/reservoir assembly on the vacuum flask.
12.2.1.3.2 Wet the filter/disk with 4-5 mL of acetone. Allow the acetone to spread evenly across the disk and soak for 15-20 seconds. Pull the acetone through the disk, releasing the vacuum when approx 1 mm thickness remains on the filter.
12.2.1.3.3 Rinse the sample bottle with approx 20 mL of methylene chloride and transfer to the reservoir. Pull approx half of the solvent through the filter/disk and release the vacuum. Allow the filter/disk to soak for approx 1 minute. Pull all of the solvent through the disk. Repeat the bottle rinsing and elution step with another 20 mL of methylene chloride. Pull all of the solvent through the disk.
12.2.1.3.4 Release the vacuum, remove the filter/disk/reservoir assembly, and remove the test tube containing the sample solution. Quantitatively transfer the solution to a 250-mL separatory funnel and proceed to Section 12.5 for back-extraction.
12.2.2 Separatory funnel extraction
12.2.2.1 Pour the spiked sample (Section 11.4.2.2) into a 2-L separatory funnel. Rinse the bottle or flask twice with 5 mL of reagent water and add these rinses to the separatory funnel.
12.2.2.2 Add 60 mL methylene chloride to the empty sample bottle. Seal the bottle and shake 60 seconds to rinse the inner surface. Transfer the solvent to the separatory funnel, and extract the sample by shaking the funnel for 2 minutes with periodic venting. Allow the organic layer to separate from the aqueous phase for a minimum of 10 minutes. If an emulsion forms and is more than one-third the volume of the solvent layer, employ mechanical techniques to complete the phase separation (see note below). Drain the methylene chloride extract through a solvent-rinsed glass funnel approximately one-half full of granular anhydrous sodium sulfate (Section 7.2.1) supported on clean glass-fiber paper into a solvent-rinsed concentration device (Section 12.6).
EPA Method 1668C 35 April 2010
EPA Method 1668C 36 April 2010
Note: If an emulsion forms, the laboratory must employ mechanical techniques to complete the phase separation. The optimum technique depends upon the sample, but may include stirring, filtration through glass wool, use of phase separation paper, centrifugation, use of an ultrasonic bath with ice, addition of NaCl, or other physical methods. Alternatively, solid-phase (Section 12.2.1), CLLE (Section 12.2.3), or other extraction techniques may be used to prevent emulsion formation. Any alternative technique is acceptable so long as the requirements in Section 9.2 are met.
12.2.2.3 Extract the water sample two more times with 60-mL portions of methylene chloride. Drain each portion through the sodium sulfate into the concentrator. After the third extraction, rinse the separatory funnel with at least 20 mL of methylene chloride, and drain this rinse through the sodium sulfate into the concentrator. Repeat this rinse at least twice.
12.2.2.4 Concentrate the extract using one of the macro-concentration procedures in Section 12.6 and proceed to back extraction in Section 12.5. Set aside the concentration device for use after back extraction or other cleanup.
12.2.3 Continuous liquid/liquid extraction
12.2.3.1 Place 100-150 mL methylene chloride in each continuous extractor and 200-300 mL in each distilling flask.
12.2.3.2 Pour the sample(s), blank, and QC aliquots into the extractors. Rinse the sample containers with 50-100 mL methylene chloride and add to the respective extractors. Include all solids in the extraction process.
12.2.3.3 Begin the extraction by heating the flask until the methylene chloride is boiling. When properly adjusted, 1-2 drops of methylene chloride per second will fall from the condenser tip into the water. Extract for 16-24 hours.
12.2.3.4 Remove the distilling flask, estimate and record the volume of extract (to the nearest 100 mL), and pour the contents through a drying column containing 7 to 10 cm of granular anhydrous sodium sulfate into a 500-mL K-D evaporator flask equipped with a 10-mL concentrator tube. Rinse the distilling flask with 30-50 mL of methylene chloride and pour through the drying column. Concentrate and exchange to hexane per Section 12.6 and back extract per Section 12.5. Set aside the concentration device for use after back extraction or other cleanup.
12.3 SDS extraction of samples containing particles
Note: SDS extraction with toluene may cause loss of some of the mono- through tri- CB congeners. If this loss is excessive, use Soxhlet extraction with methylene chloride (Section 12.4) and increase the amount of powdered, anhydrous sodium sulfate as necessary to provide a free-flowing mixture.
12.3.1 Charge a clean extraction thimble (Section 6.4.2.2) with 5.0 g of 100/200 mesh silica (Section 7.5.1.1) topped with 100 g of quartz sand (Section 7.3.2).
Note: Do not disturb the silica layer throughout the extraction process.
12.3.2 Place the thimble in a clean extractor. Place 30 to 40 mL of toluene in the receiver and 200 to 250 mL of toluene in the flask.
12.3.3 Pre-extract the glassware by heating the flask until the toluene is boiling. When properly adjusted, 1 to 2 drops of toluene will fall per second from the condenser tip into the receiver. Extract the apparatus for a minimum of 3 hours.
12.3.4 After pre-extraction, cool and disassemble the apparatus. Rinse the thimble with toluene and allow to air dry.
12.3.5 Load the wet sample and/or filter from Sections 11.5.8, 11.6.5, or 11.7.5 and any non-aqueous liquid from Section 11.6.3 into the thimble and manually mix into the sand layer with a clean metal spatula, carefully breaking up any large lumps of sample.
12.3.6 Reassemble the pre-extracted SDS apparatus, and add a fresh charge of toluene to the receiver and reflux flask. Apply power to the heating mantle to begin re-fluxing. Adjust the reflux rate to match the rate of percolation through the sand and silica beds until water removal lessens the restriction to toluene flow. Frequently check the apparatus for foaming during the first 2 hours of extraction. If foaming occurs, reduce the reflux rate until foaming subsides.
12.3.7 Drain the water from the receiver at 1-2 hours and 8-9 hours, or sooner if the receiver fills with water. Reflux the sample for a total of 16-24 hours. Cool and disassemble the apparatus. Record the total volume of water collected.
12.3.8 Remove the distilling flask. Drain the water from the Dean-Stark receiver and add any toluene in the receiver to the extract in the flask.
12.3.9 Concentrate the extracts from particles to approximately 10 mL using the rotary evaporator (Section 12.6.1) or heating mantle (Section 12.6.2), transfer to a 250-mL separatory funnel, and proceed with back-extraction (Section 12.5). Set aside the concentration device for use after back-extraction or other cleanup.
12.4 Soxhlet extraction of tissue (References 3 and 15)
Note: This procedure includes determination of the lipid content of the sample (Sections 12.4.8 12.4.9), using the same sample extract that is analyzed by GC/MS. Alternatively, a separate sample aliquot may be used for the lipid determination. If a separate aliquot is used, use nitrogen to evaporate the main portion of the sample extract only to the extent necessary to effect the solvent exchange to nhexane, so that loss of low molecular weight CBs is avoided, i.e., it is not necessary to dry the main portion of the sample to constant weight (Section 12.4.8).
12.4.1 Add 30 to 40 g of powdered anhydrous sodium sulfate (Section 7.2.2) to each of the beakers (Section 11.8.4) and mix thoroughly. Cover the beakers with aluminum foil and dry until the mixture becomes a free-flowing powder (30 minutes minimum). Remix prior to extraction to prevent clumping.
12.4.2 Assemble and pre-extract the Soxhlet apparatus per Sections 12.3.1-12.3.4, except use methylene chloride for the pre-extraction and rinsing and omit the quartz sand.
12.4.3 Reassemble the pre-extracted Soxhlet apparatus and add a fresh charge of methylene chloride to the reflux flask.
12.4.4 Transfer the sample/sodium sulfate mixture (Section 12.4.1) to the Soxhlet thimble, and install the thimble in the Soxhlet apparatus.
EPA Method 1668C 37 April 2010
12.4.5 Rinse the beaker with several portions of solvent and add to the thimble. Fill the thimble/receiver with solvent. Extract for 18-24 hours.
12.4.6 After extraction, cool and disassemble the apparatus.
12.4.7 Quantitatively transfer the extract to a macro-concentration device (Section 12.6), and concentrate to near dryness. Set aside the concentration apparatus for re-use.
12.4.8 Complete the removal of the solvent using the nitrogen blow evaporation procedure (Section 12.7) and a water bath temperature of 60 ºC. Weigh the receiver, record the weight, and return the receiver to the blowdown apparatus, concentrating the residue until a constant weight is obtained.
12.4.9 Percent lipid determination
12.4.9.1 Redissolve the residue in the receiver in hexane and spike 1.0 mL of the Labeled cleanup standard spiking solution (Section 7.13) into the solution.
12.4.9.2 Transfer the residue/hexane to the anthropogenic isolation column (Section 13.6), retaining the boiling chips in the concentration apparatus. Use several rinses to assure that all material is transferred. If necessary, sonicate or heat the receiver slightly to assure that all material is re-dissolved. Allow the receiver to dry. Weigh the receiver and boiling chips.
12.4.9.3 Calculate the lipid content to the nearest three significant figures as follows:
weight of residue (g)% lipid = x 100 weight of tissue (g)
12.4.9.4 The laboratory should determine the lipid content of the blank, IPR, and OPR to assure that the extraction system is working effectively.
12.5 Back-extraction with base and acid
12.5.1 Back-extraction may not be necessary for some samples. For some samples, the presence of color in the extract may indicate that back-extraction is necessary. If back-extraction is not necessary, spike 1.0 mL of the Labeled cleanup standard spiking solution (Section 7.13) into the extract and concentrate the extract for cleanup or analysis (Sections 12.6 and 12.7). If back-extraction is necessary, spike 1.0 mL of the Labeled cleanup standard spiking solution (Section 7.13) into the separatory funnels containing the sample and QC extracts from Section 12.2.3.4 or 12.3.9.
12.5.2 Partition the extract against 50 mL of potassium hydroxide solution (Section 7.1.1). Shake for 2 minutes with periodic venting into a hood. Remove and discard the aqueous layer. Repeat the base washing until no color is visible in the aqueous layer, to a maximum of four washings. Minimize contact time between the extract and the base to prevent degradation of the CBs. Stronger potassium hydroxide solutions may be employed for back-extraction, provided that the laboratory meets the specifications for labeled compound recovery and demonstrates acceptable performance using the procedure in Section 9.2.
12.5.3 Partition the extract against 50 mL of sodium chloride solution (Section 7.1.4) in the same way as with base. Discard the aqueous layer.
EPA Method 1668C 38 April 2010
12.5.4 Partition the extract against 50 mL of sulfuric acid (Section 7.1.2) in the same way as with base. Repeat the acid washing until no color is visible in the aqueous layer, to a maximum of four washings.
12.5.5 Repeat the partitioning against sodium chloride solution and discard the aqueous layer.
12.5.6 Pour each extract through a drying column containing 7 to 10 cm of granular anhydrous sodium sulfate (Section 7.2.1) into a macro-concentration device (Section 12.6). If a concentration device was set aside from extraction, that concentration device may be reused. Rinse the separatory funnel with 30 to 50 mL of solvent, and pour through the drying column. Re-concentrate the sample and QC aliquots per Sections 12.6-12.7, and clean up the samples and QC aliquots per Section 13.
12.6 Macro-concentration – Extracts in toluene are concentrated using a rotary evaporator or a heating mantle; extracts in methylene chloride or hexane are concentrated using a rotary evaporator, heating mantle, or Kuderna-Danish apparatus.
Note: In the concentration procedures below, the extract must not be allowed to concentrate to dryness because the mono- through tri-chlorobiphenyls may be totally or partially lost.
12.6.1 Rotary evaporation – Concentrate the extracts in separate round-bottom flasks.
12.6.1.1 Assemble the rotary evaporator according to manufacturer's instructions, and warm the water bath to 45 ºC. On a daily basis, pre-clean the rotary evaporator by concentrating 100 mL of clean extraction solvent through the system. Archive both the concentrated solvent and the solvent in the catch flask for a contamination check if necessary. Between samples, three 2- to 3- mL aliquots of solvent should be rinsed down the feed tube into a waste beaker.
12.6.1.2 Attach the round-bottom flask containing the sample extract to the rotary evaporator. Slowly apply vacuum to the system, and begin rotating the sample flask.
12.6.1.3 Lower the flask into the water bath, and adjust the speed of rotation and the temperature as required to complete concentration in 15 to 20 minutes. At the proper rate of concentration, the flow of solvent into the receiving flask will be steady, but no bumping or visible boiling of the extract will occur.
Note: If the rate of concentration is too fast, analyte loss may occur.
12.6.1.4 When the liquid in the concentration flask has reached an apparent volume of approximately 2 mL, remove the flask from the water bath and stop the rotation. Slowly and carefully admit air into the system. Be sure not to open the valve so quickly that the sample is blown out of the flask. Rinse the feed tube with approximately 2 mL of solvent.
12.6.1.5 Proceed to Section 12.6.4 for preparation for back-extraction or micro-concentration and solvent exchange.
EPA Method 1668C 39 April 2010
12.6.2 Heating mantle – Concentrate the extracts in separate round-bottom flasks.
12.6.2.1 Add one or two clean boiling chips to the round-bottom flask, and attach a three-ball macro Snyder column. Prewet the column by adding approximately 1 mL of solvent through the top. Place the round-bottom flask in a heating mantle, and apply heat as required to complete the concentration in 15 to 20 minutes. At the proper rate of distillation, the balls of the column will actively chatter, but the chambers will not flood.
12.6.2.2 When the liquid has reached an apparent volume of approximately 10 mL, remove the round-bottom flask from the heating mantle and allow the solvent to drain and cool for at least 10 minutes. Remove the Snyder column and rinse the glass joint into the receiver with small portions of solvent.
12.6.2.3 Proceed to Section 12.6.4 for preparation for back-extraction or micro-concentration and solvent exchange.
12.6.3 Kuderna-Danish (K-D) – Concentrate the extracts in separate 500-mL K-D flasks equipped with 10-mL concentrator tubes. The K-D technique is used for solvents such as methylene chloride and hexane. Toluene is difficult to concentrate using the K-D technique unless a water bath fed by a steam generator is used.
12.6.3.1 Add 1 to 2 clean boiling chips to the receiver. Attach a three-ball macro Snyder column. Prewet the column by adding approximately 1 mL of solvent through the top. Place the K-D apparatus in a hot water bath so that the entire lower rounded surface of the flask is bathed with steam.
12.6.3.2 Adjust the vertical position of the apparatus and the water temperature as required to complete the concentration in 15 to 20 minutes. At the proper rate of distillation, the balls of the column will actively chatter but the chambers will not flood.
12.6.3.3 When the liquid has reached an apparent volume of 1 mL, remove the K-D apparatus from the bath and allow the solvent to drain and cool for at least 10 minutes. Remove the Snyder column and rinse the flask and its lower joint into the concentrator tube with 1 to 2 mL of solvent. A 5-mL syringe is recommended for this operation.
12.6.3.4 Remove the three-ball Snyder column, add a fresh boiling chip, and attach a two ball micro Snyder column to the concentrator tube. Prewet the column by adding approximately 0.5 mL of solvent through the top. Place the apparatus in the hot water bath.
12.6.3.5 Adjust the vertical position and the water temperature as required to complete the concentration in 5 to 10 minutes. At the proper rate of distillation, the balls of the column will actively chatter but the chambers will not flood.
12.6.3.6 When the liquid reaches an apparent volume of 0.5 mL, remove the apparatus from the water bath and allow to drain and cool for at least 10 minutes.
12.6.3.7 Proceed to 12.6.4 for preparation for back-extraction or micro-concentration and solvent exchange.
EPA Method 1668C 40 April 2010
12.6.4 Preparation for back-extraction or micro-concentration and solvent exchange
12.6.4.1 For back-extraction (Section 12.5), transfer the extract to a 250-mL separatory funnel. Rinse the concentration vessel with small portions of hexane, adjust the hexane volume in the separatory funnel to 10 to 20 mL, and proceed to back-extraction (Section 12.5).
12.6.4.2 For determination of the weight of residue in the extract, or for clean-up procedures other than back-extraction, transfer the extract to a blowdown vial using 2-3 rinses of solvent. Proceed with micro-concentration and solvent exchange (Section 12.7).
12.7 Micro-concentration and solvent exchange
12.7.1 Extracts to be subjected to GPC cleanup are exchanged into methylene chloride. Extracts to be cleaned up using silica gel, carbon, Florisil, and/or HPLC are exchanged into hexane.
12.7.2 Transfer the vial containing the sample extract to a nitrogen evaporation device. Adjust the flow of nitrogen so that the surface of the solvent is just visibly disturbed.
Note: A large vortex in the solvent may cause analyte loss.
12.7.3 Lower the vial into a 45 ºC water bath and continue concentrating.
12.7.3.1 If the extract or an aliquot of the extract is to be concentrated to dryness for weight determination (Sections 12.4.8 and 13.6.4), blow dry until a constant weight is obtained.
12.7.3.2 If the extract is to be concentrated for injection into the GC/MS or the solvent is to be exchanged for extract cleanup, proceed as follows:
12.7.4 When the volume of the liquid is approximately 100 µL, add 2 to 3 mL of the desired solvent (methylene chloride for GPC and HPLC, or hexane for the other cleanups) and continue concentration to approximately 100 µL. Repeat the addition of solvent and concentrate once more.
12.7.5 If the extract is to be cleaned up by GPC, adjust the volume of the extract to 5.0 mL with methylene chloride. If the extract is to be cleaned up by HPLC, concentrate the extract to 1.0 mL. Proceed with GPC or HPLC cleanup (Section 13.2 or 13.5, respectively).
12.7.6 If the extract is to be cleaned up by column chromatography (silica gel, Carbopak/Celite, or Florisil), bring the final volume to 1.0 mL with hexane. Proceed with column cleanup (Sections 13.3, 13.4, or 13.7).
12.7.7 If the extract is to be concentrated for injection into the GC/MS (Section 14), quantitatively transfer the extract to a 0.3-mL conical vial for final concentration, rinsing the larger vial with hexane and adding the rinse to the conical vial. Reduce the volume to approximately 100 µL. Add 20 µL of nonane to the vial, and evaporate the solvent to the level of the nonane. Seal the vial and label with the sample number. Store in the dark at room temperature until ready for GC/MS analysis. If GC/MS analysis will not be performed on the same day, store the vial at less than -10 ºC.
EPA Method 1668C 41 April 2010
13.0 Extract cleanup
13.1 Cleanup may not be necessary for relatively clean samples (e.g., treated effluents, groundwater, drinking water). If particular circumstances require the use of a cleanup procedure, the laboratory may use any or all of the procedures below or any other appropriate procedure. Before using a cleanup procedure, the laboratory must demonstrate that the requirements of Section 9.2 can be met using the cleanup procedure.
13.1.1 Gel permeation chromatography (Section 13.2) removes high molecular weight interferences that cause GC column performance to degrade. It should be used for all soil and sediment extracts. It may be used for water extracts that are expected to contain high molecular weight organic compounds (e.g., polymeric materials, humic acids). It should also be used for tissue extracts after initial cleanup on the anthropogenic isolation column (Section 13.6).
13.1.2 Acid, neutral, and basic silica gel (Section 13.3) and Florisil (Section 13.7) are used to remove non-polar and polar interferences.
13.1.3 Carbopak/Celite (Section 13.4) can be used to separate CBs 77, 126, and 169 from the mono- and di- ortho-substituted CBs, if desired.
13.1.4 HPLC (Section 13.5) is used to provide specificity for certain congeners and congener groups.
13.1.5 The anthropogenic isolation column (Section 13.6) is used for removal of lipids from tissue samples.
13.2 Gel permeation chromatography (GPC)
13.2.1 Column packing
13.2.1.1 Place 70 to 75 g of SX-3 Bio-beads (Section 6.7.1.1) in a 400- to 500-mL beaker.
13.2.1.2 Cover the beads with methylene chloride and allow to swell overnight (a minimum of 12 hours).
13.2.1.3 Transfer the swelled beads to the column (Section 6.7.1.1) and pump solvent through the column, from bottom to top, at 4.5 to 5.5 mL/minute prior to connecting the column to the detector.
13.2.1.4 After purging the column with solvent for 1 to 2 hours, adjust the column head pressure to 7 to 10 psig and purge for 4 to 5 hours to remove air. Maintain a head pressure of 7 to 10 psig. Connect the column to the detector (Section 6.7.1.4).
13.2.2 Column calibration
13.2.2.1 Load 5 mL of the GPC calibration solution (Section 7.4) into the sample loop.
13.2.2.2 Inject the GPC calibration solution and record the signal from the detector. The elution pattern will be corn oil, BEHP, methoxychlor, perylene, and sulfur.
EPA Method 1668C 42 April 2010
13.2.2.3 Set the “dump time” to allow >85% removal of BEHP and >85% collection of methoxychlor.
13.2.2.4 Set the “collect time” to the time of the sulfur peak maximum.
13.2.2.5 Verify calibration with the GPC calibration solution after every 20 extracts. Calibration is verified if the recovery of the methoxychlor is greater than 85%. If calibration is not verified, the system must be recalibrated using the GPC calibration solution, and the previous sample batch must be re-extracted and cleaned up using the calibrated GPC system.
13.2.3 Extract cleanup – GPC requires that the column not be overloaded. The column specified in this Method is designed to handle a maximum of 0.5 g of material from an aqueous, soil, or mixed-phase sample in a 5-mL extract, and has been shown to handle 1.5 g of lipid from a tissue sample in a 5-mL extract. If the extract is known or expected to contain more than these amounts, the extract is split into aliquots for GPC, and the aliquots are combined after elution from the column. The residue content of the extract may be obtained gravimetrically by evaporating the solvent from a 50-µL aliquot.
13.2.3.1 Filter the extract or load through the filter holder (Section 6.7.1.3) to remove particles. Load the 5.0-mL extract onto the column.
13.2.3.2 Elute the extract using the calibration data determined in Section 13.2.2. Collect the eluate in a clean 400- to 500-mL beaker. Allow the system to rinse for additional 10 minutes before injecting the next sample.
13.2.3.3 Rinse the sample loading tube thoroughly with methylene chloride between extracts to prepare for the next sample.
13.2.3.4 If an extract is encountered that could overload the GPC column to the extent that carry-over could occur, a 5.0-mL methylene chloride blank must be run through the system to check for carry-over.
13.2.3.5 Concentrate the eluate per Sections 12.6 and 12.7 for further cleanup or injection into the GC/MS.
13.3 Silica gel cleanup
13.3.1 Place a glass-wool plug in a 15-mm ID chromatography column (Section 6.7.4.2). Pack the column bottom to top with: 1 g silica gel (Section 7.5.1.1), 4 g basic silica gel (Section 7.5.1.3), 1 g silica gel, 8 g acid silica gel (Section 7.5.1.2), 2 g silica gel, and 4 g granular anhydrous sodium sulfate (Section 7.2.1). Tap the column to settle the adsorbents.
13.3.2 Pre-elute the column with 50 to 100 mL of hexane. Close the stopcock when the hexane is within 1 mm of the sodium sulfate. Discard the eluate. Check the column for channeling. If channeling is present, discard the column and prepare another.
13.3.3 Apply the concentrated extract to the column. Open the stopcock until the extract is within 1 mm of the sodium sulfate.
13.3.4 Rinse the receiver twice with 1-mL portions of hexane, and apply separately to the column. Elute the CBs with 25 mL of hexane and collect the eluate.
EPA Method 1668C 43 April 2010
13.3.5 Concentrate the eluate per Section 12.6 and 12.7 for further cleanup or injection into the HPLC or GC/MS.
13.3.6 For extracts of samples known to contain large quantities of other organic compounds, it may be advisable to increase the capacity of the silica gel column. This may be accomplished by increasing the strengths of the acid and basic silica gels. The acid silica gel (Section 7.5.1.2) may be increased in strength to as much as 40% w/w (6.7 g sulfuric acid added to 10 g silica gel). The basic silica gel (Section 7.5.1.3) may be increased in strength to as much as 33% w/w (50 mL 1N NaOH added to 100 g silica gel), or the potassium silicate (Section 7.5.1.4) may be used.
Note: The use of stronger acid silica gel (44% w/w) may lead to charring of organic compounds in some extracts. The charred material may retain some of the analytes and lead to lower recoveries of the CBs. Increasing the strengths of the acid and basic silica gel may also require different volumes of hexane than those specified above to elute the analytes from the column. The performance of the Method after such modifications must be verified by the procedure in Section 9.2.
13.4 Carbon column (Reference 16)
13.4.1 Cut both ends from a 50-mL disposable serological pipet (Section 6.7.3.2) to produce a 20cm column. Fire-polish both ends and flare both ends if desired. Insert a glass-wool plug at one end, and pack the column with 3.6 g of Carbopak/Celite (Section 7.5.2.3) to form an adsorbent bed 20 cm long. Insert a glass-wool plug on top of the bed to hold the adsorbent in place.
13.4.2 Pre-elute the column with 20 mL each in succession of toluene, methylene chloride, and hexane.
13.4.3 When the solvent is within 1 mm of the column packing, apply the n-hexane sample extract to the column. Rinse the sample container twice with 1-mL portions of hexane and apply separately to the column. Apply 2 mL of hexane to complete the transfer.
13.4.4 Elute the column with 25 mL of n-hexane and collect the eluate. This fraction will contain the mono- and di-ortho CBs. If carbon particles are present in the eluate, filter through glass-fiber filter paper.
13.4.5 Elute the column with 15 mL of methanol and discard the eluate. The fraction discarded will contain residual lipids and other potential interferents, if present.
13.4.6 Elute the column with 15 mL of toluene and collect the eluate. This fraction will contain CBs 77, 126, and 169. If carbon particles are present in the eluate, filter through glass-fiber filter paper.
13.4.7 Concentrate the fractions per Section 12.6 and 12.7 for further cleanup or injection into the HPLC or GC/MS.
EPA Method 1668C 44 April 2010
13.5 HPLC (References 4 and 17)
13.5.1 Column calibration
13.5.1.1 Prepare a calibration standard containing the Toxics and other congeners of interest at the concentrations of the stock solution in Table 3, or at a concentration appropriate to the response of the detector.
13.5.1.2 Inject the calibration standard into the HPLC and record the signal from the detector. Collect the eluant for reuse. Elution will be in the order of the diortho, mono-ortho, and non-ortho congeners.
13.5.1.3 Establish the collection time for the congeners of interest. Following calibration, flush the injection system with solvent to ensure that residual CBs are removed from the system.
13.5.1.4 Verify the calibration with the calibration solution after every 20 extracts. Calibration is verified if the recovery of the CBs is 75 to 125% compared to the calibration (Section 13.5.1.1). If calibration is not verified, the system must be recalibrated using the calibration solution, and the previous 20 samples must be re-extracted and cleaned up using the calibrated system.
13.5.2 Extract cleanup – HPLC requires that the column not be overloaded. The column specified in this Method is designed to handle a maximum of 5-50 µg of a given CB, depending on the congener (Reference 17). If the amount of material in the extract will overload the column, split the extract into fractions and combine the fractions after elution from the column.
13.5.2.1 Rinse the sides of the vial containing the sample and adjust to the volume required for the sample loop for injection.
13.5.2.2 Inject the sample extract into the HPLC.
13.5.2.3 Elute the extract using the calibration data determined in Section 13.5.1. Collect the fraction(s) in clean 20-mL concentrator tubes.
13.5.2.4 If an extract containing greater than 500 µg of total CBs is encountered, a blank must be run through the system to check for carry-over.
13.5.2.5 Concentrate the eluate per Section 12.7 for injection into the GC/MS.
13.6 Anthropogenic isolation column (Reference 3) – Used for removal of lipids from tissue extracts
13.6.1 Prepare the column as given in Section 7.5.3.
13.6.2 Pre-elute the column with 100 mL of hexane. Drain the hexane layer to the top of the column, but do not expose the sodium sulfate.
13.6.3 Load the sample and rinses (Section 12.4.9.2) onto the column by draining each portion to the top of the bed. Elute the CBs from the column into the apparatus used for concentration (Section 12.4.7) using 200 mL of hexane.
EPA Method 1668C 45 April 2010
13.6.4 Remove a small portion (e.g., 50 µL) of the extract for determination of residue content. Estimate the percent of the total that this portion represents. Concentrate the small portion to constant weight per Section 12.7.3.1. Calculate the total amount of residue in the extract. If more than 500 mg of material remains, repeat the cleanup using a fresh anthropogenic isolation column.
13.6.5 If necessary, exchange the extract to a solvent suitable for the additional cleanups to be used (Section 13.2-13.5 and 13.7).
13.6.6 Clean up the extract using the procedures in Sections 13.2-13.5 and 13.7. GPC (Section 13.2) and Florisil (Section 13.7) are recommended as minimum additional cleanup steps.
13.6.7 Following cleanup, concentrate the extract to 20 µL as described in Section 12.7 and proceed with the analysis in Section 14.
13.7 Florisil cleanup (Reference 18)
13.7.1 Begin to drain the n-hexane from the column (Section 7.5.4.1.2). Adjust the flow rate of eluant to 4.5-5.0 mL/min.
13.7.2 When the n-hexane is within 1 mm of the sodium sulfate, apply the sample extract (in hexane) to the column. Rinse the sample container twice with 1-mL portions of hexane and apply to the column.
13.7.3 Elute the mono-ortho and di-ortho CBs with approx 165 mL of n-hexane and collect the eluate. Elute the non-ortho co-planar CBs with approx 100 mL of 6% ether:hexane and collect the eluate. The exact volumes of solvents will need to be determined for each batch of Florisil. If the mono/di-ortho CBs are not to be separated from the non-ortho co-planar CBs, elute all CBs with 6% ether:hexane.
13.7.4 Concentrate the eluate(s) per Sections 12.6-12.7 for further cleanup or for injection into the HPLC or GC/MS.
14.0 HRGC/HRMS analysis
14.1 Establish the operating conditions given in Section 10.1.
14.2 Add 2 µL of the labeled injection internal standard spiking solution (Section 7.14) to the 20 µL sample extract immediately prior to injection to minimize the possibility of loss by evaporation, adsorption, or reaction. If an extract is to be reanalyzed and evaporation has occurred, do not add more labeled injection internal standard spiking solution. Rather, bring the extract back to its previous volume (e.g., 19 µL) with pure nonane (18 µL if 2 µL injections are used).
14.3 Inject 1.0 or 2.0 µL of the concentrated extract containing the Labeled injection internal standards using on-column or splitless injection. The volume injected must be identical to the volume used for calibration (Section 10.3).
14.3.1 Start the GC column initial isothermal hold upon injection. Start MS data collection after the solvent peak elutes.
EPA Method 1668C 46 April 2010
14.3.2 Monitor the exact m/z’s at each LOC throughout the LOC retention time window. Where warranted, monitor m/z’s associated with congeners at higher levels of chlorination to assure that fragments are not interfering with the m/z’s for congeners at lower levels of chlorination. Also where warranted, monitor m/z’s associated with interferents expected to be present.
14.3.3 Stop data collection after 13C12-DeCB has eluted. Return the column to the initial temperature for analysis of the next extract or standard.
15.0 System and laboratory performance
15.1 At the beginning of each 12-hour shift during which analyses are performed, GC/MS system performance and calibration are verified for all native CBs and labeled compounds. For these tests, analyze the diluted combined 209 congener solution (Section 7.10.2.2) to verify all performance criteria. Adjustment and/or recalibration (Section 10) must be performed until all performance criteria are met. Only after all performance criteria are met may samples, blanks, IPRs, and OPRs be analyzed.
15.2 MS resolution – Static resolving power checks must be performed at the beginning and at the end of each shift per Section 10.2.1. If analyses are performed on successive shifts, only the beginning of shift static resolving power check is required. If the requirement in Section 10.2.1 cannot be met, the problem must be corrected before analyses can proceed. If any of the samples in the previous shift may be affected by poor resolution, those samples must be re-analyzed.
15.3 Calibration verification
15.3.1 Inject and analyze the Diluted combined 209 congener solution (Section 7.10.2.2.2) using the procedure in Section 14.
15.3.2 The m/z abundance ratios for each native CB and labeled compound in the VER standard must be within the limits in Table 8; otherwise, the mass spectrometer must be adjusted until the m/z abundance ratios fall within the limits specified when the verification test is be repeated. If the adjustment alters the resolution of the mass spectrometer, resolution must be verified (Section 10.2.1) prior to repeat of the verification test.
15.3.3 The GC peak representing each native CB and labeled compound in the VER standard must be present with a S/N of at least 10; otherwise, the mass spectrometer must be adjusted and the verification test repeated.
15.3.4 Compute the recovery of the Toxics/LOC CBs by isotope dilution (Section 17.1) and the labeled compounds by internal standard (17.2). These recoveries are computed based on the calibration data in Section 10.
15.3.5 For each compound, compare the recovery with the calibration verification limit in Table 6. If all compounds meet the acceptance criteria, calibration has been verified and analysis of standards and sample extracts may proceed. If, however, any compound fails its respective limit, the measurement system is not performing properly. In this event, prepare a fresh calibration standard or correct the problem and repeat the resolution (Section 15.2) and verification (Section 15.3) tests, or recalibrate (Section 10). If recalibration is required, recalibration for the 209 congeners (Section 10.5) must also be performed.
EPA Method 1668C 47 April 2010
15.4 Retention times and GC resolution
15.4.1 Retention times
15.4.1.1 Absolute – The absolute retention times of the Labeled Toxics/LOC/window defining standard congeners (Section 7.12) in the verification test (Section 15.3) must be within ± 15 seconds of the respective retention times in the calibration or, if an alternate column or column system is employed, within ± 15 seconds of the respective retention times in the calibration for the alternate column or column system (Section 6.9.1.2).
15.4.1.2 Relative – The relative retention times of native CBs and labeled compounds in the verification test (Section 15.3) must be within their respective RRT limits in Table 2 or, if an alternate column or column system is employed, within their respective RRT limits for the alternate column or column system (Section 6.9.1.2).
15.4.1.3 If the absolute or relative retention time of any compound is not within the limits specified, the GC is not performing properly. In this event, adjust the GC and repeat the verification test (Section 15.3) or recalibrate (Section 10), or replace the GC column and either verify calibration or recalibrate.
15.4.2 GC resolution and minimum analysis time
15.4.2.1 As a final step in calibration verification, GC resolution and minimum analysis time are verified and response factors for congeners other than the Toxics and LOC CBs are updated.
15.4.2.2 The resolution and minimum analysis time specifications in Sections 6.9.1.1.2 and 6.9.1.1.1, respectively, must be met for the SPB-octyl column or, if an alternate column or column system is employed, must be met as specified for the alternate column or column system (Section 6.9.1.2). If these specifications are not met, the GC analysis conditions must be adjusted until the specifications are met, or the column must be replaced and the calibration verification tests repeated Sections 15.4.1 through 15.4.2.2), or the system must be recalibrated (Section 10).
15.4.2.3 After the resolution and minimum analysis time specifications are met, update the retention times and relative retention times for all congeners, and response factors for all congeners except the Toxics and LOC CBs. For the Toxics and LOC CBs, the multi-point calibration data must be used ( Section 10.4) and verified (Section 15.3.4).
15.5 Ongoing precision and recovery
15.5.1 Analyze the extract of the ongoing precision and recovery (OPR) aliquot (Section 11.4.2.5, 11.5.4, 11.6.2, or 11.8.3.2) prior to analysis of samples from the same batch.
15.5.2 Compute the percent recovery of the Toxics/LOC CBs by isotope dilution (Section 10.4). Compute the percent recovery of each labeled compound by the internal standard method (Section 10.5).
EPA Method 1668C 48 April 2010
15.5.3 For the Toxics/LOC CBs and labeled compounds, compare the recovery to the OPR limits given in Table 6. If all compounds meet the acceptance criteria, system performance is acceptable and analysis of blanks and samples may proceed. If, however, any individual concentration falls outside of the range given, the extraction/concentration processes are not being performed properly for that compound. In this event, correct the problem, re-prepare, extract, and clean up the sample batch and repeat the ongoing precision and recovery test (Section 15.5).
15.5.4 If desired, add results that pass the specifications in Section 15.5.3 to initial and previous ongoing data for each compound in each matrix. Update QC charts to form a graphic representation of continued laboratory performance. Develop a statement of laboratory accuracy for each congener in each matrix type by calculating the average percent recovery (R) and the standard deviation of percent recovery (SR). Express the accuracy as a recovery interval from R - 2SR to R + 2SR. For example, if R = 95% and SR = 5%, the accuracy is 85 to 105%.
15.6 Blank – Analyze the Method blank extracted with each sample batch immediately following analysis of the OPR aliquot to demonstrate freedom from contamination and freedom from carryover from the OPR analysis. If CBs will be carried from the OPR into the Method blank, analyze one or more aliquots of solvent between the OPR and the Method blank. The results of the analysis of the blank must meet the specifications in Section 9.5.2 before sample analyses may proceed.
16.0 Qualitative determination
A CB or labeled compound is identified in a standard, blank, or sample when all of the criteria in Sections 16.1 through 16.4 are met.
16.1 The signals for the two exact m/z’s in Table 7 must be present and must maximize within the same two scans.
16.2 The signal-to-noise ratio (S/N) for the GC peak at each exact m/z must be greater than or equal to 2.5 for each CB detected in a sample extract, and greater than or equal to 10 for all CBs in the calibration and verification standards (Sections 10.3.3 and 15.3.3).
Note: An interference between DiCB m/z 223.9974 and PFK m/z 223.9872 may preclude meeting the S/N requirement for the DiCB congeners. If identification is ambiguous, an experienced spectrometrist (Section 1.4) must determine the presence or absence of the congener.
16.3 The ratio of the integrated areas of the two exact m/z’s specified in Table 7 must be within the limit in Table 8, or within ± 15 percent of the ratio in the midpoint (CS-3) calibration or calibration verification (VER), whichever is most recent.
16.4 The relative retention time of the peak for a CB must be within the RRT QC limits specified in Table 2 or within similar limits developed from calibration data (Section 10.1.2). If an alternate column or column system is employed, the RRT for the CB must be within its respective RRT QC limits for the alternate column or column system (Section 6.9.1.2).
EPA Method 1668C 49 April 2010
Note: For native CBs determined by internal standard quantitation, a given CB congener may fall within more than one RT window and be mis-identified unless the RRT windows are made very narrow, as in Table 2. Therefore, consistency of the RT and RRT with other congeners and the labeled compounds may be required for rigorous congener identification. Retention time regression analysis may aid in this identification.
16.5 Because of congener overlap and the potential for interfering substances, it is possible that all of the identification criteria (Sections 16.1-16.4) may not be met. It is also possible that loss of one or more chlorines from a highly chlorinated congener may inflate or produce a false concentration for a less-chlorinated congener that elutes at the same retention time (see Section 18.5). If identification is ambiguous, an experienced spectrometrist (Section 1.4) must determine the presence or absence of the congener.
16.6 If the criteria for identification in Sections 16.1-16.5 are not met, the CB has not been identified and the result for that congener may not be reported or used for permitting or regulatory compliance purposes. If interferences preclude identification, a new aliquot of sample must be extracted, further cleaned up, and analyzed.
17.0 Quantitative determination
17.1 Isotope dilution quantitation
17.1.1 By adding a known amount of the Labeled Toxics/LOC/window-defining compounds to every sample prior to extraction, correction for recovery of the CBs can be made because the native compound and its labeled analog exhibit similar effects upon extraction, concentration, and gas chromatography. Relative responses (RRs) are used in conjunction with the calibration data in Section 10.4 to determine concentrations in the final extract, so long as labeled compound spiking levels are constant.
17.1.2 Compute the concentrations in the extract of the Native Toxics/LOC CBs using the RRs from the calibration data (Section 10.4) and following equation:
(A1 + A2 ) Cn n lC (ng/mL) = ex (A1l + A2l ) RR
where: Cex = concentration of the PCB in the extract (ng/mL) and the other terms are as
defined in Section 10.5.1
17.2 Internal standard quantitation and labeled compound recovery
17.2.1 Compute the concentrations in the extract of the labeled compounds (except labeled CB 178) and of the native compounds other than those in the Native Toxics/LOC standard using the response factors determined from calibration (Section 10.5) or calibration verification (Section 15.4.2.3) and the following equation:
EPA Method 1668C 50 April 2010
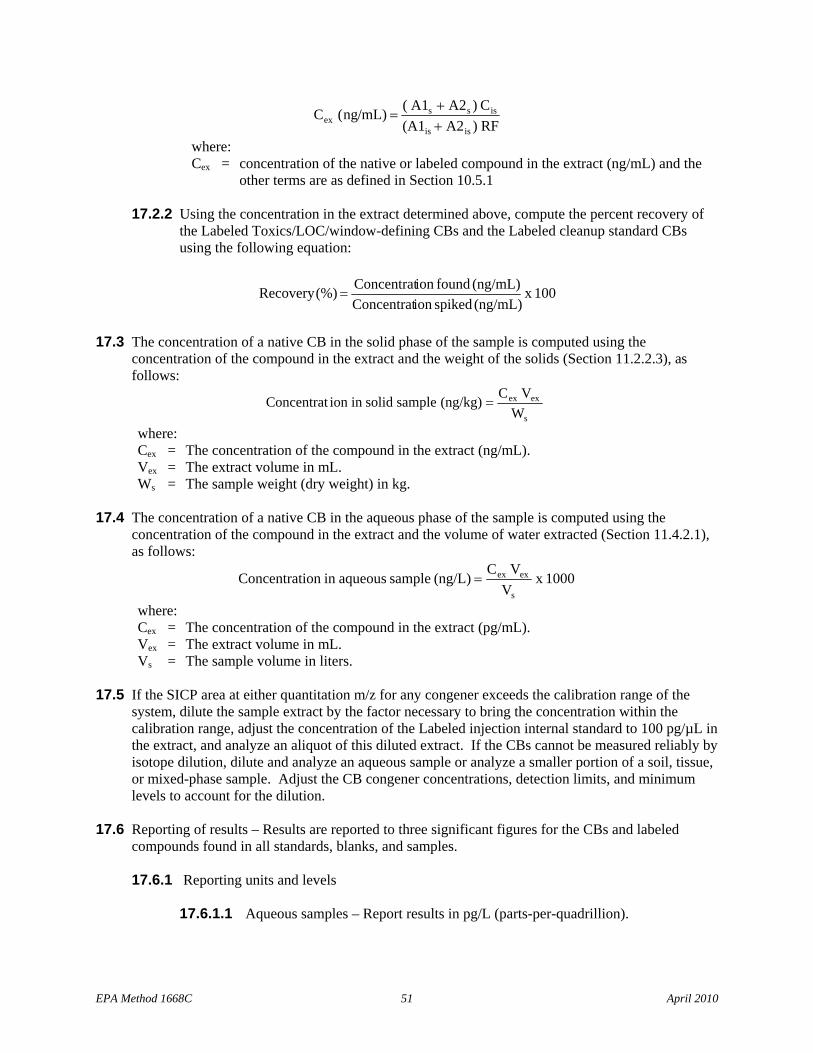
( A1 + A2 ) Cs s isCex (ng/mL) = (A1 + A2 ) RFis is
where: Cex = concentration of the native or labeled compound in the extract (ng/mL) and the
other terms are as defined in Section 10.5.1
17.2.2 Using the concentration in the extract determined above, compute the percent recovery of the Labeled Toxics/LOC/window-defining CBs and the Labeled cleanup standard CBs using the following equation:
Concentration found (ng/mL)Recovery(%) = x 100 Concentration spiked (ng/mL)
17.3 The concentration of a native CB in the solid phase of the sample is computed using the concentration of the compound in the extract and the weight of the solids (Section 11.2.2.3), as follows:
Cex VexConcentrat ion in solid sample (ng/kg) = Ws
where: Cex = The concentration of the compound in the extract (ng/mL). Vex = The extract volume in mL. Ws = The sample weight (dry weight) in kg.
17.4 The concentration of a native CB in the aqueous phase of the sample is computed using the concentration of the compound in the extract and the volume of water extracted (Section 11.4.2.1), as follows:
C Vex exConcentration in aqueous sample (ng/L) = x 1000 Vs
where: Cex = The concentration of the compound in the extract (pg/mL). Vex = The extract volume in mL. Vs = The sample volume in liters.
17.5 If the SICP area at either quantitation m/z for any congener exceeds the calibration range of the system, dilute the sample extract by the factor necessary to bring the concentration within the calibration range, adjust the concentration of the Labeled injection internal standard to 100 pg/µL in the extract, and analyze an aliquot of this diluted extract. If the CBs cannot be measured reliably by isotope dilution, dilute and analyze an aqueous sample or analyze a smaller portion of a soil, tissue, or mixed-phase sample. Adjust the CB congener concentrations, detection limits, and minimum levels to account for the dilution.
17.6 Reporting of results – Results are reported to three significant figures for the CBs and labeled compounds found in all standards, blanks, and samples.
17.6.1 Reporting units and levels
17.6.1.1 Aqueous samples – Report results in pg/L (parts-per-quadrillion).
EPA Method 1668C 51 April 2010
17.6.1.2 Samples containing greater than 1% solids (soils, sediments, filter cake, compost) – Report results in ng/kg based on the dry weight of the sample. Report the percent solids so that the result may be converted to aqueous units.
17.6.1.3 Tissues – Report results in ng/kg of wet tissue, not on the basis of the lipid content of the tissue. Report the percent lipid content, so that the data user can calculate the concentration on a lipid basis if desired.
17.6.1.4 Reporting level
17.6.1.4.1 Report the result for each congener at or above the minimum level of quantitation (ML; Table 2) for analyses of blanks, standards, and samples. The MLs in Table 2 are the levels that can be achieved in the presence of common laboratory contamination. A laboratory may establish an ML for a CB congener lower than the MLs in Table 2. MLs may be established as low as the lowest calibration point (Table 5) provided that the concentration of the congener in a minimum of 10 blanks for a sample medium (e.g., water, soil, sludge, tissue) is significantly below the ML in Table 2. “Significant” means that the ML for the congener is no less than 2 standard deviations above the mean (average) level in the minimum of 10 blanks (Reference 19). The blanks must be analyzed during the same period that samples are analyzed, ideally over an approximately 1-month period.
17.6.1.4.2 Standards (VER, IPR, OPR) and samples – Report the result for each congener at or above the ML (Table 2) to 3 significant figures. Report results below the ML as <ML (where ML is the concentration at the ML) or as required by the regulatory authority or permit.
17.6.1.4.3 Blanks – Report the result for each congener above the ML to 3 significant figures. Report a result below the ML but above the MDL to 2 significant figures. Report a result below the MDL as <MDL (where MDL is the concentration at the MDL) or as required by the regulatory authority or permit.
17.6.1.4.4 Blank correction – Blank-corrected results may be reported in addition to reporting of separate results for samples (Section 17.6.1.4.1) and blanks (Section 17.6.1.4.2). The recommended procedure for blank correction (Reference 19) is that a result is significantly above the blank level, and the level in the blank may be subtracted, if the result is 2 standard deviations above the mean (average) of results of analyses of 10 or more blanks for a sample medium.
17.6.2 Results for a CB in a sample that has been diluted are reported at the least dilute level at which the area at the quantitation m/z is within the calibration range (Section 17.5).
17.6.3 For a CB having a labeled analog, report results at the least dilute level at which the area at the quantitation m/z is within the calibration range (Section 17.5) and the labeled compound recovery is within the normal range for the Method (Section 9.3 and Table 6).
EPA Method 1668C 52 April 2010

17.6.4 If requested, the total concentration of all congeners at a given level of chlorination (homolog; i.e., total TrCB, total PeCB, total HxCB) may be reported by summing the concentrations of all congeners identified at that LOC, including both the Toxics and other congeners. Also if requested, total CBs may be reported by summing all congeners identified at all LOCs.
17.6.5 Reporting of coeluting PCB congeners–Optionally, Delaware River Basin Commission (DRBC) data qualifier flags and conventions for reporting coeluting congeners (see http://www.state.nj.us/drbc/PCB_info.htm), or other reporting convention agreed upon between the laboratory and the discharger/permittee or regulatory/control authority, may be used.
18.0 Analysis of complex samples
18.1 Some samples may contain high levels (>10 ng/L; >1000 ng/kg) of the compounds of interest, interfering compounds, and/or polymeric materials. Some extracts may not concentrate to 20 µL (Section 12.7.7); others may overload the GC column and/or mass spectrometer. Fragment ions from congeners at higher levels of chlorination may interfere with determination of congeners at lower levels of chlorination.
18.2 Analyze a smaller aliquot of the sample (Section 17.5) when the extract will not concentrate to 20 µL after all cleanup procedures have been exhausted. If a smaller aliquot of soils or mixed-phase samples is analyzed, attempt to assure that the sample is representative.
18.3 Perform integration of peak areas and calculate concentrations manually when interferences preclude computerized calculations.
18.4 Several laboratories have reported that backgrounds of many of the CB congeners are difficult to eliminate, and that these backgrounds can interfere with the determination of the CBs in environmental samples. Backgrounds of Toxics with congener numbers 105, 114, 118, 123, 156, 157, and 167 are common. The effects of contamination on results for these congeners should be understood in order to make a reliable determination.
18.5 Interferences may pose a problem in the determination of congeners 81, 123, 126, and 169 in some environmental samples. Loss of one or more chlorines from a highly chlorinated congener may inflate or produce a false concentration for a less-chlorinated congener that elutes at the same retention time. If, upon inspection of the chromatogram, the possibility of interferences is evident (e.g., high concentrations of fragments from loss of one or two chlorines from higher chlorinated closely eluting congeners), carbon column fractionation (Section 13.4) and analysis is recommended.
18.6 Recovery of labeled compounds – In most samples, recoveries of the labeled compounds will be similar to those from reagent water or from the alternate matrix (Section 7.6).
18.6.1 If the recovery of any of the labeled compounds is outside of the normal range (Table 6), a diluted sample must be analyzed (Section 17.5).
18.6.2 If the recovery of any of the labeled compounds in the diluted sample is outside of normal range, the Diluted combined 209 congener solution (Section 7.10.2.2.2) must be analyzed and calibration verified (Section 15.3).
EPA Method 1668C 53 April 2010
18.6.3 If the calibration cannot be verified, a new calibration must be performed and the original sample extract reanalyzed.
18.6.4 If calibration is verified and the diluted sample does not meet the limits for labeled compound recovery, the Method does not apply to the sample being analyzed and the result may not be reported or used for permitting or regulatory compliance purposes. In this case, alternate extraction and cleanup procedures in this Method or an alternate GC column must be employed to resolve the interference. If all cleanup procedures in this Method and an alternate GC column have been employed and labeled compound recovery remains outside of the normal range, extraction and/or cleanup procedures that are beyond this scope of this Method will be required to analyze the sample.
19.0 Pollution prevention
19.1 Pollution prevention encompasses any technique that reduces or eliminates the quantity or toxicity of waste at the point of generation. Many opportunities for pollution prevention exist in laboratory operation. EPA has established a preferred hierarchy of environmental management techniques that places pollution prevention as the management option of first choice. Whenever feasible, laboratory personnel should use pollution prevention techniques to address waste generation. When wastes cannot be reduced feasibly at the source, the Agency recommends recycling as the next best option.
19.2 The CBs in this Method are used in extremely small amounts and pose little threat to the environment when managed properly. Standards should be prepared in volumes consistent with laboratory use to minimize the disposal of excess volumes of expired standards.
19.3 For information about pollution prevention that may be applied to laboratories and research institutions, consult Less is Better: Laboratory Chemical Management for Waste Reduction, available from the American Chemical Society's Department of Governmental Relations and Science Policy, 1155 16th Street NW, Washington DC 20036, 202/872-4477.
20.0 Waste management
20.1 The laboratory is responsible for complying with all Federal, State, and local regulations governing waste management, particularly the hazardous waste identification rules and land disposal restrictions, and to protect the air, water, and land by minimizing and controlling all releases from fume hoods and bench operations. Compliance is also required with any sewage discharge permits and regulations. An overview of requirements can be found in Environmental Management Guide for Small Laboratories (EPA 233-B-98-001).
20.2 Samples containing HCl or H2SO4 to pH <2 are hazardous and must be neutralized before being poured down a drain or must be handled as hazardous waste.
20.3 The CBs decompose above 800 ºC. Low-level waste such as absorbent paper, tissues, animal remains, and plastic gloves may be burned in an appropriate incinerator. Gross quantities (milligrams) should be packaged securely and disposed of through commercial or governmental channels that are capable of handling extremely toxic wastes.
EPA Method 1668C 54 April 2010
20.4 Liquid or soluble waste should be dissolved in methanol or ethanol and irradiated with ultraviolet light with a wavelength shorter than 290 nm for several days. Use F40 BL or equivalent lamps. Analyze liquid wastes, and dispose of the solutions when the CBs can no longer be detected.
20.5 For further information on waste management, consult The Waste Management Manual for Laboratory Personnel and Less is Better-Laboratory Chemical Management for Waste Reduction, available from the American Chemical Society's Department of Government Relations and Science Policy, 1155 16th Street NW, Washington, DC 20036.
21.0 Method performance
The original version of Method 1668 was validated in single-laboratory studies at Pacific Analytical, Inc., Carlsbad, California and AXYS Analytical Services, Ltd., Sidney, British Columbia, Canada. The next version, Method 1668A, was validated and data were collected at AXYS Analytical (Reference 20). Method 1668A was subjected to peer review in 1999, and published in 2000. In 2003-2004, EPA conducted an interlaboratory method validation study of Method 1668A (Reference 21), subjected the study to a peer review, and subsequently published interlaboratory performance data in Method 1668B.
After release of Method 1668B, it was reported to EPA that some of the QC acceptance criteria in Method 1668B did not allow excursions above 100 percent. As a result, the QC acceptance criteria were re-developed using data from the interlaboratory study and data from AXYS Analytical and TestAmerica-Knoxville, Tennessee. The revised QC acceptance criteria were published in addendum to the Interlaboratory Study Report (Reference 22).
Subsequent to development of the revised QC acceptance criteria, AXYS Analytical, TestAmerica-Knoxville, and Battelle-Columbus provided method detection limit (MDL) data to EPA. These data were combined to produced pooled MDLs and MLs (Reference 23). Method 1668B was revised to Method 1668C to incorporate the revised QC acceptance criteria and revised MDLs and MLs.
Figure 8 is a chromatogram showing method performance at each level of chlorination.
22.0 References
1. Van den Berg, Martin, Linda S. Birnbaum, Michael Denison, Mike De Vito, William Farland, Mark Feeley, Heidelore Fiedler, Helen Hakansson, Annika Hanberg, Laurie Haws, Martin Rose, Stephen Safe, Dieter Schrenk, Chiharu Tohyama, Angelika Tritscher, Jouko Tuomisto, Mats Tysklind, Nigel Walker, and Richard E. Peterson, 2006, “The 2005 World Health Organization Reevaluation of Human and Mammalian Toxic Equivalency Factors for Dioxins and Dioxin-like Compounds,” Toxicological Sciences 93(2): 223-241.
2. “Sampling and Analytical Methods of the National Status and Trends Program Mussel Watch Project: 1993-1996 Update,” NOAA Technical Memorandum NOS ORCS 130, Coastal Monitoring and Bioeffects Assessment Division, Office of Ocean Resources Conservation and Assessment, National Ocean Service, National Oceanic and Atmospheric Administration, U.S. Department of Commerce, N/ORCA2, SSMC4, 1305 East-West Highway, Silver Spring, MD 20910, p. 3, 1998.
3. Kuehl, D.W., B.C. Butterworth, J. Libal, and P. Marquis, “An Isotope Dilution High Resolution Gas Chromatography-High Resolution Mass Spectrometric Method for the Determination of Coplanar
EPA Method 1668C 55 April 2010
Polychlorinated Biphenyls: Application to Fish and Marine Mammals,” Chemosphere 22:9-10, 849858, 1991.
4. Echols, Kathy, Robert Gale, Donald E. Tillitt, Ted Schwartz, and Jerome O'Laughlin, “An Automated HPLC Method for the Fractionation of Polychlorinated Biphenyls, Polychlorinated Dibenzo-p dioxins, and Polychlorinated Dibenzofurans in Fish Tissue on a Porous Graphitic Carbon Column,” Environmental Toxicology and Chemistry 16:8 1590-1597, 1997.
5. “Working with Carcinogens,” Department of Health, Education, & Welfare, Public Health Service, Centers for Disease Control, NIOSH, Publication 77-206, August 1977, NTIS PB-277256.
6. “OSHA Safety and Health Standards, General Industry,” OSHA 2206, 29 CFR 1910.
7. “Safety in Academic Chemistry Laboratories,” ACS Committee on Chemical Safety, 1979.
8. “Standard Methods for the Examination of Water and Wastewater,” 18th edition and later revisions, American Public Health Association, 1015 15th St, NW, Washington, DC 20005, 1-35: Section 1090 (Safety), 1992.
9. “Method 613 – 2,3,7,8-Tetrachlorodibenzo-p-dioxin,” 40 CFR 136, Appendix A, Section 4.1.
10. Lamparski, L.L., and Nestrick, T.J., “Novel Extraction Device for the Determination of Chlorinated Dibenzo-p-dioxins (PCDDs) and Dibenzofurans (PCDFs) in Matrices Containing Water,” Chemosphere, 19:27-31, 1989.
11. Provost, L.P., and Elder, R.S., “Interpretation of Percent Recovery Data,” American Laboratory, 15: 56-83, 1983.
12. “Standard Practice for Sampling Water,” ASTM Annual Book of Standards, ASTM, 1916 Race Street, Philadelphia, PA 19103-1187, 1980.
13. “Methods 330.4 and 330.5 for Total Residual Chlorine,” USEPA, EMSL, Cincinnati, OH 45268, EPA 600/4-70-020, April 1979.
14. “Handbook of Analytical Quality Control in Water and Wastewater Laboratories,” USEPA EMSL, Cincinnati, OH 45268, EPA-600/4-79-019, April 1979.
15. “Analytical Procedures and Quality Assurance Plan for the Determination of PCDD/PCDF in Fish”, U.S. Environmental Protection Agency, Environmental Research Laboratory, Duluth, MN 55804, EPA/600/3-90/022, April 1990.
16. Storr-Hansen, E. and T. Cederberg, “Determination of Coplanar Polychlorinated Biphenyl (CB) Congeners in Seal Tissues by Chromatography on Active Carbon, Dual-Column High Resolution GC/ECD and High Resolution GC/High Resolution MS,” Chemosphere 24:9, 1181-1196, 1992.
17. Echols, Kathy R., Robert W. Gale, Kevin Feltz, Jerome O'Laughlin, Donald E. Tillitt, and Ted R. Schwartz, “Loading capacity and chromatographic behavior of a porous graphitic carbon column for polychlorinated biphenyls,” J. Chromatog. A 811: 135-144, 1998.
18. Tessari, J.D., Personal communication with Dale Rushneck, available from U.S. Environmental Protection Agency, Engineering and Analysis Division (4303T), 1200 Pennsylvania Avenue NW, Washington, DC 20460.
EPA Method 1668C 56 April 2010
19. Ferrario, J.C., C. Byrne, A.E. Dupuy, Jr., “Background Contamination by Coplanar Polychlorinated Biphenyls (PCBs) in Trace Level High Resolution Gas Chromatography/High Resolution Mass Spectrometry (HRGC/HRMS) Analytical Procedures” Chemosphere 34:11, 2451-2465, 1997.
20. “Development of a Full Congener Version of Method 1668 and Application to the Analysis of 209 PCB Congeners in Aroclors,” AXYS Analytical Services, available from U.S. Environmental Protection Agency, Engineering and Analysis Division (4303T), 1200 Pennsylvania Avenue NW, Washington, DC 20460.
21. “Method 1668A Interlaboratory Validation Study Report,” March 2010, EPA-820-R-10-004, U.S. Environmental Protection Agency, Engineering and Analysis Division (4303T), 1200 Pennsylvania Avenue NW, Washington, DC 20460.
22. “Method 1668A Interlaboratory Study Report Addendum,” March 2010, EPA-820-R-10-003, U.S. Environmental Protection Agency, Engineering and Analysis Division (4303T), 1200 Pennsylvania Avenue NW, Washington, DC 20460.
23. “Development of Pooled Method Detection Limits (MDLs) and Minimum Levels of Quantitation (MLs) for EPA Method 1668C,” Brian Englert, USEPA, May 18 2010; available from U.S. Environmental Protection Agency, Engineering and Analysis Division (4303T), 1200 Pennsylvania Avenue NW, Washington, DC 20460.
EPA Method 1668C 57 April 2010
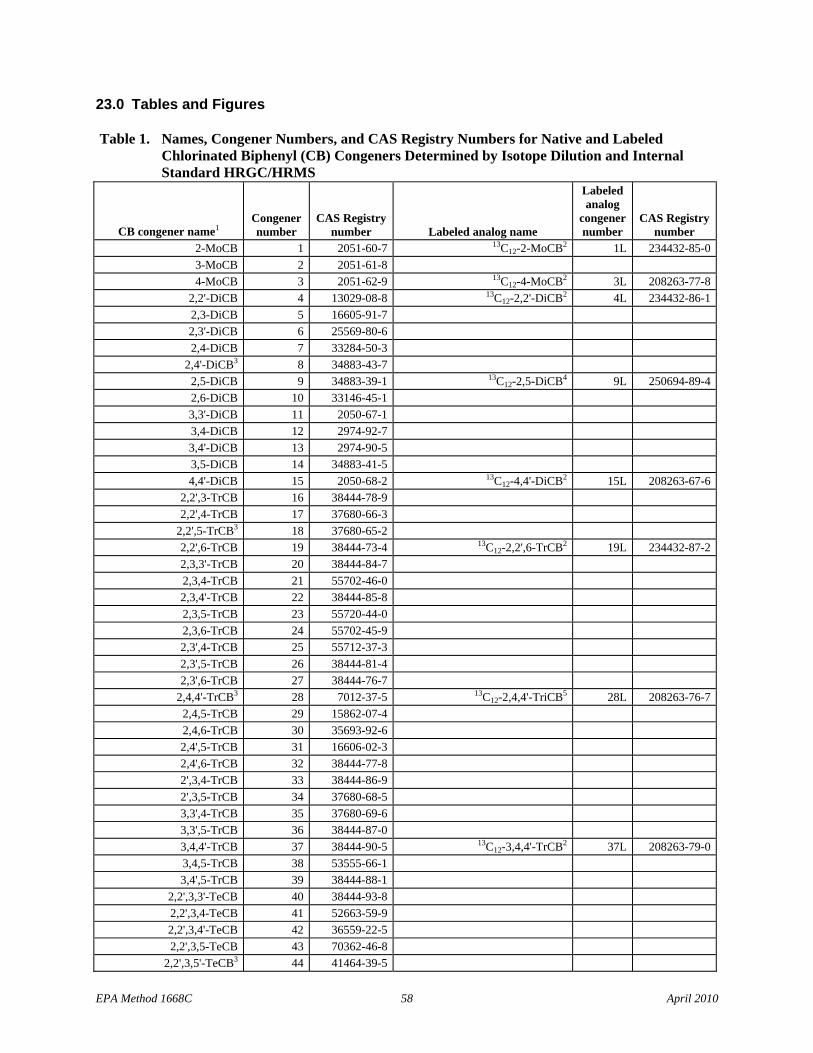
23.0 Tables and Figures
Table 1. Names, Congener Numbers, and CAS Registry Numbers for Native and Labeled Chlorinated Biphenyl (CB) Congeners Determined by Isotope Dilution and Internal Standard HRGC/HRMS
CB congener name1 Congener number
CAS Registry number Labeled analog name
Labeled analog
congener number
CAS Registry number
2-MoCB 1 2051-60-7 13C12-2-MoCB2 1L 234432-85-0 3-MoCB 2 2051-61-8 4-MoCB 3 2051-62-9 13C12-4-MoCB2 3L 208263-77-8
2,2'-DiCB 4 13029-08-8 13C12-2,2'-DiCB2 4L 234432-86-1 2,3-DiCB 5 16605-91-7 2,3'-DiCB 6 25569-80-6 2,4-DiCB 7 33284-50-3
2,4'-DiCB3 8 34883-43-7 2,5-DiCB 9 34883-39-1 13C12-2,5-DiCB4 9L 250694-89-4 2,6-DiCB 10 33146-45-1 3,3'-DiCB 11 2050-67-1 3,4-DiCB 12 2974-92-7 3,4'-DiCB 13 2974-90-5 3,5-DiCB 14 34883-41-5 4,4'-DiCB 15 2050-68-2 13C12-4,4'-DiCB2 15L 208263-67-6
2,2',3-TrCB 16 38444-78-9 2,2',4-TrCB 17 37680-66-3
2,2',5-TrCB3 18 37680-65-2 2,2',6-TrCB 19 38444-73-4 13C12-2,2',6-TrCB2 19L 234432-87-2 2,3,3'-TrCB 20 38444-84-7 2,3,4-TrCB 21 55702-46-0 2,3,4'-TrCB 22 38444-85-8 2,3,5-TrCB 23 55720-44-0 2,3,6-TrCB 24 55702-45-9 2,3',4-TrCB 25 55712-37-3 2,3',5-TrCB 26 38444-81-4 2,3',6-TrCB 27 38444-76-7
2,4,4'-TrCB3 28 7012-37-5 13C12-2,4,4'-TriCB5 28L 208263-76-7 2,4,5-TrCB 29 15862-07-4 2,4,6-TrCB 30 35693-92-6 2,4',5-TrCB 31 16606-02-3 2,4',6-TrCB 32 38444-77-8 2',3,4-TrCB 33 38444-86-9 2',3,5-TrCB 34 37680-68-5 3,3',4-TrCB 35 37680-69-6 3,3',5-TrCB 36 38444-87-0 3,4,4'-TrCB 37 38444-90-5 13C12-3,4,4'-TrCB2 37L 208263-79-0 3,4,5-TrCB 38 53555-66-1 3,4',5-TrCB 39 38444-88-1
2,2',3,3'-TeCB 40 38444-93-8 2,2',3,4-TeCB 41 52663-59-9 2,2',3,4'-TeCB 42 36559-22-5 2,2',3,5-TeCB 43 70362-46-8
2,2',3,5'-TeCB3 44 41464-39-5
EPA Method 1668C 58 April 2010
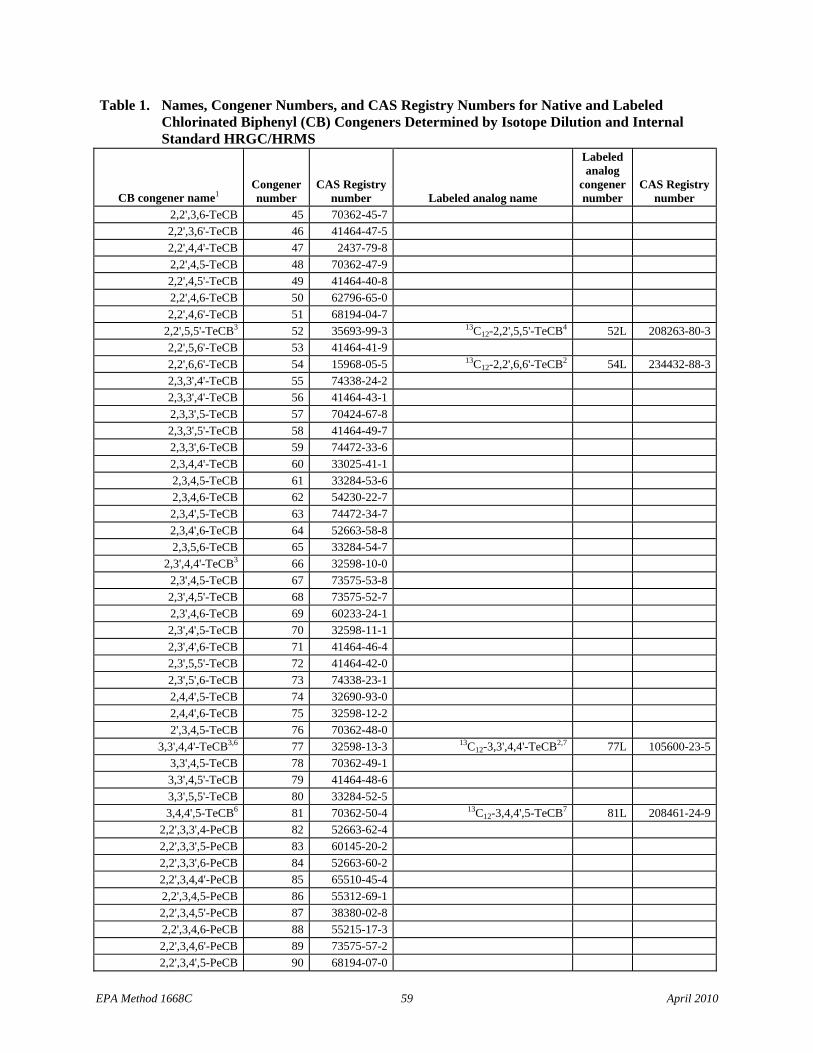
Table 1. Names, Congener Numbers, and CAS Registry Numbers for Native and Labeled Chlorinated Biphenyl (CB) Congeners Determined by Isotope Dilution and Internal Standard HRGC/HRMS
CB congener name1 Congener number
CAS Registry number Labeled analog name
Labeled analog
congener number
CAS Registry number
2,2',3,6-TeCB 45 70362-45-7 2,2',3,6'-TeCB 46 41464-47-5 2,2',4,4'-TeCB 47 2437-79-8 2,2',4,5-TeCB 48 70362-47-9 2,2',4,5'-TeCB 49 41464-40-8 2,2',4,6-TeCB 50 62796-65-0 2,2',4,6'-TeCB 51 68194-04-7
2,2',5,5'-TeCB3 52 35693-99-3 13C12-2,2',5,5'-TeCB4 52L 208263-80-3 2,2',5,6'-TeCB 53 41464-41-9 2,2',6,6'-TeCB 54 15968-05-5 13C12-2,2',6,6'-TeCB2 54L 234432-88-3 2,3,3',4'-TeCB 55 74338-24-2 2,3,3',4'-TeCB 56 41464-43-1 2,3,3',5-TeCB 57 70424-67-8 2,3,3',5'-TeCB 58 41464-49-7 2,3,3',6-TeCB 59 74472-33-6 2,3,4,4'-TeCB 60 33025-41-1 2,3,4,5-TeCB 61 33284-53-6 2,3,4,6-TeCB 62 54230-22-7 2,3,4',5-TeCB 63 74472-34-7 2,3,4',6-TeCB 64 52663-58-8 2,3,5,6-TeCB 65 33284-54-7
2,3',4,4'-TeCB3 66 32598-10-0 2,3',4,5-TeCB 67 73575-53-8 2,3',4,5'-TeCB 68 73575-52-7 2,3',4,6-TeCB 69 60233-24-1 2,3',4',5-TeCB 70 32598-11-1 2,3',4',6-TeCB 71 41464-46-4 2,3',5,5'-TeCB 72 41464-42-0 2,3',5',6-TeCB 73 74338-23-1 2,4,4',5-TeCB 74 32690-93-0 2,4,4',6-TeCB 75 32598-12-2 2',3,4,5-TeCB 76 70362-48-0
3,3',4,4'-TeCB3,6 77 32598-13-3 13C12-3,3',4,4'-TeCB2,7 77L 105600-23-5 3,3',4,5-TeCB 78 70362-49-1 3,3',4,5'-TeCB 79 41464-48-6 3,3',5,5'-TeCB 80 33284-52-5 3,4,4',5-TeCB6 81 70362-50-4 13C12-3,4,4',5-TeCB7 81L 208461-24-9
2,2',3,3',4-PeCB 82 52663-62-4 2,2',3,3',5-PeCB 83 60145-20-2 2,2',3,3',6-PeCB 84 52663-60-2 2,2',3,4,4'-PeCB 85 65510-45-4 2,2',3,4,5-PeCB 86 55312-69-1 2,2',3,4,5'-PeCB 87 38380-02-8 2,2',3,4,6-PeCB 88 55215-17-3
2,2',3,4,6'-PeCB 89 73575-57-2 2,2',3,4',5-PeCB 90 68194-07-0
EPA Method 1668C 59 April 2010
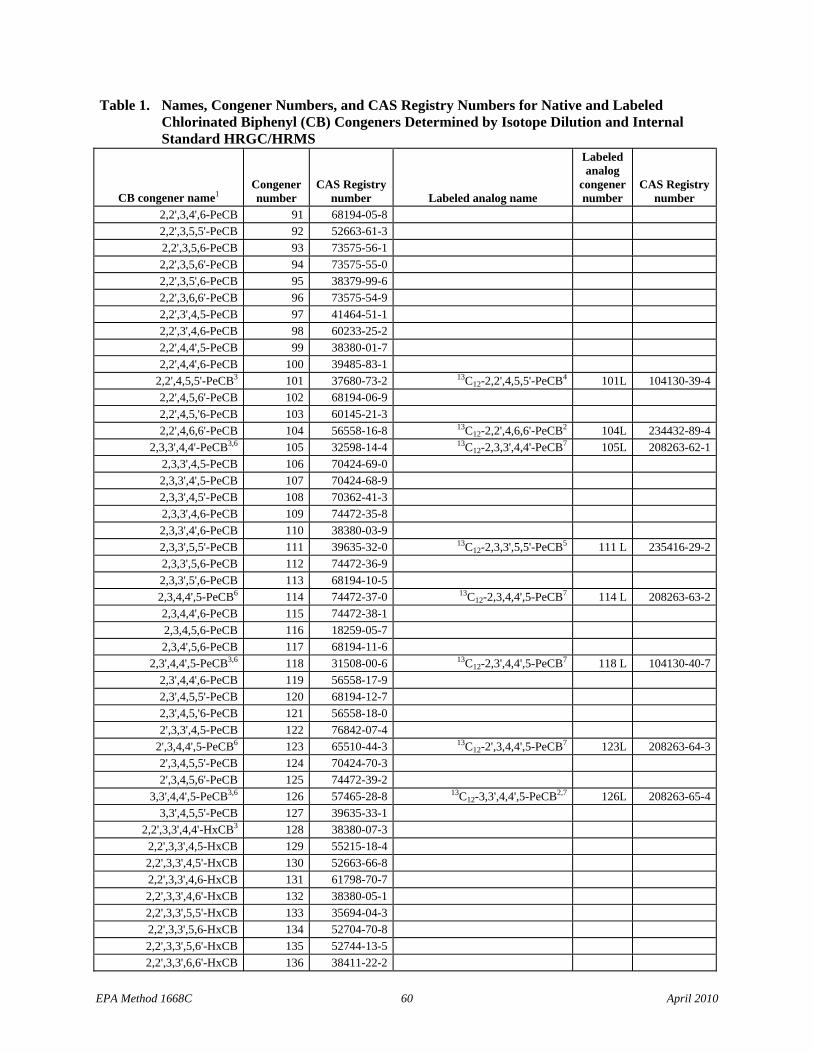
Table 1. Names, Congener Numbers, and CAS Registry Numbers for Native and Labeled Chlorinated Biphenyl (CB) Congeners Determined by Isotope Dilution and Internal Standard HRGC/HRMS
CB congener name1 Congener number
CAS Registry number Labeled analog name
Labeled analog
congener number
CAS Registry number
2,2',3,4',6-PeCB 91 68194-05-8 2,2',3,5,5'-PeCB 92 52663-61-3 2,2',3,5,6-PeCB 93 73575-56-1 2,2',3,5,6'-PeCB 94 73575-55-0 2,2',3,5',6-PeCB 95 38379-99-6 2,2',3,6,6'-PeCB 96 73575-54-9 2,2',3',4,5-PeCB 97 41464-51-1
2,2',3',4,6-PeCB 98 60233-25-2 2,2',4,4',5-PeCB 99 38380-01-7 2,2',4,4',6-PeCB 100 39485-83-1
2,2',4,5,5'-PeCB3 101 37680-73-2 13C12-2,2',4,5,5'-PeCB4 101L 104130-39-4 2,2',4,5,6'-PeCB 102 68194-06-9 2,2',4,5,'6-PeCB 103 60145-21-3 2,2',4,6,6'-PeCB 104 56558-16-8 13C12-2,2',4,6,6'-PeCB2 104L 234432-89-4
2,3,3',4,4'-PeCB3,6 105 32598-14-4 13C12-2,3,3',4,4'-PeCB7 105L 208263-62-1 2,3,3',4,5-PeCB 106 70424-69-0 2,3,3',4',5-PeCB 107 70424-68-9 2,3,3',4,5'-PeCB 108 70362-41-3 2,3,3',4,6-PeCB 109 74472-35-8 2,3,3',4',6-PeCB 110 38380-03-9
2,3,3',5,5'-PeCB 111 39635-32-0 13C12-2,3,3',5,5'-PeCB5 111 L 235416-29-2 2,3,3',5,6-PeCB 112 74472-36-9 2,3,3',5',6-PeCB 113 68194-10-5 2,3,4,4',5-PeCB6 114 74472-37-0 13C12-2,3,4,4',5-PeCB7 114 L 208263-63-2 2,3,4,4',6-PeCB 115 74472-38-1 2,3,4,5,6-PeCB 116 18259-05-7 2,3,4',5,6-PeCB 117 68194-11-6
2,3',4,4',5-PeCB3,6 118 31508-00-6 13C12-2,3',4,4',5-PeCB7 118 L 104130-40-7 2,3',4,4',6-PeCB 119 56558-17-9 2,3',4,5,5'-PeCB 120 68194-12-7 2,3',4,5,'6-PeCB 121 56558-18-0 2',3,3',4,5-PeCB 122 76842-07-4
2',3,4,4',5-PeCB6 123 65510-44-3 13C12-2',3,4,4',5-PeCB7 123L 208263-64-3 2',3,4,5,5'-PeCB 124 70424-70-3 2',3,4,5,6'-PeCB 125 74472-39-2
3,3',4,4',5-PeCB3,6 126 57465-28-8 13C12-3,3',4,4',5-PeCB2,7 126L 208263-65-4 3,3',4,5,5'-PeCB 127 39635-33-1
2,2',3,3',4,4'-HxCB3 128 38380-07-3 2,2',3,3',4,5-HxCB 129 55215-18-4 2,2',3,3',4,5'-HxCB 130 52663-66-8 2,2',3,3',4,6-HxCB 131 61798-70-7 2,2',3,3',4,6'-HxCB 132 38380-05-1 2,2',3,3',5,5'-HxCB 133 35694-04-3 2,2',3,3',5,6-HxCB 134 52704-70-8 2,2',3,3',5,6'-HxCB 135 52744-13-5 2,2',3,3',6,6'-HxCB 136 38411-22-2
EPA Method 1668C 60 April 2010
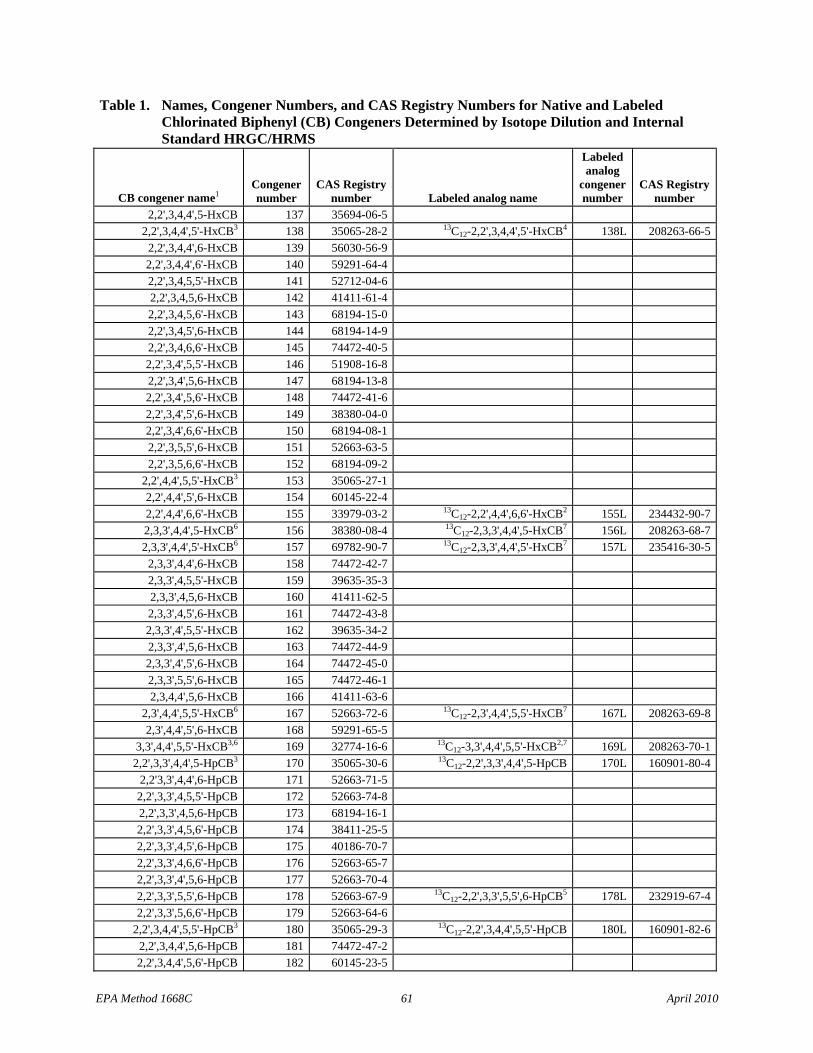
Table 1. Names, Congener Numbers, and CAS Registry Numbers for Native and Labeled Chlorinated Biphenyl (CB) Congeners Determined by Isotope Dilution and Internal Standard HRGC/HRMS
CB congener name1 Congener number
CAS Registry number Labeled analog name
Labeled analog
congener number
CAS Registry number
2,2',3,4,4',5-HxCB 137 35694-06-5 2,2',3,4,4',5'-HxCB3 138 35065-28-2 13C12-2,2',3,4,4',5'-HxCB4 138L 208263-66-5 2,2',3,4,4',6-HxCB 139 56030-56-9 2,2',3,4,4',6'-HxCB 140 59291-64-4 2,2',3,4,5,5'-HxCB 141 52712-04-6 2,2',3,4,5,6-HxCB 142 41411-61-4
2,2',3,4,5,6'-HxCB 143 68194-15-0 2,2',3,4,5',6-HxCB 144 68194-14-9 2,2',3,4,6,6'-HxCB 145 74472-40-5 2,2',3,4',5,5'-HxCB 146 51908-16-8 2,2',3,4',5,6-HxCB 147 68194-13-8 2,2',3,4',5,6'-HxCB 148 74472-41-6 2,2',3,4',5',6-HxCB 149 38380-04-0 2,2',3,4',6,6'-HxCB 150 68194-08-1 2,2',3,5,5',6-HxCB 151 52663-63-5 2,2',3,5,6,6'-HxCB 152 68194-09-2
2,2',4,4',5,5'-HxCB3 153 35065-27-1 2,2',4,4',5',6-HxCB 154 60145-22-4 2,2',4,4',6,6'-HxCB 155 33979-03-2 13C12-2,2',4,4',6,6'-HxCB2 155L 234432-90-7 2,3,3',4,4',5-HxCB6 156 38380-08-4 13C12-2,3,3',4,4',5-HxCB7 156L 208263-68-7 2,3,3',4,4',5'-HxCB6 157 69782-90-7 13C12-2,3,3',4,4',5'-HxCB7 157L 235416-30-5
2,3,3',4,4',6-HxCB 158 74472-42-7 2,3,3',4,5,5'-HxCB 159 39635-35-3 2,3,3',4,5,6-HxCB 160 41411-62-5 2,3,3',4,5',6-HxCB 161 74472-43-8 2,3,3',4',5,5'-HxCB 162 39635-34-2 2,3,3',4',5,6-HxCB 163 74472-44-9 2,3,3',4',5',6-HxCB 164 74472-45-0 2,3,3',5,5',6-HxCB 165 74472-46-1 2,3,4,4',5,6-HxCB 166 41411-63-6
2,3',4,4',5,5'-HxCB6 167 52663-72-6 13C12-2,3',4,4',5,5'-HxCB7 167L 208263-69-8 2,3',4,4',5',6-HxCB 168 59291-65-5
3,3',4,4',5,5'-HxCB3,6 169 32774-16-6 13C12-3,3',4,4',5,5'-HxCB2,7 169L 208263-70-1 2,2',3,3',4,4',5-HpCB3 170 35065-30-6 13C12-2,2',3,3',4,4',5-HpCB 170L 160901-80-4
2,2'3,3',4,4',6-HpCB 171 52663-71-5 2,2',3,3',4,5,5'-HpCB 172 52663-74-8 2,2',3,3',4,5,6-HpCB 173 68194-16-1 2,2',3,3',4,5,6'-HpCB 174 38411-25-5 2,2',3,3',4,5',6-HpCB 175 40186-70-7 2,2',3,3',4,6,6'-HpCB 176 52663-65-7 2,2',3,3',4',5,6-HpCB 177 52663-70-4 2,2',3,3',5,5',6-HpCB 178 52663-67-9 13C12-2,2',3,3',5,5',6-HpCB5 178L 232919-67-4 2,2',3,3',5,6,6'-HpCB 179 52663-64-6
2,2',3,4,4',5,5'-HpCB3 180 35065-29-3 13C12-2,2',3,4,4',5,5'-HpCB 180L 160901-82-6 2,2',3,4,4',5,6-HpCB 181 74472-47-2 2,2',3,4,4',5,6'-HpCB 182 60145-23-5
EPA Method 1668C 61 April 2010
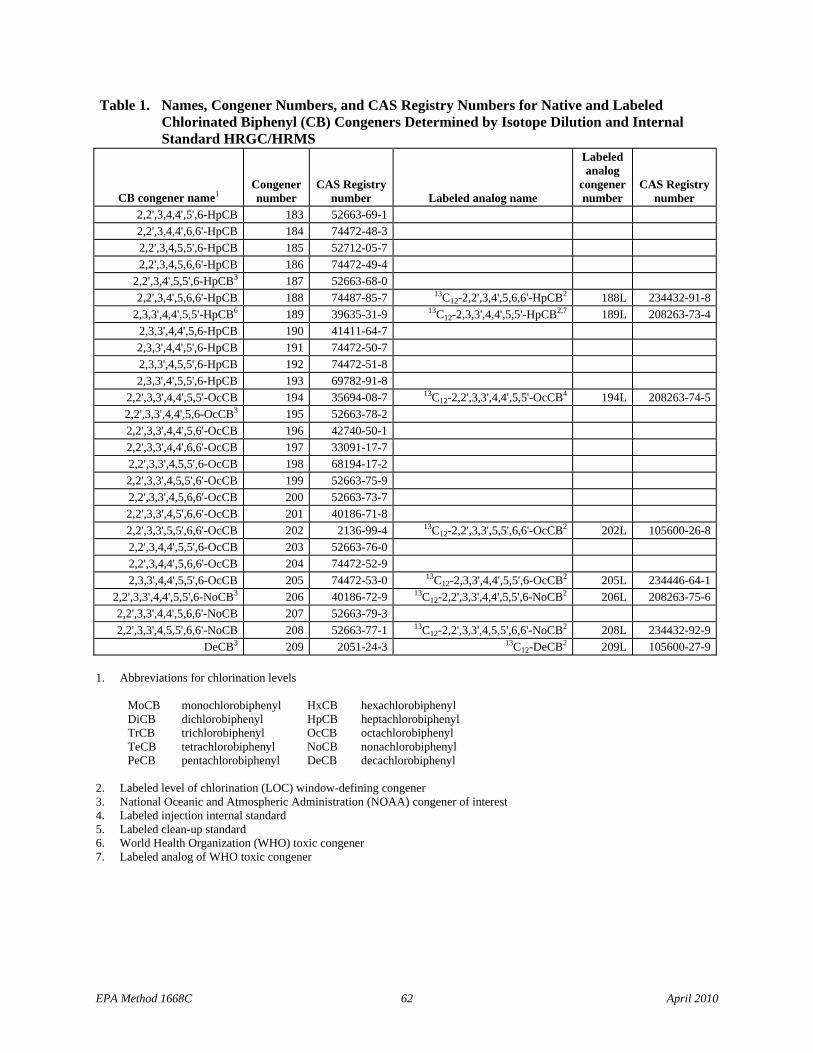
Table 1. Names, Congener Numbers, and CAS Registry Numbers for Native and Labeled Chlorinated Biphenyl (CB) Congeners Determined by Isotope Dilution and Internal Standard HRGC/HRMS
CB congener name1 Congener number
CAS Registry number Labeled analog name
Labeled analog
congener number
CAS Registry number
2,2',3,4,4',5',6-HpCB 183 52663-69-1 2,2',3,4,4',6,6'-HpCB 184 74472-48-3 2,2',3,4,5,5',6-HpCB 185 52712-05-7 2,2',3,4,5,6,6'-HpCB 186 74472-49-4
2,2',3,4',5,5',6-HpCB3 187 52663-68-0 2,2',3,4',5,6,6'-HpCB 188 74487-85-7 13C12-2,2',3,4',5,6,6'-HpCB2 188L 234432-91-8
2,3,3',4,4',5,5'-HpCB6 189 39635-31-9 13C12-2,3,3',4,4',5,5'-HpCB2,7 189L 208263-73-4 2,3,3',4,4',5,6-HpCB 190 41411-64-7 2,3,3',4,4',5',6-HpCB 191 74472-50-7 2,3,3',4,5,5',6-HpCB 192 74472-51-8 2,3,3',4',5,5',6-HpCB 193 69782-91-8
2,2',3,3',4,4',5,5'-OcCB 194 35694-08-7 13C12-2,2',3,3',4,4',5,5'-OcCB4 194L 208263-74-5 2,2',3,3',4,4',5,6-OcCB3 195 52663-78-2 2,2',3,3',4,4',5,6'-OcCB 196 42740-50-1 2,2',3,3',4,4',6,6'-OcCB 197 33091-17-7 2,2',3,3',4,5,5',6-OcCB 198 68194-17-2 2,2',3,3',4,5,5',6'-OcCB 199 52663-75-9 2,2',3,3',4,5,6,6'-OcCB 200 52663-73-7 2,2',3,3',4,5',6,6'-OcCB 201 40186-71-8 2,2',3,3',5,5',6,6'-OcCB 202 2136-99-4 13C12-2,2',3,3',5,5',6,6'-OcCB2 202L 105600-26-8 2,2',3,4,4',5,5',6-OcCB 203 52663-76-0 2,2',3,4,4',5,6,6'-OcCB 204 74472-52-9 2,3,3',4,4',5,5',6-OcCB 205 74472-53-0 13C12-2,3,3',4,4',5,5',6-OcCB2 205L 234446-64-1
2,2',3,3',4,4',5,5',6-NoCB3 206 40186-72-9 13C12-2,2',3,3',4,4',5,5',6-NoCB2 206L 208263-75-6 2,2',3,3',4,4',5,6,6'-NoCB 207 52663-79-3 2,2',3,3',4,5,5',6,6'-NoCB 208 52663-77-1 13C12-2,2',3,3',4,5,5',6,6'-NoCB2 208L 234432-92-9
DeCB3 209 2051-24-3 13C12-DeCB2 209L 105600-27-9
1. Abbreviations for chlorination levels
MoCB monochlorobiphenyl HxCB hexachlorobiphenyl DiCB dichlorobiphenyl HpCB heptachlorobiphenyl TrCB trichlorobiphenyl OcCB octachlorobiphenyl TeCB tetrachlorobiphenyl NoCB nonachlorobiphenyl PeCB pentachlorobiphenyl DeCB decachlorobiphenyl
2. Labeled level of chlorination (LOC) window-defining congener 3. National Oceanic and Atmospheric Administration (NOAA) congener of interest 4. Labeled injection internal standard 5. Labeled clean-up standard 6. World Health Organization (WHO) toxic congener 7. Labeled analog of WHO toxic congener
EPA Method 1668C 62 April 2010
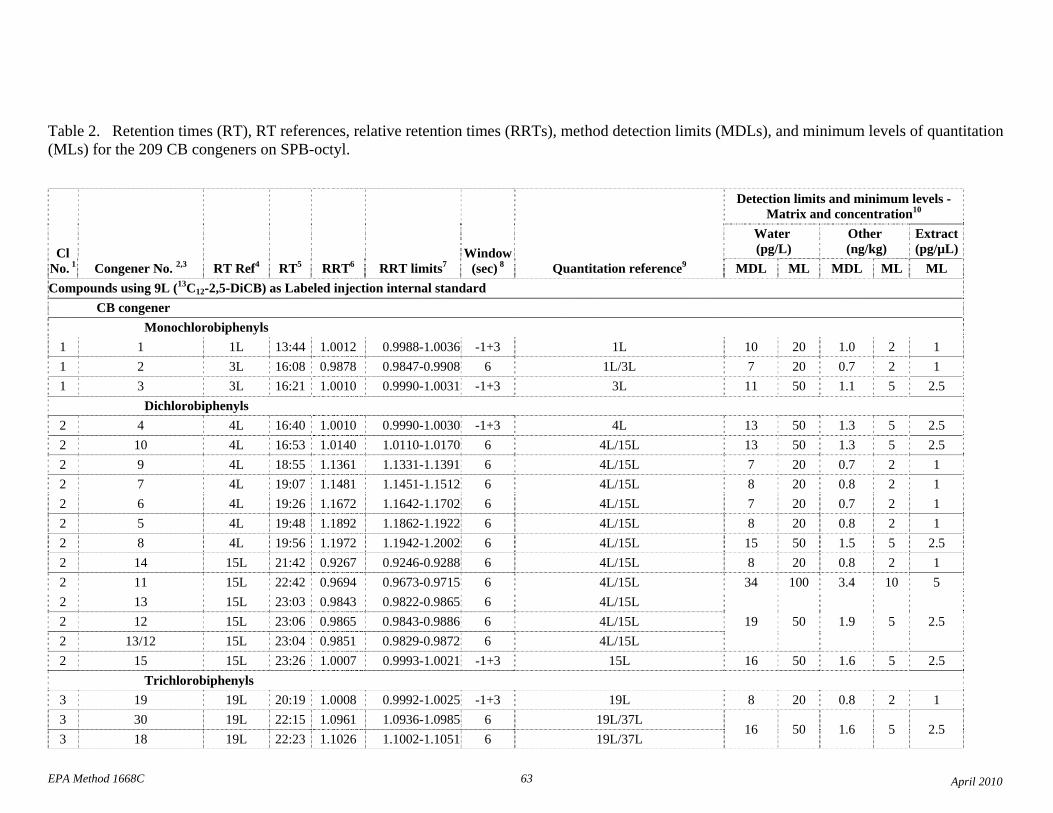
EPA Method 1668C 63 April 2010
Detection limits and minimum levels - 10 Matrix and concentration
Cl
Window
Water (pg/L)
Other (ng/kg)
Extract (pg/µL)
1 No. 2,3 Congener No. RT Ref4 RT5 RRT6 RRT limits7 (sec) 8 Quantitation reference9 MDL ML MDL ML ML Compounds using 9L (13C12-2,5-DiCB) as Labeled injection internal standard
CB congener Monochlorobiphenyls
1 1 1L 13:44 1.0012 0.9988-1.0036 -1+3 1L 10 20 1.0 2 11 2 3L 16:08 0.9878 0.9847-0.9908 6 1L/3L 7 20 0.7 2 11 3 3L 16:21 1.0010 0.9990-1.0031 -1+3 3L 11 50 1.1 5 2.5
Dichlorobiphenyls 2 4 4L 16:40 1.0010 0.9990-1.0030 -1+3 4L 13 50 1.3 5 2.5 2 10 4L 16:53 1.0140 1.0110-1.0170 6 4L/15L 13 50 1.3 5 2.5 2 9 4L 18:55 1.1361 1.1331-1.1391 6 4L/15L 7 20 0.7 2 12 7 4L 19:07 1.1481 1.1451-1.1512 6 4L/15L 8 20 0.8 2 12 6 4L 19:26 1.1672 1.1642-1.1702 6 4L/15L 7 20 0.7 2 12 5 4L 19:48 1.1892 1.1862-1.1922 6 4L/15L 8 20 0.8 2 12 8 4L 19:56 1.1972 1.1942-1.2002 6 4L/15L 15 50 1.5 5 2.5 2 14 15L 21:42 0.9267 0.9246-0.9288 6 4L/15L 8 20 0.8 2 12 11 15L 22:42 0.9694 0.9673-0.9715 6 4L/15L 34 100 3.4 10 52 13 15L 23:03 0.9843 0.9822-0.9865 6 4L/15L 2 12 15L 23:06 0.9865 0.9843-0.9886 6 4L/15L 19 50 1.9 5 2.5 2 13/12 15L 23:04 0.9851 0.9829-0.9872 6 4L/15L 2 15 15L 23:26 1.0007 0.9993-1.0021 -1+3 15L 16 50 1.6 5 2.5
Trichlorobiphenyls 3 19 19L 20:19 1.0008 0.9992-1.0025 -1+3 19L 8 20 0.8 2 13 3
30 19L 18 19L
22:15 22:23
1.0961 1.1026
1.0936-1.0985 1.1002-1.1051
6 6
19L/37L 19L/37L
16 50 1.6 5 2.5
Table 2. Retention times (RT), RT references, relative retention times (RRTs), method detection limits (MDLs), and minimum levels of quantitation (MLs) for the 209 CB congeners on SPB-octyl.
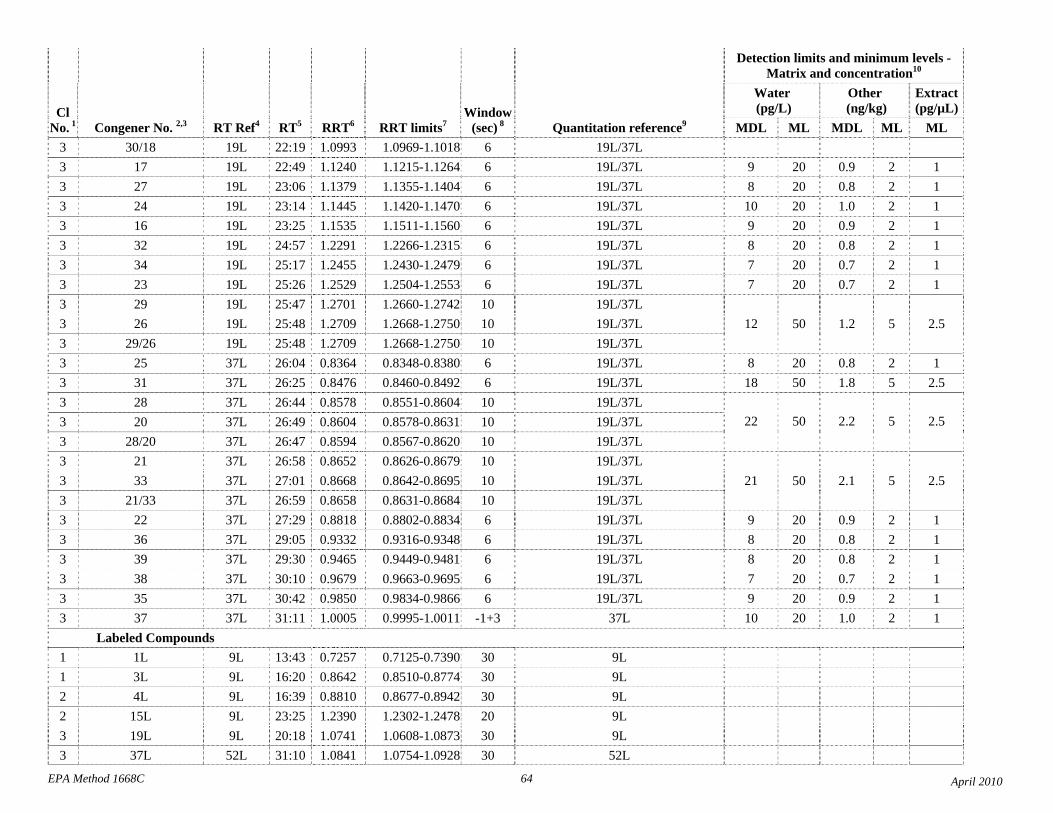
Detection limits and minimum levels - 10 Matrix and concentration
Cl
Window
Water (pg/L)
Other (ng/kg)
Extract (pg/µL)
1 No. 2,3 Congener No. RT Ref4 RT5 RRT6 RRT limits7 (sec) 8 Quantitation reference9 MDL ML MDL ML ML 3 30/18 19L 22:19 1.0993 1.0969-1.1018 6 19L/37L 3 17 19L 22:49 1.1240 1.1215-1.1264 6 19L/37L 9 20 0.9 2 13 27 19L 23:06 1.1379 1.1355-1.1404 6 19L/37L 8 20 0.8 2 13 24 19L 23:14 1.1445 1.1420-1.1470 6 19L/37L 10 20 1.0 2 13 16 19L 23:25 1.1535 1.1511-1.1560 6 19L/37L 9 20 0.9 2 13 32 19L 24:57 1.2291 1.2266-1.2315 6 19L/37L 8 20 0.8 2 13 34 19L 25:17 1.2455 1.2430-1.2479 6 19L/37L 7 20 0.7 2 13 23 19L 25:26 1.2529 1.2504-1.2553 6 19L/37L 7 20 0.7 2 13 29 19L 25:47 1.2701 1.2660-1.2742 10 19L/37L 3 26 19L 25:48 1.2709 1.2668-1.2750 10 19L/37L 12 50 1.2 5 2.5 3 29/26 19L 25:48 1.2709 1.2668-1.2750 10 19L/37L 3 25 37L 26:04 0.8364 0.8348-0.8380 6 19L/37L 8 20 0.8 2 13 31 37L 26:25 0.8476 0.8460-0.8492 6 19L/37L 18 50 1.8 5 2.5 3 28 37L 26:44 0.8578 0.8551-0.8604 10 19L/37L 3 20 37L 26:49 0.8604 0.8578-0.8631 10 19L/37L 22 50 2.2 5 2.5 3 28/20 37L 26:47 0.8594 0.8567-0.8620 10 19L/37L 3 21 37L 26:58 0.8652 0.8626-0.8679 10 19L/37L 3 33 37L 27:01 0.8668 0.8642-0.8695 10 19L/37L 21 50 2.1 5 2.5 3 21/33 37L 26:59 0.8658 0.8631-0.8684 10 19L/37L 3 22 37L 27:29 0.8818 0.8802-0.8834 6 19L/37L 9 20 0.9 2 13 36 37L 29:05 0.9332 0.9316-0.9348 6 19L/37L 8 20 0.8 2 13 39 37L 29:30 0.9465 0.9449-0.9481 6 19L/37L 8 20 0.8 2 13 38 37L 30:10 0.9679 0.9663-0.9695 6 19L/37L 7 20 0.7 2 13 35 37L 30:42 0.9850 0.9834-0.9866 6 19L/37L 9 20 0.9 2 13 37 37L 31:11 1.0005 0.9995-1.0011 -1+3 37L 10 20 1.0 2 1
Labeled Compounds 1 1L 9L 13:43 0.7257 0.7125-0.7390 30 9L 1 3L 9L 16:20 0.8642 0.8510-0.8774 30 9L 2 4L 9L 16:39 0.8810 0.8677-0.8942 30 9L 2 15L 9L 23:25 1.2390 1.2302-1.2478 20 9L 3 19L 9L 20:18 1.0741 1.0608-1.0873 30 9L 3 37L 52L 31:10 1.0841 1.0754-1.0928 30 52L
EPA Method 1668C 64 April 2010
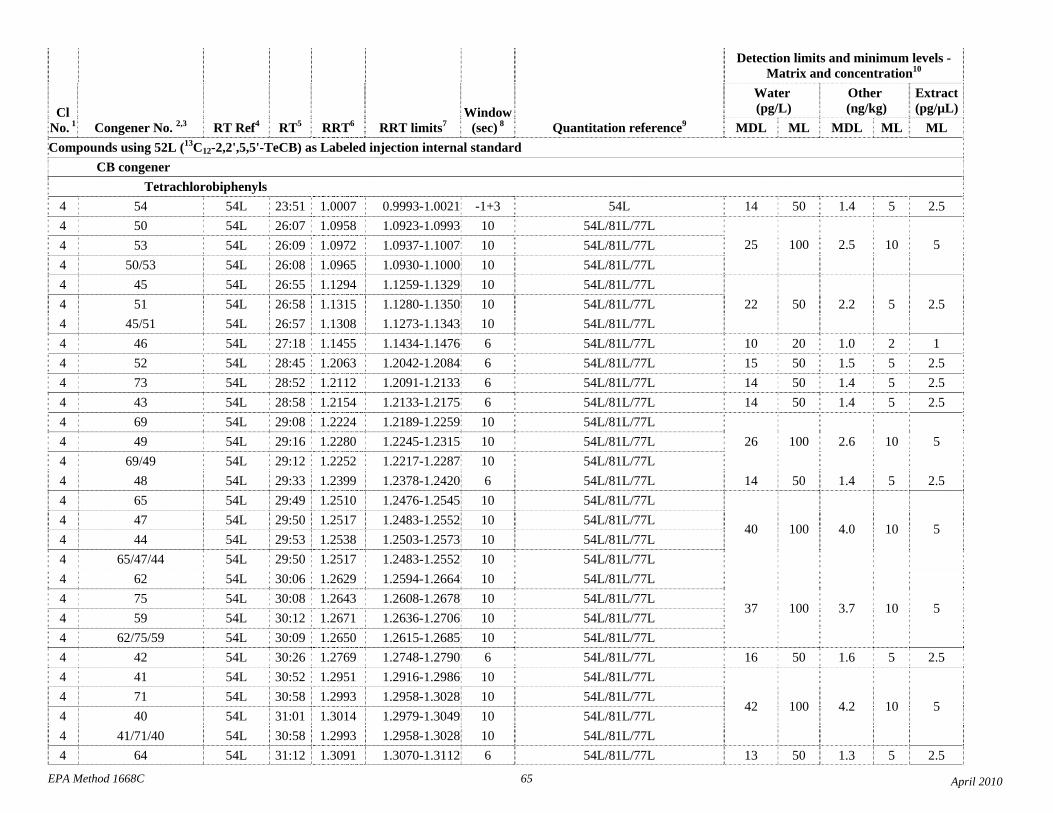
EPA Method 1668C 65 April 2010
Detection limits and minimum levels - 10 Matrix and concentration
Cl
Window
Water (pg/L)
Other (ng/kg)
Extract (pg/µL)
1 No. 2,3 Congener No. RT Ref4 RT5 RRT6 RRT limits7 (sec) 8 Quantitation reference9 MDL ML MDL ML ML Compounds using 52L (13C12-2,2',5,5'-TeCB) as Labeled injection internal standard CB congener Tetrachlorobiphenyls
4 54 54L 23:51 1.0007 0.9993-1.0021 -1+3 54L 14 50 1.4 5 2.5 4 50 54L 26:07 1.0958 1.0923-1.0993 10 54L/81L/77L 4 53 54L 26:09 1.0972 1.0937-1.1007 10 54L/81L/77L 25 100 2.5 10 54 50/53 54L 26:08 1.0965 1.0930-1.1000 10 54L/81L/77L 4 45 54L 26:55 1.1294 1.1259-1.1329 10 54L/81L/77L 4 51 54L 26:58 1.1315 1.1280-1.1350 10 54L/81L/77L 22 50 2.2 5 2.5 4 45/51 54L 26:57 1.1308 1.1273-1.1343 10 54L/81L/77L 4 46 54L 27:18 1.1455 1.1434-1.1476 6 54L/81L/77L 10 20 1.0 2 1 4 52 54L 28:45 1.2063 1.2042-1.2084 6 54L/81L/77L 15 50 1.5 5 2.5 4 73 54L 28:52 1.2112 1.2091-1.2133 6 54L/81L/77L 14 50 1.4 5 2.5 4 43 54L 28:58 1.2154 1.2133-1.2175 6 54L/81L/77L 14 50 1.4 5 2.5 4 69 54L 29:08 1.2224 1.2189-1.2259 10 54L/81L/77L 4 49 54L 29:16 1.2280 1.2245-1.2315 10 54L/81L/77L 26 100 2.6 10 54 69/49 54L 29:12 1.2252 1.2217-1.2287 10 54L/81L/77L 4 48 54L 29:33 1.2399 1.2378-1.2420 6 54L/81L/77L 14 50 1.4 5 2.5 4 65 54L 29:49 1.2510 1.2476-1.2545 10 54L/81L/77L 4 4
47 44
54L 54L
29:50 29:53
1.2517 1.2538
1.2483-1.2552 1.2503-1.2573
10 10
54L/81L/77L 54L/81L/77L
40 100 4.0 10 5
4 65/47/44 54L 29:50 1.2517 1.2483-1.2552 10 54L/81L/77L 4 62 54L 30:06 1.2629 1.2594-1.2664 10 54L/81L/77L 4 4
75 59
54L 54L
30:08 30:12
1.2643 1.2671
1.2608-1.2678 1.2636-1.2706
10 10
54L/81L/77L 54L/81L/77L
37 100 3.7 10 5
4 62/75/59 54L 30:09 1.2650 1.2615-1.2685 10 54L/81L/77L 4 42 54L 30:26 1.2769 1.2748-1.2790 6 54L/81L/77L 16 50 1.6 5 2.5 4 41 54L 30:52 1.2951 1.2916-1.2986 10 54L/81L/77L 4 4
71 40
54L 54L
30:58 31:01
1.2993 1.3014
1.2958-1.3028 1.2979-1.3049
10 10
54L/81L/77L 54L/81L/77L
42 100 4.2 10 5
4 41/71/40 54L 30:58 1.2993 1.2958-1.3028 10 54L/81L/77L 4 64 54L 31:12 1.3091 1.3070-1.3112 6 54L/81L/77L 13 50 1.3 5 2.5
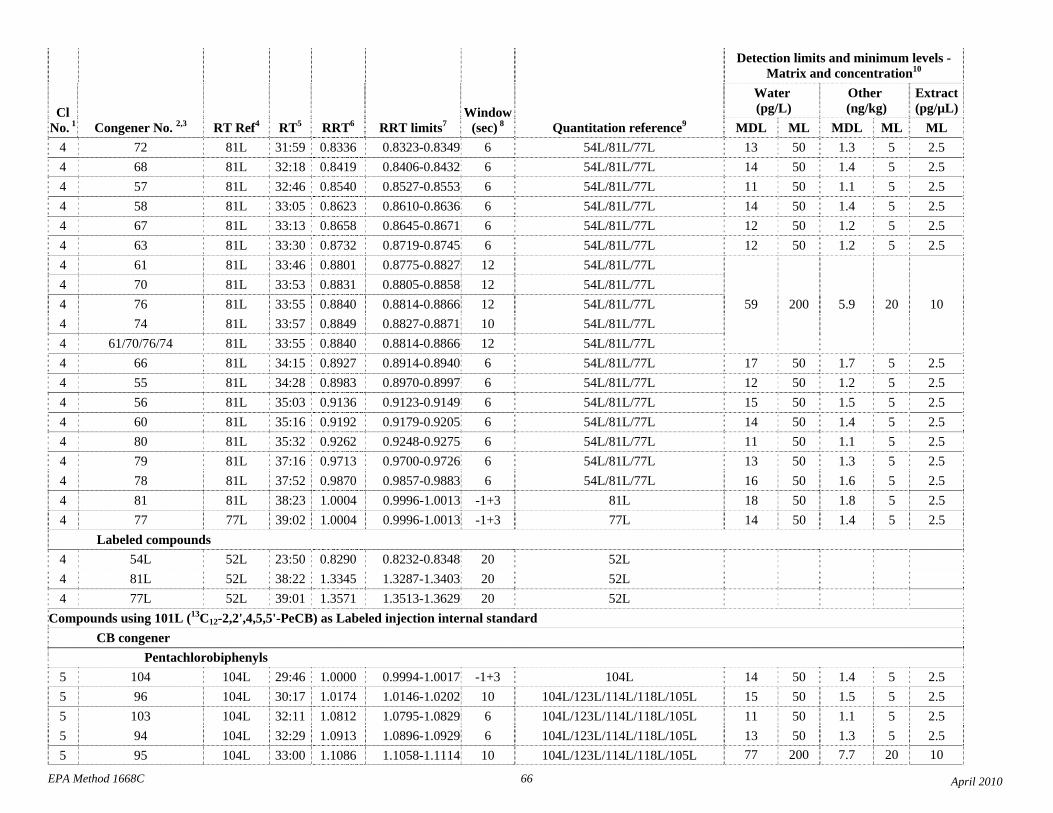
EPA Method 1668C 66 April 2010
Detection limits and minimum levels - 10 Matrix and concentration
Cl
Window
Water (pg/L)
Other (ng/kg)
Extract (pg/µL)
1 No. 2,3 Congener No. RT Ref4 RT5 RRT6 RRT limits7 (sec) 8 Quantitation reference9 MDL ML MDL ML ML 4 72 81L 31:59 0.8336 0.8323-0.8349 6 54L/81L/77L 13 50 1.3 5 2.5 4 68 81L 32:18 0.8419 0.8406-0.8432 6 54L/81L/77L 14 50 1.4 5 2.5 4 57 81L 32:46 0.8540 0.8527-0.8553 6 54L/81L/77L 11 50 1.1 5 2.5 4 58 81L 33:05 0.8623 0.8610-0.8636 6 54L/81L/77L 14 50 1.4 5 2.5 4 67 81L 33:13 0.8658 0.8645-0.8671 6 54L/81L/77L 12 50 1.2 5 2.5 4 63 81L 33:30 0.8732 0.8719-0.8745 6 54L/81L/77L 12 50 1.2 5 2.5 4 61 81L 33:46 0.8801 0.8775-0.8827 12 54L/81L/77L 4 70 81L 33:53 0.8831 0.8805-0.8858 12 54L/81L/77L 4 76 81L 33:55 0.8840 0.8814-0.8866 12 54L/81L/77L 59 200 5.9 20 10 4 74 81L 33:57 0.8849 0.8827-0.8871 10 54L/81L/77L 4 61/70/76/74 81L 33:55 0.8840 0.8814-0.8866 12 54L/81L/77L 4 66 81L 34:15 0.8927 0.8914-0.8940 6 54L/81L/77L 17 50 1.7 5 2.5 4 55 81L 34:28 0.8983 0.8970-0.8997 6 54L/81L/77L 12 50 1.2 5 2.5 4 56 81L 35:03 0.9136 0.9123-0.9149 6 54L/81L/77L 15 50 1.5 5 2.5 4 60 81L 35:16 0.9192 0.9179-0.9205 6 54L/81L/77L 14 50 1.4 5 2.5 4 80 81L 35:32 0.9262 0.9248-0.9275 6 54L/81L/77L 11 50 1.1 5 2.5 4 79 81L 37:16 0.9713 0.9700-0.9726 6 54L/81L/77L 13 50 1.3 5 2.5 4 78 81L 37:52 0.9870 0.9857-0.9883 6 54L/81L/77L 16 50 1.6 5 2.5 4 81 81L 38:23 1.0004 0.9996-1.0013 -1+3 81L 18 50 1.8 5 2.5 4 77 77L 39:02 1.0004 0.9996-1.0013 -1+3 77L 14 50 1.4 5 2.5
Labeled compounds 4 54L 52L 23:50 0.8290 0.8232-0.8348 20 52L 4 81L 52L 38:22 1.3345 1.3287-1.3403 20 52L 4 77L 52L 39:01 1.3571 1.3513-1.3629 20 52L
Compounds using 101L (13C12-2,2',4,5,5'-PeCB) as Labeled injection internal standard CB congener Pentachlorobiphenyls
5 104 104L 29:46 1.0000 0.9994-1.0017 -1+3 104L 14 50 1.4 5 2.5 5 96 104L 30:17 1.0174 1.0146-1.0202 10 104L/123L/114L/118L/105L 15 50 1.5 5 2.5 5 103 104L 32:11 1.0812 1.0795-1.0829 6 104L/123L/114L/118L/105L 11 50 1.1 5 2.5 5 94 104L 32:29 1.0913 1.0896-1.0929 6 104L/123L/114L/118L/105L 13 50 1.3 5 2.5 5 95 104L 33:00 1.1086 1.1058-1.1114 10 104L/123L/114L/118L/105L 77 200 7.7 20 10
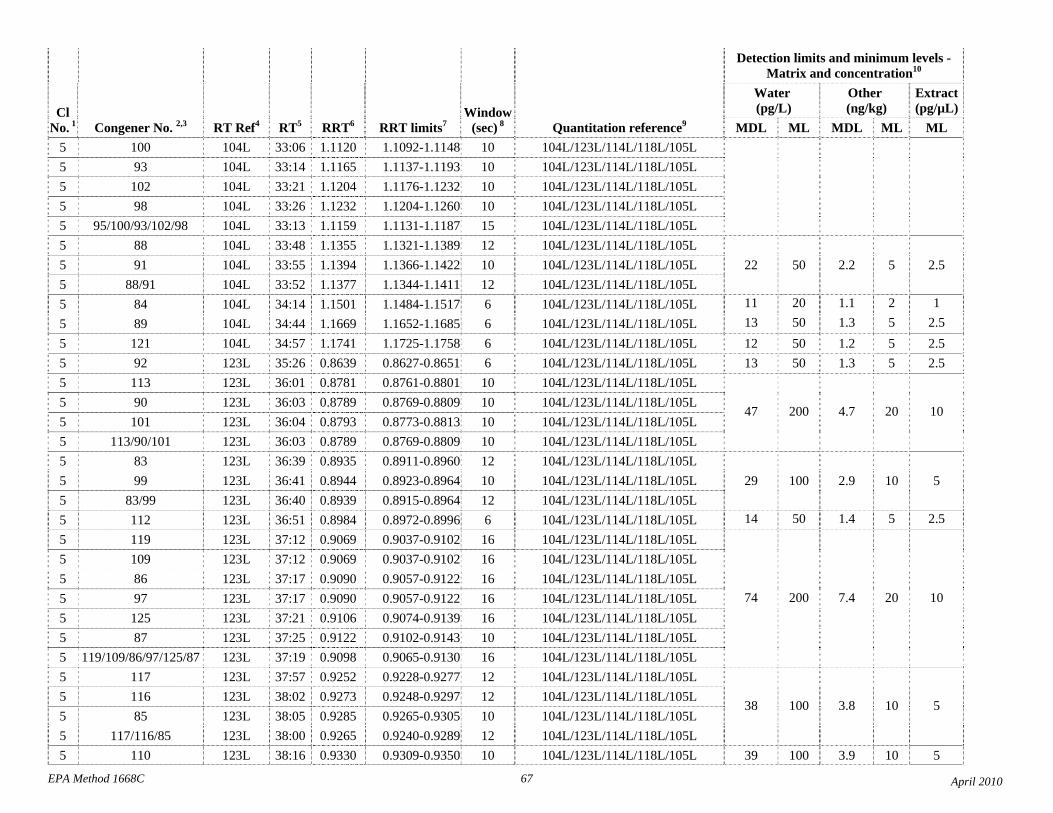
EPA Method 1668C 67 April 2010
Detection limits and minimum levels - 10 Matrix and concentration
Cl
Window
Water (pg/L)
Other (ng/kg)
Extract (pg/µL)
1 No. 2,3 Congener No. RT Ref4 RT5 RRT6 RRT limits7 (sec) 8 Quantitation reference9 MDL ML MDL ML ML 5 100 104L 33:06 1.1120 1.1092-1.1148 10 104L/123L/114L/118L/105L 5 93 104L 33:14 1.1165 1.1137-1.1193 10 104L/123L/114L/118L/105L 5 102 104L 33:21 1.1204 1.1176-1.1232 10 104L/123L/114L/118L/105L 5 98 104L 33:26 1.1232 1.1204-1.1260 10 104L/123L/114L/118L/105L 5 95/100/93/102/98 104L 33:13 1.1159 1.1131-1.1187 15 104L/123L/114L/118L/105L 5 88 104L 33:48 1.1355 1.1321-1.1389 12 104L/123L/114L/118L/105L 5 91 104L 33:55 1.1394 1.1366-1.1422 10 104L/123L/114L/118L/105L 22 50 2.2 5 2.5 5 88/91 104L 33:52 1.1377 1.1344-1.1411 12 104L/123L/114L/118L/105L 5 84 104L 34:14 1.1501 1.1484-1.1517 6 104L/123L/114L/118L/105L 11 20 1.1 2 1 5 89 104L 34:44 1.1669 1.1652-1.1685 6 104L/123L/114L/118L/105L 13 50 1.3 5 2.5 5 121 104L 34:57 1.1741 1.1725-1.1758 6 104L/123L/114L/118L/105L 12 50 1.2 5 2.5 5 92 123L 35:26 0.8639 0.8627-0.8651 6 104L/123L/114L/118L/105L 13 50 1.3 5 2.5 5 113 123L 36:01 0.8781 0.8761-0.8801 10 104L/123L/114L/118L/105L 5 5
90 101
123L 123L
36:03 36:04
0.8789 0.8793
0.8769-0.8809 0.8773-0.8813
10 10
104L/123L/114L/118L/105L 104L/123L/114L/118L/105L
47 200 4.7 20 10
5 113/90/101 123L 36:03 0.8789 0.8769-0.8809 10 104L/123L/114L/118L/105L 5 83 123L 36:39 0.8935 0.8911-0.8960 12 104L/123L/114L/118L/105L 5 99 123L 36:41 0.8944 0.8923-0.8964 10 104L/123L/114L/118L/105L 29 100 2.9 10 55 83/99 123L 36:40 0.8939 0.8915-0.8964 12 104L/123L/114L/118L/105L 5 112 123L 36:51 0.8984 0.8972-0.8996 6 104L/123L/114L/118L/105L 14 50 1.4 5 2.5 5 119 123L 37:12 0.9069 0.9037-0.9102 16 104L/123L/114L/118L/105L 5 109 123L 37:12 0.9069 0.9037-0.9102 16 104L/123L/114L/118L/105L 5 86 123L 37:17 0.9090 0.9057-0.9122 16 104L/123L/114L/118L/105L 5 97 123L 37:17 0.9090 0.9057-0.9122 16 104L/123L/114L/118L/105L 74 200 7.4 20 10 5 125 123L 37:21 0.9106 0.9074-0.9139 16 104L/123L/114L/118L/105L 5 87 123L 37:25 0.9122 0.9102-0.9143 10 104L/123L/114L/118L/105L 5 119/109/86/97/125/87 123L 37:19 0.9098 0.9065-0.9130 16 104L/123L/114L/118L/105L 5 117 123L 37:57 0.9252 0.9228-0.9277 12 104L/123L/114L/118L/105L 5 5
116 85
123L 123L
38:02 38:05
0.9273 0.9285
0.9248-0.9297 0.9265-0.9305
12 10
104L/123L/114L/118L/105L 104L/123L/114L/118L/105L
38 100 3.8 10 5
5 117/116/85 123L 38:00 0.9265 0.9240-0.9289 12 104L/123L/114L/118L/105L 5 110 123L 38:16 0.9330 0.9309-0.9350 10 104L/123L/114L/118L/105L 39 100 3.9 10 5
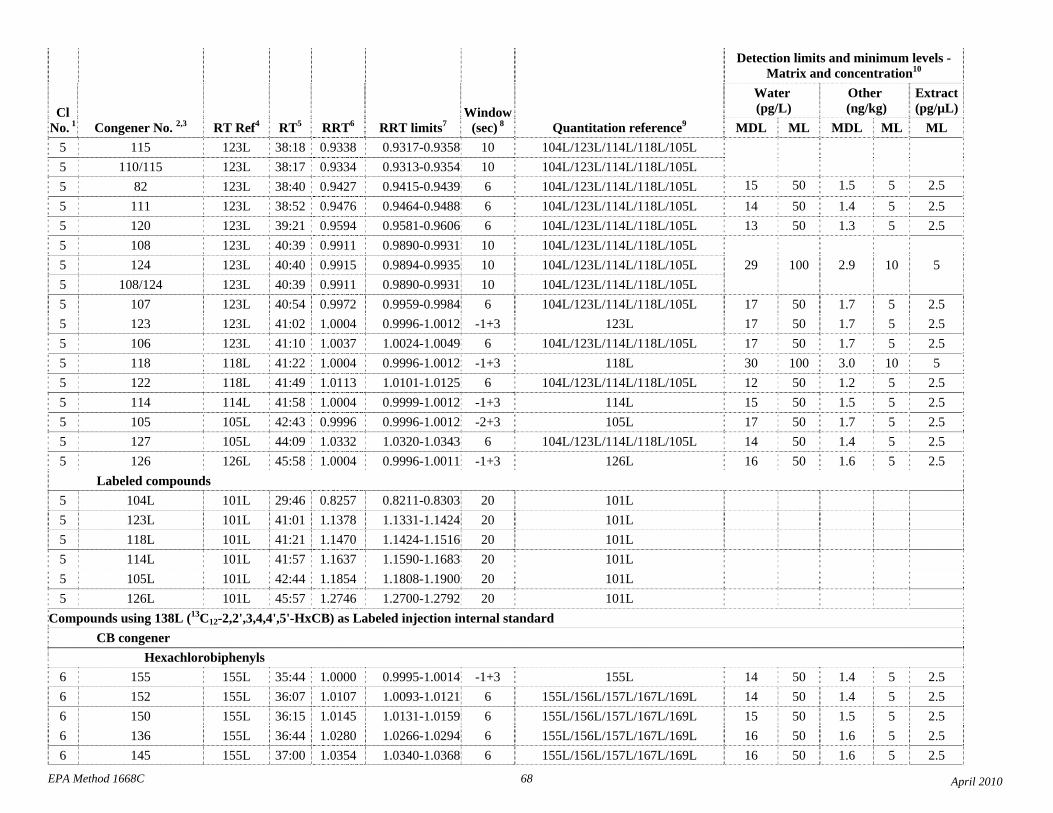
EPA Method 1668C 68 April 2010
Detection limits and minimum levels - 10 Matrix and concentration
Cl
1 No.
2,3 Congener No. RT Ref4
RT5
RRT6
RRT limits7
Window
(sec) 8
Quantitation reference9
Water (pg/L)
MDL ML
Other (ng/kg)
MDL ML
Extract (pg/µL)
ML 5 115 123L 38:18 0.9338 0.9317-0.9358 10 104L/123L/114L/118L/105L 5 5
110/115 123L 82 123L
38:17 38:40
0.9334 0.9427
0.9313-0.9354 0.9415-0.9439
10 6
104L/123L/114L/118L/105L 104L/123L/114L/118L/105L 15 50 1.5 5 2.5
5 111 123L 38:52 0.9476 0.9464-0.9488 6 104L/123L/114L/118L/105L 14 50 1.4 5 2.5 5 120 123L 39:21 0.9594 0.9581-0.9606 6 104L/123L/114L/118L/105L 13 50 1.3 5 2.5 5 108 123L 40:39 0.9911 0.9890-0.9931 10 104L/123L/114L/118L/105L 5 124 123L 40:40 0.9915 0.9894-0.9935 10 104L/123L/114L/118L/105L 29 100 2.9 10 55 108/124 123L 40:39 0.9911 0.9890-0.9931 10 104L/123L/114L/118L/105L 5 107 123L 40:54 0.9972 0.9959-0.9984 6 104L/123L/114L/118L/105L 17 50 1.7 5 2.5 5 123 123L 41:02 1.0004 0.9996-1.0012 -1+3 123L 17 50 1.7 5 2.5 5 106 123L 41:10 1.0037 1.0024-1.0049 6 104L/123L/114L/118L/105L 17 50 1.7 5 2.5 5 118 118L 41:22 1.0004 0.9996-1.0012 -1+3 118L 30 100 3.0 10 5 5 122 118L 41:49 1.0113 1.0101-1.0125 6 104L/123L/114L/118L/105L 12 50 1.2 5 2.5 5 114 114L 41:58 1.0004 0.9999-1.0012 -1+3 114L 15 50 1.5 5 2.5 5 105 105L 42:43 0.9996 0.9996-1.0012 -2+3 105L 17 50 1.7 5 2.5 5 127 105L 44:09 1.0332 1.0320-1.0343 6 104L/123L/114L/118L/105L 14 50 1.4 5 2.5 5 126 126L 45:58 1.0004 0.9996-1.0011 -1+3 126L 16 50 1.6 5 2.5
Labeled compounds 5 104L 101L 29:46 0.8257 0.8211-0.8303 20 101L 5 123L 101L 41:01 1.1378 1.1331-1.1424 20 101L 5 118L 101L 41:21 1.1470 1.1424-1.1516 20 101L 5 114L 101L 41:57 1.1637 1.1590-1.1683 20 101L 5 105L 101L 42:44 1.1854 1.1808-1.1900 20 101L 5 126L 101L 45:57 1.2746 1.2700-1.2792 20 101L
Compounds using 138L (13C12-2,2',3,4,4',5'-HxCB) as Labeled injection internal standard CB congener Hexachlorobiphenyls
6 155 155L 35:44 1.0000 0.9995-1.0014 -1+3 155L 14 50 1.4 5 2.5 6 152 155L 36:07 1.0107 1.0093-1.0121 6 155L/156L/157L/167L/169L 14 50 1.4 5 2.5 6 150 155L 36:15 1.0145 1.0131-1.0159 6 155L/156L/157L/167L/169L 15 50 1.5 5 2.5 6 136 155L 36:44 1.0280 1.0266-1.0294 6 155L/156L/157L/167L/169L 16 50 1.6 5 2.5 6 145 155L 37:00 1.0354 1.0340-1.0368 6 155L/156L/157L/167L/169L 16 50 1.6 5 2.5
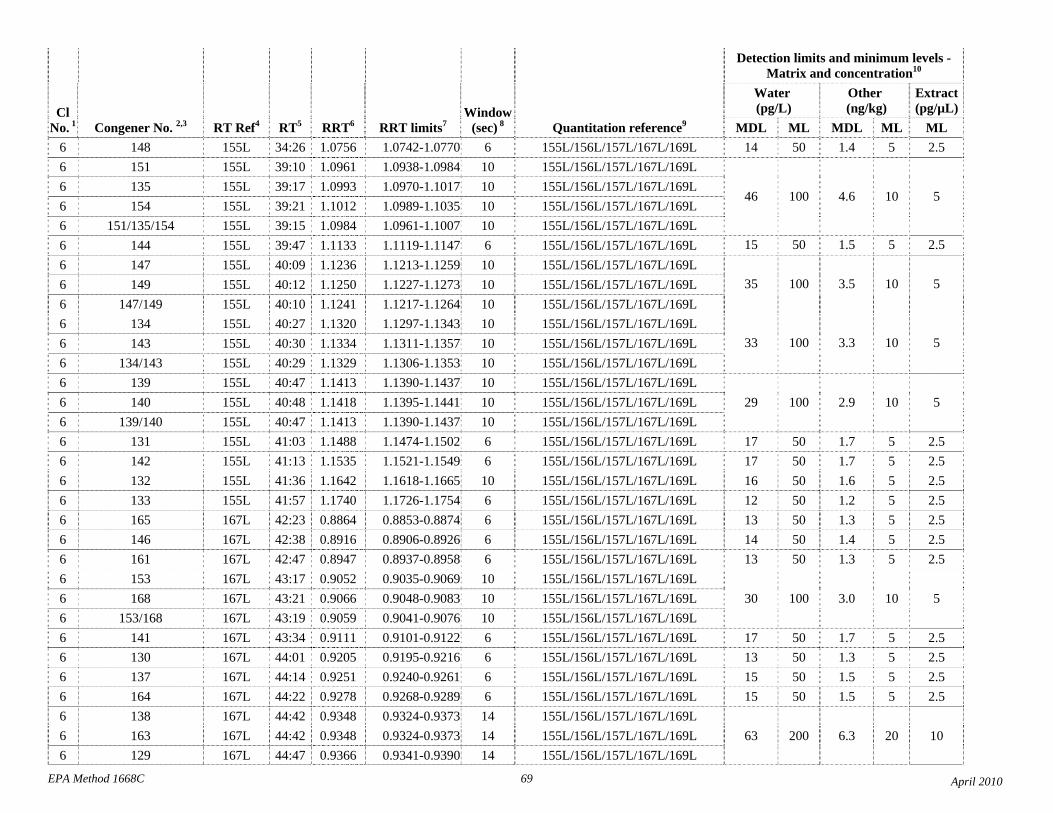
Detection limits and minimum levels - 10 Matrix and concentration
Cl
Window
Water (pg/L)
Other (ng/kg)
Extract (pg/µL)
1 No. 2,3 Congener No. RT Ref4 RT5 RRT6 RRT limits7 (sec) 8 Quantitation reference9 MDL ML MDL ML ML 6 148 155L 34:26 1.0756 1.0742-1.0770 6 155L/156L/157L/167L/169L 14 50 1.4 5 2.5 6 151 155L 39:10 1.0961 1.0938-1.0984 10 155L/156L/157L/167L/169L 6 6
135 154
155L 155L
39:17 39:21
1.0993 1.1012
1.0970-1.1017 1.0989-1.1035
10 10
155L/156L/157L/167L/169L 155L/156L/157L/167L/169L
46 100 4.6 10 5
6 151/135/154 155L 39:15 1.0984 1.0961-1.1007 10 155L/156L/157L/167L/169L 6 144 155L 39:47 1.1133 1.1119-1.1147 6 155L/156L/157L/167L/169L 15 50 1.5 5 2.5 6 147 155L 40:09 1.1236 1.1213-1.1259 10 155L/156L/157L/167L/169L 6 149 155L 40:12 1.1250 1.1227-1.1273 10 155L/156L/157L/167L/169L 35 100 3.5 10 56 147/149 155L 40:10 1.1241 1.1217-1.1264 10 155L/156L/157L/167L/169L 6 134 155L 40:27 1.1320 1.1297-1.1343 10 155L/156L/157L/167L/169L 6 143 155L 40:30 1.1334 1.1311-1.1357 10 155L/156L/157L/167L/169L 33 100 3.3 10 56 134/143 155L 40:29 1.1329 1.1306-1.1353 10 155L/156L/157L/167L/169L 6 139 155L 40:47 1.1413 1.1390-1.1437 10 155L/156L/157L/167L/169L 6 140 155L 40:48 1.1418 1.1395-1.1441 10 155L/156L/157L/167L/169L 29 100 2.9 10 56 139/140 155L 40:47 1.1413 1.1390-1.1437 10 155L/156L/157L/167L/169L 6 131 155L 41:03 1.1488 1.1474-1.1502 6 155L/156L/157L/167L/169L 17 50 1.7 5 2.5 6 142 155L 41:13 1.1535 1.1521-1.1549 6 155L/156L/157L/167L/169L 17 50 1.7 5 2.5 6 132 155L 41:36 1.1642 1.1618-1.1665 10 155L/156L/157L/167L/169L 16 50 1.6 5 2.5 6 133 155L 41:57 1.1740 1.1726-1.1754 6 155L/156L/157L/167L/169L 12 50 1.2 5 2.5 6 165 167L 42:23 0.8864 0.8853-0.8874 6 155L/156L/157L/167L/169L 13 50 1.3 5 2.5 6 146 167L 42:38 0.8916 0.8906-0.8926 6 155L/156L/157L/167L/169L 14 50 1.4 5 2.5 6 161 167L 42:47 0.8947 0.8937-0.8958 6 155L/156L/157L/167L/169L 13 50 1.3 5 2.5 6 153 167L 43:17 0.9052 0.9035-0.9069 10 155L/156L/157L/167L/169L 6 168 167L 43:21 0.9066 0.9048-0.9083 10 155L/156L/157L/167L/169L 30 100 3.0 10 56 153/168 167L 43:19 0.9059 0.9041-0.9076 10 155L/156L/157L/167L/169L 6 141 167L 43:34 0.9111 0.9101-0.9122 6 155L/156L/157L/167L/169L 17 50 1.7 5 2.5 6 130 167L 44:01 0.9205 0.9195-0.9216 6 155L/156L/157L/167L/169L 13 50 1.3 5 2.5 6 137 167L 44:14 0.9251 0.9240-0.9261 6 155L/156L/157L/167L/169L 15 50 1.5 5 2.5 6 164 167L 44:22 0.9278 0.9268-0.9289 6 155L/156L/157L/167L/169L 15 50 1.5 5 2.5 6 138 167L 44:42 0.9348 0.9324-0.9373 14 155L/156L/157L/167L/169L 6 163 167L 44:42 0.9348 0.9324-0.9373 14 155L/156L/157L/167L/169L 63 200 6.3 20 106 129 167L 44:47 0.9366 0.9341-0.9390 14 155L/156L/157L/167L/169L
EPA Method 1668C 69 April 2010
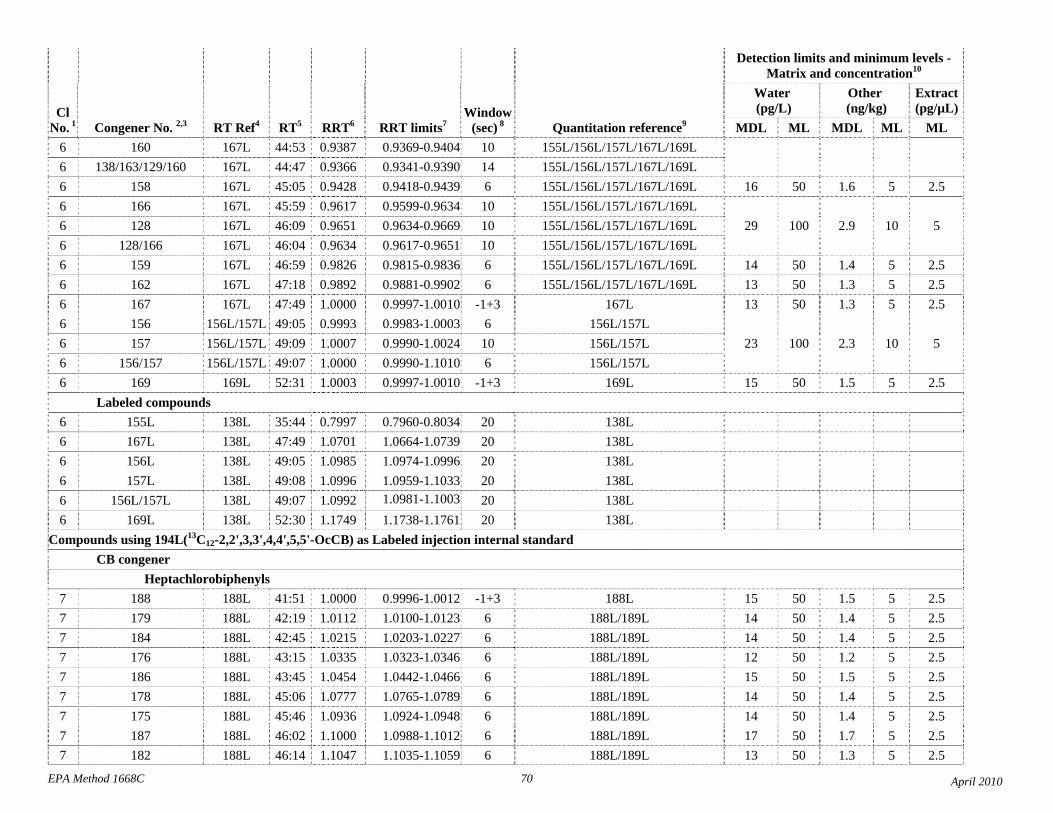
EPA Method 1668C 70 April 2010
Detection limits and minimum levels - 10 Matrix and concentration
Cl
Window
Water (pg/L)
Other (ng/kg)
Extract (pg/µL)
1 No. 2,3 Congener No. RT Ref4 RT5 RRT6 RRT limits7 (sec) 8 Quantitation reference9 MDL ML MDL ML ML 6 160 167L 44:53 0.9387 0.9369-0.9404 10 155L/156L/157L/167L/169L 6 138/163/129/160 167L 44:47 0.9366 0.9341-0.9390 14 155L/156L/157L/167L/169L 6 158 167L 45:05 0.9428 0.9418-0.9439 6 155L/156L/157L/167L/169L 16 50 1.6 5 2.5 6 166 167L 45:59 0.9617 0.9599-0.9634 10 155L/156L/157L/167L/169L 6 128 167L 46:09 0.9651 0.9634-0.9669 10 155L/156L/157L/167L/169L 29 100 2.9 10 56 128/166 167L 46:04 0.9634 0.9617-0.9651 10 155L/156L/157L/167L/169L 6 159 167L 46:59 0.9826 0.9815-0.9836 6 155L/156L/157L/167L/169L 14 50 1.4 5 2.5 6 162 167L 47:18 0.9892 0.9881-0.9902 6 155L/156L/157L/167L/169L 13 50 1.3 5 2.5 6 167 167L 47:49 1.0000 0.9997-1.0010 -1+3 167L 13 50 1.3 5 2.5 6 156 156L/157L 49:05 0.9993 0.9983-1.0003 6 156L/157L 6 157 156L/157L 49:09 1.0007 0.9990-1.0024 10 156L/157L 23 100 2.3 10 56 156/157 156L/157L 49:07 1.0000 0.9990-1.1010 6 156L/157L 6 169 169L 52:31 1.0003 0.9997-1.0010 -1+3 169L 15 50 1.5 5 2.5
Labeled compounds 6 155L 138L 35:44 0.7997 0.7960-0.8034 20 138L 6 167L 138L 47:49 1.0701 1.0664-1.0739 20 138L 6 156L 138L 49:05 1.0985 1.0974-1.0996 20 138L 6 157L 138L 49:08 1.0996 1.0959-1.1033 20 138L 6 156L/157L 138L 49:07 1.0992 1.0981-1.1003 20 138L 6 169L 138L 52:30 1.1749 1.1738-1.1761 20 138L
Compounds using 194L(13C12-2,2',3,3',4,4',5,5'-OcCB) as Labeled injection internal standard CB congener Heptachlorobiphenyls
7 188 188L 41:51 1.0000 0.9996-1.0012 -1+3 188L 15 50 1.5 5 2.5 7 179 188L 42:19 1.0112 1.0100-1.0123 6 188L/189L 14 50 1.4 5 2.5 7 184 188L 42:45 1.0215 1.0203-1.0227 6 188L/189L 14 50 1.4 5 2.5 7 176 188L 43:15 1.0335 1.0323-1.0346 6 188L/189L 12 50 1.2 5 2.5 7 186 188L 43:45 1.0454 1.0442-1.0466 6 188L/189L 15 50 1.5 5 2.5 7 178 188L 45:06 1.0777 1.0765-1.0789 6 188L/189L 14 50 1.4 5 2.5 7 175 188L 45:46 1.0936 1.0924-1.0948 6 188L/189L 14 50 1.4 5 2.5 7 187 188L 46:02 1.1000 1.0988-1.1012 6 188L/189L 17 50 1.7 5 2.5 7 182 188L 46:14 1.1047 1.1035-1.1059 6 188L/189L 13 50 1.3 5 2.5
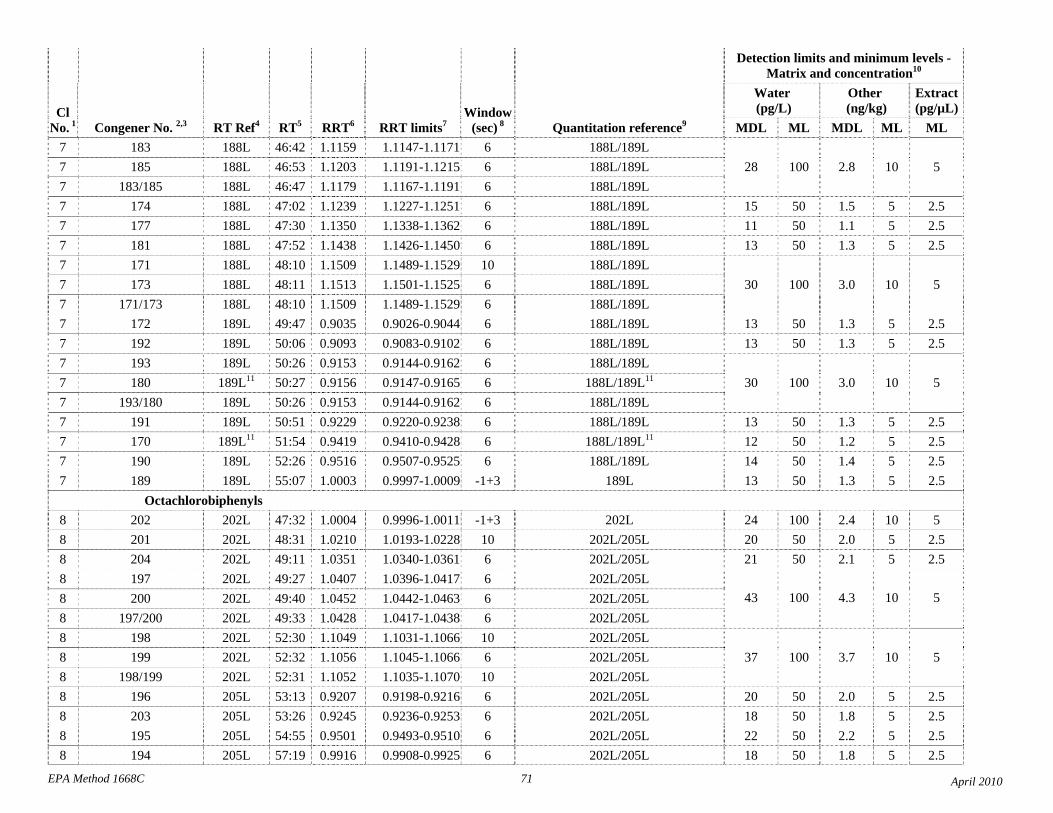
Detection limits and minimum levels - 10 Matrix and concentration
Cl
Window
Water (pg/L)
Other (ng/kg)
Extract (pg/µL)
1 No. 2,3 Congener No. RT Ref4 RT5 RRT6 RRT limits7 (sec) 8 Quantitation reference9 MDL ML MDL ML ML 7 183 188L 46:42 1.1159 1.1147-1.1171 6 188L/189L 7 185 188L 46:53 1.1203 1.1191-1.1215 6 188L/189L 28 100 2.8 10 57 183/185 188L 46:47 1.1179 1.1167-1.1191 6 188L/189L 7 174 188L 47:02 1.1239 1.1227-1.1251 6 188L/189L 15 50 1.5 5 2.5 7 177 188L 47:30 1.1350 1.1338-1.1362 6 188L/189L 11 50 1.1 5 2.5 7 181 188L 47:52 1.1438 1.1426-1.1450 6 188L/189L 13 50 1.3 5 2.5 7 171 188L 48:10 1.1509 1.1489-1.1529 10 188L/189L 7 173 188L 48:11 1.1513 1.1501-1.1525 6 188L/189L 30 100 3.0 10 57 171/173 188L 48:10 1.1509 1.1489-1.1529 6 188L/189L 7 172 189L 49:47 0.9035 0.9026-0.9044 6 188L/189L 13 50 1.3 5 2.5 7 192 189L 50:06 0.9093 0.9083-0.9102 6 188L/189L 13 50 1.3 5 2.5 7 193 189L 50:26 0.9153 0.9144-0.9162 6 188L/189L 7 180 189L11 50:27 0.9156 0.9147-0.9165 6 188L/189L11 30 100 3.0 10 57 193/180 189L 50:26 0.9153 0.9144-0.9162 6 188L/189L 7 191 189L 50:51 0.9229 0.9220-0.9238 6 188L/189L 13 50 1.3 5 2.5 7 170 189L11 51:54 0.9419 0.9410-0.9428 6 188L/189L11 12 50 1.2 5 2.5 7 190 189L 52:26 0.9516 0.9507-0.9525 6 188L/189L 14 50 1.4 5 2.5 7 189 189L 55:07 1.0003 0.9997-1.0009 -1+3 189L 13 50 1.3 5 2.5
Octachlorobipheny ls 8 202 202L 47:32 1.0004 0.9996-1.0011 -1+3 202L 24 100 2.4 10 5 8 201 202L 48:31 1.0210 1.0193-1.0228 10 202L/205L 20 50 2.0 5 2.5 8 204 202L 49:11 1.0351 1.0340-1.0361 6 202L/205L 21 50 2.1 5 2.5 8 197 202L 49:27 1.0407 1.0396-1.0417 6 202L/205L 8 200 202L 49:40 1.0452 1.0442-1.0463 6 202L/205L 43 100 4.3 10 58 197/200 202L 49:33 1.0428 1.0417-1.0438 6 202L/205L 8 198 202L 52:30 1.1049 1.1031-1.1066 10 202L/205L 8 199 202L 52:32 1.1056 1.1045-1.1066 6 202L/205L 37 100 3.7 10 58 198/199 202L 52:31 1.1052 1.1035-1.1070 10 202L/205L 8 196 205L 53:13 0.9207 0.9198-0.9216 6 202L/205L 20 50 2.0 5 2.5 8 203 205L 53:26 0.9245 0.9236-0.9253 6 202L/205L 18 50 1.8 5 2.5 8 195 205L 54:55 0.9501 0.9493-0.9510 6 202L/205L 22 50 2.2 5 2.5 8 194 205L 57:19 0.9916 0.9908-0.9925 6 202L/205L 18 50 1.8 5 2.5
EPA Method 1668C 71 April 2010
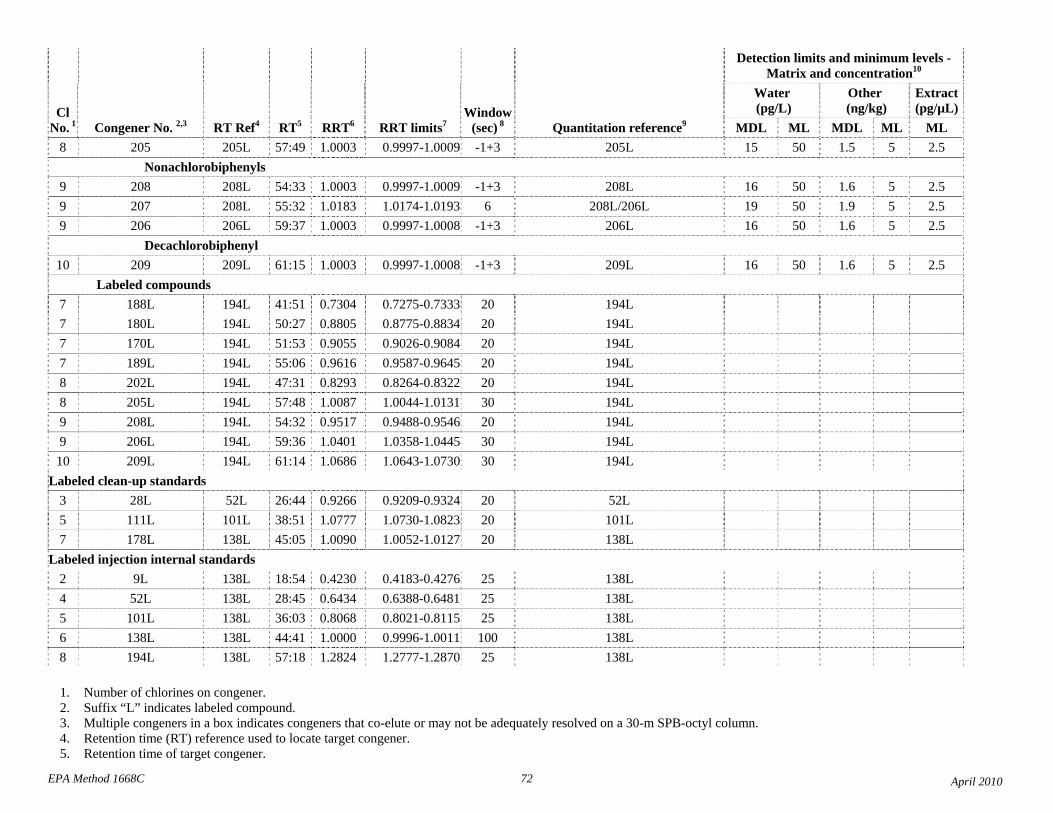
EPA Method 1668C 72 April 2010
Detection limits and minimum levels - 10 Matrix and concentration
Cl
1 No.8
2,3 Congener No. RT Ref4
205 205L
RT5
57:49
RRT6
1.0003
RRT limits7
0.9997-1.0009
Window
(sec) 8
-1+3
Quantitation reference9
205L
Water (pg/L)
MDL ML 15 50
Other (ng/kg)
MDL ML 1.5 5
Extract (pg/µL)
ML 2.5
Nonachlorobiphenyls 9 208 208L 54:33 1.0003 0.9997-1.0009 -1+3 208L 16 50 1.6 5 2.5 9 207 208L 55:32 1.0183 1.0174-1.0193 6 208L/206L 19 50 1.9 5 2.5 9 206 206L 59:37 1.0003 0.9997-1.0008 -1+3 206L 16 50 1.6 5 2.5
Decachlorobiphenyl 10 209 209L 61:15 1.0003 0.9997-1.0008 -1+3 209L 16 50 1.6 5 2.5
Labeled compounds 7 188L 194L 41:51 0.7304 0.7275-0.7333 20 194L 7 180L 194L 50:27 0.8805 0.8775-0.8834 20 194L 7 170L 194L 51:53 0.9055 0.9026-0.9084 20 194L 7 189L 194L 55:06 0.9616 0.9587-0.9645 20 194L 8 202L 194L 47:31 0.8293 0.8264-0.8322 20 194L 8 205L 194L 57:48 1.0087 1.0044-1.0131 30 194L 9 208L 194L 54:32 0.9517 0.9488-0.9546 20 194L 9 206L 194L 59:36 1.0401 1.0358-1.0445 30 194L
10 209L 194L 61:14 1.0686 1.0643-1.0730 30 194L Labeled clean-up standards
3 28L 52L 26:44 0.9266 0.9209-0.9324 20 52L 5 111L 101L 38:51 1.0777 1.0730-1.0823 20 101L 7 178L 138L 45:05 1.0090 1.0052-1.0127 20 138L
Labeled injection internal standards 2 9L 138L 18:54 0.4230 0.4183-0.4276 25 138L 4 52L 138L 28:45 0.6434 0.6388-0.6481 25 138L 5 101L 138L 36:03 0.8068 0.8021-0.8115 25 138L 6 138L 138L 44:41 1.0000 0.9996-1.0011 100 138L 8 194L 138L 57:18 1.2824 1.2777-1.2870 25 138L
1. Number of chlorines on congener. 2. Suffix “L” indicates labeled compound. 3. Multiple congeners in a box indicates congeners that co-elute or may not be adequately resolved on a 30-m SPB-octyl column. 4. Retention time (RT) reference used to locate target congener. 5. Retention time of target congener.
EPA Method 1668C 73 April 2010
6. Relative retention time (RRT) between the RT for the congener and RT for the reference. 7. RRT limits based on RT window. RTs, RRTs, and RRT limits may differ slightly from those in Table 2. 8. RT window width necessary to attempt to unambiguously identify the congener in the presence of other congeners. 9. Labeled congeners that form the quantitation reference. Areas from the exact m/z’s of the congeners listed in the quantitation reference are summed, and divided by the
number of congeners in the quantitation reference. For example, for congener 10, the areas at the exact m/z’s for 4L and 15L are summed and the sum is divided by 2 (because there are 2 congeners in the quantitation reference).
10. MDLs for water pooled from data from AXYS Analytical, TestAmerica-Knoxville, and Battelle-Columbus (see Reference 24). MLs for water per ML procedure at 68 FR 11790. MDLs and MLs for “Other” and “Extract” calculated from sample amount and extract volume.
11. If congeners 170L and 180L are included in the calibration and spiking solutions, these congeners should be used as RT and quantitation references.
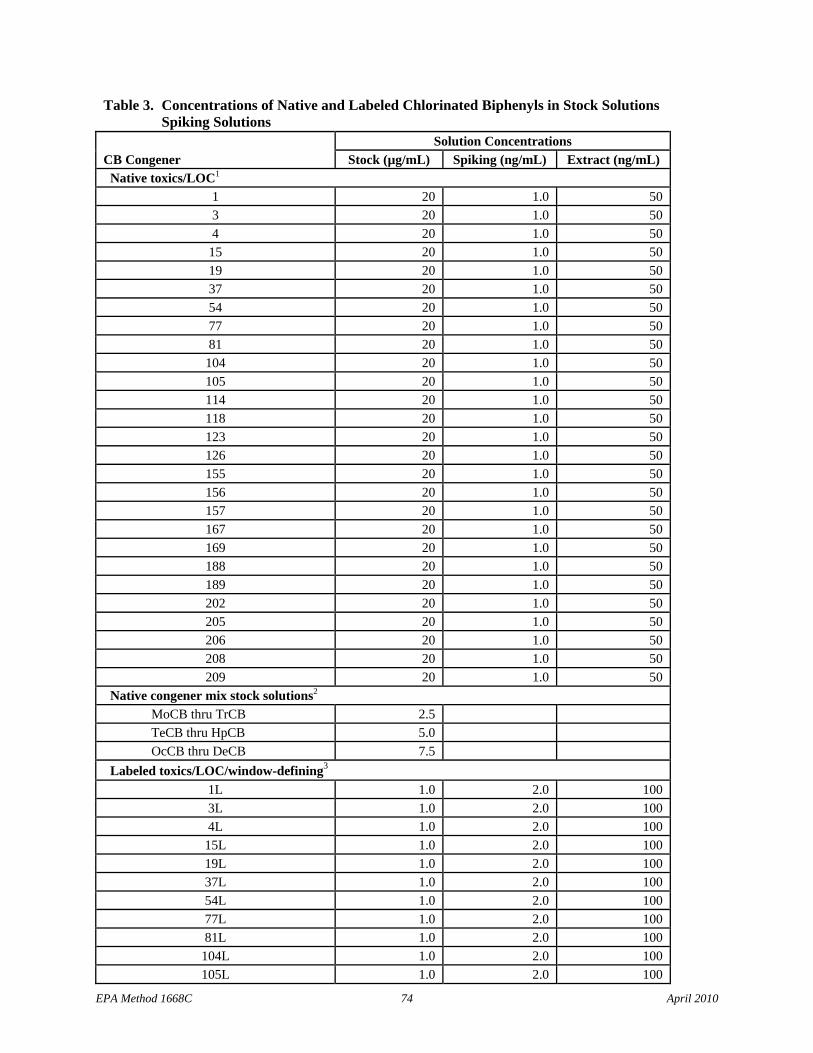
Table 3. Concentrations of Native and Labeled Chlorinated Biphenyls in Stock Solutions Spiking Solutions
CB Congener Solution Concentrations
Stock (µg/mL) Spiking (ng/mL) Extract (ng/mL) Native toxics/LOC1
1 20 1.0 50 3 20 1.0 50 4 20 1.0 50
15 20 1.0 50 19 20 1.0 50 37 20 1.0 50 54 20 1.0 50 77 20 1.0 50 81 20 1.0 50 104 20 1.0 50 105 20 1.0 50 114 20 1.0 50 118 20 1.0 50 123 20 1.0 50 126 20 1.0 50 155 20 1.0 50 156 20 1.0 50 157 20 1.0 50 167 20 1.0 50 169 20 1.0 50 188 20 1.0 50 189 20 1.0 50 202 20 1.0 50 205 20 1.0 50 206 20 1.0 50 208 20 1.0 50 209 20 1.0 50
Native congener mix stock solutions2
MoCB thru TrCB 2.5 TeCB thru HpCB 5.0 OcCB thru DeCB 7.5
Labeled toxics/LOC/window-defining3
1L 1.0 2.0 100 3L 1.0 2.0 100 4L 1.0 2.0 100 15L 1.0 2.0 100 19L 1.0 2.0 100 37L 1.0 2.0 100 54L 1.0 2.0 100 77L 1.0 2.0 100 81L 1.0 2.0 100
104L 1.0 2.0 100 105L 1.0 2.0 100
EPA Method 1668C 74 April 2010

Table 3. Concentrations of Native and Labeled Chlorinated Biphenyls in Stock Solutions Spiking Solutions
CB Congener Solution Concentrations
Stock (µg/mL) Spiking (ng/mL) Extract (ng/mL) 114L 1.0 2.0 100 118L 1.0 2.0 100 123L 1.0 2.0 100 126L 1.0 2.0 100 155L 1.0 2.0 100 156L 1.0 2.0 100 157L 1.0 2.0 100 167L 1.0 2.0 100 169L 1.0 2.0 100 188L 1.0 2.0 100 189L 1.0 2.0 100 202L 1.0 .2.0 100 205L 1.0 2.0 100 206L 1.0 2.0 100 208L 1.0 2.0 100 209L 1.0 2.0 100
Labeled clean-up4
28L 1.0 2.0 100 111L 1.0 2.0 100 178L 1.0 2.0 100
Labeled injection internal5
9L 5.0 1000 100 52L 5.0 1000 100
101L 5.0 1000 100 138L 5.0 1000 100 194L 5.0 1000 100
Diluted combined 209 congener6 Solution Concentration (ng/mL) Standard Native Labeled Native congeners
MoCB thru TrCB 25 TeCB thru HpCB 50 OcCB thru DeCB 75
Labeled toxics/LOC/window-defining 100 Labeled cleanup 100 Labeled injection internal 100
1. Stock solution: Section 7.8.1; Spiking solution: Section 7.11 2. Section 7.8.2.1 3. Stock solution: Section 7.9.1; Spiking solution: Section 7.12 4. Stock solution: Section 7.9.2; Spiking solution: Section 7.13 5. Stock solution: Section 7.9.3; Spiking solution: Section 7.14 6. Section 7.10.2.2.2
EPA Method 1668C 75 April 2010
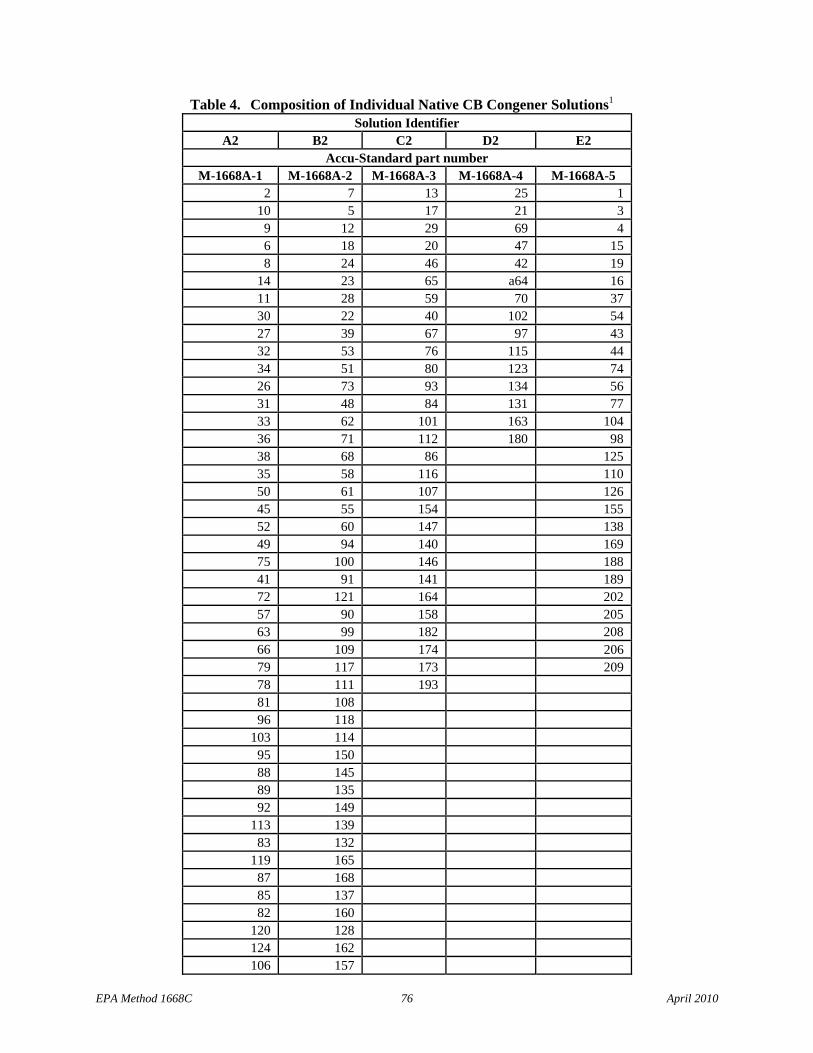
Table 4. Composition of Individual Native CB Congener Solutions1
Solution Identifier A2 B2 C2 D2 E2
Accu-Standard part number M-1668A-1 M-1668A-2 M-1668A-3 M-1668A-4 M-1668A-5
2 7 13 25 1 10 5 17 21 3
9 12 29 69 4 6 18 20 47 15 8 24 46 42 19
14 23 65 a64 16 11 28 59 70 37 30 22 40 102 54 27 39 67 97 43 32 53 76 115 44 34 51 80 123 74 26 73 93 134 56 31 48 84 131 77 33 62 101 163 104 36 71 112 180 98 38 68 86 125 35 58 116 110 50 61 107 126 45 55 154 155 52 60 147 138 49 94 140 169 75 100 146 188 41 91 141 189 72 121 164 202 57 90 158 205 63 99 182 208 66 109 174 206 79 117 173 209 78 111 193 81 108 96 118
103 114 95 150 88 145 89 135 92 149
113 139 83 132
119 165 87 168 85 137 82 160
120 128 124 162 106 157
EPA Method 1668C 76 April 2010
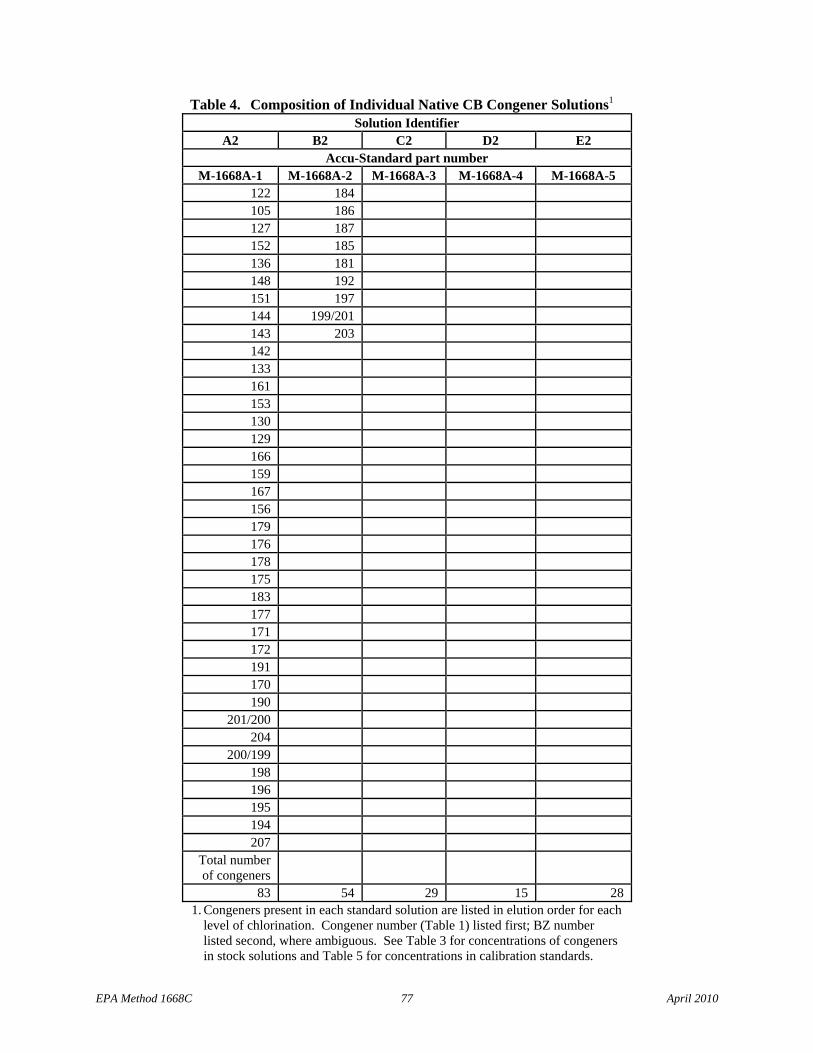
Table 4. Composition of Individual Native CB Congener Solutions1
Solution Identifier A2 B2 C2 D2 E2
Accu-Standard part number M-1668A-1 M-1668A-2 M-1668A-3 M-1668A-4 M-1668A-5
122 184 105 186 127 187 152 185 136 181 148 192 151 197 144 199/201 143 203 142 133 161 153 130 129 166 159 167 156 179 176 178 175 183 177 171 172 191 170 190
201/200 204
200/199 198 196 195 194 207
Total number of congeners
83 54 29 15 28 1. Congeners present in each standard solution are listed in elution order for each
level of chlorination. Congener number (Table 1) listed first; BZ number listed second, where ambiguous. See Table 3 for concentrations of congeners in stock solutions and Table 5 for concentrations in calibration standards.
EPA Method 1668C 77 April 2010
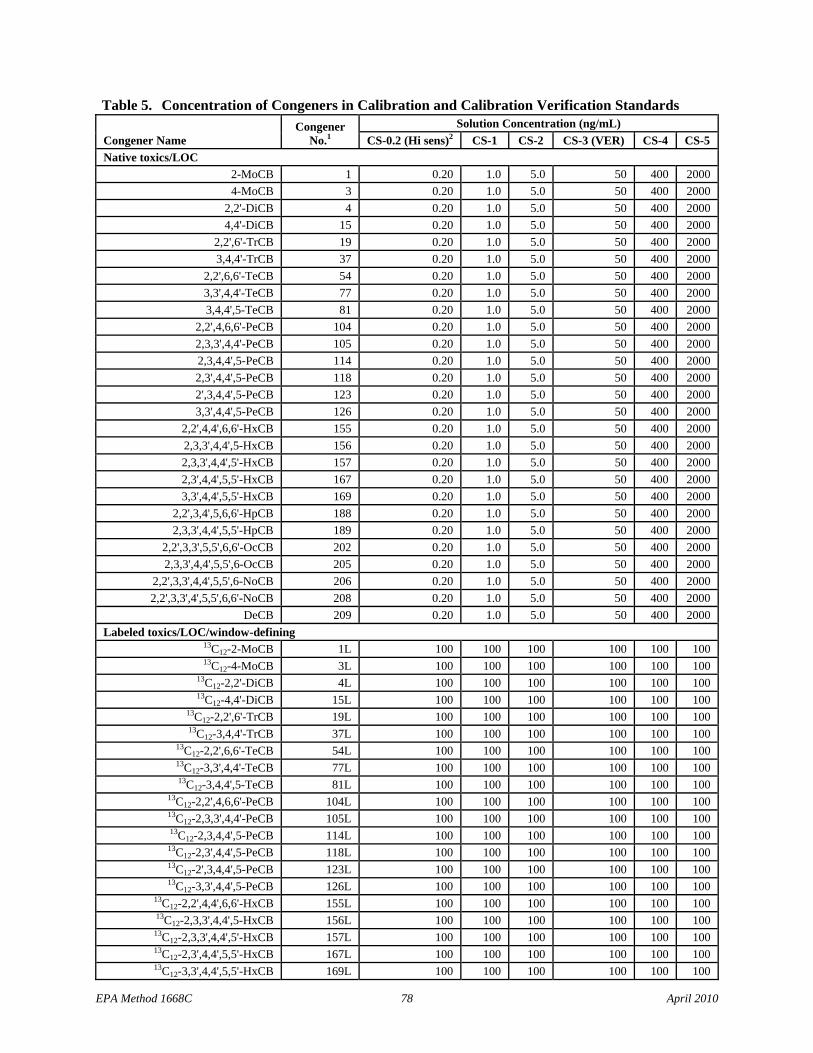
Table 5. Concentration of Congeners in Calibration and Calibration Verification Standards
Congener Name Congener
No.1 Solution Concentration (ng/mL)
CS-0.2 (Hi sens)2 CS-1 CS-2 CS-3 (VER) CS-4 CS-5 Native toxics/LOC
2-MoCB 1 0.20 1.0 5.0 50 400 2000 4-MoCB 3 0.20 1.0 5.0 50 400 2000
2,2'-DiCB 4 0.20 1.0 5.0 50 400 2000 4,4'-DiCB 15 0.20 1.0 5.0 50 400 2000
2,2',6'-TrCB 19 0.20 1.0 5.0 50 400 2000 3,4,4'-TrCB 37 0.20 1.0 5.0 50 400 2000
2,2',6,6'-TeCB 54 0.20 1.0 5.0 50 400 2000 3,3',4,4'-TeCB 77 0.20 1.0 5.0 50 400 2000 3,4,4',5-TeCB 81 0.20 1.0 5.0 50 400 2000
2,2',4,6,6'-PeCB 104 0.20 1.0 5.0 50 400 2000 2,3,3',4,4'-PeCB 105 0.20 1.0 5.0 50 400 2000 2,3,4,4',5-PeCB 114 0.20 1.0 5.0 50 400 2000 2,3',4,4',5-PeCB 118 0.20 1.0 5.0 50 400 2000 2',3,4,4',5-PeCB 123 0.20 1.0 5.0 50 400 2000 3,3',4,4',5-PeCB 126 0.20 1.0 5.0 50 400 2000
2,2',4,4',6,6'-HxCB 155 0.20 1.0 5.0 50 400 2000 2,3,3',4,4',5-HxCB 156 0.20 1.0 5.0 50 400 2000 2,3,3',4,4',5'-HxCB 157 0.20 1.0 5.0 50 400 2000 2,3',4,4',5,5'-HxCB 167 0.20 1.0 5.0 50 400 2000 3,3',4,4',5,5'-HxCB 169 0.20 1.0 5.0 50 400 2000
2,2',3,4',5,6,6'-HpCB 188 0.20 1.0 5.0 50 400 2000 2,3,3',4,4',5,5'-HpCB 189 0.20 1.0 5.0 50 400 2000
2,2',3,3',5,5',6,6'-OcCB 202 0.20 1.0 5.0 50 400 2000 2,3,3',4,4',5,5',6-OcCB 205 0.20 1.0 5.0 50 400 2000
2,2',3,3',4,4',5,5',6-NoCB 206 0.20 1.0 5.0 50 400 2000 2,2',3,3',4',5,5',6,6'-NoCB 208 0.20 1.0 5.0 50 400 2000
DeCB 209 0.20 1.0 5.0 50 400 2000 Labeled toxics/LOC/window-defining
13C12-2-MoCB 1L 100 100 100 100 100 100 13C12-4-MoCB 3L 100 100 100 100 100 100
13C12-2,2'-DiCB 4L 100 100 100 100 100 100 13C12-4,4'-DiCB 15L 100 100 100 100 100 100
13C12-2,2',6'-TrCB 19L 100 100 100 100 100 100 13C12-3,4,4'-TrCB 37L 100 100 100 100 100 100
13C12-2,2',6,6'-TeCB 54L 100 100 100 100 100 100 13C12-3,3',4,4'-TeCB 77L 100 100 100 100 100 100 13C12-3,4,4',5-TeCB 81L 100 100 100 100 100 100
13C12-2,2',4,6,6'-PeCB 104L 100 100 100 100 100 100 13C12-2,3,3',4,4'-PeCB 105L 100 100 100 100 100 100 13C12-2,3,4,4',5-PeCB 114L 100 100 100 100 100 100
13C12-2,3',4,4',5-PeCB 118L 100 100 100 100 100 100 13C12-2',3,4,4',5-PeCB 123L 100 100 100 100 100 100 13C12-3,3',4,4',5-PeCB 126L 100 100 100 100 100 100
13C12-2,2',4,4',6,6'-HxCB 155L 100 100 100 100 100 100 13C12-2,3,3',4,4',5-HxCB 156L 100 100 100 100 100 100
13C12-2,3,3',4,4',5'-HxCB 157L 100 100 100 100 100 100 13C12-2,3',4,4',5,5'-HxCB 167L 100 100 100 100 100 100 13C12-3,3',4,4',5,5'-HxCB 169L 100 100 100 100 100 100
EPA Method 1668C 78 April 2010
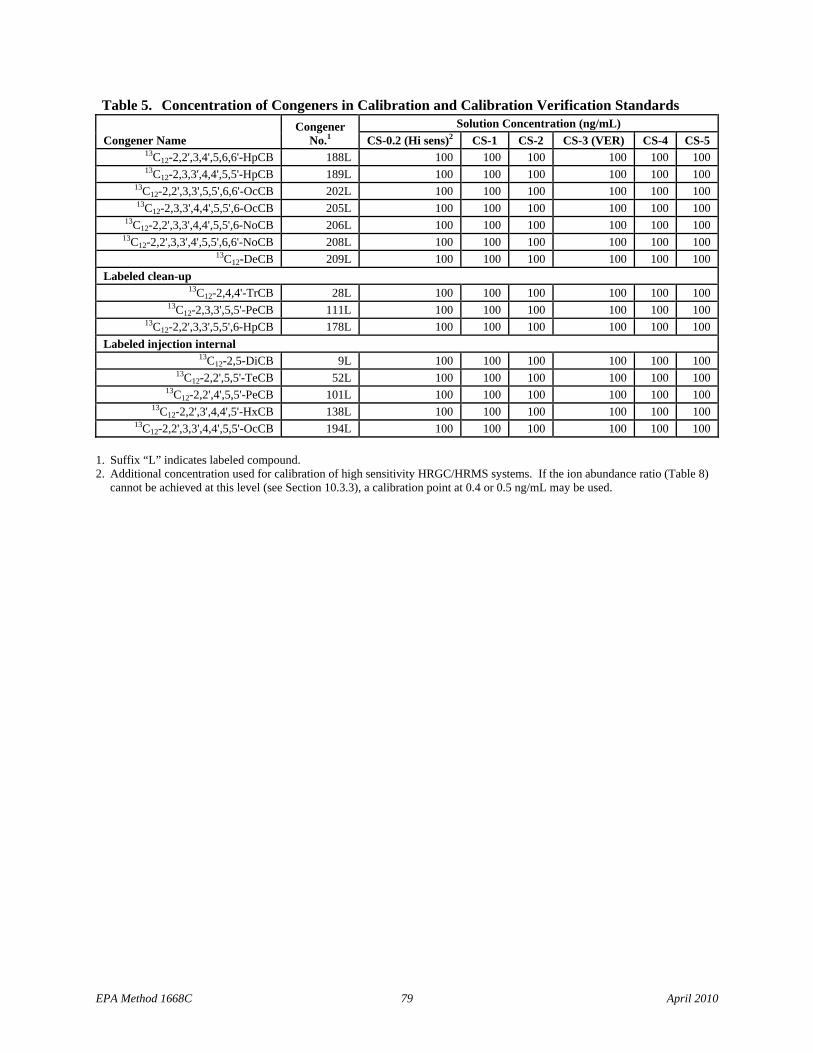
Table 5. Concentration of Congeners in Calibration and Calibration Verification Standards
Congener Name Congener
No.1 Solution Concentration (ng/mL)
CS-0.2 (Hi sens)2 CS-1 CS-2 CS-3 (VER) CS-4 CS-5 13C12-2,2',3,4',5,6,6'-HpCB 188L 100 100 100 100 100 100 13C12-2,3,3',4,4',5,5'-HpCB 189L 100 100 100 100 100 100
13C12-2,2',3,3',5,5',6,6'-OcCB 202L 100 100 100 100 100 100 13C12-2,3,3',4,4',5,5',6-OcCB 205L 100 100 100 100 100 100
13C12-2,2',3,3',4,4',5,5',6-NoCB 206L 100 100 100 100 100 100 13C12-2,2',3,3',4',5,5',6,6'-NoCB 208L 100 100 100 100 100 100
13C12-DeCB 209L 100 100 100 100 100 100 Labeled clean-up
13C12-2,4,4'-TrCB 28L 100 100 100 100 100 100 13C12-2,3,3',5,5'-PeCB 111L 100 100 100 100 100 100
13C12-2,2',3,3',5,5',6-HpCB 178L 100 100 100 100 100 100 Labeled injection internal
13C12-2,5-DiCB 9L 100 100 100 100 100 100 13C12-2,2',5,5'-TeCB 52L 100 100 100 100 100 100
13C12-2,2',4',5,5'-PeCB 101L 100 100 100 100 100 100 13C12-2,2',3',4,4',5'-HxCB 138L 100 100 100 100 100 100
13C12-2,2',3,3',4,4',5,5'-OcCB 194L 100 100 100 100 100 100
1. Suffix “L” indicates labeled compound. 2. Additional concentration used for calibration of high sensitivity HRGC/HRMS systems. If the ion abundance ratio (Table 8)
cannot be achieved at this level (see Section 10.3.3), a calibration point at 0.4 or 0.5 ng/mL may be used.
EPA Method 1668C 79 April 2010
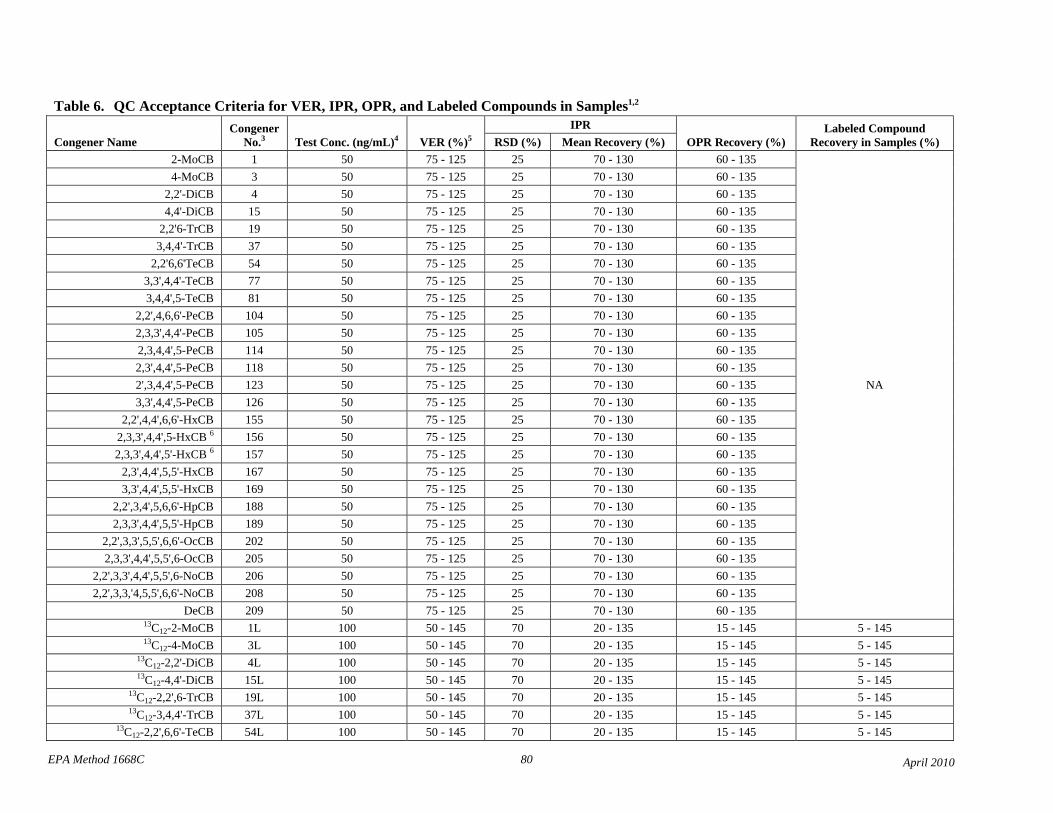
EPA Method 1668C 80 April 2010
Table 6. QC Acceptance Criteria for VER, IPR, OPR, and Labeled Compounds in Samples1,2
Congener Name Congener
No.3 Test Conc. (ng/mL)4 VER (%)5 IPR
OPR Recovery (%) Labeled Compound
Recovery in Samples (%) RSD (%) Mean Recovery (%) 2-MoCB 1 50 75 - 125 25 70 - 130 60 - 135
NA
4-MoCB 3 50 75 - 125 25 70 - 130 60 - 135 2,2'-DiCB 4 50 75 - 125 25 70 - 130 60 - 135 4,4'-DiCB 15 50 75 - 125 25 70 - 130 60 - 135
2,2'6-TrCB 19 50 75 - 125 25 70 - 130 60 - 135 3,4,4'-TrCB 37 50 75 - 125 25 70 - 130 60 - 135
2,2'6,6'TeCB 54 50 75 - 125 25 70 - 130 60 - 135 3,3',4,4'-TeCB 77 50 75 - 125 25 70 - 130 60 - 135 3,4,4',5-TeCB 81 50 75 - 125 25 70 - 130 60 - 135
2,2',4,6,6'-PeCB 104 50 75 - 125 25 70 - 130 60 - 135 2,3,3',4,4'-PeCB 105 50 75 - 125 25 70 - 130 60 - 135 2,3,4,4',5-PeCB 114 50 75 - 125 25 70 - 130 60 - 135 2,3',4,4',5-PeCB 118 50 75 - 125 25 70 - 130 60 - 135 2',3,4,4',5-PeCB 123 50 75 - 125 25 70 - 130 60 - 135 3,3',4,4',5-PeCB 126 50 75 - 125 25 70 - 130 60 - 135
2,2',4,4',6,6'-HxCB 155 50 75 - 125 25 70 - 130 60 - 135 2,3,3',4,4',5-HxCB 6 156 50 75 - 125 25 70 - 130 60 - 135
2,3,3',4,4',5'-HxCB 6 157 50 75 - 125 25 70 - 130 60 - 135 2,3',4,4',5,5'-HxCB 167 50 75 - 125 25 70 - 130 60 - 135 3,3',4,4',5,5'-HxCB 169 50 75 - 125 25 70 - 130 60 - 135
2,2',3,4',5,6,6'-HpCB 188 50 75 - 125 25 70 - 130 60 - 135 2,3,3',4,4',5,5'-HpCB 189 50 75 - 125 25 70 - 130 60 - 135
2,2',3,3',5,5',6,6'-OcCB 202 50 75 - 125 25 70 - 130 60 - 135 2,3,3',4,4',5,5',6-OcCB 205 50 75 - 125 25 70 - 130 60 - 135
2,2',3,3',4,4',5,5',6-NoCB 206 50 75 - 125 25 70 - 130 60 - 135 2,2',3,3,'4,5,5',6,6'-NoCB 208 50 75 - 125 25 70 - 130 60 - 135
DeCB 209 50 75 - 125 25 70 - 130 60 - 135 13C12-2-MoCB 1L 100 50 - 145 70 20 - 135 15 - 145 5 - 145 13C12-4-MoCB 3L 100 50 - 145 70 20 - 135 15 - 145 5 - 145
13C12-2,2'-DiCB 4L 100 50 - 145 70 20 - 135 15 - 145 5 - 145 13C12-4,4'-DiCB 15L 100 50 - 145 70 20 - 135 15 - 145 5 - 145
13C12-2,2',6-TrCB 19L 100 50 - 145 70 20 - 135 15 - 145 5 - 145 13C12-3,4,4'-TrCB 37L 100 50 - 145 70 20 - 135 15 - 145 5 - 145
13C12-2,2',6,6'-TeCB 54L 100 50 - 145 70 20 - 135 15 - 145 5 - 145
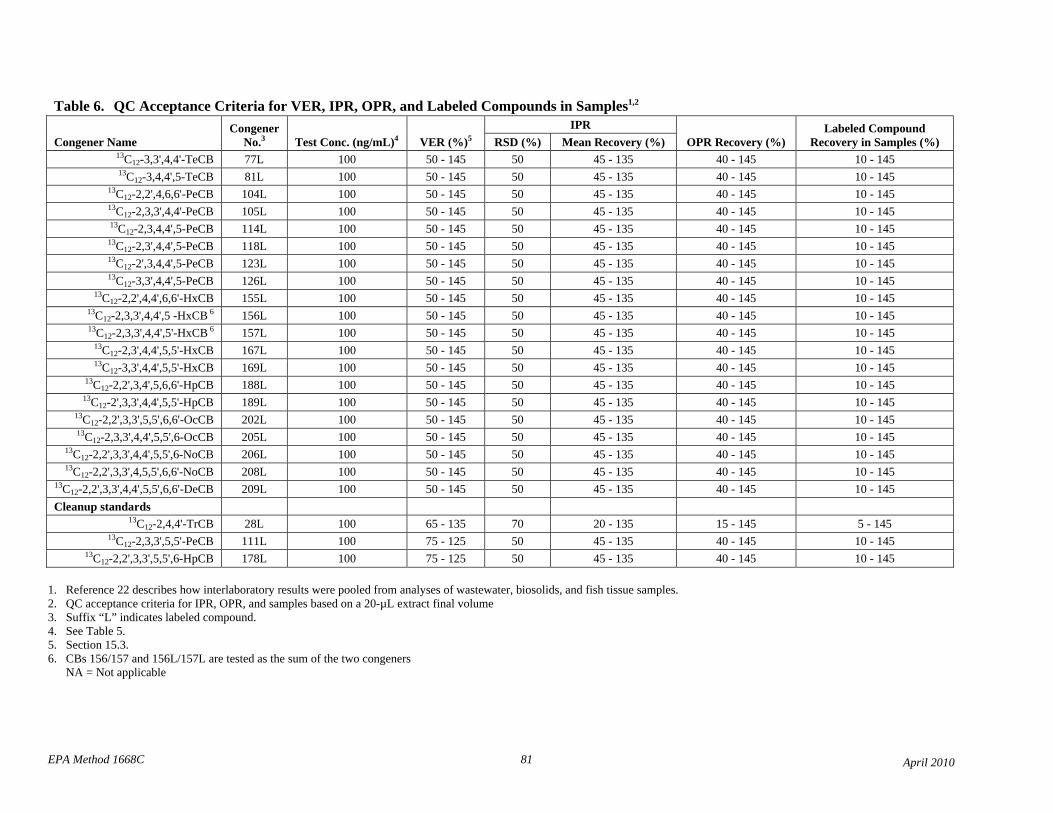
EPA Method 1668C 81 April 2010
Table 6. QC Acceptance Criteria for VER, IPR, OPR, and Labeled Compounds in Samples1,2
Congener Name Congener
No.3 Test Conc. (ng/mL)4 VER (%)5 IPR
OPR Recovery (%) Labeled Compound
Recovery in Samples (%) RSD (%) Mean Recovery (%) 13C12-3,3',4,4'-TeCB 77L 100 50 - 145 50 45 - 135 40 - 145 10 - 145 13C12-3,4,4',5-TeCB 81L 100 50 - 145 50 45 - 135 40 - 145 10 - 145
13C12-2,2',4,6,6'-PeCB 104L 100 50 - 145 50 45 - 135 40 - 145 10 - 145 13C12-2,3,3',4,4'-PeCB 105L 100 50 - 145 50 45 - 135 40 - 145 10 - 145 13C12-2,3,4,4',5-PeCB 114L 100 50 - 145 50 45 - 135 40 - 145 10 - 145
13C12-2,3',4,4',5-PeCB 118L 100 50 - 145 50 45 - 135 40 - 145 10 - 145 13C12-2',3,4,4',5-PeCB 123L 100 50 - 145 50 45 - 135 40 - 145 10 - 145 13C12-3,3',4,4',5-PeCB 126L 100 50 - 145 50 45 - 135 40 - 145 10 - 145
13C12-2,2',4,4',6,6'-HxCB 155L 100 50 - 145 50 45 - 135 40 - 145 10 - 145 13C12-2,3,3',4,4',5 -HxCB 6 156L 100 50 - 145 50 45 - 135 40 - 145 10 - 145 13C12-2,3,3',4,4',5'-HxCB 6 157L 100 50 - 145 50 45 - 135 40 - 145 10 - 145
13C12-2,3',4,4',5,5'-HxCB 167L 100 50 - 145 50 45 - 135 40 - 145 10 - 145 13C12-3,3',4,4',5,5'-HxCB 169L 100 50 - 145 50 45 - 135 40 - 145 10 - 145
13C12-2,2',3,4',5,6,6'-HpCB 188L 100 50 - 145 50 45 - 135 40 - 145 10 - 145 13C12-2',3,3',4,4',5,5'-HpCB 189L 100 50 - 145 50 45 - 135 40 - 145 10 - 145
13C12-2,2',3,3',5,5',6,6'-OcCB 202L 100 50 - 145 50 45 - 135 40 - 145 10 - 145 13C12-2,3,3',4,4',5,5',6-OcCB 205L 100 50 - 145 50 45 - 135 40 - 145 10 - 145
13C12-2,2',3,3',4,4',5,5',6-NoCB 206L 100 50 - 145 50 45 - 135 40 - 145 10 - 145 13C12-2,2',3,3',4,5,5',6,6'-NoCB 208L 100 50 - 145 50 45 - 135 40 - 145 10 - 145
13C12-2,2',3,3',4,4',5,5',6,6'-DeCB 209L 100 50 - 145 50 45 - 135 40 - 145 10 - 145 Cleanup standards
13C12-2,4,4'-TrCB 28L 100 65 - 135 70 20 - 135 15 - 145 5 - 145 13C12-2,3,3',5,5'-PeCB 111L 100 75 - 125 50 45 - 135 40 - 145 10 - 145
13C12-2,2',3,3',5,5',6-HpCB 178L 100 75 - 125 50 45 - 135 40 - 145 10 - 145
1. Reference 22 describes how interlaboratory results were pooled from analys es of wastewater, biosolids, and fish tissue samples. 2. QC acceptance criteria for IP R, OPR, and samples based on a 20-µL extract final volume 3. Suffix “L” indicates labeled compound. 4. See Table 5.
5. Section 15.3 . 6. CBs 156/157 and 156L/157L are tested as the sum of the two con geners NA = Not applicable
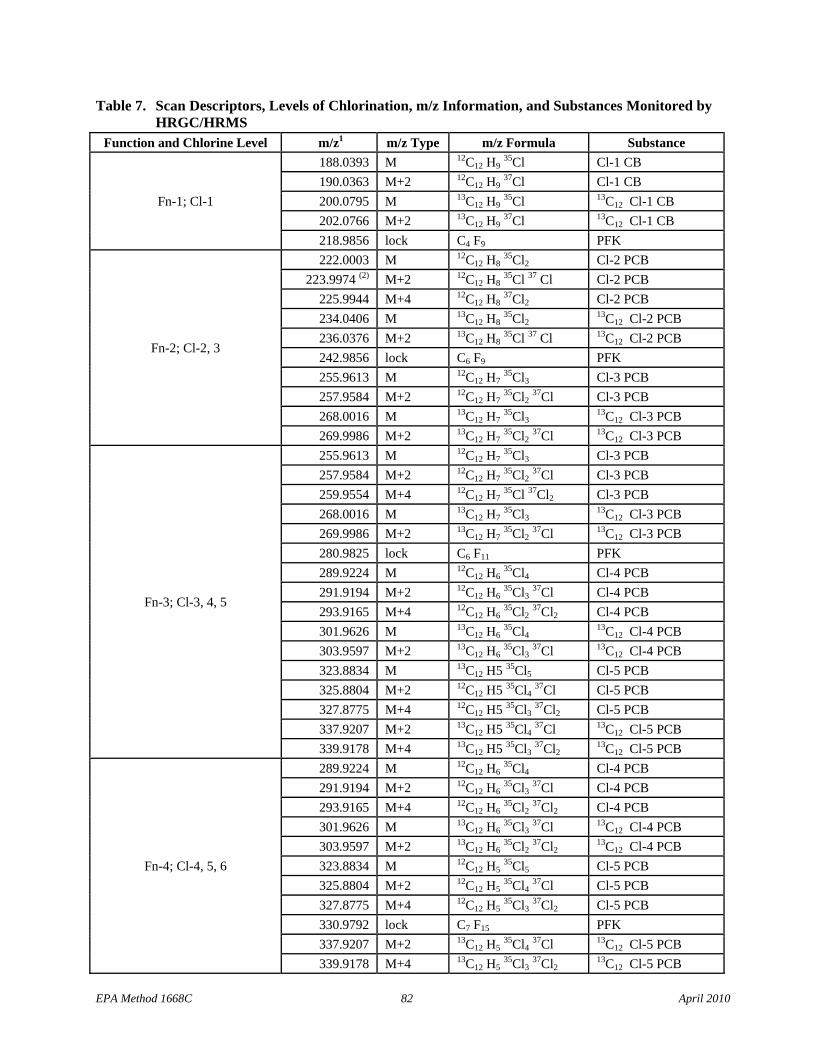
Table 7. Scan Descriptors, Levels of Chlorination, m/z Information, and Substances Monitored by HRGC/HRMS
Function and Chlorine Level m/z1 m/z Type m/z Formula Substance
Fn-1; Cl-1
188.0393 M 12C12 H9 35Cl Cl-1 CB
190.0363 M+2 12C12 H9 37Cl Cl-1 CB
200.0795 M 13C12 H9 35Cl 13C12 Cl-1 CB
202.0766 M+2 13C12 H9 37Cl 13C12 Cl-1 CB
218.9856 lock C4 F9 PFK
Fn-2; Cl-2, 3
222.0003 M 12C12 H8 35Cl2 Cl-2 PCB
223.9974 (2) M+2 12C12 H8 35Cl 37 Cl Cl-2 PCB
225.9944 M+4 12C12 H8 37Cl2 Cl-2 PCB
234.0406 M 13C12 H8 35Cl2
13C12 Cl-2 PCB 236.0376 M+2 13C12 H8
35Cl 37 Cl 13C12 Cl-2 PCB 242.9856 lock C6 F9 PFK 255.9613 M 12C12 H7
35Cl3 Cl-3 PCB 257.9584 M+2 12C12 H7
35Cl2 37Cl Cl-3 PCB
268.0016 M 13C12 H7 35Cl3
13C12 Cl-3 PCB 269.9986 M+2 13C12 H7
35Cl2 37Cl 13C12 Cl-3 PCB
Fn-3; Cl-3, 4, 5
255.9613 M 12C12 H7 35Cl3 Cl-3 PCB
257.9584 M+2 12C12 H7 35Cl2
37Cl Cl-3 PCB 259.9554 M+4 12C12 H7
35Cl 37Cl2 Cl-3 PCB 268.0016 M 13C12 H7
35Cl3 13C12 Cl-3 PCB
269.9986 M+2 13C12 H7 35Cl2
37Cl 13C12 Cl-3 PCB 280.9825 lock C6 F11 PFK 289.9224 M 12C12 H6
35Cl4 Cl-4 PCB 291.9194 M+2 12C12 H6
35Cl3 37Cl Cl-4 PCB
293.9165 M+4 12C12 H6 35Cl2
37Cl2 Cl-4 PCB 301.9626 M 13C12 H6
35Cl4 13C12 Cl-4 PCB
303.9597 M+2 13C12 H6 35Cl3
37Cl 13C12 Cl-4 PCB 323.8834 M 13C12 H5 35Cl5 Cl-5 PCB 325.8804 M+2 12C12 H5 35Cl4
37Cl Cl-5 PCB 327.8775 M+4 12C12 H5 35Cl3
37Cl2 Cl-5 PCB 337.9207 M+2 13C12 H5 35Cl4
37Cl 13C12 Cl-5 PCB 339.9178 M+4 13C12 H5 35Cl3
37Cl2 13C12 Cl-5 PCB
Fn-4; Cl-4, 5, 6
289.9224 M 12C12 H6 35Cl4 Cl-4 PCB
291.9194 M+2 12C12 H6 35Cl3
37Cl Cl-4 PCB 293.9165 M+4 12C12 H6
35Cl2 37Cl2 Cl-4 PCB
301.9626 M 13C12 H6 35Cl3
37Cl 13C12 Cl-4 PCB 303.9597 M+2 13C12 H6
35Cl2 37Cl2
13C12 Cl-4 PCB 323.8834 M 12C12 H5
35Cl5 Cl-5 PCB 325.8804 M+2 12C12 H5
35Cl4 37Cl Cl-5 PCB
327.8775 M+4 12C12 H5 35Cl3
37Cl2 Cl-5 PCB 330.9792 lock C7 F15 PFK 337.9207 M+2 13C12 H5
35Cl4 37Cl 13C12 Cl-5 PCB
339.9178 M+4 13C12 H5 35Cl3
37Cl2 13C12 Cl-5 PCB
EPA Method 1668C 82 April 2010
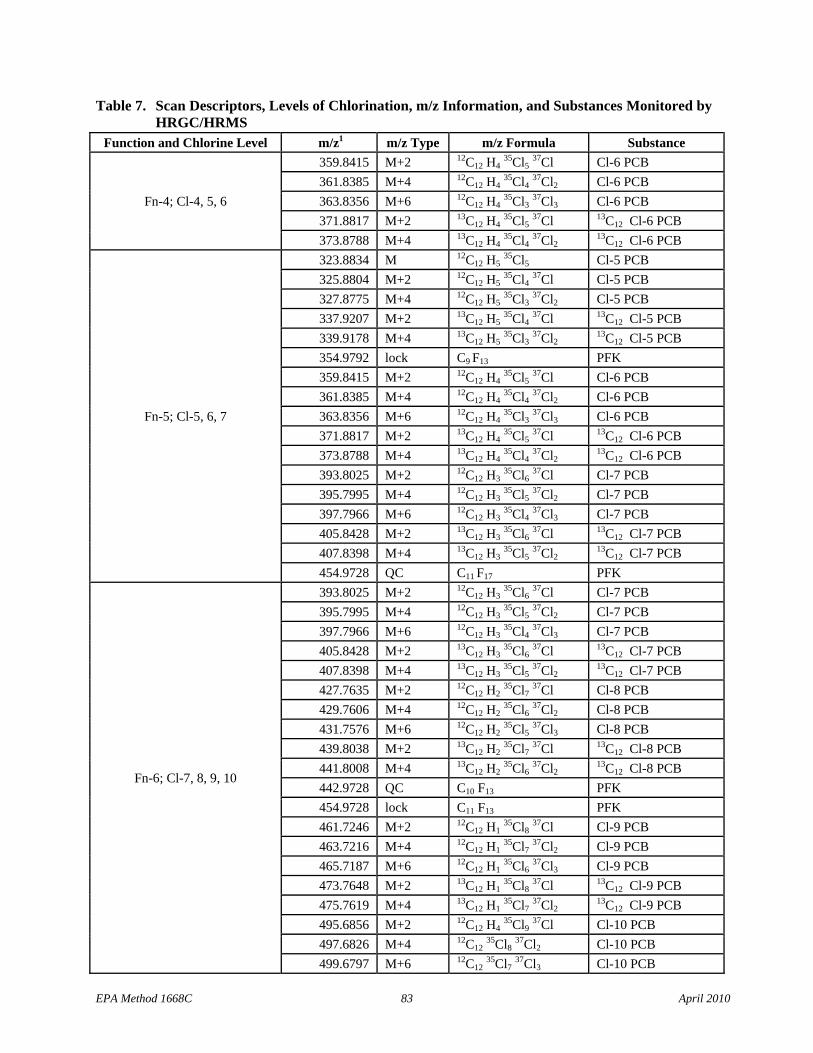
Table 7. Scan Descriptors, Levels of Chlorination, m/z Information, and Substances Monitored by HRGC/HRMS
Function and Chlorine Level m/z1 m/z Type m/z Formula Substance
Fn-4; Cl-4, 5, 6
359.8415 M+2 12C12 H4 35Cl5
37Cl Cl-6 PCB 361.8385 M+4 12C12 H4
35Cl4 37Cl2 Cl-6 PCB
363.8356 M+6 12C12 H4 35Cl3
37Cl3 Cl-6 PCB 371.8817 M+2 13C12 H4
35Cl5 37Cl 13C12 Cl-6 PCB
373.8788 M+4 13C12 H4 35Cl4
37Cl2 13C12 Cl-6 PCB
Fn-5; Cl-5, 6, 7
323.8834 M 12C12 H5 35Cl5 Cl-5 PCB
325.8804 M+2 12C12 H5 35Cl4
37Cl Cl-5 PCB 327.8775 M+4 12C12 H5
35Cl3 37Cl2 Cl-5 PCB
337.9207 M+2 13C12 H5 35Cl4
37Cl 13C12 Cl-5 PCB 339.9178 M+4 13C12 H5
35Cl3 37Cl2
13C12 Cl-5 PCB 354.9792 lock C9 F13 PFK 359.8415 M+2 12C12 H4
35Cl5 37Cl Cl-6 PCB
361.8385 M+4 12C12 H4 35Cl4
37Cl2 Cl-6 PCB 363.8356 M+6 12C12 H4
35Cl3 37Cl3 Cl-6 PCB
371.8817 M+2 13C12 H4 35Cl5
37Cl 13C12 Cl-6 PCB 373.8788 M+4 13C12 H4
35Cl4 37Cl2
13C12 Cl-6 PCB 393.8025 M+2 12C12 H3
35Cl6 37Cl Cl-7 PCB
395.7995 M+4 12C12 H3 35Cl5
37Cl2 Cl-7 PCB 397.7966 M+6 12C12 H3
35Cl4 37Cl3 Cl-7 PCB
405.8428 M+2 13C12 H3 35Cl6
37Cl 13C12 Cl-7 PCB 407.8398 M+4 13C12 H3
35Cl5 37Cl2
13C12 Cl-7 PCB 454.9728 QC C11 F17 PFK
Fn-6; Cl-7, 8, 9, 10
393.8025 M+2 12C12 H3 35Cl6
37Cl Cl-7 PCB 395.7995 M+4 12C12 H3
35Cl5 37Cl2 Cl-7 PCB
397.7966 M+6 12C12 H3 35Cl4
37Cl3 Cl-7 PCB 405.8428 M+2 13C12 H3
35Cl6 37Cl 13C12 Cl-7 PCB
407.8398 M+4 13C12 H3 35Cl5
37Cl2 13C12 Cl-7 PCB
427.7635 M+2 12C12 H2 35Cl7
37Cl Cl-8 PCB 429.7606 M+4 12C12 H2
35Cl6 37Cl2 Cl-8 PCB
431.7576 M+6 12C12 H2 35Cl5
37Cl3 Cl-8 PCB 439.8038 M+2 13C12 H2
35Cl7 37Cl 13C12 Cl-8 PCB
441.8008 M+4 13C12 H2 35Cl6
37Cl2 13C12 Cl-8 PCB
442.9728 QC C10 F13 PFK 454.9728 lock C11 F13 PFK 461.7246 M+2 12C12 H1
35Cl8 37Cl Cl-9 PCB
463.7216 M+4 12C12 H1 35Cl7
37Cl2 Cl-9 PCB 465.7187 M+6 12C12 H1
35Cl6 37Cl3 Cl-9 PCB
473.7648 M+2 13C12 H1 35Cl8
37Cl 13C12 Cl-9 PCB 475.7619 M+4 13C12 H1
35Cl7 37Cl2
13C12 Cl-9 PCB 495.6856 M+2 12C12 H4
35Cl9 37Cl Cl-10 PCB
497.6826 M+4 12C12 35Cl8
37Cl2 Cl-10 PCB 499.6797 M+6 12C12
35Cl7 37Cl3 Cl-10 PCB
EPA Method 1668C 83 April 2010
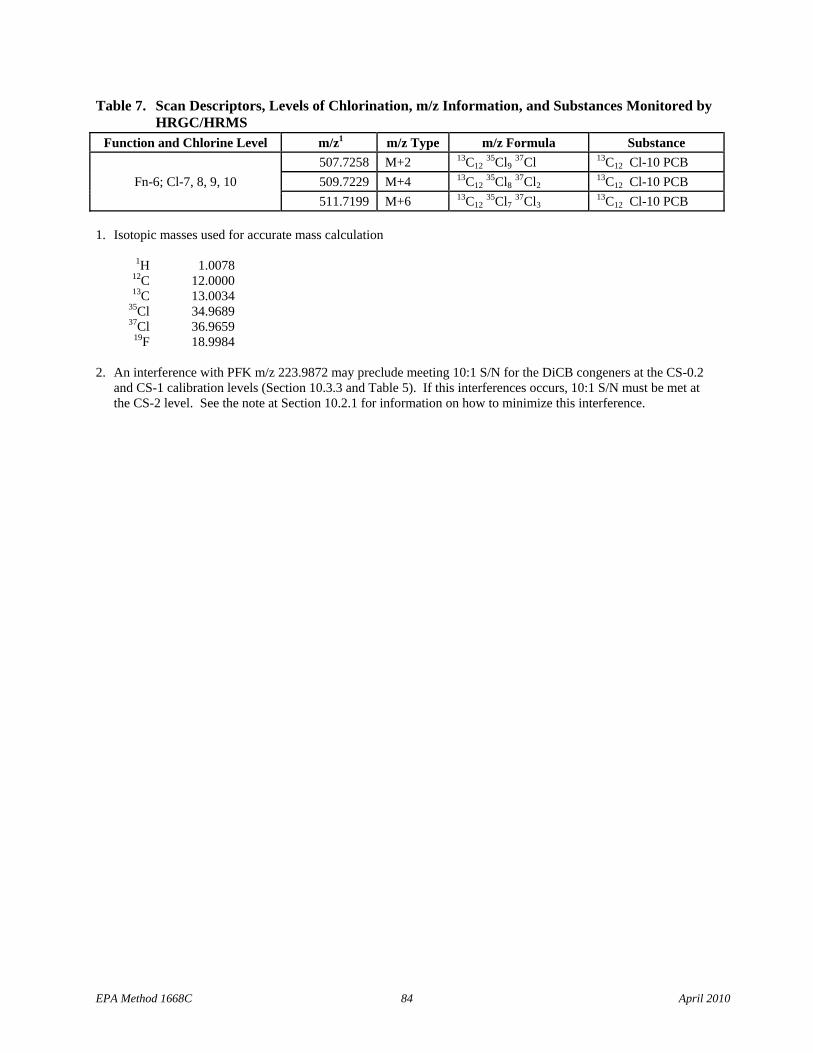
Table 7. Scan Descriptors, Levels of Chlorination, m/z Information, and Substances Monitored by HRGC/HRMS
Function and Chlorine Level m/z1 m/z Type m/z Formula Substance 507.7258 M+2 13C12
35Cl9 37Cl 13C12 Cl-10 PCB
Fn-6; Cl-7, 8, 9, 10 509.7229 M+4 13C12 35Cl8
37Cl2 13C12 Cl-10 PCB
511.7199 M+6 13C12 35Cl7
37Cl3 13C12 Cl-10 PCB
1. Isotopic masses used for accurate mass calculation 1H 1.0078 12C 12.0000 13C 13.0034 35Cl 34.9689 37Cl 36.9659 19F 18.9984 2. An interference with PFK m/z 223.9872 may preclude meeting 10:1 S/N for the DiCB congeners at the CS-0.2
and CS-1 calibration levels (Section 10.3.3 and Table 5). If this interferences occurs, 10:1 S/N must be met at the CS-2 level. See the note at Section 10.2.1 for information on how to minimize this interference.
EPA Method 1668C 84 April 2010
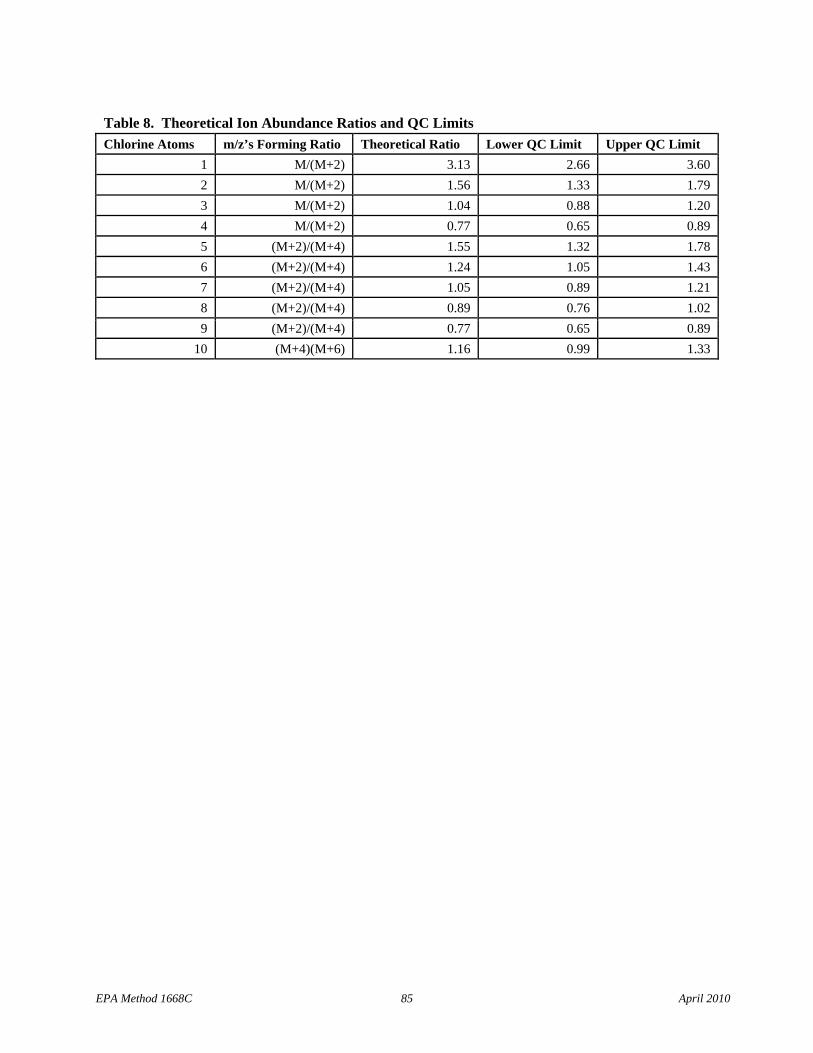
1 2 3 4 5 6 7 8 9
10
Table 8. Theoretical Ion Abundance Ratios and QC Limits Chlorine Atoms m/z’s Forming Ratio Theoretical Ratio Lower QC Limit Upper QC Limit
M/(M+2) 3.13 2.66 3.60 M/(M+2) 1.56 1.33 1.79 M/(M+2) 1.04 0.88 1.20 M/(M+2) 0.77 0.65 0.89 (M+2)/(M+4) 1.55 1.32 1.78 (M+2)/(M+4) 1.24 1.05 1.43 (M+2)/(M+4) 1.05 0.89 1.21 (M+2)/(M+4) 0.89 0.76 1.02 (M+2)/(M+4) 0.77 0.65 0.89 (M+4)(M+6) 1.16 0.99 1.33
EPA Method 1668C 85 April 2010
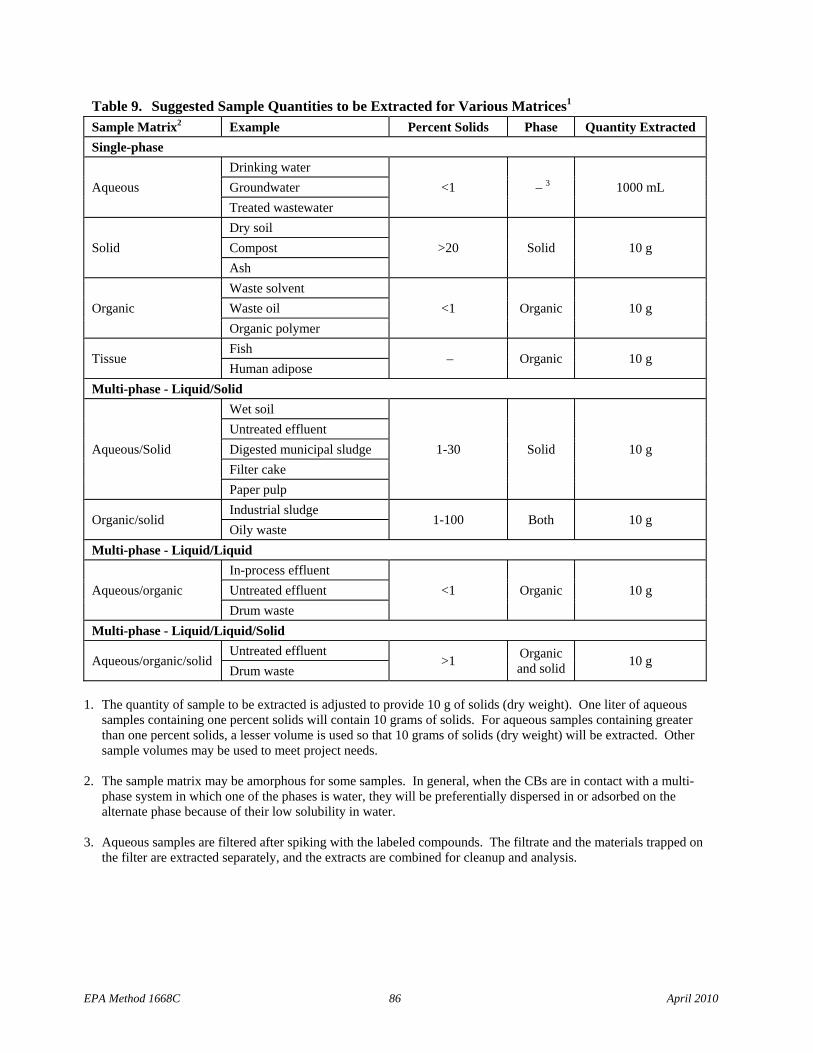
Table 9. Suggested Sample Quantities to be Extracted for Various Matrices1
Sample Matrix2 Example Percent Solids Phase Quantity Extracted Single-phase
Aqueous Drinking water
<1 – 3 1000 mL Groundwater Treated wastewater
Solid Dry soil
>20 Solid 10 g Compost Ash
Organic Waste solvent
<1 Organic 10 g Waste oil Organic polymer
Tissue Fish
– Organic 10 g Human adipose
Multi-phase - Liquid/Solid
Aqueous/Solid
Wet soil
1-30 Solid 10 g Untreated effluent Digested municipal sludge Filter cake Paper pulp
Organic/solid Industrial sludge
1-100 Both 10 g Oily waste
Multi-phase - Liquid/Liquid
Aqueous/organic In-process effluent
<1 Organic 10 g Untreated effluent Drum waste
Multi-phase - Liquid/Liquid/Solid
Aqueous/organic/solid Untreated effluent
>1 Organic and solid 10 g
Drum waste
1. The quantity of sample to be extracted is adjusted to provide 10 g of solids (dry weight). One liter of aqueous samples containing one percent solids will contain 10 grams of solids. For aqueous samples containing greater than one percent solids, a lesser volume is used so that 10 grams of solids (dry weight) will be extracted. Other sample volumes may be used to meet project needs.
2. The sample matrix may be amorphous for some samples. In general, when the CBs are in contact with a multiphase system in which one of the phases is water, they will be preferentially dispersed in or adsorbed on the alternate phase because of their low solubility in water.
3. Aqueous samples are filtered after spiking with the labeled compounds. The filtrate and the materials trapped on the filter are extracted separately, and the extracts are combined for cleanup and analysis.
EPA Method 1668C 86 April 2010
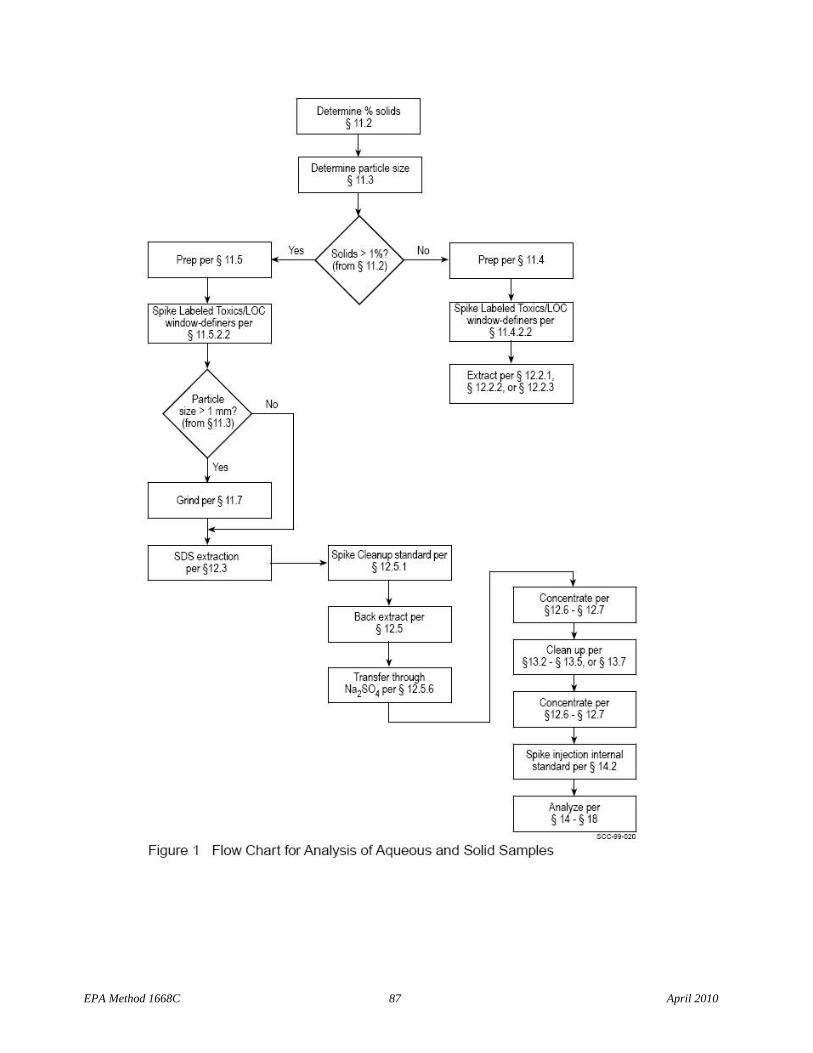
EPA Method 1668C 87 April 2010
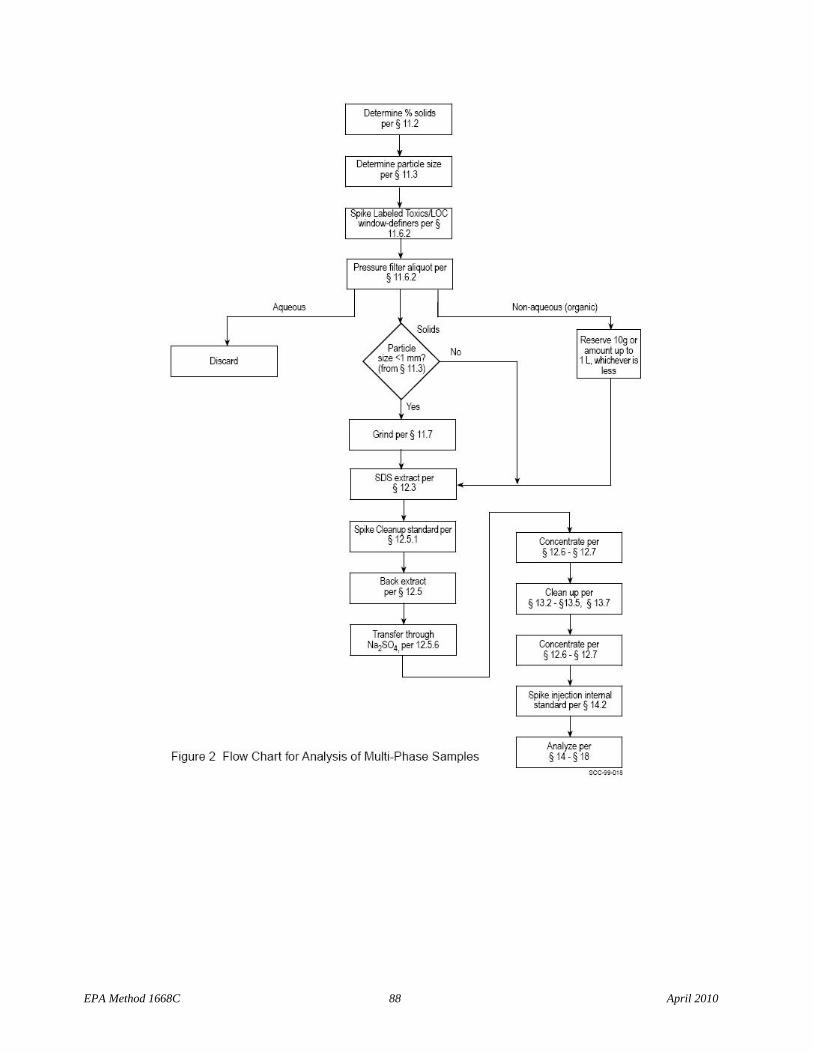
EPA Method 1668C 88 April 2010
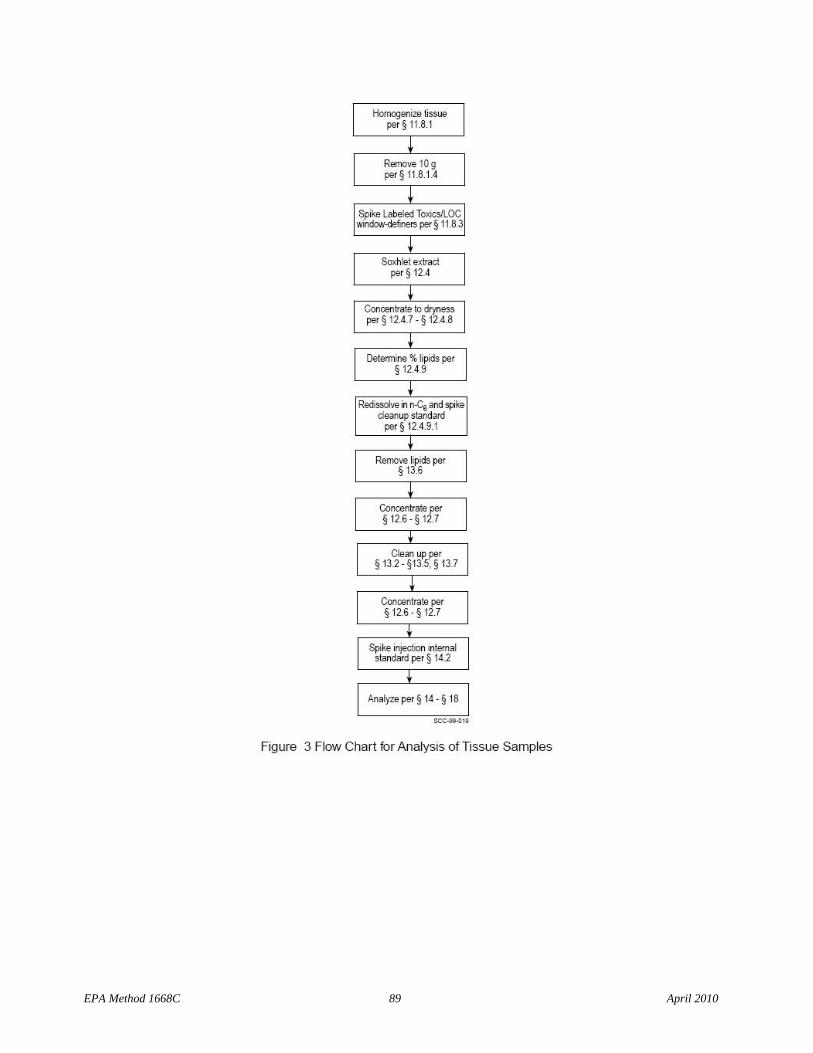
EPA Method 1668C 89 April 2010
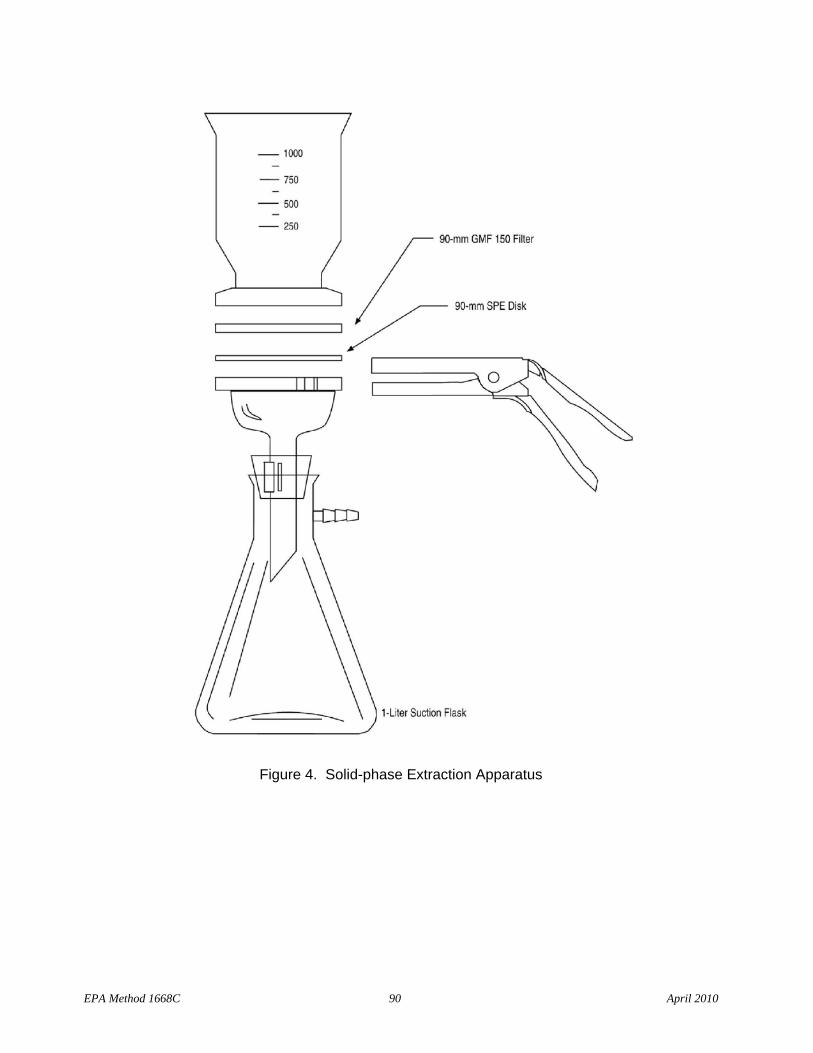
Figure 4. Solid-phase Extraction Apparatus
EPA Method 1668C 90 April 2010
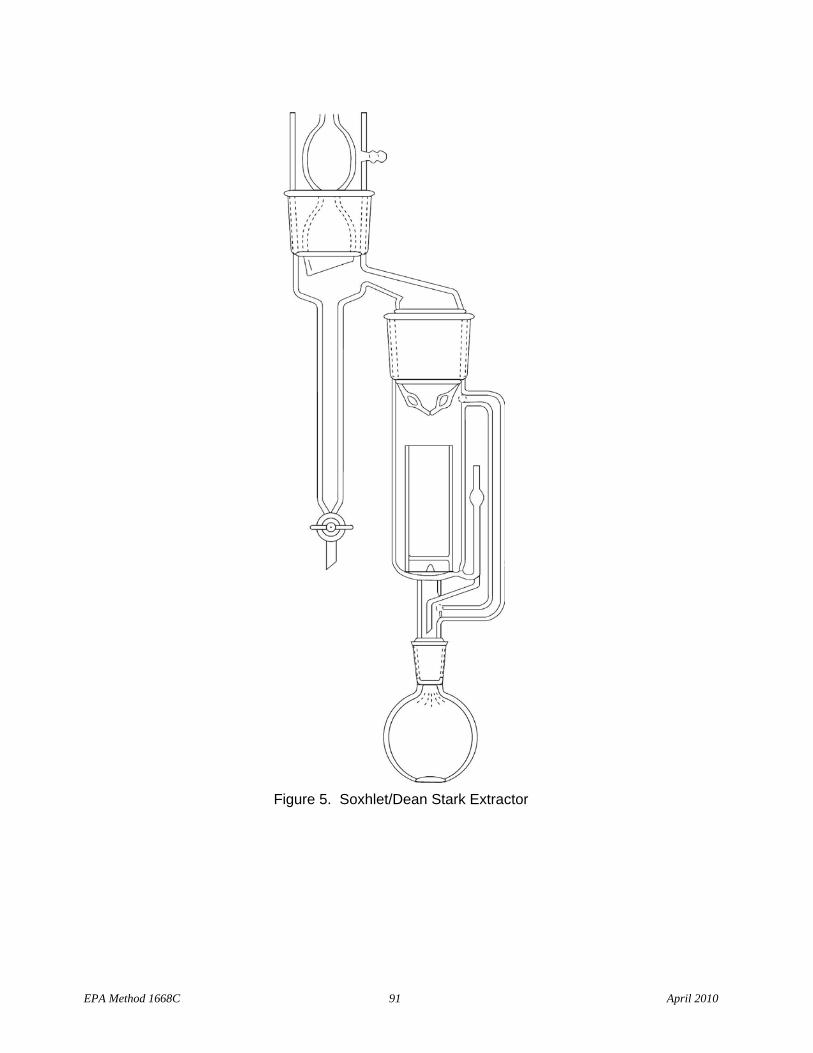
Figure 5. Soxhlet/Dean Stark Extractor
EPA Method 1668C 91 April 2010
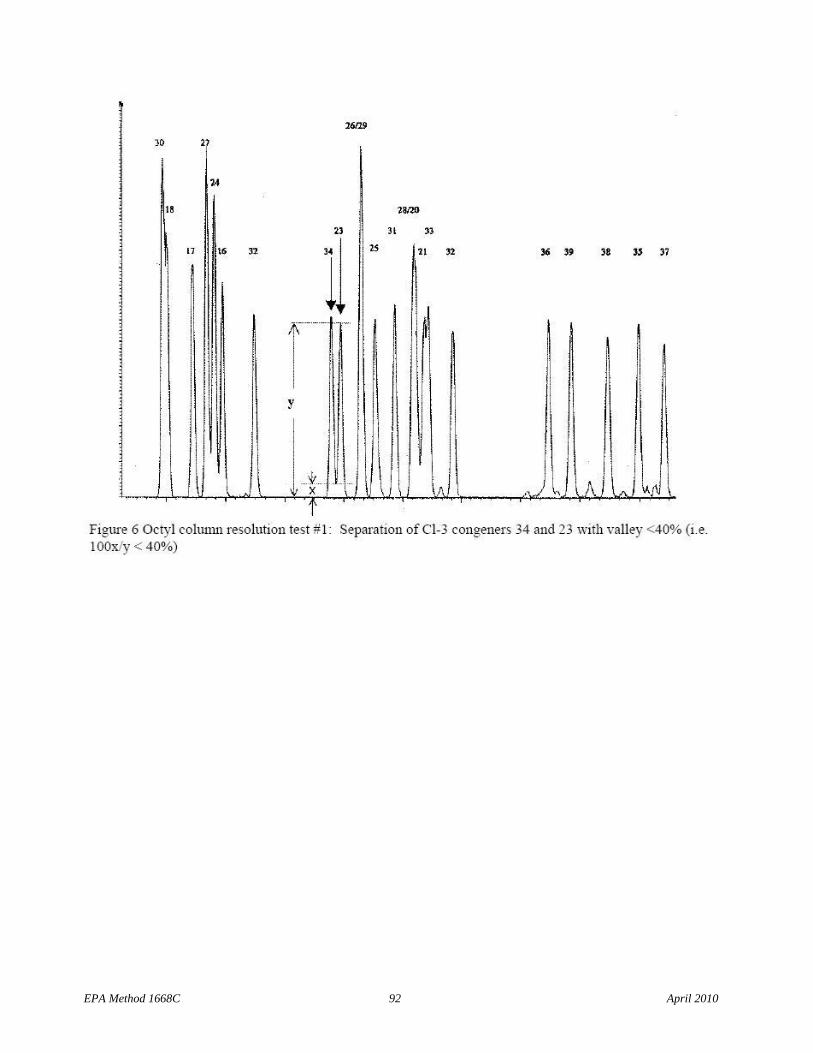
EPA Method 1668C 92 April 2010
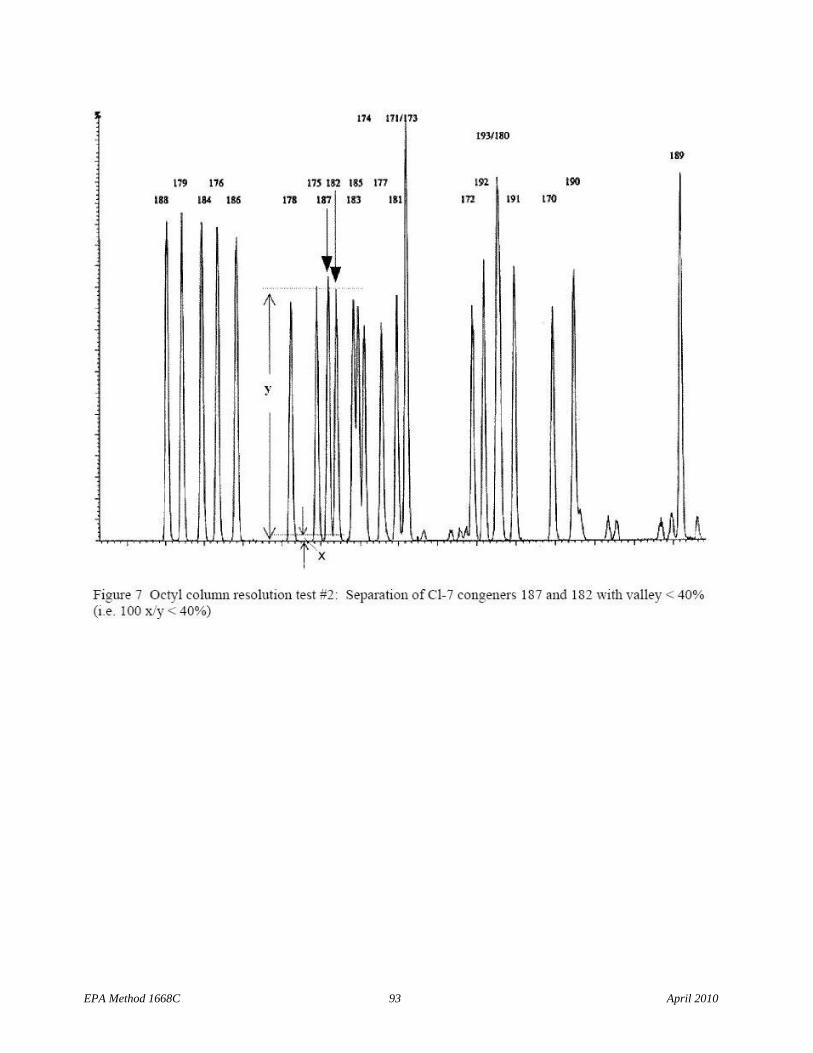
EPA Method 1668C 93 April 2010
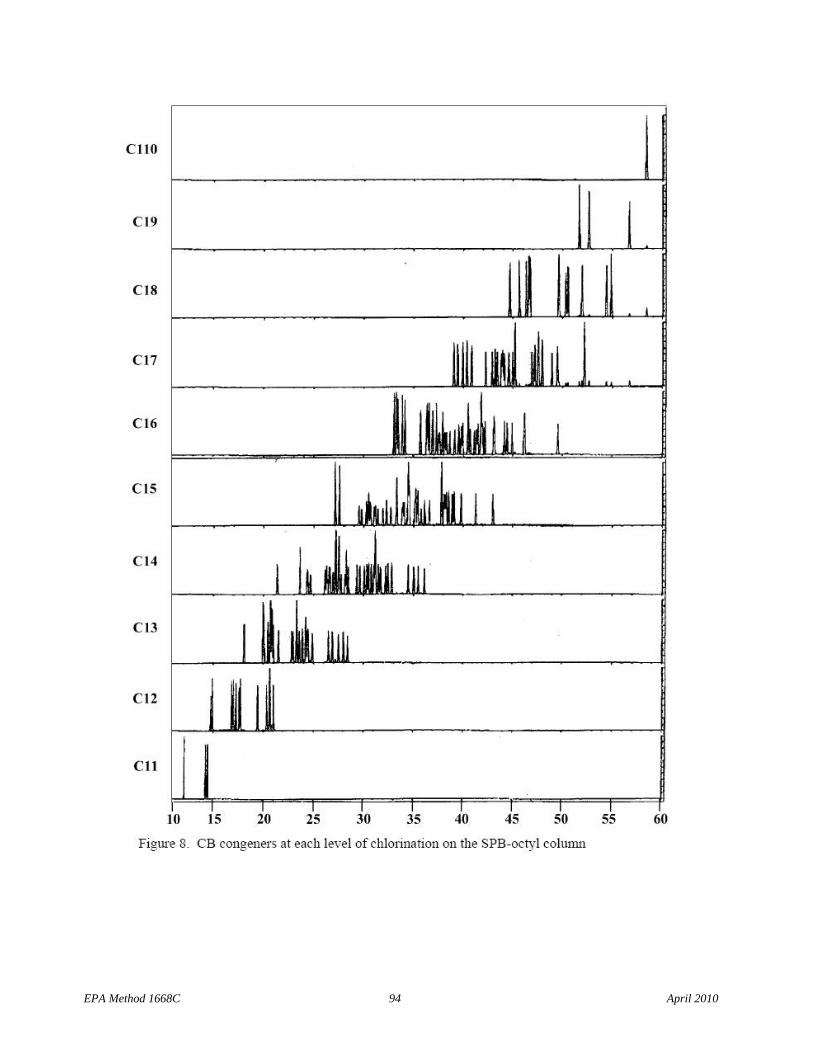
EPA Method 1668C 94 April 2010
24.0 Glossary
These definitions and purposes are specific to this method, but have been conformed to common usage to the extent possible.
24.1 Units of weight and measure and their abbreviations
24.1.1 Symbols
ºC degrees Celsius µL microliter µm micrometer < less than > greater than % percent
24.1.2 Alphabetical abbreviations
cm centimeter g gram h hour ID inside diameter in. inch L liter M molecular ion m meter mg milligram min minute mL milliliter mm millimeter m/z mass-to-charge ratio N normal; gram molecular weight of solute divided by hydrogen equivalent of
solute, per liter of solution OD outside diameter pg picogram ppb part-per-billion ppm part-per-million ppq part-per-quadrillion ppt part-per-trillion psig pound-per-square-inch gauge v/v volume per unit volume w/v weight per unit volume
24.2 Definitions and acronyms (in alphabetical order)
Analyte – A CB tested for by this method. The analytes are listed in Table 1.
Calibration standard (CAL) – A solution prepared from a secondary standard and/or stock solutions and used to calibrate the response of the HRGC/HRMS instrument.
Calibration verification standard (VER) – The mid-point calibration standard (CS-3) that is used to verify calibration. See Table 5.
EPA Method 1668C 95 April 2010
CB – Chlorinated biphenyl congener. One of the 209 individual chlorinated biphenyl congeners determined using this method. The 209 CBs are listed in Table 1.
CS-0.2, CS-1, CS-2, CS-3, CS-4, CS-5 – See Calibration standards and Table 5
DeCB – Decachlorobiphenyl (PCB 209)
DiCB – Dichlorobiphenyl
Field blank – An aliquot of reagent water or other reference matrix that is placed in a sample container in the laboratory or the field, and treated as a sample in all respects, including exposure to sampling site conditions, storage, preservation, and all analytical procedures. The purpose of the field blank is to determine if the field or sample transporting procedures and environments have contaminated the sample.
GC – Gas chromatograph or gas chromatography
GPC – Gel permeation chromatograph or gel permeation chromatography
HpCB – Heptachlorobiphenyl
HPLC – High performance liquid chromatograph or high performance liquid chromatography
HRGC – High resolution GC
HRMS – High resolution MS
HxCB – Hexachlorobiphenyl
Labeled injection internal standard – All five, or any one of the five, 13C12-labeled CB congeners spiked into the concentrated extract immediately prior to injection of an aliquot of the extract into the HRGC/HRMS. The five Labeled injection internal standards in this method are CBs with congener numbers 9L, 52L, 101L, 138L, and 194L.
Internal standard – a labeled compound used as a reference for quantitation of other labeled compounds and for quantitation of native CB congeners other than the congener of which it is a labeled analog. See Internal standard quantitation.
Internal standard quantitation – A means of determining the concentration of (1) a naturally occurring (native) compound by reference to a compound other than its labeled analog and (2) a labeled compound by reference to another labeled compound
IPR – Initial precision and recovery; four aliquots of a reference matrix spiked with the analytes of interest and labeled compounds and analyzed to establish the ability of the laboratory to generate acceptable precision and recovery. An IPR is performed prior to the first time this method is used and any time the method or instrumentation is modified.
Isotope dilution quantitation – A means of determining a naturally occurring (native) compound by reference to the same compound in which one or more atoms has been isotopically enriched. In this method, all 12 carbon atoms in the biphenyl molecule are enriched with carbon-13 to produce 13C12- labeled analogs of the chlorinated biphenyls. The 13C12-labeled CBs are spiked into each
EPA Method 1668C 96 April 2010
sample and allow identification and correction of the concentration of the native compounds in the analytical process.
K-D – Kuderna-Danish concentrator; a device used to concentrate the analytes in a solvent
Laboratory blank – See Method blank
Laboratory control sample (LCS) – See Ongoing precision and recovery standard (OPR)
Laboratory reagent blank – See Method blank
May – This action, activity, or procedural step is neither required nor prohibited.
May not – This action, activity, or procedural step is prohibited.
Method blank – An aliquot of reagent water that is treated exactly as a sample including exposure to all glassware, equipment, solvents, reagents, internal standards, and surrogates that are used with samples. The method blank is used to determine if analytes or interferences are present in the laboratory environment, the reagents, or the apparatus.
Method Detection Limit – The minimum concentration of a substance that can be measured and reported with 99% confidence that the analyte concentration is greater than zero (40 CFR 136, Appendix B)
Minimum level of quantitation (ML) – The lowest level at which the entire analytical system must give a recognizable signal and acceptable calibration point for the analyte. The ML represents the lowest concentration at which an analyte can be measured with a known level of confidence. It may be equivalent to the concentration of the lowest calibration standard, assuming that all method-specified sample weights, volumes, and cleanup procedures have been employed. The ML is calculated by multiplying the MDL (pooled or unpooled, as appropriate) by 3.18 and rounding the result to the number nearest to 1, 2, or 5 x 10 n, where n is zero or an integer (see 68 FR 11790).
MoCB – Monochlorobiphenyl
MS – Mass spectrometer or mass spectrometry
Must – This action, activity, or procedural step is required.
NoCB – Nonachlorobiphenyl
OcCB – Octachlorobiphenyl
OPR – Ongoing precision and recovery standard (OPR); a method blank spiked with known quantities of analytes. The OPR is analyzed exactly like a sample. Its purpose is to assure that the results produced by the laboratory remain within the limits specified in this method for precision and recovery.
Perfluorokerosene (PFK) – A mixture of compounds used to calibrate the exact m/z scale in the HRMS
Preparation blank – See Method blank
EPA Method 1668C 97 April 2010
Quality control check sample (QCS) – A sample containing all or a subset of the analytes at known concentrations. The QCS is obtained from a source external to the laboratory or is prepared from a source of standards different from the source of calibration standards. It is used to check laboratory performance with test materials prepared external to the normal preparation process.
PeCB – Pentachlorobiphenyl
PCB – Polychlorinated biphenyl
Reagent water – Water demonstrated to be free from the analytes of interest and potentially interfering substances at the method detection limit for the analyte.
Relative standard deviation (RSD) – The standard deviation times 100 divided by the mean. Also termed “coefficient of variation.”
RF – Response factor. See Section 10.5.
RR – Relative response. See Section 10.4.
SDS – Soxhlet/Dean-Stark extractor; an extraction device applied to the extraction of solid and semi-solid materials (Reference 11 and Figure 5)
Signal-to-noise ratio (S/N) – The height of the signal as measured from the mean (average) of the noise to the peak maximum divided by the width of the noise
Should – This action, activity, or procedural step is suggested but not required.
SICP – Selected ion current profile; the line described by the signal at an exact m/z
SPE – Solid-phase extraction; an extraction technique in which an analyte is extracted from an aqueous sample by passage over or through a material capable of reversibly adsorbing the analyte. Also termed liquid-solid extraction.
Stock solution – A solution containing an analyte that is prepared using a reference material traceable to EPA, the National Institute of Science and Technology (NIST), or a source that will attest to the purity and authenticity of the reference material.
TeCB – Tetrachlorobiphenyl
TEF – Toxicity equivalency factor; an estimate of the toxicity of a specific congener relative to 2,3,7,8-tetrachlorodibenzo-p-dioxin
TEQ – The toxicity equivalent concentration in an environmental sample. It is the sum of the concentrations of each individual toxic PCB and each individual 2,3,7,8-substituted, tetra-through octa-chlorinated, dibenzo-p-dioxin and dibenzofuran multiplied by their respective TEFs (Reference 1).
TEQPCB – The portion of the TEQ attributable to the toxic PCBs
TrCB – Trichlorobiphenyl
EPA Method 1668C 98 April 2010
Unique GC resolution or uniquely resolved – Two adjacent chromatographic peaks in which the height of the valley is less than 40 percent of the height of the shorter peak. See Section 6.9.1.1.2 and Figures 6 and 7 for unique resolution specific to the SPB-octyl column.
VER – See Calibration verification
EPA Method 1668C 99 April 2010
Appendix A - Preliminary Information for Determination of 209 CBs on the DB-1 Column
1.0 Column and Conditions
1.1 Column – 30 ± 5-m long x 0.25 ± 0.02-mm ID; 0.25 µm film DB-1 (J&W, or equivalent).
1.2 Suggested GC operating conditions:
Injector temperature: 270 ºC Interface temperature: 290 ºC Initial temperature: 75 ºC Initial time: 2 minutes Temperature program: 75-150 ºC at 15 ºC/minute
150-270 ºC at 2.5 ºC/minute Final time: 7 minutes Carrier gas velocity: 40 cm/sec at 200 ºC
Note: The GC conditions may be optimized for compound separation and sensitivity. Once optimized, the same GC conditions must be used for the analysis of all standards, blanks, IPR and OPR aliquots, and samples.
2.0 Operating Information
2.1 Congener solutions – Mixes of individual congeners that will allow separation of all 209 congeners on the DB-1 column had not been developed when writing Method 1668C.
2.2 Elution order data – The congener mixes developed for the SPB-octyl column (Table 4 of Method 1668C) were run on the DB-1 column. Although some congeners in these mixes co-elute, the mixes allow determination of retention times for many congeners on the DB-1 column. These retention times are shown in Appendix Table A-1.
2.3 Window-defining congeners – The beginning and ending congeners at each level of chlorination are the same as for the SPB-octyl column. See Table 2 in Method 1668C.
2.4 Scan descriptors – The 6-function scan descriptors are shown in Appendix Table A-2.
EPA Method 1668C 100 April 2010
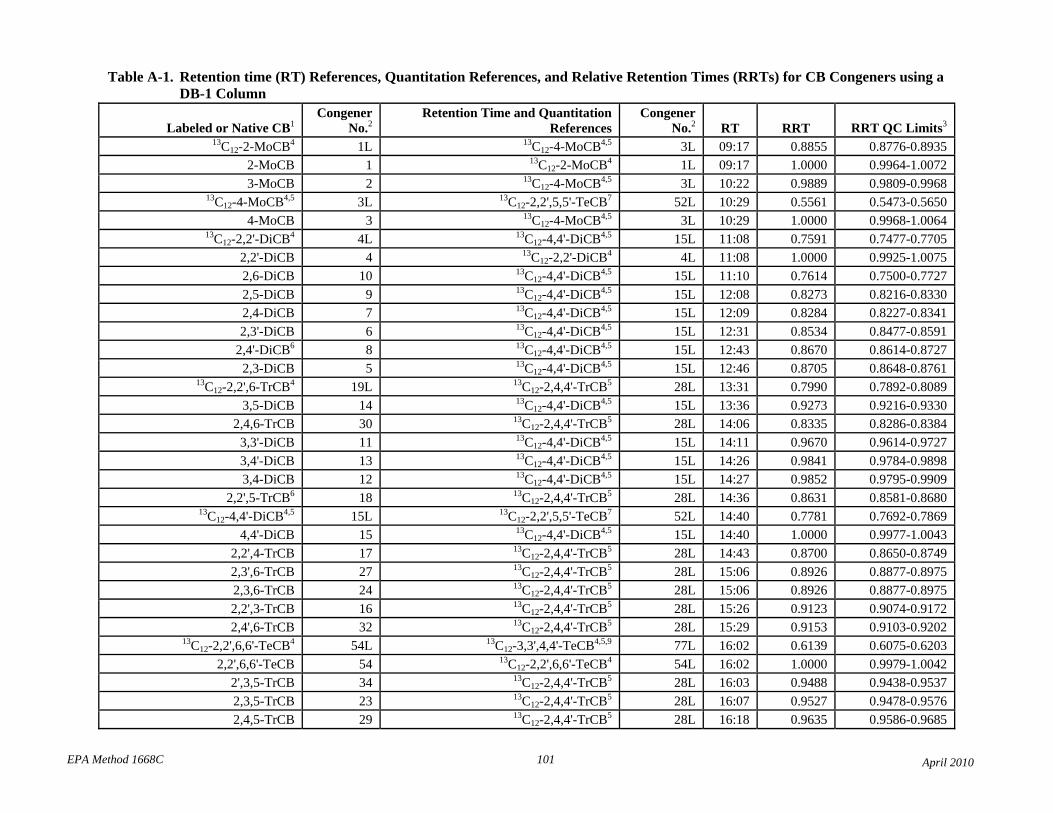
EPA Method 1668C 101 April 2010
Table A-1. Retention time (RT) References, Quantitation References, and Relative Retention Times (RRTs) for CB Congeners using a DB-1 Column
Labeled or Native CB1 Congener
No.2 Retention Time and Quantitation
References Congener
No.2 RT RRT RRT QC Limits3
13C12-2-MoCB4 1L 13C12-4-MoCB4,5 3L 09:17 0.8855 0.8776-0.8935 2-MoCB 1 13C12-2-MoCB4 1L 09:17 1.0000 0.9964-1.0072 3-MoCB 2 13C12-4-MoCB4,5 3L 10:22 0.9889 0.9809-0.9968
13C12-4-MoCB4,5 3L 13C12-2,2',5,5'-TeCB7 52L 10:29 0.5561 0.5473-0.5650 4-MoCB 3 13C12-4-MoCB4,5 3L 10:29 1.0000 0.9968-1.0064
13C12-2,2'-DiCB4 4L 13C12-4,4'-DiCB4,5 15L 11:08 0.7591 0.7477-0.7705 2,2'-DiCB 4 13C12-2,2'-DiCB4 4L 11:08 1.0000 0.9925-1.0075 2,6-DiCB 10 13C12-4,4'-DiCB4,5 15L 11:10 0.7614 0.7500-0.7727 2,5-DiCB 9 13C12-4,4'-DiCB4,5 15L 12:08 0.8273 0.8216-0.8330 2,4-DiCB 7 13C12-4,4'-DiCB4,5 15L 12:09 0.8284 0.8227-0.8341 2,3'-DiCB 6 13C12-4,4'-DiCB4,5 15L 12:31 0.8534 0.8477-0.8591
2,4'-DiCB6 8 13C12-4,4'-DiCB4,5 15L 12:43 0.8670 0.8614-0.8727 2,3-DiCB 5 13C12-4,4'-DiCB4,5 15L 12:46 0.8705 0.8648-0.8761
13C12-2,2',6-TrCB4 19L 13C12-2,4,4'-TrCB5 28L 13:31 0.7990 0.7892-0.8089 3,5-DiCB 14 13C12-4,4'-DiCB4,5 15L 13:36 0.9273 0.9216-0.9330
2,4,6-TrCB 30 13C12-2,4,4'-TrCB5 28L 14:06 0.8335 0.8286-0.8384 3,3'-DiCB 11 13C12-4,4'-DiCB4,5 15L 14:11 0.9670 0.9614-0.9727 3,4'-DiCB 13 13C12-4,4'-DiCB4,5 15L 14:26 0.9841 0.9784-0.9898 3,4-DiCB 12 13C12-4,4'-DiCB4,5 15L 14:27 0.9852 0.9795-0.9909
2,2',5-TrCB6 18 13C12-2,4,4'-TrCB5 28L 14:36 0.8631 0.8581-0.8680 13C12-4,4'-DiCB4,5 15L 13C12-2,2',5,5'-TeCB7 52L 14:40 0.7781 0.7692-0.7869
4,4'-DiCB 15 13C12-4,4'-DiCB4,5 15L 14:40 1.0000 0.9977-1.0043 2,2',4-TrCB 17 13C12-2,4,4'-TrCB5 28L 14:43 0.8700 0.8650-0.8749
2,3',6-TrCB 27 13C12-2,4,4'-TrCB5 28L 15:06 0.8926 0.8877-0.8975 2,3,6-TrCB 24 13C12-2,4,4'-TrCB5 28L 15:06 0.8926 0.8877-0.8975 2,2',3-TrCB 16 13C12-2,4,4'-TrCB5 28L 15:26 0.9123 0.9074-0.9172
2,4',6-TrCB 32 13C12-2,4,4'-TrCB5 28L 15:29 0.9153 0.9103-0.9202 13C12-2,2',6,6'-TeCB4 54L 13C12-3,3',4,4'-TeCB4,5,9 77L 16:02 0.6139 0.6075-0.6203
2,2',6,6'-TeCB 54 13C12-2,2',6,6'-TeCB4 54L 16:02 1.0000 0.9979-1.0042 2',3,5-TrCB 34 13C12-2,4,4'-TrCB5 28L 16:03 0.9488 0.9438-0.9537 2,3,5-TrCB 23 13C12-2,4,4'-TrCB5 28L 16:07 0.9527 0.9478-0.9576 2,4,5-TrCB 29 13C12-2,4,4'-TrCB5 28L 16:18 0.9635 0.9586-0.9685
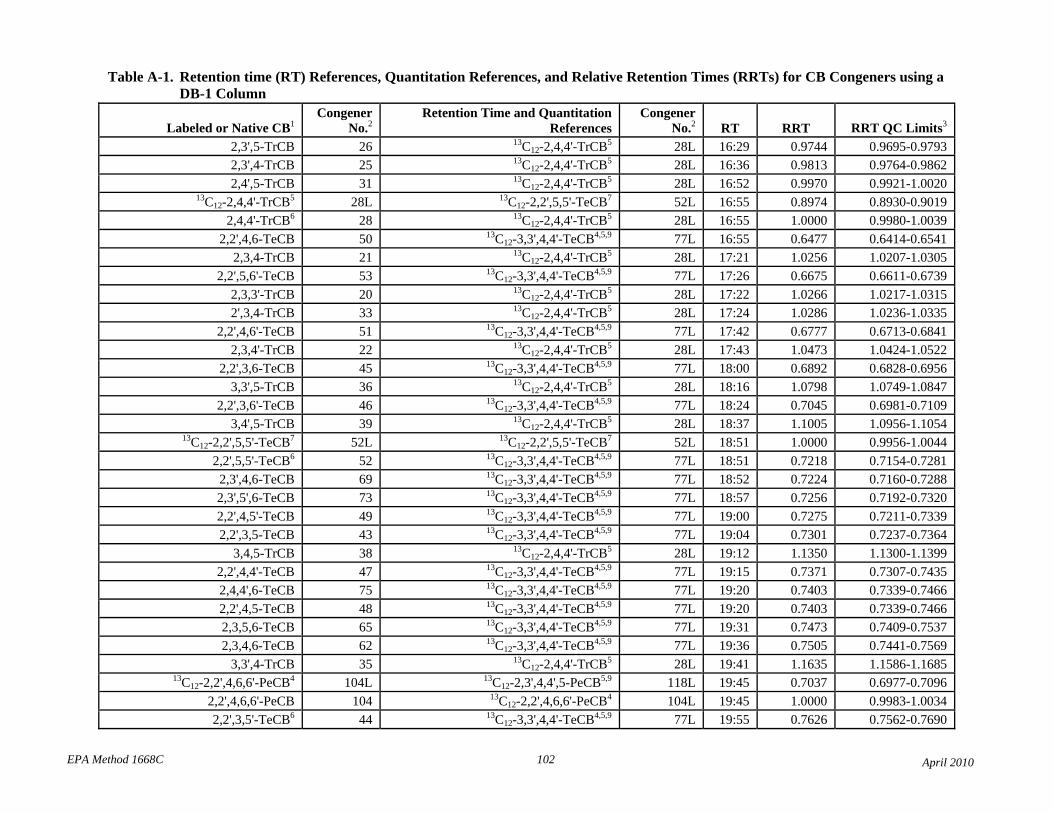
EPA Method 1668C 102 April 2010
Table A-1. Retention time (RT) References, Quantitation References, and Relative Retention Times (RRTs) for CB Congeners using a DB-1 Column
Labeled or Native CB1 Congener
No.2 Retention Time and Quantitation
References Congener
No.2 RT RRT RRT QC Limits3
2,3',5-TrCB 26 13C12-2,4,4'-TrCB5 28L 16:29 0.9744 0.9695-0.9793 2,3',4-TrCB 25 13C12-2,4,4'-TrCB5 28L 16:36 0.9813 0.9764-0.9862 2,4',5-TrCB 31 13C12-2,4,4'-TrCB5 28L 16:52 0.9970 0.9921-1.0020
13C12-2,4,4'-TrCB5 28L 13C12-2,2',5,5'-TeCB7 52L 16:55 0.8974 0.8930-0.9019 2,4,4'-TrCB6 28 13C12-2,4,4'-TrCB5 28L 16:55 1.0000 0.9980-1.0039
2,2',4,6-TeCB 50 13C12-3,3',4,4'-TeCB4,5,9 77L 16:55 0.6477 0.6414-0.6541 2,3,4-TrCB 21 13C12-2,4,4'-TrCB5 28L 17:21 1.0256 1.0207-1.0305
2,2',5,6'-TeCB 53 13C12-3,3',4,4'-TeCB4,5,9 77L 17:26 0.6675 0.6611-0.6739 2,3,3'-TrCB 20 13C12-2,4,4'-TrCB5 28L 17:22 1.0266 1.0217-1.0315 2',3,4-TrCB 33 13C12-2,4,4'-TrCB5 28L 17:24 1.0286 1.0236-1.0335
2,2',4,6'-TeCB 51 13C12-3,3',4,4'-TeCB4,5,9 77L 17:42 0.6777 0.6713-0.6841 2,3,4'-TrCB 22 13C12-2,4,4'-TrCB5 28L 17:43 1.0473 1.0424-1.0522
2,2',3,6-TeCB 45 13C12-3,3',4,4'-TeCB4,5,9 77L 18:00 0.6892 0.6828-0.6956 3,3',5-TrCB 36 13C12-2,4,4'-TrCB5 28L 18:16 1.0798 1.0749-1.0847
2,2',3,6'-TeCB 46 13C12-3,3',4,4'-TeCB4,5,9 77L 18:24 0.7045 0.6981-0.7109 3,4',5-TrCB 39 13C12-2,4,4'-TrCB5 28L 18:37 1.1005 1.0956-1.1054
13C12-2,2',5,5'-TeCB7 52L 13C12-2,2',5,5'-TeCB7 52L 18:51 1.0000 0.9956-1.0044 2,2',5,5'-TeCB6 52 13C12-3,3',4,4'-TeCB4,5,9 77L 18:51 0.7218 0.7154-0.7281 2,3',4,6-TeCB 69 13C12-3,3',4,4'-TeCB4,5,9 77L 18:52 0.7224 0.7160-0.7288 2,3',5',6-TeCB 73 13C12-3,3',4,4'-TeCB4,5,9 77L 18:57 0.7256 0.7192-0.7320 2,2',4,5'-TeCB 49 13C12-3,3',4,4'-TeCB4,5,9 77L 19:00 0.7275 0.7211-0.7339 2,2',3,5-TeCB 43 13C12-3,3',4,4'-TeCB4,5,9 77L 19:04 0.7301 0.7237-0.7364
3,4,5-TrCB 38 13C12-2,4,4'-TrCB5 28L 19:12 1.1350 1.1300-1.1399 2,2',4,4'-TeCB 47 13C12-3,3',4,4'-TeCB4,5,9 77L 19:15 0.7371 0.7307-0.7435 2,4,4',6-TeCB 75 13C12-3,3',4,4'-TeCB4,5,9 77L 19:20 0.7403 0.7339-0.7466 2,2',4,5-TeCB 48 13C12-3,3',4,4'-TeCB4,5,9 77L 19:20 0.7403 0.7339-0.7466 2,3,5,6-TeCB 65 13C12-3,3',4,4'-TeCB4,5,9 77L 19:31 0.7473 0.7409-0.7537
2,3,4,6-TeCB 62 13C12-3,3',4,4'-TeCB4,5,9 77L 19:36 0.7505 0.7441-0.7569 3,3',4-TrCB 35 13C12-2,4,4'-TrCB5 28L 19:41 1.1635 1.1586-1.1685
13C12-2,2',4,6,6'-PeCB4 104L 13C12-2,3',4,4',5-PeCB5,9 118L 19:45 0.7037 0.6977-0.7096 2,2',4,6,6'-PeCB 104 13C12-2,2',4,6,6'-PeCB4 104L 19:45 1.0000 0.9983-1.0034 2,2',3,5'-TeCB6 44 13C12-3,3',4,4'-TeCB4,5,9 77L 19:55 0.7626 0.7562-0.7690
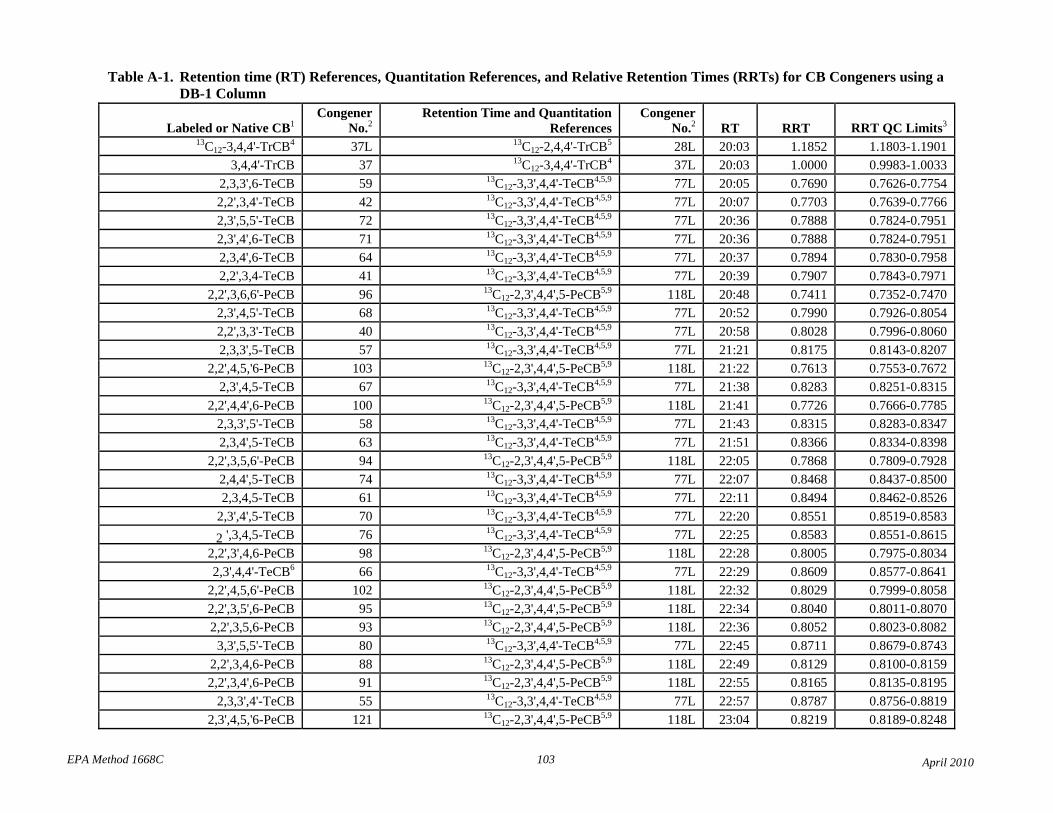
EPA Method 1668C 103 April 2010
Table A-1. Retention time (RT) References, Quantitation References, and Relative Retention Times (RRTs) for CB Congeners using a DB-1 Column
Labeled or Native CB1 Congener
No.2 Retention Time and Quantitation
References Congener
No.2 RT RRT RRT QC Limits3
13C12-3,4,4'-TrCB4 37L 13C12-2,4,4'-TrCB5 28L 20:03 1.1852 1.1803-1.1901 3,4,4'-TrCB 37 13C12-3,4,4'-TrCB4 37L 20:03 1.0000 0.9983-1.0033
2,3,3',6-TeCB 59 13C12-3,3',4,4'-TeCB4,5,9 77L 20:05 0.7690 0.7626-0.7754 2,2',3,4'-TeCB 42 13C12-3,3',4,4'-TeCB4,5,9 77L 20:07 0.7703 0.7639-0.7766
2,3',5,5'-TeCB 72 13C12-3,3',4,4'-TeCB4,5,9 77L 20:36 0.7888 0.7824-0.7951 2,3',4',6-TeCB 71 13C12-3,3',4,4'-TeCB4,5,9 77L 20:36 0.7888 0.7824-0.7951 2,3,4',6-TeCB 64 13C12-3,3',4,4'-TeCB4,5,9 77L 20:37 0.7894 0.7830-0.7958
2,2',3,4-TeCB 41 13C12-3,3',4,4'-TeCB4,5,9 77L 20:39 0.7907 0.7843-0.7971 2,2',3,6,6'-PeCB 96 13C12-2,3',4,4',5-PeCB5,9 118L 20:48 0.7411 0.7352-0.7470 2,3',4,5'-TeCB 68 13C12-3,3',4,4'-TeCB4,5,9 77L 20:52 0.7990 0.7926-0.8054 2,2',3,3'-TeCB 40 13C12-3,3',4,4'-TeCB4,5,9 77L 20:58 0.8028 0.7996-0.8060 2,3,3',5-TeCB 57 13C12-3,3',4,4'-TeCB4,5,9 77L 21:21 0.8175 0.8143-0.8207
2,2',4,5,'6-PeCB 103 13C12-2,3',4,4',5-PeCB5,9 118L 21:22 0.7613 0.7553-0.7672 2,3',4,5-TeCB 67 13C12-3,3',4,4'-TeCB4,5,9 77L 21:38 0.8283 0.8251-0.8315
2,2',4,4',6-PeCB 100 13C12-2,3',4,4',5-PeCB5,9 118L 21:41 0.7726 0.7666-0.7785 2,3,3',5'-TeCB 58 13C12-3,3',4,4'-TeCB4,5,9 77L 21:43 0.8315 0.8283-0.8347 2,3,4',5-TeCB 63 13C12-3,3',4,4'-TeCB4,5,9 77L 21:51 0.8366 0.8334-0.8398
2,2',3,5,6'-PeCB 94 13C12-2,3',4,4',5-PeCB5,9 118L 22:05 0.7868 0.7809-0.7928 2,4,4',5-TeCB 74 13C12-3,3',4,4'-TeCB4,5,9 77L 22:07 0.8468 0.8437-0.8500 2,3,4,5-TeCB 61 13C12-3,3',4,4'-TeCB4,5,9 77L 22:11 0.8494 0.8462-0.8526 2,3',4',5-TeCB 70 13C12-3,3',4,4'-TeCB4,5,9 77L 22:20 0.8551 0.8519-0.8583 2 ',3,4,5-TeCB 76 13C12-3,3',4,4'-TeCB4,5,9 77L 22:25 0.8583 0.8551-0.8615
2,2',3',4,6-PeCB 98 13C12-2,3',4,4',5-PeCB5,9 118L 22:28 0.8005 0.7975-0.8034 2,3',4,4'-TeCB6 66 13C12-3,3',4,4'-TeCB4,5,9 77L 22:29 0.8609 0.8577-0.8641
2,2',4,5,6'-PeCB 102 13C12-2,3',4,4',5-PeCB5,9 118L 22:32 0.8029 0.7999-0.8058 2,2',3,5',6-PeCB 95 13C12-2,3',4,4',5-PeCB5,9 118L 22:34 0.8040 0.8011-0.8070 2,2',3,5,6-PeCB 93 13C12-2,3',4,4',5-PeCB5,9 118L 22:36 0.8052 0.8023-0.8082
3,3',5,5'-TeCB 80 13C12-3,3',4,4'-TeCB4,5,9 77L 22:45 0.8711 0.8679-0.8743 2,2',3,4,6-PeCB 88 13C12-2,3',4,4',5-PeCB5,9 118L 22:49 0.8129 0.8100-0.8159 2,2',3,4',6-PeCB 91 13C12-2,3',4,4',5-PeCB5,9 118L 22:55 0.8165 0.8135-0.8195
2,3,3',4'-TeCB 55 13C12-3,3',4,4'-TeCB4,5,9 77L 22:57 0.8787 0.8756-0.8819 2,3',4,5,'6-PeCB 121 13C12-2,3',4,4',5-PeCB5,9 118L 23:04 0.8219 0.8189-0.8248
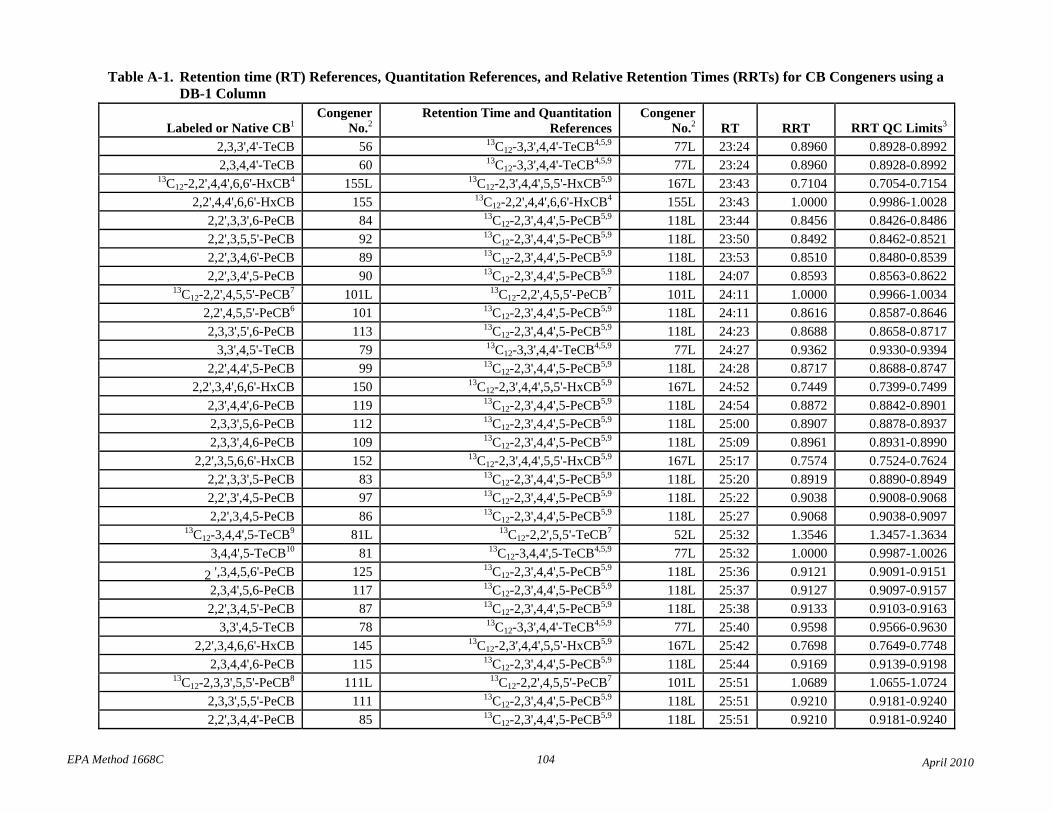
EPA Method 1668C 104 April 2010
Table A-1. Retention time (RT) References, Quantitation References, and Relative Retention Times (RRTs) for CB Congeners using a DB-1 Column
Labeled or Native CB1 Congener
No.2 Retention Time and Quantitation
References Congener
No.2 RT RRT RRT QC Limits3
2,3,3',4'-TeCB 56 13C12-3,3',4,4'-TeCB4,5,9 77L 23:24 0.8960 0.8928-0.8992 2,3,4,4'-TeCB 60 13C12-3,3',4,4'-TeCB4,5,9 77L 23:24 0.8960 0.8928-0.8992
13C12-2,2',4,4',6,6'-HxCB4 155L 13C12-2,3',4,4',5,5'-HxCB5,9 167L 23:43 0.7104 0.7054-0.7154 2,2',4,4',6,6'-HxCB 155 13C12-2,2',4,4',6,6'-HxCB4 155L 23:43 1.0000 0.9986-1.0028
2,2',3,3',6-PeCB 84 13C12-2,3',4,4',5-PeCB5,9 118L 23:44 0.8456 0.8426-0.8486 2,2',3,5,5'-PeCB 92 13C12-2,3',4,4',5-PeCB5,9 118L 23:50 0.8492 0.8462-0.8521
2,2',3,4,6'-PeCB 89 13C12-2,3',4,4',5-PeCB5,9 118L 23:53 0.8510 0.8480-0.8539 2,2',3,4',5-PeCB 90 13C12-2,3',4,4',5-PeCB5,9 118L 24:07 0.8593 0.8563-0.8622
13C12-2,2',4,5,5'-PeCB7 101L 13C12-2,2',4,5,5'-PeCB7 101L 24:11 1.0000 0.9966-1.0034 2,2',4,5,5'-PeCB6 101 13C12-2,3',4,4',5-PeCB5,9 118L 24:11 0.8616 0.8587-0.8646 2,3,3',5',6-PeCB 113 13C12-2,3',4,4',5-PeCB5,9 118L 24:23 0.8688 0.8658-0.8717
3,3',4,5'-TeCB 79 13C12-3,3',4,4'-TeCB4,5,9 77L 24:27 0.9362 0.9330-0.9394 2,2',4,4',5-PeCB 99 13C12-2,3',4,4',5-PeCB5,9 118L 24:28 0.8717 0.8688-0.8747
2,2',3,4',6,6'-HxCB 150 13C12-2,3',4,4',5,5'-HxCB5,9 167L 24:52 0.7449 0.7399-0.7499 2,3',4,4',6-PeCB 119 13C12-2,3',4,4',5-PeCB5,9 118L 24:54 0.8872 0.8842-0.8901 2,3,3',5,6-PeCB 112 13C12-2,3',4,4',5-PeCB5,9 118L 25:00 0.8907 0.8878-0.8937 2,3,3',4,6-PeCB 109 13C12-2,3',4,4',5-PeCB5,9 118L 25:09 0.8961 0.8931-0.8990
2,2',3,5,6,6'-HxCB 152 13C12-2,3',4,4',5,5'-HxCB5,9 167L 25:17 0.7574 0.7524-0.7624 2,2',3,3',5-PeCB 83 13C12-2,3',4,4',5-PeCB5,9 118L 25:20 0.8919 0.8890-0.8949 2,2',3',4,5-PeCB 97 13C12-2,3',4,4',5-PeCB5,9 118L 25:22 0.9038 0.9008-0.9068 2,2',3,4,5-PeCB 86 13C12-2,3',4,4',5-PeCB5,9 118L 25:27 0.9068 0.9038-0.9097
13C12-3,4,4',5-TeCB9 81L 13C12-2,2',5,5'-TeCB7 52L 25:32 1.3546 1.3457-1.3634 3,4,4',5-TeCB10 81 13C12-3,4,4',5-TeCB4,5,9 77L 25:32 1.0000 0.9987-1.0026
2 ',3,4,5,6'-PeCB 125 13C12-2,3',4,4',5-PeCB5,9 118L 25:36 0.9121 0.9091-0.9151 2,3,4',5,6-PeCB 117 13C12-2,3',4,4',5-PeCB5,9 118L 25:37 0.9127 0.9097-0.9157 2,2',3,4,5'-PeCB 87 13C12-2,3',4,4',5-PeCB5,9 118L 25:38 0.9133 0.9103-0.9163
3,3',4,5-TeCB 78 13C12-3,3',4,4'-TeCB4,5,9 77L 25:40 0.9598 0.9566-0.9630 2,2',3,4,6,6'-HxCB 145 13C12-2,3',4,4',5,5'-HxCB5,9 167L 25:42 0.7698 0.7649-0.7748
2,3,4,4',6-PeCB 115 13C12-2,3',4,4',5-PeCB5,9 118L 25:44 0.9169 0.9139-0.9198 13C12-2,3,3',5,5'-PeCB8 111L 13C12-2,2',4,5,5'-PeCB7 101L 25:51 1.0689 1.0655-1.0724
2,3,3',5,5'-PeCB 111 13C12-2,3',4,4',5-PeCB5,9 118L 25:51 0.9210 0.9181-0.9240 2,2',3,4,4'-PeCB 85 13C12-2,3',4,4',5-PeCB5,9 118L 25:51 0.9210 0.9181-0.9240
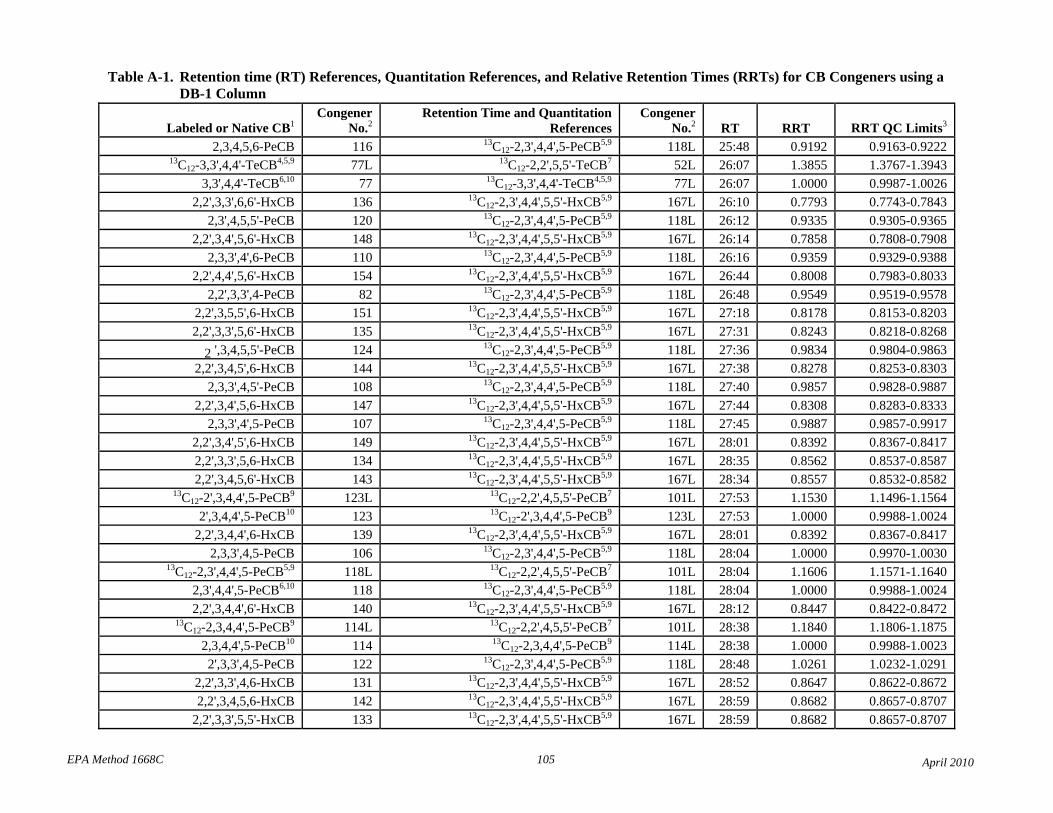
EPA Method 1668C 105 April 2010
Table A-1. Retention time (RT) References, Quantitation References, and Relative Retention Times (RRTs) for CB Congeners using a DB-1 Column
Labeled or Native CB1 Congener
No.2 Retention Time and Quantitation
References Congener
No.2 RT RRT RRT QC Limits3
2,3,4,5,6-PeCB 116 13C12-2,3',4,4',5-PeCB5,9 118L 25:48 0.9192 0.9163-0.9222 13C12-3,3',4,4'-TeCB4,5,9 77L 13C12-2,2',5,5'-TeCB7 52L 26:07 1.3855 1.3767-1.3943
3,3',4,4'-TeCB6,10 77 13C12-3,3',4,4'-TeCB4,5,9 77L 26:07 1.0000 0.9987-1.0026 2,2',3,3',6,6'-HxCB 136 13C12-2,3',4,4',5,5'-HxCB5,9 167L 26:10 0.7793 0.7743-0.7843
2,3',4,5,5'-PeCB 120 13C12-2,3',4,4',5-PeCB5,9 118L 26:12 0.9335 0.9305-0.9365 2,2',3,4',5,6'-HxCB 148 13C12-2,3',4,4',5,5'-HxCB5,9 167L 26:14 0.7858 0.7808-0.7908
2,3,3',4',6-PeCB 110 13C12-2,3',4,4',5-PeCB5,9 118L 26:16 0.9359 0.9329-0.9388 2,2',4,4',5,6'-HxCB 154 13C12-2,3',4,4',5,5'-HxCB5,9 167L 26:44 0.8008 0.7983-0.8033
2,2',3,3',4-PeCB 82 13C12-2,3',4,4',5-PeCB5,9 118L 26:48 0.9549 0.9519-0.9578 2,2',3,5,5',6-HxCB 151 13C12-2,3',4,4',5,5'-HxCB5,9 167L 27:18 0.8178 0.8153-0.8203 2,2',3,3',5,6'-HxCB 135 13C12-2,3',4,4',5,5'-HxCB5,9 167L 27:31 0.8243 0.8218-0.8268
2 ',3,4,5,5'-PeCB 124 13C12-2,3',4,4',5-PeCB5,9 118L 27:36 0.9834 0.9804-0.9863 2,2',3,4,5',6-HxCB 144 13C12-2,3',4,4',5,5'-HxCB5,9 167L 27:38 0.8278 0.8253-0.8303
2,3,3',4,5'-PeCB 108 13C12-2,3',4,4',5-PeCB5,9 118L 27:40 0.9857 0.9828-0.9887 2,2',3,4',5,6-HxCB 147 13C12-2,3',4,4',5,5'-HxCB5,9 167L 27:44 0.8308 0.8283-0.8333
2,3,3',4',5-PeCB 107 13C12-2,3',4,4',5-PeCB5,9 118L 27:45 0.9887 0.9857-0.9917 2,2',3,4',5',6-HxCB 149 13C12-2,3',4,4',5,5'-HxCB5,9 167L 28:01 0.8392 0.8367-0.8417 2,2',3,3',5,6-HxCB 134 13C12-2,3',4,4',5,5'-HxCB5,9 167L 28:35 0.8562 0.8537-0.8587
2,2',3,4,5,6'-HxCB 143 13C12-2,3',4,4',5,5'-HxCB5,9 167L 28:34 0.8557 0.8532-0.8582 13C12-2',3,4,4',5-PeCB9 123L 13C12-2,2',4,5,5'-PeCB7 101L 27:53 1.1530 1.1496-1.1564
2',3,4,4',5-PeCB10 123 13C12-2',3,4,4',5-PeCB9 123L 27:53 1.0000 0.9988-1.0024 2,2',3,4,4',6-HxCB 139 13C12-2,3',4,4',5,5'-HxCB5,9 167L 28:01 0.8392 0.8367-0.8417
2,3,3',4,5-PeCB 106 13C12-2,3',4,4',5-PeCB5,9 118L 28:04 1.0000 0.9970-1.0030 13C12-2,3',4,4',5-PeCB5,9 118L 13C12-2,2',4,5,5'-PeCB7 101L 28:04 1.1606 1.1571-1.1640
2,3',4,4',5-PeCB6,10 118 13C12-2,3',4,4',5-PeCB5,9 118L 28:04 1.0000 0.9988-1.0024 2,2',3,4,4',6'-HxCB 140 13C12-2,3',4,4',5,5'-HxCB5,9 167L 28:12 0.8447 0.8422-0.8472
13C12-2,3,4,4',5-PeCB9 114L 13C12-2,2',4,5,5'-PeCB7 101L 28:38 1.1840 1.1806-1.1875 2,3,4,4',5-PeCB10 114 13C12-2,3,4,4',5-PeCB9 114L 28:38 1.0000 0.9988-1.0023 2',3,3',4,5-PeCB 122 13C12-2,3',4,4',5-PeCB5,9 118L 28:48 1.0261 1.0232-1.0291
2,2',3,3',4,6-HxCB 131 13C12-2,3',4,4',5,5'-HxCB5,9 167L 28:52 0.8647 0.8622-0.8672 2,2',3,4,5,6-HxCB 142 13C12-2,3',4,4',5,5'-HxCB5,9 167L 28:59 0.8682 0.8657-0.8707
2,2',3,3',5,5'-HxCB 133 13C12-2,3',4,4',5,5'-HxCB5,9 167L 28:59 0.8682 0.8657-0.8707
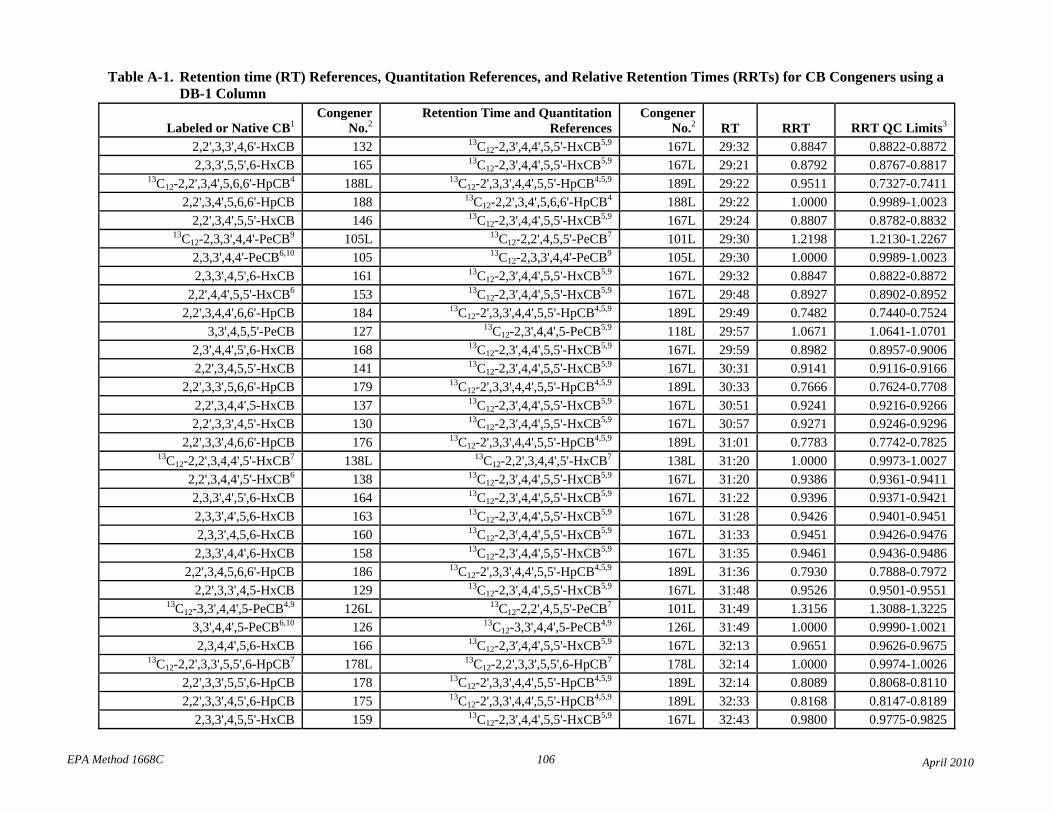
EPA Method 1668C 106 April 2010
Table A-1. Retention time (RT) References, Quantitation References, and Relative Retention Times (RRTs) for CB Congeners using a DB-1 Column
Labeled or Native CB1 Congener
No.2 Retention Time and Quantitation
References Congener
No.2 RT RRT RRT QC Limits3
2,2',3,3',4,6'-HxCB 132 13C12-2,3',4,4',5,5'-HxCB5,9 167L 29:32 0.8847 0.8822-0.8872 2,3,3',5,5',6-HxCB 165 13C12-2,3',4,4',5,5'-HxCB5,9 167L 29:21 0.8792 0.8767-0.8817
13C12-2,2',3,4',5,6,6'-HpCB4 188L 13C12-2',3,3',4,4',5,5'-HpCB4,5,9 189L 29:22 0.9511 0.7327-0.7411 2,2',3,4',5,6,6'-HpCB 188 13C12-2,2',3,4',5,6,6'-HpCB4 188L 29:22 1.0000 0.9989-1.0023
2,2',3,4',5,5'-HxCB 146 13C12-2,3',4,4',5,5'-HxCB5,9 167L 29:24 0.8807 0.8782-0.8832 13C12-2,3,3',4,4'-PeCB9 105L 13C12-2,2',4,5,5'-PeCB7 101L 29:30 1.2198 1.2130-1.2267
2,3,3',4,4'-PeCB6,10 105 13C12-2,3,3',4,4'-PeCB9 105L 29:30 1.0000 0.9989-1.0023 2,3,3',4,5',6-HxCB 161 13C12-2,3',4,4',5,5'-HxCB5,9 167L 29:32 0.8847 0.8822-0.8872
2,2',4,4',5,5'-HxCB6 153 13C12-2,3',4,4',5,5'-HxCB5,9 167L 29:48 0.8927 0.8902-0.8952 2,2',3,4,4',6,6'-HpCB 184 13C12-2',3,3',4,4',5,5'-HpCB4,5,9 189L 29:49 0.7482 0.7440-0.7524
3,3',4,5,5'-PeCB 127 13C12-2,3',4,4',5-PeCB5,9 118L 29:57 1.0671 1.0641-1.0701 2,3',4,4',5',6-HxCB 168 13C12-2,3',4,4',5,5'-HxCB5,9 167L 29:59 0.8982 0.8957-0.9006 2,2',3,4,5,5'-HxCB 141 13C12-2,3',4,4',5,5'-HxCB5,9 167L 30:31 0.9141 0.9116-0.9166
2,2',3,3',5,6,6'-HpCB 179 13C12-2',3,3',4,4',5,5'-HpCB4,5,9 189L 30:33 0.7666 0.7624-0.7708 2,2',3,4,4',5-HxCB 137 13C12-2,3',4,4',5,5'-HxCB5,9 167L 30:51 0.9241 0.9216-0.9266 2,2',3,3',4,5'-HxCB 130 13C12-2,3',4,4',5,5'-HxCB5,9 167L 30:57 0.9271 0.9246-0.9296
2,2',3,3',4,6,6'-HpCB 176 13C12-2',3,3',4,4',5,5'-HpCB4,5,9 189L 31:01 0.7783 0.7742-0.7825 13C12-2,2',3,4,4',5'-HxCB7 138L 13C12-2,2',3,4,4',5'-HxCB7 138L 31:20 1.0000 0.9973-1.0027
2,2',3,4,4',5'-HxCB6 138 13C12-2,3',4,4',5,5'-HxCB5,9 167L 31:20 0.9386 0.9361-0.9411 2,3,3',4',5',6-HxCB 164 13C12-2,3',4,4',5,5'-HxCB5,9 167L 31:22 0.9396 0.9371-0.9421 2,3,3',4',5,6-HxCB 163 13C12-2,3',4,4',5,5'-HxCB5,9 167L 31:28 0.9426 0.9401-0.9451 2,3,3',4,5,6-HxCB 160 13C12-2,3',4,4',5,5'-HxCB5,9 167L 31:33 0.9451 0.9426-0.9476 2,3,3',4,4',6-HxCB 158 13C12-2,3',4,4',5,5'-HxCB5,9 167L 31:35 0.9461 0.9436-0.9486
2,2',3,4,5,6,6'-HpCB 186 13C12-2',3,3',4,4',5,5'-HpCB4,5,9 189L 31:36 0.7930 0.7888-0.7972 2,2',3,3',4,5-HxCB 129 13C12-2,3',4,4',5,5'-HxCB5,9 167L 31:48 0.9526 0.9501-0.9551
13C12-3,3',4,4',5-PeCB4,9 126L 13C12-2,2',4,5,5'-PeCB7 101L 31:49 1.3156 1.3088-1.3225 3,3',4,4',5-PeCB6,10 126 13C12-3,3',4,4',5-PeCB4,9 126L 31:49 1.0000 0.9990-1.0021 2,3,4,4',5,6-HxCB 166 13C12-2,3',4,4',5,5'-HxCB5,9 167L 32:13 0.9651 0.9626-0.9675
13C12-2,2',3,3',5,5',6-HpCB7 178L 13C12-2,2',3,3',5,5',6-HpCB7 178L 32:14 1.0000 0.9974-1.0026 2,2',3,3',5,5',6-HpCB 178 13C12-2',3,3',4,4',5,5'-HpCB4,5,9 189L 32:14 0.8089 0.8068-0.8110 2,2',3,3',4,5',6-HpCB 175 13C12-2',3,3',4,4',5,5'-HpCB4,5,9 189L 32:33 0.8168 0.8147-0.8189
2,3,3',4,5,5'-HxCB 159 13C12-2,3',4,4',5,5'-HxCB5,9 167L 32:43 0.9800 0.9775-0.9825
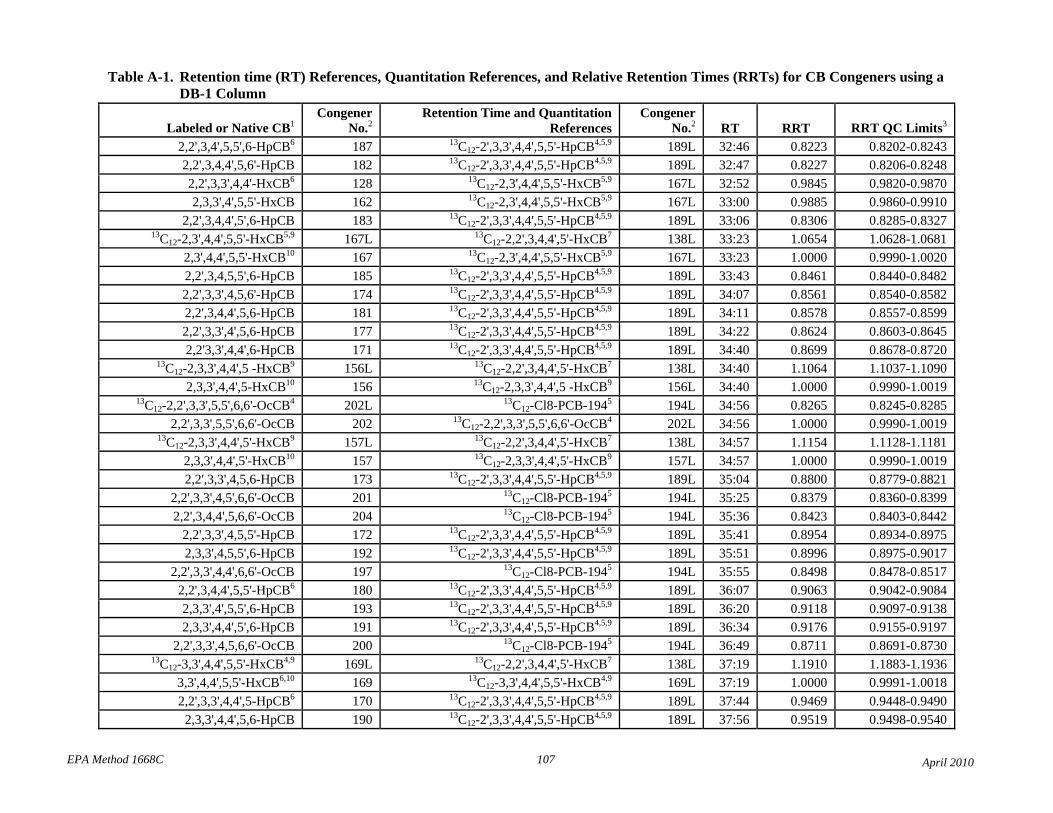
EPA Method 1668C 107 April 2010
Table A-1. Retention time (RT) References, Quantitation References, and Relative Retention Times (RRTs) for CB Congeners using a DB-1 Column
Labeled or Native CB1 Congener
No.2 Retention Time and Quantitation
References Congener
No.2 RT RRT RRT QC Limits3
2,2',3,4',5,5',6-HpCB6 187 13C12-2',3,3',4,4',5,5'-HpCB4,5,9 189L 32:46 0.8223 0.8202-0.8243 2,2',3,4,4',5,6'-HpCB 182 13C12-2',3,3',4,4',5,5'-HpCB4,5,9 189L 32:47 0.8227 0.8206-0.8248
2,2',3,3',4,4'-HxCB6 128 13C12-2,3',4,4',5,5'-HxCB5,9 167L 32:52 0.9845 0.9820-0.9870 2,3,3',4',5,5'-HxCB 162 13C12-2,3',4,4',5,5'-HxCB5,9 167L 33:00 0.9885 0.9860-0.9910
2,2',3,4,4',5',6-HpCB 183 13C12-2',3,3',4,4',5,5'-HpCB4,5,9 189L 33:06 0.8306 0.8285-0.8327 13C12-2,3',4,4',5,5'-HxCB5,9 167L 13C12-2,2',3,4,4',5'-HxCB7 138L 33:23 1.0654 1.0628-1.0681
2,3',4,4',5,5'-HxCB10 167 13C12-2,3',4,4',5,5'-HxCB5,9 167L 33:23 1.0000 0.9990-1.0020 2,2',3,4,5,5',6-HpCB 185 13C12-2',3,3',4,4',5,5'-HpCB4,5,9 189L 33:43 0.8461 0.8440-0.8482 2,2',3,3',4,5,6'-HpCB 174 13C12-2',3,3',4,4',5,5'-HpCB4,5,9 189L 34:07 0.8561 0.8540-0.8582 2,2',3,4,4',5,6-HpCB 181 13C12-2',3,3',4,4',5,5'-HpCB4,5,9 189L 34:11 0.8578 0.8557-0.8599 2,2',3,3',4',5,6-HpCB 177 13C12-2',3,3',4,4',5,5'-HpCB4,5,9 189L 34:22 0.8624 0.8603-0.8645 2,2'3,3',4,4',6-HpCB 171 13C12-2',3,3',4,4',5,5'-HpCB4,5,9 189L 34:40 0.8699 0.8678-0.8720
13C12-2,3,3',4,4',5 -HxCB9 156L 13C12-2,2',3,4,4',5'-HxCB7 138L 34:40 1.1064 1.1037-1.1090 2,3,3',4,4',5-HxCB10 156 13C12-2,3,3',4,4',5 -HxCB9 156L 34:40 1.0000 0.9990-1.0019
13C12-2,2',3,3',5,5',6,6'-OcCB4 202L 13C12-Cl8-PCB-1945 194L 34:56 0.8265 0.8245-0.8285 2,2',3,3',5,5',6,6'-OcCB 202 13C12-2,2',3,3',5,5',6,6'-OcCB4 202L 34:56 1.0000 0.9990-1.0019
13C12-2,3,3',4,4',5'-HxCB9 157L 13C12-2,2',3,4,4',5'-HxCB7 138L 34:57 1.1154 1.1128-1.1181 2,3,3',4,4',5'-HxCB10 157 13C12-2,3,3',4,4',5'-HxCB9 157L 34:57 1.0000 0.9990-1.0019 2,2',3,3',4,5,6-HpCB 173 13C12-2',3,3',4,4',5,5'-HpCB4,5,9 189L 35:04 0.8800 0.8779-0.8821
2,2',3,3',4,5',6,6'-OcCB 201 13C12-Cl8-PCB-1945 194L 35:25 0.8379 0.8360-0.8399 2,2',3,4,4',5,6,6'-OcCB 204 13C12-Cl8-PCB-1945 194L 35:36 0.8423 0.8403-0.8442
2,2',3,3',4,5,5'-HpCB 172 13C12-2',3,3',4,4',5,5'-HpCB4,5,9 189L 35:41 0.8954 0.8934-0.8975 2,3,3',4,5,5',6-HpCB 192 13C12-2',3,3',4,4',5,5'-HpCB4,5,9 189L 35:51 0.8996 0.8975-0.9017
2,2',3,3',4,4',6,6'-OcCB 197 13C12-Cl8-PCB-1945 194L 35:55 0.8498 0.8478-0.8517 2,2',3,4,4',5,5'-HpCB6 180 13C12-2',3,3',4,4',5,5'-HpCB4,5,9 189L 36:07 0.9063 0.9042-0.9084 2,3,3',4',5,5',6-HpCB 193 13C12-2',3,3',4,4',5,5'-HpCB4,5,9 189L 36:20 0.9118 0.9097-0.9138 2,3,3',4,4',5',6-HpCB 191 13C12-2',3,3',4,4',5,5'-HpCB4,5,9 189L 36:34 0.9176 0.9155-0.9197
2,2',3,3',4,5,6,6'-OcCB 200 13C12-Cl8-PCB-1945 194L 36:49 0.8711 0.8691-0.8730 13C12-3,3',4,4',5,5'-HxCB4,9 169L 13C12-2,2',3,4,4',5'-HxCB7 138L 37:19 1.1910 1.1883-1.1936
3,3',4,4',5,5'-HxCB6,10 169 13C12-3,3',4,4',5,5'-HxCB4,9 169L 37:19 1.0000 0.9991-1.0018 2,2',3,3',4,4',5-HpCB6 170 13C12-2',3,3',4,4',5,5'-HpCB4,5,9 189L 37:44 0.9469 0.9448-0.9490
2,3,3',4,4',5,6-HpCB 190 13C12-2',3,3',4,4',5,5'-HpCB4,5,9 189L 37:56 0.9519 0.9498-0.9540
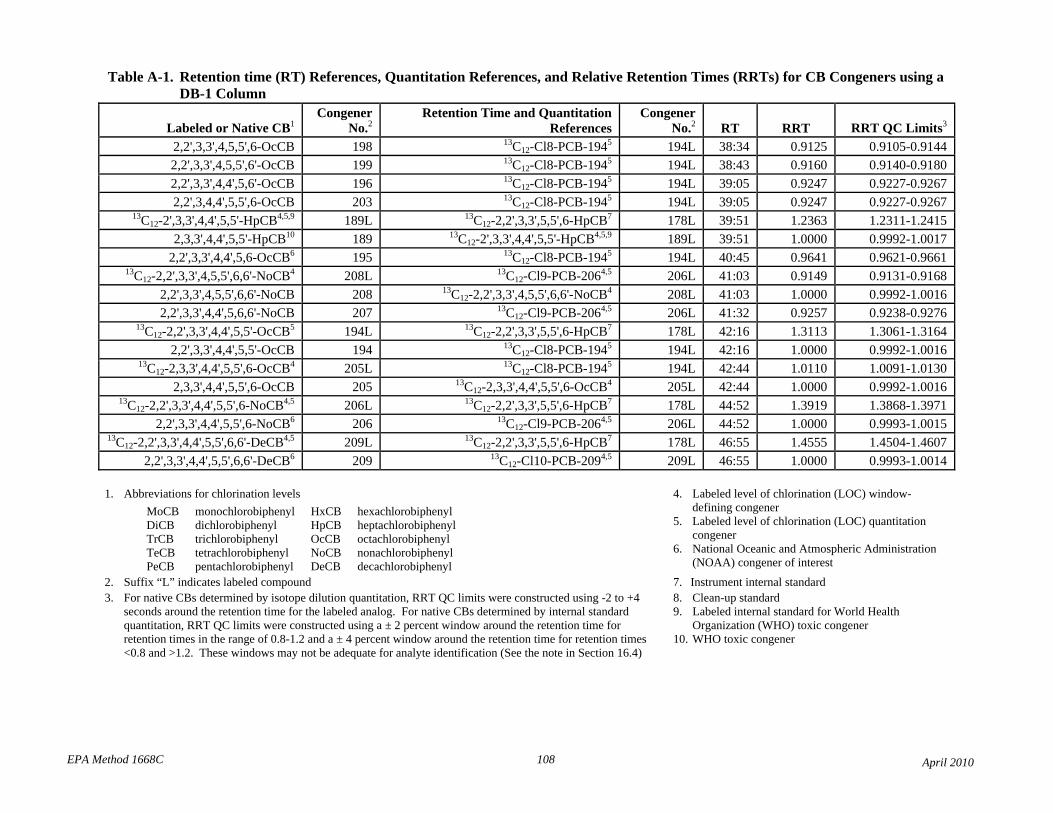
EPA Method 1668C 108 April 2010
Table A-1. Retention time (RT) References, Quantitation References, and Relative Retention Times (RRTs) for CB Congeners using a DB-1 Column
Labeled or Native CB1 Congener
No.2 Retention Time and Quantitation
References Congener
No.2 RT RRT RRT QC Limits3
2,2',3,3',4,5,5',6-OcCB 198 13C12-Cl8-PCB-1945 194L 38:34 0.9125 0.9105-0.9144 2,2',3,3',4,5,5',6'-OcCB 199 13C12-Cl8-PCB-1945 194L 38:43 0.9160 0.9140-0.9180 2,2',3,3',4,4',5,6'-OcCB 196 13C12-Cl8-PCB-1945 194L 39:05 0.9247 0.9227-0.9267 2,2',3,4,4',5,5',6-OcCB 203 13C12-Cl8-PCB-1945 194L 39:05 0.9247 0.9227-0.9267
13C12-2',3,3',4,4',5,5'-HpCB4,5,9 189L 13C12-2,2',3,3',5,5',6-HpCB7 178L 39:51 1.2363 1.2311-1.2415 2,3,3',4,4',5,5'-HpCB10 189 13C12-2',3,3',4,4',5,5'-HpCB4,5,9 189L 39:51 1.0000 0.9992-1.0017
2,2',3,3',4,4',5,6-OcCB6 195 13C12-Cl8-PCB-1945 194L 40:45 0.9641 0.9621-0.9661 13C12-2,2',3,3',4,5,5',6,6'-NoCB4 208L 13C12-Cl9-PCB-2064,5 206L 41:03 0.9149 0.9131-0.9168
2,2',3,3',4,5,5',6,6'-NoCB 208 13C12-2,2',3,3',4,5,5',6,6'-NoCB4 208L 41:03 1.0000 0.9992-1.0016 2,2',3,3',4,4',5,6,6'-NoCB 207 13C12-Cl9-PCB-2064,5 206L 41:32 0.9257 0.9238-0.9276
13C12-2,2',3,3',4,4',5,5'-OcCB5 194L 13C12-2,2',3,3',5,5',6-HpCB7 178L 42:16 1.3113 1.3061-1.3164 2,2',3,3',4,4',5,5'-OcCB 194 13C12-Cl8-PCB-1945 194L 42:16 1.0000 0.9992-1.0016
13C12-2,3,3',4,4',5,5',6-OcCB4 205L 13C12-Cl8-PCB-1945 194L 42:44 1.0110 1.0091-1.0130 2,3,3',4,4',5,5',6-OcCB 205 13C12-2,3,3',4,4',5,5',6-OcCB4 205L 42:44 1.0000 0.9992-1.0016
13C12-2,2',3,3',4,4',5,5',6-NoCB4,5 206L 13C12-2,2',3,3',5,5',6-HpCB7 178L 44:52 1.3919 1.3868-1.3971 2,2',3,3',4,4',5,5',6-NoCB6 206 13C12-Cl9-PCB-2064,5 206L 44:52 1.0000 0.9993-1.0015
13C12-2,2',3,3',4,4',5,5',6,6'-DeCB4,5 209L 13C12-2,2',3,3',5,5',6-HpCB7 178L 46:55 1.4555 1.4504-1.4607 2,2',3,3',4,4',5,5',6,6'-DeCB6 209 13C12-Cl10-PCB-2094,5 209L 46:55 1.0000 0.9993-1.0014
1. Abbreviations for chlorination levels MoCB monochlorobiphenyl HxCB hexachlorobiphenyl DiCB dichlorobiphenyl HpCB heptachlorobipheny l TrCB trichlorobiphenyl OcCB octachlorobipheny l TeCB tetrachlorobiphenyl NoCB nonachlorobiphenyl
PeCB pentachlorobipheny l DeCB decachlorobiphenyl 2. Suffix “L” indicates labeled compound 3. For native CBs determined by isotope dilution quantitation, RRT QC limits were constructed using -2 to +4
seconds around the retention time for the labeled analog. For native CBs determined by internal standard quantitation, RRT QC limits were constructed using a ± 2 percent window around the retention time for retention times in the range of 0.8-1.2 and a ± 4 percent window around the retention time for retention times <0.8 and >1.2. These windows may not be adequate for analyte identification (See the note in Section 16 .4)
4. Labeled level of chlorination (LOC) window-defining congener
5. Labeled level o f chlorination (LOC) quantita tion congener
6. National Oceanic and Atmospheric Administration (NOAA) congener of interest
7. Instrument inter nal standard 8. s Clean-up tandar d 9. Labeled internal standard for World Health
Organization (WHO) toxic congener 10. WHO toxic cong ener
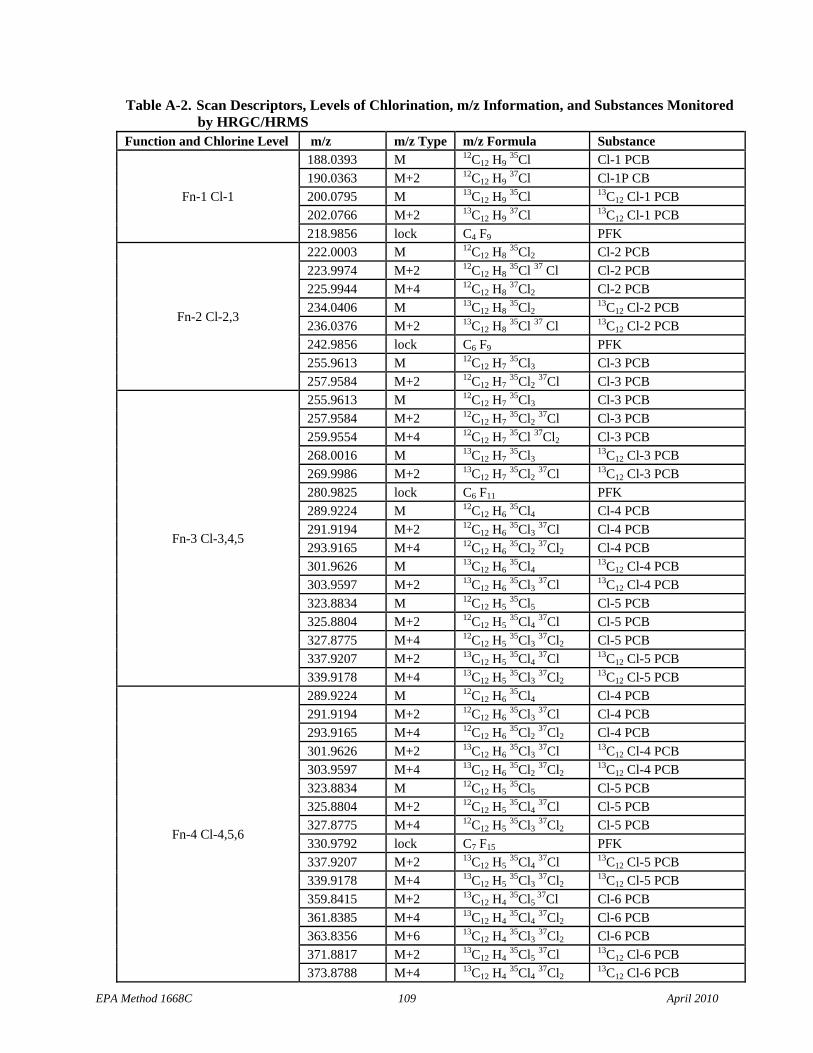
Table A-2. Scan Descriptors, Levels of Chlorination, m/z Information, and Substances Monitored by HRGC/HRMS
Function and Chlorine Level m/z m/z Type m/z Formula Substance
Fn-1 Cl-1
188.0393 M 12C12 H9 35Cl Cl-1 PCB
190.0363 M+2 12C12 H9 37Cl Cl-1P CB
200.0795 M 13C12 H9 35Cl 13C12 Cl-1 PCB
202.0766 M+2 13C12 H9 37Cl 13C12 Cl-1 PCB
218.9856 lock C4 F9 PFK
Fn-2 Cl-2,3
222.0003 M 12C12 H8 35Cl2 Cl-2 PCB
223.9974 M+2 12C12 H8 35Cl 37 Cl Cl-2 PCB
225.9944 M+4 12C12 H8 37Cl2 Cl-2 PCB
234.0406 M 13C12 H8 35Cl2
13C12 Cl-2 PCB 236.0376 M+2 13C12 H8
35Cl 37 Cl 13C12 Cl-2 PCB 242.9856 lock C6 F9 PFK 255.9613 M 12C12 H7
35Cl3 Cl-3 PCB 257.9584 M+2 12C12 H7
35Cl2 37Cl Cl-3 PCB
Fn-3 Cl-3,4,5
255.9613 M 12C12 H7 35Cl3 Cl-3 PCB
257.9584 M+2 12C12 H7 35Cl2
37Cl Cl-3 PCB 259.9554 M+4 12C12 H7
35Cl 37Cl2 Cl-3 PCB 268.0016 M 13C12 H7
35Cl3 13C12 Cl-3 PCB
269.9986 M+2 13C12 H7 35Cl2
37Cl 13C12 Cl-3 PCB 280.9825 lock C6 F11 PFK 289.9224 M 12C12 H6
35Cl4 Cl-4 PCB 291.9194 M+2 12C12 H6
35Cl3 37Cl Cl-4 PCB
293.9165 M+4 12C12 H6 35Cl2
37Cl2 Cl-4 PCB 301.9626 M 13C12 H6
35Cl4 13C12 Cl-4 PCB
303.9597 M+2 13C12 H6 35Cl3
37Cl 13C12 Cl-4 PCB 323.8834 M 12C12 H5
35Cl5 Cl-5 PCB 325.8804 M+2 12C12 H5
35Cl4 37Cl Cl-5 PCB
327.8775 M+4 12C12 H5 35Cl3
37Cl2 Cl-5 PCB 337.9207 M+2 13C12 H5
35Cl4 37Cl 13C12 Cl-5 PCB
339.9178 M+4 13C12 H5 35Cl3
37Cl2 13C12 Cl-5 PCB
Fn-4 Cl-4,5,6
289.9224 M 12C12 H6 35Cl4 Cl-4 PCB
291.9194 M+2 12C12 H6 35Cl3
37Cl Cl-4 PCB 293.9165 M+4 12C12 H6
35Cl2 37Cl2 Cl-4 PCB
301.9626 M+2 13C12 H6 35Cl3
37Cl 13C12 Cl-4 PCB 303.9597 M+4 13C12 H6
35Cl2 37Cl2
13C12 Cl-4 PCB 323.8834 M 12C12 H5
35Cl5 Cl-5 PCB 325.8804 M+2 12C12 H5
35Cl4 37Cl Cl-5 PCB
327.8775 M+4 12C12 H5 35Cl3
37Cl2 Cl-5 PCB 330.9792 lock C7 F15 PFK 337.9207 M+2 13C12 H5
35Cl4 37Cl 13C12 Cl-5 PCB
339.9178 M+4 13C12 H5 35Cl3
37Cl2 13C12 Cl-5 PCB
359.8415 M+2 13C12 H4 35Cl5
37Cl Cl-6 PCB 361.8385 M+4 13C12 H4
35Cl4 37Cl2 Cl-6 PCB
363.8356 M+6 13C12 H4 35Cl3
37Cl2 Cl-6 PCB 371.8817 M+2 13C12 H4
35Cl5 37Cl 13C12 Cl-6 PCB
373.8788 M+4 13C12 H4 35Cl4
37Cl2 13C12 Cl-6 PCB
EPA Method 1668C 109 April 2010
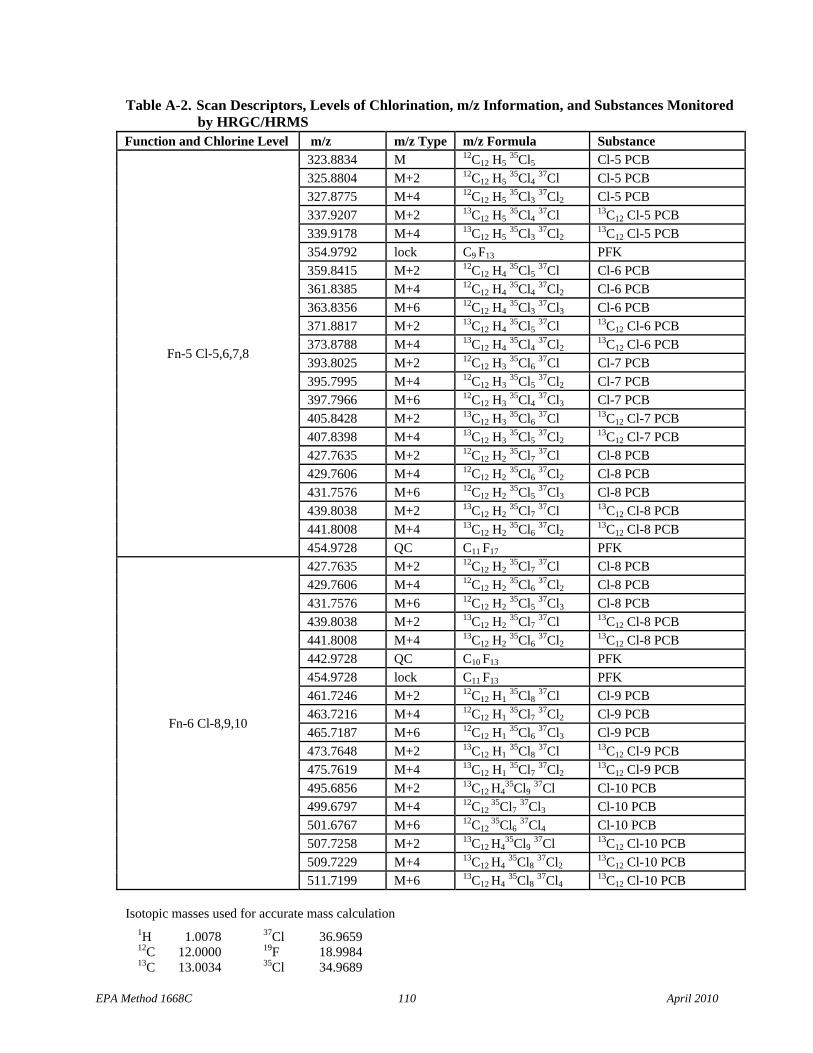
Table A-2. Scan Descriptors, Levels of Chlorination, m/z Information, and Substances Monitored by HRGC/HRMS
Function and Chlorine Level m/z m/z Type m/z Formula Substance
Fn-5 Cl-5,6,7,8
323.8834 M 12C12 H5 35Cl5 Cl-5 PCB
325.8804 M+2 12C12 H5 35Cl4
37Cl Cl-5 PCB 327.8775 M+4 12C12 H5
35Cl3 37Cl2 Cl-5 PCB
337.9207 M+2 13C12 H5 35Cl4
37Cl 13C12 Cl-5 PCB 339.9178 M+4 13C12 H5
35Cl3 37Cl2
13C12 Cl-5 PCB 354.9792 lock C9 F13 PFK 359.8415 M+2 12C12 H4
35Cl5 37Cl Cl-6 PCB
361.8385 M+4 12C12 H4 35Cl4
37Cl2 Cl-6 PCB 363.8356 M+6 12C12 H4
35Cl3 37Cl3 Cl-6 PCB
371.8817 M+2 13C12 H4 35Cl5
37Cl 13C12 Cl-6 PCB 373.8788 M+4 13C12 H4
35Cl4 37Cl2
13C12 Cl-6 PCB 393.8025 M+2 12C12 H3
35Cl6 37Cl Cl-7 PCB
395.7995 M+4 12C12 H3 35Cl5
37Cl2 Cl-7 PCB 397.7966 M+6 12C12 H3
35Cl4 37Cl3 Cl-7 PCB
405.8428 M+2 13C12 H3 35Cl6
37Cl 13C12 Cl-7 PCB 407.8398 M+4 13C12 H3
35Cl5 37Cl2
13C12 Cl-7 PCB 427.7635 M+2 12C12 H2
35Cl7 37Cl Cl-8 PCB
429.7606 M+4 12C12 H2 35Cl6
37Cl2 Cl-8 PCB 431.7576 M+6 12C12 H2
35Cl5 37Cl3 Cl-8 PCB
439.8038 M+2 13C12 H2 35Cl7
37Cl 13C12 Cl-8 PCB 441.8008 M+4 13C12 H2
35Cl6 37Cl2
13C12 Cl-8 PCB 454.9728 QC C11 F17 PFK
Fn-6 Cl-8,9,10
427.7635 M+2 12C12 H2 35Cl7
37Cl Cl-8 PCB 429.7606 M+4 12C12 H2
35Cl6 37Cl2 Cl-8 PCB
431.7576 M+6 12C12 H2 35Cl5
37Cl3 Cl-8 PCB 439.8038 M+2 13C12 H2
35Cl7 37Cl 13C12 Cl-8 PCB
441.8008 M+4 13C12 H2 35Cl6
37Cl2 13C12 Cl-8 PCB
442.9728 QC C10 F13 PFK 454.9728 lock C11 F13 PFK 461.7246 M+2 12C12 H1
35Cl8 37Cl Cl-9 PCB
463.7216 M+4 12C12 H1 35Cl7
37Cl2 Cl-9 PCB 465.7187 M+6 12C12 H1
35Cl6 37Cl3 Cl-9 PCB
473.7648 M+2 13C12 H1 35Cl8
37Cl 13C12 Cl-9 PCB 475.7619 M+4 13C12 H1
35Cl7 37Cl2
13C12 Cl-9 PCB 495.6856 M+2 13C12 H4
35Cl9 37Cl Cl-10 PCB
499.6797 M+4 12C12 35Cl7
37Cl3 Cl-10 PCB 501.6767 M+6 12C12
35Cl6 37Cl4 Cl-10 PCB
507.7258 M+2 13C12 H4 35Cl9
37Cl 13C12 Cl-10 PCB 509.7229 M+4 13C12 H4
35Cl8 37Cl2
13C12 Cl-10 PCB 511.7199 M+6 13C12 H4
35Cl8 37Cl4
13C12 Cl-10 PCB
Isotopic masses used for accurate mass calculation 1H 1.0078 37Cl 36.9659 12C 12.0000 19F 18.9984 13C 13.0034 35Cl 34.9689
EPA Method 1668C 110 April 2010