
6sismologia PGA Ometepec
24
GEOFÍSICA INTERNACIONAL (2013) 522: 173196 173 OmetepecPinotepa Nacional, Mexico Earthquake of 20 March 2012 (M w 7.5): A preliminary report Universidad Nacional Autónoma de México Seismology Group * (with contribution from Universidad Autónoma Metropolitana, Azcapozalco, México, D.F.) Received: February 02, 2013 accepted: February 15, 2013 published on line: March 22, 2013 * UNAM Seismology Group includes all researchers and technicians of Institute of Geophysics and Institute of (QJLQHHULQJ 81$0 ZKR ZRUN LQ WKH ¿HOG RI VHLVPRORJ\ and engineering seismology. ORIGINAL PAPER Resumen A partir de un análisis de los datos locales y regionales del sismo somero e inverso de OmetepecPinotepa Nacional (M w 7.5), del 20 de marzo de 2012, se determinó la localización de su hipocentro en 16.254°N 98.531°W, aproximadamente 5 km fuera de la costa a una profundidad de 20 km. Durante los primeros 4 segundos de la ruptura, el deslizamiento fue relativamente pequeño. Esta fase inicial fue seguida por dos parches de gran deslizamiento, uno de ellos echado arriba del hipocentro, hacia el SE, y el otro echado abajo, hacia el norte. El área de ruptura total, estimada a partir de la inversión de registros de movimientos fuertes cercanos a la fuente, es de ~25 km × 60 km. El sismo fue seguido por un número excepcionalmen te grande de réplicas. El área de réplicas coincide espacialmente con la observada en el doblete de 1982 (M w 7.0, 6.9). Sin embargo, el momento sísmico del sismo de 2012 es ~3 veces mayor al de la suma de los momentos del doblete, indicando que las características generales de la ruptura GH ORV GRV HSLVRGLRV VtVPLFRV GL¿HUHQ (O iUHD GH escaso deslizamiento cerca del hipocentro y las áreas de gran deslizamiento de los dos parches se distinguen por una actividad relativamente pequeña de réplicas. Sin embargo, se observa una clara y sorprendente alineación de las réplicas en dirección NE al este del epicentro. Los cocientes de la energía radiada y el momento sísmico (E s /M 0 ) de cinco sismos en la región de estudio revelan que dichos cocientes son, en el caso de sismos cercanos a la trinchera, un orden de magnitud más pequeños que los observados en eventos que ocurren echado abajo (e.g., los sismos de 2012 y de Copala de 1995). Los sismos cercanos a la trinchera son conocidos por producir una aceleración máxima (PGA) baja. La informa ción disponible sugiere que la interfase de la placa en la región puede ser dividida en tres dominios en dirección del echado: (1) De la trinchera a una distancia de 35 km echado abajo. En este dominio ocurren sismos de M~6 a 7 con valores bajos de (E s /M 0 ). Estos eventos generan un gran número de réplicas. No se sabe si el área donde no han ocurrido rupturas en este dominio de la interfase se desliza asísmicamente (deslizamiento estable) o si se encuentra parcialmente acoplada. (2) De 35 a 100 km a partir de la trinchera. Este dominio está sísmicamente acoplado y es en donde ocurre el deslizamiento stickslip, generando grandes sismos. Probablemente, parte del dominio se en cuentra condicionalmente estable. (3) De 100 a 200 km a partir de la trinchera. En este dominio se han reportado eventos de deslizamiento lento (SSE) y tremores no volcánicos (NVT). El sismo causó daños severos en y cerca de los poblados de Ometepec y Pinotepa Nacional. La PGA excedió 1 g en un sitio blando de la región epicentral. Los valores de PGA observados en sitios duros en función de la distancia epicentral concuerdan razonablemente bien con las leyes de atenuación derivadas a partir de datos de sismos mexicanos interplaca. El sismo se sintió fuertemente en la Ciudad de México. La PGA en Ciudad Universitaria, un sitio duro en la capital del país, fue de 12 gales. Registros de movimientos fuertes en la ciudad desde 1985 muestran que los valores de PGA durante el sismo de 2012 no fueron excepcionales, y que movimientos similares en la ciudad ocurren ~ una vez cada tres años. Palabras clave: sismo de OmetepecPinotepa Nacional de 2012, sismo interplaca, deslizamiento y energía radiada, movimiento del terreno.
-
Upload
ricardo-chiu -
Category
Documents
-
view
31 -
download
0
Transcript of 6sismologia PGA Ometepec

GEOFÍSICA INTERNACIONAL (2013) 52-2: 173-196
173
Ometepec-Pinotepa Nacional, Mexico Earthquake of 20 March 2012
(Mw7.5): A preliminary report
Universidad Nacional Autónoma de México Seismology Group*
(with contribution from Universidad Autónoma Metropolitana, Azcapozalco, México, D.F.)
Received: February 02, 2013;; accepted: February 15, 2013;; published on line: March 22, 2013
* UNAM Seismology Group includes all researchers and technicians of Institute of Geophysics and Institute of
and engineering seismology.
ORIGINAL PAPER
Resumen
A partir de un análisis de los datos locales y regionales del sismo somero e inverso de Ometepec-Pinotepa Nacional (Mw 7.5), del 20 de marzo de 2012, se determinó la localización de su hipocentro en 16.254°N 98.531°W, aproximadamente 5 km fuera de la costa a una profundidad de 20 km. Durante los primeros 4 segundos de la ruptura, el deslizamiento fue relativamente pequeño. Esta fase inicial fue seguida por dos parches de gran deslizamiento, uno de ellos echado arriba del hipocentro, hacia el SE, y el otro echado abajo, hacia el norte. El área de ruptura total, estimada a partir de la inversión de registros de movimientos fuertes cercanos a la fuente, es de ~25 km × 60 km. El sismo fue seguido por un número excepcionalmen-te grande de réplicas. El área de réplicas coincide espacialmente con la observada en el doblete de 1982 (Mw7.0, 6.9). Sin embargo, el momento sísmico del sismo de 2012 es ~3 veces mayor al de la suma de los momentos del doblete, indicando que las características generales de la ruptura
escaso deslizamiento cerca del hipocentro y las áreas de gran deslizamiento de los dos parches se distinguen por una actividad relativamente pequeña de réplicas. Sin embargo, se observa una clara y sorprendente alineación de las réplicas en dirección NE al este del epicentro. Los cocientes de la energía radiada y el momento sísmico (Es/M0) de cinco sismos en la región de estudio revelan que dichos cocientes son, en el caso de sismos cercanos a la trinchera, un orden de magnitud más pequeños que los observados en eventos que ocurren echado abajo (e.g., los sismos de 2012 y de Copala de 1995). Los sismos cercanos a la trinchera son conocidos por producir una
aceleración máxima (PGA) baja. La informa- ción disponible sugiere que la interfase de la placa en la región puede ser dividida en tres dominios en dirección del echado: (1) De la trinchera a una distancia de 35 km echado abajo. En este dominio ocurren sismos de M~6 a 7 con valores bajos de (Es/M0). Estos eventos generan un gran número de réplicas. No se sabe si el área donde no han ocurrido rupturas en este dominio de la interfase se desliza asísmicamente (deslizamiento estable) o si se encuentra parcialmente acoplada. (2) De 35 a 100 km a partir de la trinchera. Este dominio está sísmicamente acoplado y es en donde ocurre el deslizamiento stick-slip, generando grandes sismos. Probablemente, parte del dominio se en-cuentra condicionalmente estable. (3) De 100 a 200 km a partir de la trinchera. En este dominio se han reportado eventos de deslizamiento lento (SSE) y tremores no volcánicos (NVT).El sismo causó daños severos en y cerca de los poblados de Ometepec y Pinotepa Nacional. La PGA excedió 1 g en un sitio blando de la región epicentral. Los valores de PGA observados en sitios duros en función de la distancia epicentral concuerdan razonablemente bien con las leyes de atenuación derivadas a partir de datos de sismos mexicanos interplaca. El sismo se sintió fuertemente en la Ciudad de México. La PGA en Ciudad Universitaria, un sitio duro en la capital del país, fue de 12 gales. Registros de movimientos fuertes en la ciudad desde 1985 muestran que los valores de PGA durante el sismo de 2012 no fueron excepcionales, y que movimientos similares en la ciudad ocurren ~ una vez cada tres años.
Palabras clave: sismo de Ometepec-Pinotepa Nacional de 2012, sismo interplaca, deslizamiento y energía radiada, movimiento del terreno.

Universidad Nacional Autónoma de México Seismology Group
174 VOLUME 52 NUMBER 2
Introduction
The Ometepec-Pinotepa Nacional earthquake of 20 March 2012 (Mw7.5) initiated near the mexican coast at the border between the states of Oaxaca and Guerrero. It was a shallow thrust earthquake which ruptured the interface of the subducting oceanic Cocos and overriding continental North America plates. An Earthquake Engineering Research Institute (EERI) special report on the earthquake (Juárez García et al., 2012) states that in the epicentral zone “almost 2,000 houses collapsed or were judged to be total losses, over 3,000 houses sustained heavy damage, and over 3,000 were reported with minor damage.” The earthquake was strongly felt in Mexico City.
The earthquake was recorded in the epicentral zone at Pinotepa Nacional station (PNIG) which is equipped with a broadband seismograph, an accelerograph, and a GPS receiver with a sampling interval of 1 s (Figure 1). This station is operated by the National Seismological Service (SSN, Servicio Sismológico Nacional) of Instituto de Geofísica, Universidad Nacional Autónoma de México (UNAM). Data from PNIG are transmitted in real-time to Instituto de Geofísica, UNAM. There were several accelerographs in and near the epicentral zone (elements of seismic alert systems for Mexico City and the City of Oaxaca) which produced strong-motion recordings. There were also a few GPS stations in the area, operating in an autonomous mode, from which coseismic static
the earthquake, a portable network of seven seismic stations was installed in the epicentral area to record aftershocks. At regional distances, the earthquake was recorded by broadband seismographs and accelerographs. The event produced numerous accelerograms in the Valley of Mexico and the City of Oaxaca.
Based on the analysis of a subset of this large data set, we present preliminary results on the location of the mainshock and aftershocks, slip distribution on the fault, relationship of the aftershock area with the slip distribution, radiated seismic energy, attenuation of PGA as a function of distance, and ground-motion characteristics in the Valley of Mexico. When possible, we compare the 2012 earthquake with other large Mexican subduction thrust earthquakes, including the
Abstract
An analysis of local and regional data produced by the shallow, thrust Ometepec-Pinotepa Nacional earthquake (Mw 7.5) of 20 March 2012 shows that it nucleated at 16.254°N 98.531°W, about 5 km offshore at a depth of about 20 km.
small. It was followed by rupture of two patches with large slip, one updip of the hypocenter to the SE and the other downdip to the north. Total rupture area, estimated from inversion of near-source strong-motion recordings, is ~25 km × 60 km. The earthquake was followed by an exceptionally large number of aftershocks. The aftershock area overlaps with that of the 1982 doublet (Mw7.0, 6.9). However, the seismic moment of the 2012 earthquake is ~3 times the sum of the moments of the doublet, indicating that the gross rupture characteristics of the two earthquake episodes differ. The small-slip area near the hypocenter and large-slip areas of the two patches are characterized by relatively small aftershock activity. A striking, intense, linear NE alignment of the aftershocks is clearly seen. The radiated energy to seismic moment ratios, (Es/M0that they are an order of magnitude smaller for near-trench earthquakes than those that occur further downdip (e.g., 2012 and the 1995 Copala earthquakes). The near-trench earthquakes are known to produce low Amax. The available information suggests that the plate interface in the region can be divided in three domains. (1) From the trench to a distance of about 35 km downdip. In this domain M~6 to 7 earthquakes with low values of (Es/M0) occur. These events generate large number of aftershocks. It is not known whether the remaining area on this part of the interface slips aseismically (stable sliding) or is partially locked. (2) From 35 to 100 km from the trench. This domain is seismically coupled where stick-slip sliding occurs, generating large earthquakes. Part of the area is probably conditionally stable. (3) From 100 to 200 km from the trench. In this domain slow slip events (SSE) and nonvolcanic tremors (NVT) have been reported. The earthquake caused severe damage in and near the towns of Ometepec and Pinotepa Nacional. The PGA exceeded 1 g at a soft site in the epicentral region. Observed PGAs on hard sites as a function of distance are in reasonable agreement with the expected ones from ground motion prediction equations derived using data from Mexican interplate earthquakes. The earthquake was strongly felt in Mexico City. PGA at CU, a hard site in the city, was 12 gal. Strong-motion recordings in the city since 1985 demonstrate that PGAs during the 2012 earthquake were not exceptional, and that similar motion occurs about once in three years.
Key words: 2012 Ometepec-Pinotepa Nacional earthquake, interplate earthquake, slip and radiated energy, ground motion.

GEOFÍSICA INTERNACIONAL
APRIL - JUNE 2013 175
1982 Ometepec doublet (Mw6.9, 7.0) which may have broken roughly the same segment of the plate boundary and the 1995 Copala earthquake (Mw7.3) which ruptured the adjacent one. These comparisons help put this earthquake in proper perspective with respect to the other shallow thrust earthquakes along the Mexican subduction zone.
Tectonic Setting and Previous Earthquakes
in the Region
In the area of interest, the oceanic Cocos plate subducts below Mexico at a relative convergence rate of 6 cm/yr in the direction N34°E (DeMets et al., 1990). Shallow, thrust earthquakes along
consequence of the subduction, exhibit some special characteristics. (1) Large earthquakes seem to occur periodically with a recurrence period of 30-50 years (Singh et al., 1981). (2) The statistics of earthquakes in the region suggests occurrence of characteristic earthquakes of magnitude around 7.6 (Singh et al., 1983). (3) The rupture process of the earthquakes, as seen on teleseismic Galitzin and long-period WWSSN seismograms, is remarkably simple to the east of 98.2°W but becomes more complex to the west (Chael and Stewart, 1982;; Singh and Mortera, 1991).
Several parallel ridges of seamounts have
in the area (Kanjorski, 2003). These seamounts are oriented 15–20° from orthogonal to the trench axis (Figure 1). Kanjorski (2003) suggests that characteristics of seismicity in the region are affected by subduction of the seamounts. The oceanic crust is segmented along the seamount-parallel faults at the subduction zone (“slivered” ocean crust model). During large earthquakes each slivered piece of the subducted plate, generally, ruptures independently, the dimension being controlled by the spacing of the parallel seamount chains (50-100 km). We note that the rupture area of the 1982 doublet mostly falls between two parallel faults. As we show later, the rupture area of the 2012 earthquake also lies between these faults and overlaps with that of the 1982 doublet. Based on analysis of local seismicity, Yamamoto et al. (2002, 2013) suggest that the upper plate in the region is also segmented.
Table 1 lists large shallow, thrust earthquakes in the region which have occurred since 1900 near the coast between the latitudes of 95.0°W and 99.0°W. The region covered in this table includes south east Guerrero. Figure 1 shows the epicenters of these earthquakes. When the aftershock area of an earthquake is reasonably
Figure 1. Tectonic map of the region showing epicenters of large, shallow, thrust earthquakes in Oaxaca and SE Guerrero (1928-present;; Table 1) and their aftershock areas if known (closed contour if reliable, dashed otherwise;; see text). Epicenter of the Ometepec-Pinotepa Nacional 2012 event is indicated by a star. Epicenter of the 1997 (Mw6.7) event, of relevance to the study (see text), is given. Parallel thick green lines: faults along seamount lineaments offshore (continuous) and their prolongation inland (dashed), taken from Kanjorski (2003). PNIG is a station equipped with broadband seismometer, accelerometer, and GPS receiver. A schematic section along A-A’ is shown in Figure 16.

Universidad Nacional Autónoma de México Seismology Group
176 VOLUME 52 NUMBER 2
well known from local and regional seismograms, it is illustrated by a contour of unbroken line in
central Oaxaca earthquake of 1978 (Singh et al., 1980) and the Ometepec doublet (Nava, 1984). For these earthquakes portable seismographs
earthquake, both aftershock and slip areas (Courboulex et al., 1997) are shown. We roughly estimated the aftershock area of the 1996 earthquake, using local, single-station, three-component seismograms at PNIG. This area is illustrated in Figure 1 by a contour of broken line. There is more uncertainty in the aftershock areas of 1965 and 1968 earthquakes which were estimated from seismograms at regional distances. Hence, these areas are also shown by
only shows the epicenters;; even these are poorly known. Due to uncertainty in the location of the large pre-1965 earthquakes, the recurrence periods of the events, especially in south east Guerrero, are also uncertain.
Seismic Recordings in and near the Epicentral
Zone
The station PNIG, which, as mentioned earlier, was located near the epicentral region (Figures 1 and 2) and equipped with a broadband seismograph, an accelerograph, and a GPS receiver, played an important role in the analysis of the earthquake. There were seven other accelerographs in the region which recorded the event (Figure 2).
After a few seconds of recording, the data stream at PNIG was lost for ~ 4 hours. Much of the seismic data, including the mainshock accelerogram, were retrieved soon after communication was re-established. The broadband seismograms were clipped during the mainshock. Figure 3a shows acceleration, velocity, and displacement at PNIG (velocity and displacement were obtained from direct integration of the acceleration). The traces begin at the arrival of P wave. The displacements on NS, EW, and Z components, 25 s after P-wave arrival, are – 9.0, - 8.0, and - 8.0 cm, respectively.
Since 2011, the GPS network operated by the
data in real time. At the time of the Ometepec-Pinotepa Nacional earthquake, the PNIG GPS permanent station had been recently set up, and the real-time processing scheme had not been yet implemented. We performed a high-rate post-processing of PNIG GPS data using Gipsy-Oasis software (Gregorius, 1996) to obtain displacement records. Figure 3b compares the displacement
of PNIG accelerographic records (continuous line) and from GPS 1 Hz data (red crosses). As can be seen, the GPS continuous stream failed for almost 1 minute, probably due to electrical supply failure. Displacement recovered by double numerical integration agrees well with that obtained from
after about 25 s which is manifested by the drift in the traces. After about 60 s, the displacements on
Table 1. Large, shallow earthquakes near the coast of Oaxaca and south east Guerrero (95-99°W) since 1900.
Date Lat., °N Lon., °W Magnitude1 Segment
22/03/1928 15.67 96.102 7.510 East Oaxaca 17/06/1928 16.33 96.702 7.8 (Ms?) Central Oaxaca 04/08/1928 16.20 97.522 7.4 (Ms) West Oaxaca 09/10/1928 16.50 96.762 7.610 Cenyral Oaxaca 23/12/1937 16.79 98.633 7.510 Copala? 14/12/1950 16.81 98.823 7.310 Copala? 23/08/1965 16.28 96.024 7.55 East Oaxaca 02/08/1968 16.25 98.084 7.35 West Oaxaca 29/11/1978 16.03 96.675 7.75 Central Oaxaca 07/06/1982 16.35 98.376 7.011 Ometepec 07/06/1982 16.40 98.546 6.911 Ometepec 14/09/1995 16.48 98.767 7.312 Copala 25/02/1996 15.60 98.308 7.112 Offshore Pinotepa Nacional 20/03/2012 16.25 98.539 7.512 Ometepec-Pinotepa Nacional
1 Mw 2 Núñez-Cornú and Ponce (1989);; 3 Nishenko and Singh (1987);; 4 Quintanar (1985);; 5 Chael and Stewart (1982);; 6 Nava (1984);; 7 Courboulex et al. (1997);; 8 From local/regional data;; 9 This study (see Table 2);; 10 Anderson et al. (1989);; 11 Astiz and Kanamori (1984);; 12 Global CMT catalog (http://www.globalcmt.org).

GEOFÍSICA INTERNACIONAL
APRIL - JUNE 2013 177
NS, EW, and Z components from GPS data at PNIG are - 6.0, - 10.0, and - 5.0 cm (Figure 3b). For comparison, DeMets (personal communication, 2012) reports NS and EW coseismic static displacements at PNIG as - 8.8 and - 11.0 cm. We note that, for the SSN network, this is the first time that displacements retrieved from acceleration and from GPS data can be compared at the same site.
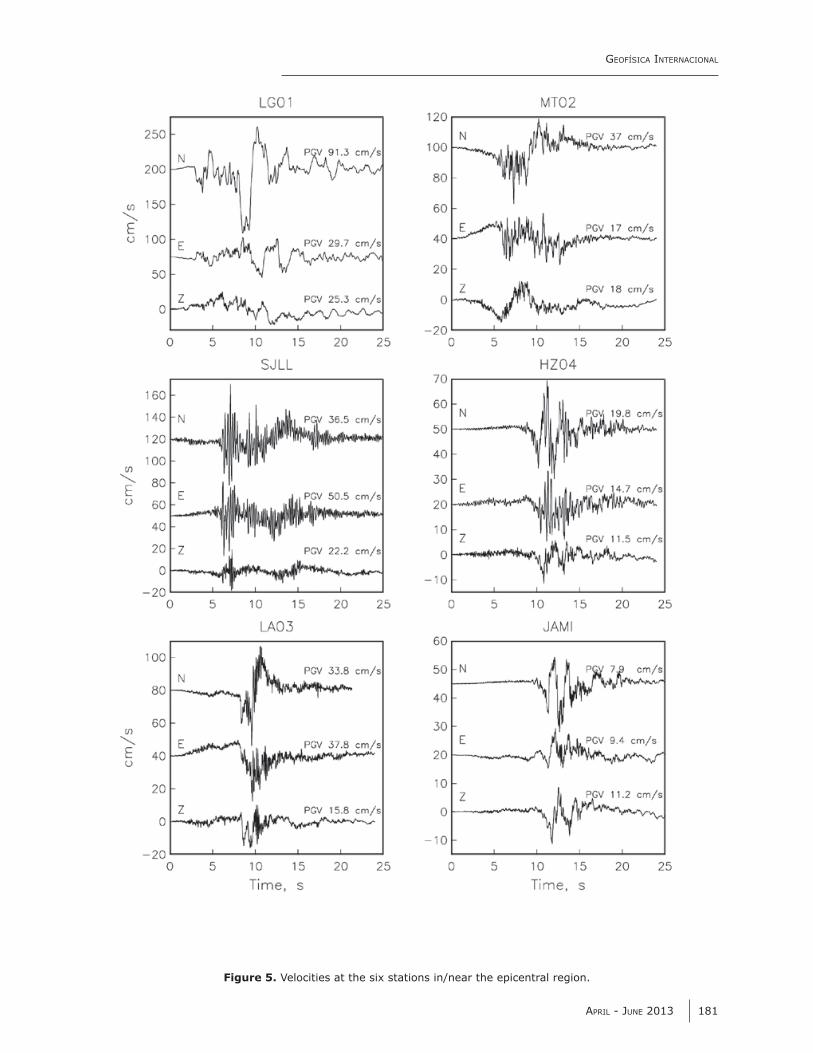
Acceleration and velocity time-histories at six other epicentral strong motion stations are illustrated in Figures 4 and 5, respectively. We note that PGA of ½ g was exceeded at two stations. At SJLL, the PGA on NS, EW, and Z components were 1070, 1070, and 1040 gal, respectively. This is the highest PGA ever recorded above Mexican subduction zone. High PGA at this station is clearly related to a site effect. An examination of the spectra shows a strong peak at 3.6 Hz. PGA at station LA03 reached 726 gal. Here again, the spectra are peaked at 6.5 Hz, suggesting a strong site effect. PGA, however, did not exceed
with previous observations along the Mexican subduction zone (Singh et al., 1989). A relatively low PGAsite. The highest PGV (91 cm/s) was observed at LG01.
Mainshock Location
Locating the mainshock presented the usual
at local distances. The SSN broadband network is
Figure 2. Black triangles: permanent seismic stations (equipped with accelerometers, except PNIG which is also instrumented with a broadband sensor and a GPS receiver). Inverted white tr iangles: portable seismic stations. Dots: autonomous GPS site. Stars: mainshock locations from local data (red) and from NEIC (green). The centroid location (blue star) and the associated focal mechanism are from GCMT.
relatively sparse. There were only 4 stations within a radius of 200 km of the epicenter. The broadband seismograms at PNIG and most other regional stations within a radius of ~300 km from the source were clipped on S wave. However, all SSN stations are equipped with accelerometers. We used accelerations (or velocities derived by simple integration) to read the S phase. We also used recordings from autonomous local and regional accelerographs [(S-P) time if absolute time was
S-wave reliably on local stations. P-wave at PNIG clearly showed that the rupture initiated SW of the station. In the location of the earthquake, the azimuth of the hypocenter from PNIG (250°) was
as it is the typical depth of plate interface below
Iglesias et al. (2001), was used in the location of the mainshock and the aftershocks. The model consisted of three layers over a half space: layer 1, thickness = 5.2 km, Vs = 3.45 km/s, density = 2.68 gm/cm3;; layer 2, thickness = 10.5 km, Vs = 3.50 km/s, density = 2.70 gm/cm3;; layer 3, thickness = 5.2 km, Vs = 3.45 km/s, density = 2.84 gm/cm3;; half space, Vs = 4.45 km/s, density = 3.23 gm/cm3. A Poisson solid was assumed to estimated Vp. Seismograms were converted to SeisAn format (Havskov and Ottemöller, 1999) and earthquakes were located using an algorithm by Lienert and Havskov (1995).
The locations of the mainshock obtained in this study and the one reported by NEIC, U.S. Geological Survey are listed in Table 2 and shown

Universidad Nacional Autónoma de México Seismology Group
178 VOLUME 52 NUMBER 2
in Figure 2. The table also lists CMT solutions, including centroid depth, reported by several sources. We note that the NEIC location is 58 km to N40°E of the location from local/regional data.
Location of Aftershocks
We obtained preliminary epicenter locations of
hours by reading azimuth and P and S times
crustal model mentioned above was used in the location. The epicenters of the events are shown in Figure 6. As mentioned earlier, a network of seven portable digital seismographs was deployed in
about 30 hours after the mainshock. We located 1235 aftershocks which occurred during the next four days using data from 4 to 7 stations. These are shown in Figure 6. To check the accuracy of the epicenters of the early aftershocks based on PNIG only, we selected the largest 50 events which were recorded by the portable network and compared the locations with those determined from PNIG alone. The difference in the epicentral locations is about 10 km on average. The four-day aftershocks (beginning 30 hours after the origin
about 40 km × 60 km, indicating expansion with time. Several clusters of aftershocks are visible in Figure 6. A lineament of aftershocks, oriented ~N45°E, occurs near PNIG. These clusters and the lineament may be related to bathymetric features on the subducted Cocos plate. We note, however, that they do not coincide with the subducted seamount chains.
Figure 6 shows the GCMT centroid epicenter and focal mechanism of the mainshock from the GCMT catalog. This location is near the north end of the aftershock area, perhaps related to the shift of the NEIC epicenter to north east of the epicenter estimated from the local and regional
focal mechanisms of all large aftershocks. The epicenters are from local and regional data while the focal mechanisms are from GCMT catalog. Most of these larger aftershocks are located at the edge of the aftershock area. The largest aftershock occurred on 2 April 2012 (H = 12 km;; Mw6.1). It has a normal-faulting focal mechanism and is located in the overriding plate. It may have been causally related to the mainshock through stress interaction. An earthquake of similar mechanism occurred about 20 km NW of Acapulco, along the coast, near the town of Coyuca, on 8 October 2001 (Mw5.8). These events suggest that in situ stress in the upper plate near the coast in these regions is extensional, probably a consequence of tectonic erosion or trench roll back (Pacheco and Singh, 2010).
Figure 3. (a) Accelerations, velocities, and displacements at PNIG. (b) Comparison of displacement obtained from double integration (continuous line) and GPS data (crosses) at station PNIG. Note that GPS data was lost from 10 s to 60 s after the arrival of the P wave.

GEOFÍSICA INTERNACIONAL
APRIL - JUNE 2013 179
Figure 3b.
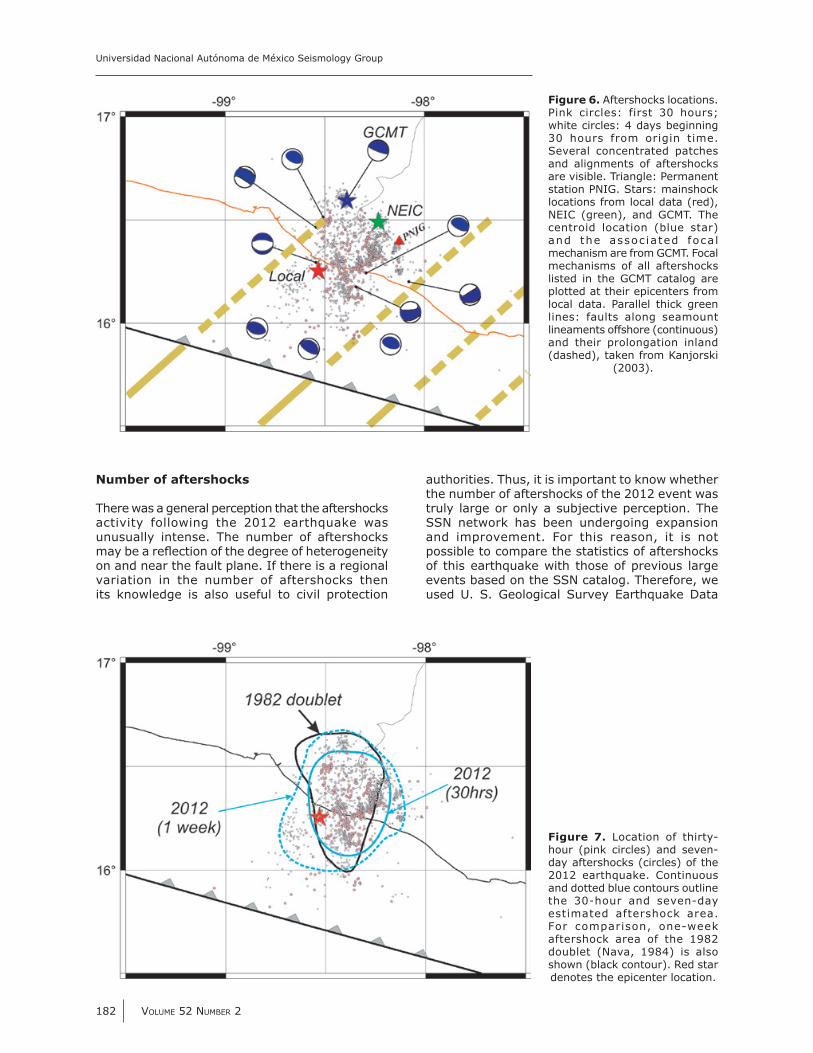
Figure 7 compares the aftershock areas of the 2012 earthquake estimated from 30-hour and seven-day activity, with that of seven-day aftershock area of the 1982 doublet (Nava, 1984). The areas roughly overlap. However, the sum of moments of the doublet (5.6×10¹⁹ Nm, Astiz and
Kanamori, 1984) is only about 1/2 to 1/3 of the moment of the 2012 earthquake (1.3×10²⁰ to 1.98×10²⁰ Nm). It is possible that the 2012 event broke an area which was larger than the doublet area but included it, suggesting a variable rupture mode (Kanamori and McNally, 1982).
Source Lat., °N Lon., °W H, km Strike, ° Dip, ° Rake, ° M0, Nm
Origin Time
This study 16.254 98.531 20* - - - -18:02:45.2Regional W-phase+ 16.252 98.342 19 287 15 83 1.3×10²⁰NEIC 16.662 98.188 20 - - - -18:02:48USGS, CMT 16.822 97.990 21 289 12 78 1.8×102018:03:14.00USGS, W-phase 16.462 97.874 15 283 13 71 1.4×10²⁰CMT, 18:02:48.00 Global CMT 16.60 98.39 15.4 296 10 95 1.98×102018:02:54.9
*
+ Based on an algorithm implemented at Instituto de Geofísica, UNAM, which uses regional waveforms recorded on -
tion.
Table 2. Some source parameters of the 20 March 2012, Ometepec-Pinotepa Nacional earthquake.

Universidad Nacional Autónoma de México Seismology Group
180 VOLUME 52 NUMBER 2
Figure 4. Accelerations at six other stations in/near the epicentral region.
GEOFÍSICA INTERNACIONAL
APRIL - JUNE 2013 181
Figure 5. Velocities at the six stations in/near the epicentral region.
Universidad Nacional Autónoma de México Seismology Group
182 VOLUME 52 NUMBER 2
authorities. Thus, it is important to know whether the number of aftershocks of the 2012 event was truly large or only a subjective perception. The SSN network has been undergoing expansion and improvement. For this reason, it is not possible to compare the statistics of aftershocks of this earthquake with those of previous large events based on the SSN catalog. Therefore, we used U. S. Geological Survey Earthquake Data
Number of aftershocks
There was a general perception that the aftershocks activity following the 2012 earthquake was unusually intense. The number of aftershocks
on and near the fault plane. If there is a regional variation in the number of aftershocks then its knowledge is also useful to civil protection
Figure 7. Location of thirty-hour (pink circles) and seven-day aftershocks (circles) of the 2012 earthquake. Continuous and dotted blue contours outline the 30-hour and seven-day estimated aftershock area. For comparison, one-week aftershock area of the 1982 doublet (Nava, 1984) is also shown (black contour). Red star denotes the epicenter location.
Figure 6. Aftershocks locations. Pink circles: first 30 hours;; white circles: 4 days beginning 30 hours from origin time. Several concentrated patches and alignments of aftershocks are visible. Triangle: Permanent station PNIG. Stars: mainshock locations from local data (red), NEIC (green), and GCMT. The centroid location (blue star) and the assoc iated foca l mechanism are from GCMT. Focal mechanisms of all aftershocks listed in the GCMT catalog are plotted at their epicenters from local data. Parallel thick green lines: faults along seamount lineaments offshore (continuous) and their prolongation inland (dashed), taken from Kanjorski
(2003).

GEOFÍSICA INTERNACIONAL
APRIL - JUNE 2013 183
Base (http://earthquake.usgs.gov/earthquakes/eqarchives/epic/epic_rect.php). For our analysis, we isolated aftershocks of all shallow, thrust events with Mw subduction zone, from Jalisco-Colima to Oaxaca, beginning 1963 when the World-Wide Standard Seismograph Network became operational. The database lists body-wave magnitude, mb, of small and moderate earthquakes and Ms or Mw for large earthquakes. For many, recent moderate earthquakes Mw rather than mb is listed. For each earthquake we extracted seismicity during the next 30 days in an area which was chosen to be somewhat larger than the expected rupture area. Table 3 gives N(mb), where N is the number of
mb. N is listed for mb = 4.5 and 5.0. The number includes the mainshock. Mw of moderate earthquakes is taken as mb. The catalog is probably complete for mb 5.0. Events 5 and 10 in Table 3 are doublets. For these events
the 30-day period was counted from the second shock. The seismic moments of the two shocks were added before computing Mw which is listed in the table.
Figure 8a shows the location of the mainshocks. The plot of N(mb Mw of the mainshock is illustrated in Figure 8b. To quantify the lack or access of aftershocks, we assume that N A, where A is the rupture area (Singh and Suárez, 1988). Since Mw (2/3)logM0 logA, it follows that if N A then logN Mw. N versus Mw data is
N = Mw + C. relation, shown in Figure 8b, serves to measure lack or excess of aftershocks for the earthquakes
and 5 (Colima-Jalisco 1995 and Michoacán 1985)
of aftershocks, while events 11 and 12 (Offshore Pinotepa 1996 and Ometepec-Pinotepa Nacional
Event Segment Date Lat., °N Depth, M0, M
w Observed N
No. (d/m/y) Lon., °W km 1020 Nm 30-day period)
mb
mb
1 Colima- 06/10/1995 18.8 15b 11.50b 8.0 15 5 Jalisco 104.5a 2 Tecomán, 22/01/2003 18.63 26b 2.05b 7.5 5 3 Colima 104.13c3 Colima 30/01/1973 18.39 31d 3.00d 7.6 4 3 103.21d4 Colima- 30/04/1986 18.25 21b 0.31b 6.9 5 1 Michoacán 102.92b 5 Michoacán 19/09/1985 18.14 17f 10.05f 8.1 15 5 102.71e 21/09/1985 17.62 22f 2.90f 101.82e 6 Playa Azul 25/10/1981 17.75 27f 0.70b 7.2 5 37 Petatlán 14/03/1979 17.46 20i 2.70i 7.6 12 6 101.46h8 San Marcos 25/04/1989 16.6 15b 0.24b 6.9 3 2 99.5j9 Copala 14/09/1995 17.0 22b 1.31b 7.3 9 2 99.0k10 Ometepec 07/06/1982 16.25 20m 0.29m 7.1 10 3 98.34l 07/06/1982 16.32 10-15m 0.27m 98.45l 11 Off-shore 25/02/1996 15.60 15b 0.55b 7.1 23 7 Pinotepa 98.30n 12 Ometepec- 20/03/2012 16.254 20n 1.98b 7.5 44 14 Pinotepa 98.531n 13 W. Oaxaca 02/08/1968 16.25 21i 1.00i 7.3 5 3 98.08o14 C. Oaxaca 29/11/1978 16.03 18i 3.2i 7.6 19 6 96.67p15 E. Oaxaca 23/08/1965 16.28 25i 1.7i 7.4 4 3 96.02o
a Pacheco et al. (1997);; b Global CMT catalog (http://www.globalcmt.org);; c Singh et al. (2003);; d Reyes et al. (1979);; e UNAM Seismology Group (1986);; f Astiz et al. (1987);; g Havskov et al. (1983);; h Valdés-González and Novelo (1998);; i Chael and Stewart (1982);; k Courboulex et al. (1997);; l Nava (1984);; m Astiz and Kanamori (1984);; n This study;; o Quintanar (1985);; p Singh et al. (1980).
Table 3. Number of aftershocks of large, shallow, thrust earthquakes along the Mexican subduction

Universidad Nacional Autónoma de México Seismology Group
184 VOLUME 52 NUMBER 2
2012) were the two most prolific ones. The relative abundance of aftershocks and simplicity of large earthquakes as seen in the region of the
heterogeneities at small scale but smooth fault plane at larger scale.
Slip on the Fault from Inversion of Teleseismic
Data
Immediately after the earthquake, teleseismic body and surface waves were inverted to map slip on the fault by groups at NEIC and Caltech (http://earthquake.usgs.gov/earthquakes/eqinthenews/2012/usc0008m6h/finite_fault.php;; http://www.tectonics.caltech.edu/slip_history/2012_Mexico/index.html). These inversions use the NEIC hypocenter (16.662°N, 98.188°W, H = 20 km;; Table 2). The results show a compact, nearly circular source whose dimension can be approximated by a square area of 35 km × 35 km. As a consequence of using the NEIC hypocenter, in these inversions the slip patch is located well inland, far north from
our epicenter. Here we use the same simulated annealing, wavelet domain algorithm used by NEIC (Ji et al., 2002a,b) to invert teleseismic body and surface waves for the slip on the fault plane. We use an expanded data set compared to the one used for the rapid solution by USGS: a total of 29 P-waves, 15 S-waves, 30 Rayleigh waves and 20 Love waves. We use the hypocenter determined in this study (Table 2). We invert for the magnitude, direction and duration of slip at each subpatch of the fault. The slip-rate function of each fault is parameterized by an asymmetric cosine function (Ji et al., 2002a). The timing of the initial slip is constrained to follow a rupture velocity of 3 km/s. First the body-wave arrivals were aligned on theoretical travel times based on a 1D Earth model. However, we found large apparent time shifts between observed and calculated seismograms, caused by the 3D structure of the Earth. The systematic variation of these shifts with azimuth is probably also responsible for the large mislocation of the hypocenter by global agencies, mentioned above. To minimize the effect of unmodeled 3D
Figure 8. (a) Location of large shallow thrust earthquakes along the Mexican subduction zone whose one-month aftershocks (mb
numbers are keyed to event number in Table 3. (Right) N(mb > 5) versus Mw. The excess
with respect to the straight line logN = Mw - 6.84 (see text). Note that events 12 (2012, Mw7.5) and 11 (1996, Mw7.1) produced the two most and events 1 (1995, Mw8.0) and 5 (1985, Mw7.6) generated the least amount of
aftershocks.

GEOFÍSICA INTERNACIONAL
APRIL - JUNE 2013 185
Figure 9. Inversion of slip on the fault using (top) teleseismic body- and surface-wave displacements,
displacements (see text). Star: mainshock epicenter from local data. Black dots: 30-hour aftershocks. Note that both models indicate that little slip occurred near the hypocenter and the aftershock activity was relatively low near areas of large slip. Arrows show observed and predicted coseismic horizontal
displacement vectors
structure on the result, we manually aligned the
in the seismogram. At stations where we could
to be consistent with neighboring stations. The
at many stations. Furthermore, comparing the teleseismic waveforms to the ones observed locally we found that the initial weak rupture (see more detail in the following section) was not seen in any of the teleseismic records. To account for this small initial slip near the hypocenter, we shifted all the traces by two seconds. The distribution of slip on the fault plane determined by the inversion is shown in Figure 9a. There are two separate regions of slip, both to the East of the hypocenter, one updip and the other one downdip. Each area of slip is about 30 km in diameter and a maximum slip of almost 2 m. It should be emphasized that this is a preliminary solution and that the pattern depends critically on the alignment of the body waves. The solutions we obtained using unaligned seismograms, as well as aligned but not shifted by a constant, have one patch of slip to the north of the hypocenter, similar to the solutions of the groups at NEIC and Caltech. The shift of two seconds is what allows the rupture to get further from the hypocenter before the large slip occurs, in effect allowing two different slip patches. Allowing a much smaller rupture velocity at the beginning could alter this result. However, we note that the two-patch slip model predicts static displacements that are in better agreement with those observed at nearby GPS stations than the one patch model and it is also in better agreement with the slip model obtained from regional data (following section).
Slip on the Fault from Inversion of Near-
Source Data
displacement traces to map the slip on the fault. Because the times at some accelerographs were incorrect, we corrected them using the computed expected P arrival times. The accelerograms were baseline corrected, integrated to obtain velocities,
Hz). These traces were integrated to obtain the displacements. The data at station HZ04 were ignored since the traces at nearby JAMI station (Figure 2) were of much better quality. From a visual inspection of the integrated traces and preliminary results of the inversion, we rejected the vertical displacement seismograms for LG01, SJLL, and LA03 stations (dashed lines in Figure 10).
to a 90 km × 90 km area (Figure 7) which has an azimuth = 295°, dip = 13°, and rake = 91°, in rough accordance with the GCMT solution. This area was divided in 18 × 18 subfaults. The

Universidad Nacional Autónoma de México Seismology Group
186 VOLUME 52 NUMBER 2
depth of the fault at the hypocenter (16.254°N, 98.531°W) was 20 km. The inversion was performed in the frequency domain (Cotton and Campillo, 1995) using a simulated annealing inversion scheme (Iglesias et al., 2002). The displacement spectrum, ui( ), at the ith station can be written as
u s e g F Ri ki t
ki k kk
nk! ! !!( ) = ( ) [ ]"
=# ,
1, (1)
where n is the number of subfaults;; tk, the rupture time (time elapsed from origin time to the initial rupture for each subfault);; Sk, the average displacement for kth subfault;; gki( ), the displacement transfer function for unitary slip in the kth subfault recorded at the ith station;; and Fk [Rk, ], the source time function depending on rise time Rk. Following Hernandez et al. (2001), we chose
F R RRk k
k
k,
sinh! "
"![ ] = #$%
&'(4 4. (2)
We attempted to invert for Rk. However, after several tests we found that Rk could not be Rk = 1.7 s.
Synthetic seismograms for each subfatult to each station were computed using discrete wave number algorithm (Bouchon, 1982). The crustal model used in the inversion is given above. We took Qs = 350 and Qp = 600.
The differences between observed and synthetic spectra (real and imaginary parts) were minimized at all the discrete frequencies between 0.025 and 1.0 Hz. Each subfault was composed of 49 source points whose rupture was delayed in time by assuming a constant rupture velocity (Vr = 3.0 km/s). The details of the method are given in Hernandez et al. (2001) and Iglesias et al. (2002).
The result of the inversion is shown in Figure 9b and the observed and synthetic waveforms are
inversion yields a seismic moment of 1.1×10²⁰ Nm (Mw7.3). The observed coseismic static
Figure 10. Observed displacement seismograms used in the near-source inversion (red lines) and the corresponding synthetics ( g r a y l i n e s ) . S om e components were neglected in the inversion because of their poor quality (dashed
red lines).
GEOFÍSICA INTERNACIONAL
APRIL - JUNE 2013 187
displacements at PINO (the same station as PNIG), OXTP, and MRQL (Figure 2) were not used in the inversion. Thus, it is reassuring that the predicted static horizontal displacements at these stations, corresponding to the inverted slip, agree well with the observations (Figure 9b).
The inversion shows small slip near the hypocenter. Large slip occurs on two patches: one patch is located updip from the hypocenter towards the south-east while the other one is
(1500 km2). The static stress drop, , during the earthquake can be estimated from the relation = (1/2) (7 3/2/16) (M0/A3/2) where A is the fault area (Eshelby, 1957). With M0 =1.98×10²⁰ Nm and A = 1500 km2, we obtain = 4.3 MPa.
Back-projection source imaging using teleseismic P waves recorded at USArray in northeast USA shows a dominant westward rupture propagation (L. Meng and J. P. Ampuero, personal communication, 2012). This network, however, has no resolution to detect along dip
dominant direction of rupture (Figure 9).
From Figure 9b we note that the aftershock activity is relatively low in areas of large slip. Do the two patches correspond to the individual events of the 1982 doublet? Comparison of the doublet epicenters (Figure 1) with the two patches (Figure 9b) does not support this. However, the errors in the locations of the 1982 doublet are
Radiated Seismic Energy
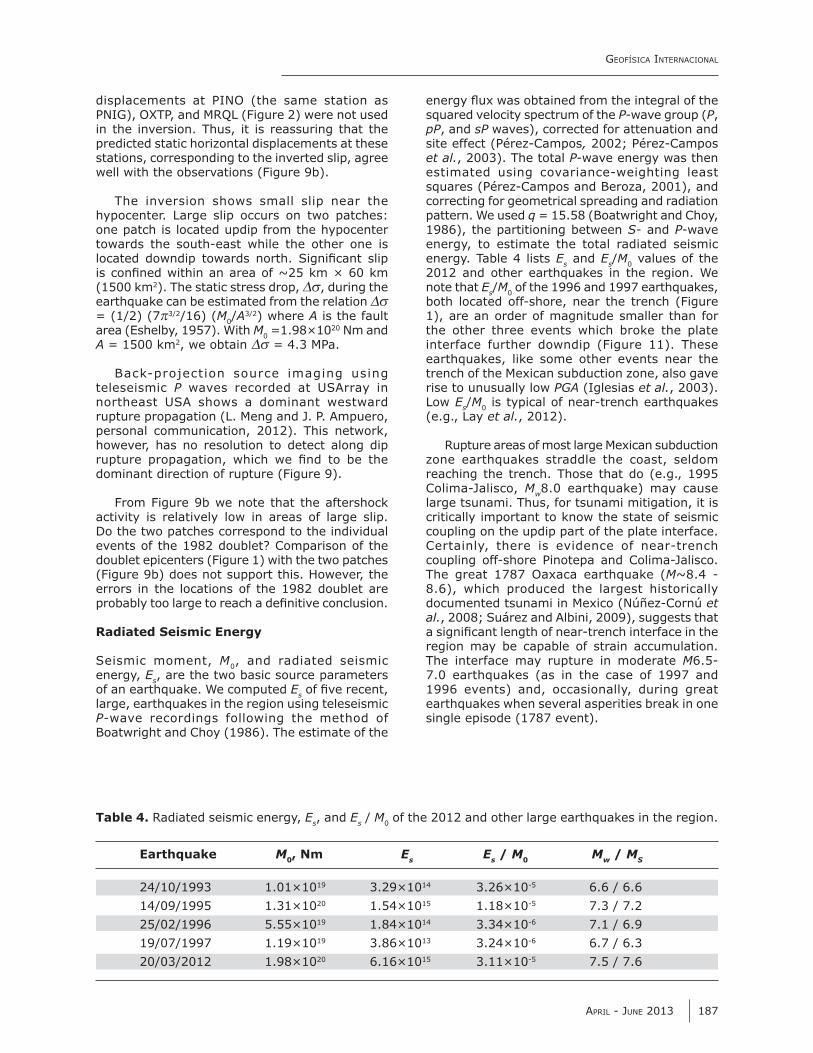
Seismic moment, M0, and radiated seismic energy, Es, are the two basic source parameters of an earthquake. We computed Eslarge, earthquakes in the region using teleseismic P-wave recordings following the method of Boatwright and Choy (1986). The estimate of the
squared velocity spectrum of the P-wave group (P, pP, and sP waves), corrected for attenuation and site effect (Pérez-Campos, 2002;; Pérez-Campos et al., 2003). The total P-wave energy was then estimated using covariance-weighting least squares (Pérez-Campos and Beroza, 2001), and correcting for geometrical spreading and radiation pattern. We used q = 15.58 (Boatwright and Choy, 1986), the partitioning between S- and P-wave energy, to estimate the total radiated seismic energy. Table 4 lists Es and Es/M0 values of the 2012 and other earthquakes in the region. We note that Es/M0 of the 1996 and 1997 earthquakes, both located off-shore, near the trench (Figure 1), are an order of magnitude smaller than for the other three events which broke the plate interface further downdip (Figure 11). These earthquakes, like some other events near the trench of the Mexican subduction zone, also gave rise to unusually low PGA (Iglesias et al., 2003). Low Es/M0 is typical of near-trench earthquakes (e.g., Lay et al., 2012).
Rupture areas of most large Mexican subduction zone earthquakes straddle the coast, seldom reaching the trench. Those that do (e.g., 1995 Colima-Jalisco, Mw8.0 earthquake) may cause large tsunami. Thus, for tsunami mitigation, it is critically important to know the state of seismic coupling on the updip part of the plate interface. Certainly, there is evidence of near-trench coupling off-shore Pinotepa and Colima-Jalisco. The great 1787 Oaxaca earthquake (M~8.4 - 8.6), which produced the largest historically documented tsunami in Mexico (Núñez-Cornú et al., 2008;; Suárez and Albini, 2009), suggests that
region may be capable of strain accumulation. The interface may rupture in moderate M6.5-7.0 earthquakes (as in the case of 1997 and 1996 events) and, occasionally, during great earthquakes when several asperities break in one single episode (1787 event).
Earthquake M0, Nm E
s E
s / M
0 M
w / M
S
24/10/1993 1.01×10¹⁹ 3.29×10¹⁴ 3.26×10⁻⁵ 6.6 / 6.6 14/09/1995 1.31×10²⁰ 1.54×10¹⁵ 1.18×10⁻⁵ 7.3 / 7.2 25/02/1996 5.55×10¹⁹ 1.84×10¹⁴ 3.34×10⁻⁶ 7.1 / 6.9 19/07/1997 1.19×10¹⁹ 3.86×10¹³ 3.24×10⁻⁶ 6.7 / 6.3 20/03/2012 1.98×10²⁰ 6.16×10¹⁵ 3.11×10⁻⁵ 7.5 / 7.6
Table 4. Radiated seismic energy, Es, and Es / M0 of the 2012 and other large earthquakes in the region.

Universidad Nacional Autónoma de México Seismology Group
188 VOLUME 52 NUMBER 2
Observed and Predicted Ground Motions in
Mexico
Prediction of ground motions from future earthquakes is critically important in seismic
in Mexico date back to 1962, it was not until 1985 that a modern accelerographic network, called the Guerrero Accelerograph Array, became operational (Anderson et al., 1994). This network covered the coastal region of Guerrero and part of Michoacán. It also included a few stations inland and an attenuation line from the Guerrero coast to Mexico City. The 1985 Michoacán earthquake was well-recorded by this newly-installed network. Since 1985, strong-motion stations in Mexico have steadily increased in number. The data have been used to develop ground motion prediction equations (GMPE).
The recordings from the 2012 earthquake permit a check on the GMPE for interface earthquakes (Arroyo et al., 2010). Figure 12 shows plots of observed and predicted PGA at hard sites as a function of Rrup, the closest distance from the site to the rupture area. Here PGA = [(An2 + Ae2)/2]1/2 (An and Ae are the peak accelerations on NS and EW components, respectively). The predictions are reasonable for Rrup < 400 km, beyond which they underestimate the observations. This is expected since only data at distances of Rrup < 400 km were used by Arroyo et al. (2010) in the regression analysis. In any case, ground motions at such large distances are of little importance in earthquake engineering.
Figure 13 shows PGA contours in Mexico for the 2012 earthquake. These contours were obtained from recorded data (shown by triangles) using a Bayesian interpolation technique. We note that the maximum contour roughly coincides with the maximum slip on the fault (Figure 9). Figure 13 also shows municipalities where significant structural damage was observed. These municipalities received federal funds for recovery and reconstruction of the affected population (http://dof.gob.mx/nota_detalle.php?codigo=5241891&fecha=03/04/2012;; http://dof.gob.mx/nota_detalle.php?codigo=5241892&fecha=03/04/2012).
Ground Motion in Mexico City
The 2012 earthquake was strongly felt in Mexico City. Initially it was thought that the city had survived well the onslaught of the largest earthquake since 1985. Figure 14 compares accelerograms and Fourier spectra of the 2012 (Mw7.5) and the 1995 Copala (Mw7.3) earthquakes at CU, a hill-zone site in city. Figure 15 illustrates the corresponding plots at SCT, a site in the lake-bed zone. The distance from the two sources to Mexico City is roughly equal. The PGAs during the two earthquakes at each of these sites are nearly the same (Tables 5 and 6). The same is true for Fourier amplitude spectra at frequencies greater than about 1 Hz. At lower frequencies, the Fourier amplitudes of the 2012 earthquake are somewhat greater than of the 1995 event, in agreement with their relative moment magnitudes.
Figure 11. Es/M0 versus M0 plot of shallow, thrust earthquakes along the Mexican subduction zone. Earthquakes of the region
dates. Es has been estimated from teleseismic P waves.

GEOFÍSICA INTERNACIONAL
APRIL - JUNE 2013 189
Figure 12. Observed (circles) and predicted (red lines) PGA values for 14, 50 and 84 percentiles versus Rrup, the closest point on the rupture surface. Predictions
are from Arroyo et al. (2010).
Figure 13. PGA contours. Star: center of maximum slip (Figure 9). Triangles: location of accelerographic stations on hard sites. Open circles: municipalities where significant structural damage was observed.

Universidad Nacional Autónoma de México Seismology Group
190 VOLUME 52 NUMBER 2
Figure 14. Comparison of accelerograms and Fourier spectra of the 2012 Ometepec-Pinotepa Nacional (Mw7.5) and the 1995 Copala (Mw7.3) earthquakes at CU, a typical
hill-zone site.
Figure 15. Same as Figure 13 but at SCT, a site in the
lake-bed zone.

GEOFÍSICA INTERNACIONAL
APRIL - JUNE 2013 191
Ten earthquakes which have produced largest PGA at CU since 1985 are listed in Table 5. PGA
largest in the table. Annual exceedance rate of 10 gal is about 0.3. We note that eight out of the 10 events gave rise to roughly similar PGA, between 8 and 14 gal. Thus, the 2012 earthquake was not exceptional in terms of PGA. Note that the PGA at CU during the 1985 earthquake was 30 gal, two and half times greater than during the 2012 event.
Table 6 is similar to Table 5 but for SCT. PGA at SCT during the 2012 earthquake was 34 gal, which is the third largest in the table. Annual exceedance rate of 20 gal at this site is about
PGA at SCT was between 29 and 39 gal. Again, the PGA at SCT during the 2012 earthquake was not exceptionally large (roughly four times less than during 1985 earthquake).
A Possible Interpretation
The 2012 Ometepec-Pinotepa Nacional earthquake may be understood as a single event in a stochastic process:
Stress accumulation Quiescence EARTH-QUAKE Stress drop Regional deformationAftershock sequence Stress accumulationQu i e s c e n c e EARTHQUAKE S t r e s s drop Regional deformation Aftershock sequence …
where time runs from left to right, and the embedded process of stress accumulation shifts its localization at random (Castaños et al., 2013). Causality appears to require a different process which, however, never happens:
Date Lat., °N Lon., °W H, km Mw R to CU, km PGA, gal Type#
19/09/1985 18.14 102.71 22 8.0 395 29.8 T 11/12/2011 17.82 99.94 57 6.4 194 19.2 IS 21/09/1985 17.62 101.82 22 7.5 338 13.9 T 21/07/2000 18.11 98.97 50 5.8 146 12.8 IS 20/03/2012 16.25 98.53 20 7.5 317 12.0 T 25/04/1989 16.58 99.48 17 6.9 307 11.9 T 15/06/1999 18.13 97.54 60 6.9 226 11.6 IS 14/09/1995 16.73 98.54 22 7.3 297 10.3 T 22/05/2009 18.10 98.43 46 5.8 160 8.6 IS 30/09/1999 16.03 96.96 40 7.4 437 7.8 IS
# T: Shallow subduction thrust earthquake IS: Intraslab earthquake
Date Lat., °N Lon., °W H, km Mw R to CU, km PGA, gal Type#
19/09/1985 18.14 102.71 22 8.0 395 132.1 T 25/04/1989 16.58 99.48 17 6.9 307 38.8 T 20/03/2012 16.25 98.53 20 7.5 317 34.2 T 15/06/1999 18.13 97.54 60 6.9 226 30.0 IS 14/09/1995 16.73 98.54 22 7.3 297 29.5 T 30/09/1999 16.03 96.96 40 7.4 437 28.9 IS 11/12/2011 17.82 99.94 57 6.4 194 20.8 IS 22/01/2003 18.63 104.13 10 7.4 537 19.8 T 21/07/2000 18.11 98.97 50 5.9 136 18.8 IS 10/12/1994 17.98 101.52 49 6.4 288 13.4 IS
# T: Shallow subduction thrust earthquake IS: Intraslab earthquake
Table 5. Ten earthquakes with largest recorded PGA at CU, a site in the hill zone of Mexico City, during the period 1985-2012 listed in descending order. Local earthquakes are excluded.
Table 6. Ten earthquakes with largest recorded PGA at SCT, a site in the lake-bed zone of Mexico City, during the period 1985-2012 listed in descending order. Local earthquakes are excluded.

Universidad Nacional Autónoma de México Seismology Group
192 VOLUME 52 NUMBER 2
S t r e s s a c c umu l a t i o n Fo r e s h o c k sequence EARTHQUAKE Stress drop Regional d e f o rm a t i o n Q u i e s c e n c e S t r e s s a c c umu l a t i o n F o r e s h o c k s e q u e n -ce EARTHQUAKE Stress drop Regional deformation Quiescence …
In other words, if all earthquakes are caused by precursory stress accumulation the current logic requires that the seismicity in the region should increase before the main shock, not afterwards. The reason is the Coulomb failure criterion
tan + c,
where the stress on the fault builds up gradually with time while the shear strength remains constant. Here tan friction and c is the cohesion. The hypothesis of stress buildup before earthquakes remains a fundamental feature of earthquake theory.
But the Coulomb failure criterion admits two symmetrically opposite interpretations: (1) the regional stress increases in time until it matches or exceeds the constant strength of the fault, or (2) the shear strength of the fault decays in time until it is overcome by the stationary regional stress . Symmetry with respect to time translation yields conservation of energy, as predicted by a famous theorem of Noether (1918): “Every differentiable symmetry in a physical system must be associated with a conserved quantity”.
The Cocos plate subducts the North America plate at a relative convergence rate of 6 cm/yr in the N34°E direction (DeMets et al., 1990). The stochastic process described above is merely a random discretization of the steady-state subduction process. The physics of this
of stress will be consistent with the Second Law of Thermodynamics: “Earth system processes perform work by degrading sources of free energy, thereby producing entropy” (Kleidon and Lorenz,
its second interpretation, i.e., the shear strength of the fault decays in time until it is overcome by the stationary regional stress .
strength on the subduction zone? The answer has to do with the ubiquitous process of stress corrosion in the presence of water. In the active Guerrero subduction zone segmentation is closely related to water content (Husker and Davis, 2009). After a major earthquake the rupture heals at a roughly constant rate with a half-life of 20 years (Castaños et al., 2013). Aftershocks are related to the healing process, so that the
aftershock region is about the same as the rupture region which has not yet healed.
Summary and Conclusions
The 2012 Ometepec-Pinotepa Nacional nucleated about 5 km offshore, near the border between the states of Guerrero and Oaxaca, at a depth of about 20 km. The epicenter reported by NEIC is 58 km toward N40°E. This large difference in the location is partly due to weak beginning of the earthquake so that P phase read at local and regional distances may not correspond to that read at teleseismic distances. In addition, there are such factors as teleseismic station distribution and the velocity structure of the subduction zone which cause a systematic bias of the NEIC epicenters of Mexican earthquakes to be shifted towards the NE (see, e.g., Singh and Lermo, 1985).
As a consequence of the mislocation mentioned above, the area of slip distribution mapped from inversion of teleseismic waves by different groups is also shifted to the NE with respect with the one mapped from our inversion of local displacement seismograms. Our preliminary inversion of teleseismic data, using the hypocenter reported here and time shifting discussed above, agrees well with the inversion of the local data. The inversion of local data reveals two patches of large slip, one updip towards SW of the hypocenter and the other downdip to the N. The slip is small near
This seems to suggest that the earthquake nucleated in an area of low strength and little strain accumulation. The rupture then broke two
km updip and 35 km downdip from the coast, and for a length of about 25 km along the strike. This
Our slip area roughly coincides with the 30-hour aftershock area. We note that there is relative lack of aftershocks near the hypocenter where the slip is small, as well as in the areas of large slip. This is a pattern reported for many earthquakes (see Das and Henry, 2003 for a review). The aftershocks of the 2012 earthquakes cluster in several patches;; in addition a large number of them are aligned in the northeast direction towards the station PNIG. This may be related to heterogeneities on the plate interface related to the subducting bathymetric features. The earthquake produced unusually large number of aftershocks, suggesting more heterogeneous interface on this segment than others along the Mexican subduction zone west of 95°W. We note, however, that neither the NE alignment of the aftershocks nor the two patches of large slip coincide with the prolongation of the sea mounts inland.

GEOFÍSICA INTERNACIONAL
APRIL - JUNE 2013 193
Although the aftershock areas of 2012 and 1982 doublet roughly overlap, the sum of the seismic moments of the doublet is only about 1/3 that of the 2012 earthquake. Thus, the two events are not a repeat of each other. The 2012 event may have ruptured the doublet fault area plus an additional area, suggesting a variable rupture mode.
The region is an excellent laboratory to study different seismic phenomena related to the subduction process. As sketched in Figure 16, the plate interface can be divided in three domains based on their seismic characteristics. This division is similar to the conceptual model proposed by Lay et al. (2012). Moderate to large thrust earthquakes (M ~ 6-7), accompanied by large number of aftershocks, occur on the upper-most “slow earthquake” domain. This domain extends from the trench up to a downdip distance
are characterized by low radiated energy to seismic moment ratio, Es/M0. They also give rise to very low accelerations. A part of the area in this domain may either be creeping (stable sliding) or may be partially locked. The next domain covers a distance range of 35 to 100 km from the trench and depth range of 15-25 km. It is seismically coupled and ruptures in large earthquakes (M ~7-7.5). A fraction of the area is conditionally stable and slips during large events. The domain further downdip, in the distance range of 100 to 200 km from the trench, is very likely the site of slow seismic events (SSEs) and nonvolcanic tremors (NVTs). SSEs and NVTs have been reported in the instrumented adjacent areas of Guerrero to the northwest (e.g., Kostoglodov et al., 2003, 2010;; Payero et al., 2008) and central Oaxaca to the southeast (Brudzinski et al., 2007, 2010). These phenomena have not yet been documented
in Ometepec-Pinotepa Nacional region which presently lacks adequate instrumentation.
It is possible that the 2012 earthquake was triggered by the SSE which occurred in the adjacent southeast region during late 2011 and mid-2012 (Graham et al., 2012). At present the details of temporal and spatial evolution of the SSE is not available. We note, however, that the earthquake nucleated offshore, probably more than 75 km updip from the region of SSE. Furthermore, one of the patches of large slip was updip from the hypocenter. To establish a causal relation between the two events, these observations would have to be satisfactorily explained.
which the PGA exceeded 1 g above the Mexican subduction zone. It was, however, at a soft site. From a seismic engineering point of view, it is reassuring that the observed PGA as function of distance is well-explained by ground motion prediction equation derived from Mexican data. The earthquake was strongly felt in Mexico City. The PGA at CU, a typical hill-zone site, and at SCT, a representative lake-bed zone site, was 12 and 20 gal, respectively. These PGAs were not unusually large;; they occur once in about 3 years.
Acknowledgments
UNAM Seismology Group includes all researchers and technicians, as well as students, of Institute of Geophysics and Institute of Engineering,
earthquake in Mexico, the Group informally coordinates its efforts in data collection from autonomous stations, field deployment of seismographs and accelerographs, analysis of the
Figure 16. A schematic section along line AB in Figure 1. The plate interface is divided in three domains. Green line: upper most domain which extends up to 35 km from the trench (depth range 5-15 km). Earthquakes (M ~6-7) in this domain have low (Es/M0), give rise to low PGA, and generate many aftershocks. This domain is marked “slow
M ~7-7.5) occur (marked
of slow slip events (SSE) and nonvolcanic tremor (NVT). Extends from 100 to 200 km from the trench (depth >25 km).

Universidad Nacional Autónoma de México Seismology Group
194 VOLUME 52 NUMBER 2
data, and elaboration of a preliminary report. The credit of the work is shared by all.
We thank Civil Protection authorities of the State of Oaxaca, Centro de Instrumentación y Registros Sísmicos (CIRES) and Centro Nacional de Prevención de Desastres (CENAPRED) for making available to us the recordings of the mainshock. We are indebted to H. Kanamori for sharing his unpublished results with us and for many fruitful discussions on the 2012 earthquake during his visit to UNAM in August 2012. We appreciate comments and suggestions by H. Kanamori, L. Astiz, R. Castro and C. Mendoza who were reviewers of the manuscript. The research was supported by Conacyt project 82599, and PAPIIT-UNAM projects IN112411 and IN111411-2.
Bibliography
Anderson J.G., Brune J.N., Prince J., Quaas R., Singh S.K., Almora D., Bodin P., Oñate M., Vásquez R., Velasco J.M., 1994, The Guerrero accelerograph network. Geofísica Internacional, 33, 341-372.
Anderson J.G., Singh S.K., Espíndola J.M., Yamamoto J., 1989, Seismic strain release in the Mexican subduction thrust. Phys. Earth Planet. Inter., 58, 307-322.
Arroyo D., García D., Ordaz M., Mora M.A., Singh S.K., 2010, Strong ground-motion relations for Mexican interplate earthquakes. J. Seismol., Doi 10.1007/s10950-010-9200-0.
Astiz L., Kanamori H., 1984, An earthquake doublet in Ometepec, Guerrero, Mexico. Phys. Earth Planet. Inter., 34, 24-45.
Astiz L., Kanamori H., Eissler H., 1987, Source characteristics of earthquakes in the Michoacan seismic gap in Mexico. Bull. Seismol. Soc. Am., 77, 1326-1346.
Boatwright J., Choy G.L., 1986, Teleseismic estimates of the energy radiated by shallow earthquakes. J. Geophys. Res., 91, 2095-2112.
Bouchon M., 1982, The complete synthetics of crustal seismic phases at regional distances. J. Geophys. Res., 87, 1735-1741.
Brudzinski M.R., Cabral-Cano E., Correa-Mora F., DeMets C., Márquez-Azúa B., 2007, Slow slip transients along the Oaxaca subduction segment from 1993 to 2007. Geophys. J. Int., 171, 523-538, DOI:10.1111/j.1365-246X.2007.03542.x.
Brudzinski M.R., Hinojosa-Prieto H.R., Schlanser K.M., Cabral-Cano E., Arciniega-Ceballos A.,
Diaz-Molina O., DeMets C., 2010, Nonvolcanic tremor along the Oaxaca segment of the Middle America subduction zone. J. Geophys. Res., 115, B00A23, doi:10.1029/2008JB006061.
Castaños H., Joshi A., Lomnitz C., Zhang C.-J., 2013, Famous failures: A natural history of disaster, in Extreme Events, AGU Monographs, in press.
Chael E.P., Stewart G.S., 1982, Recent large earthquakes along the middle American trench and their implications for the subduction process. J. Geophys. Res., 87, 329-338.
Cotton F., Campillo M., 1995, Inversion of strong ground motion in the frequency domain: application to the 1992 Landers, California earthquake. J. Geophys. Res., 100, 3961-3975.
Courboulex F., Singh S.K., Pacheco J.F., Ammon C., 1997, The 1995 Colima-Jalisco, Mexico, earthquake (Mw 8): A study of the rupture process. Geophys. Res. Lett., 34, 1019-1022.
Das S., Henry C., 2003, Spatial relation between main earthquake slip and its aftershock distribution. Rev. Geophys., 3-1 - 3-23, doi: 10.1029/2003RG000119.
DeMets C., Gordon R.G., Argus D.F., Stein S., 1990, Current plate motions, Geophys. J. Int., 101, 427-478.
Eshelby J.D., 1957, The determination of the
related problems. Proceedings of the Royal Society of London, Series A, 241, 376-396.
Graham S., Cabral Cano E., Kostoglodov V., Cotte N., Radiguet M., Walpersdorf A., Santiago J.A., Brudzinski M., McCaffrey R., DeMets C., 2012, Animations and modeling of the 2012 slow slip event beneath southern Mexico and the accompanying 20 March 2012 Mw=7.4 Ome-tepec earthquake. UGM Reunión anual 2012;; GEOS, Unión Geofísica Mexicana, 32, 263.
Gregorius T., 1996, Gipsy–OASIS II How it works, manual for class of GIPSY. Jet Propulsion Laboratory, California Institute of Technology, Pasadena, EUA.
Havskov J., Ottemöller L., 1999, Electronic Seismologist: SeisAn earthquake analysis software. Seism. Res. Lett., 70, 532-534.
Havskov J., Singh S.K., Nava E., Dominguez T., Rodriguez M., 1983, Playa Azul, Michoacan, Mexico, earthquake of 25 October 1981 (Ms = 7.3). Bull. Seismol. Soc. Am., 73, 449-457.

GEOFÍSICA INTERNACIONAL
APRIL - JUNE 2013 195
Hernandez B., Shapiro N., Singh S.K., Pacheco J., Cotton F., Campillo M., Iglesias A., Cruz V., Gómez J.M., Alcántara L., 2001, Rupture history of September 30, 1999 intraplate earthquake of Oaxaca, Mexico (Mw=7.5) from inversion of strong motion. Geophys. Res. Lett., 28, 363-366.
Husker A., Davis P.M., 2009, Tomography and thermal state of the Cocos plate subduction beneath Mexico City. J. Geophys. Res., 114, B04306 doi:10.1029/2008JB006039.
Iglesias A., Cruz-Atienza V.M., Shapiro N.M., Singh S.K., Pacheco J.F., 2001, Crustal structure of south-central Mexico estimated from the inversion of surface-wave dispersion curves using genetic and simulated annealing algorithms. Geofísica Internacional, 40, 181-190.
Iglesias A., Singh S.K., Pacheco J.F., Alcántara L., Ortiz M., Ordaz M., 2003, Near trench Mexican earthquakes have anomalously low peak accelerations. Bull. Seismol. Soc. Am., 93, 953-959.
Iglesias A., Singh S.K., Pacheco J.F., Ordaz M., 2002, A source and wave propagation study of the Copalillo, Mexico, earthquake of 21 July 2000 (Mw 5.9): Implications for seismic hazard in Mexico City from inslab earthquakes. Bull. Seismol. Soc. Am., 92, 1060-1071.
Ji C., Wald D.J., Helmberger D.V., 2002a, Source description of the 1999 Hector Mine, California, earthquake, Part I: Wavelet domain inversion theory and resolution analysis. Bull. Seismol. Soc. Am., 92, 1192-1207.
Ji C., Wald D.J., Helmberger D.V., 2002b, Source description of the 1999 Hector Mine, California, earthquake, Part II: Complexity of slip history. Bull. Seismol. Soc. Am., 92, 1208-1226.
Juárez García H., Gómez Bernal A., Rangel Núñez J.L., Tena-Colunga A., Roldán Islas J., Pelcastre Pérez E., 2012, Learning from earthquakes: The March 20, 2012, Ometepec, Mexico earthquake. EERI Special Earthquake Report.
Kanamori H., McNally K.C., 1982, Variable rupture mode of the subduction zone along the Ecuador-Colombia coast. Bull. Seismol. Soc. Am., 72, 1241-1253.
Kanjorski N.M., 2003, Cocos plate structure along the middle America subduction zone
of subducting plate morphology on tectonics and seismicity. Ph. D. thesis University of California, San Diego.
Kleidon A., Lorenz R.D., 2005, Entropy production in Earth system processes, in Non-equilibrium Thermodynamics and the Production of Entropy, A. Kleidon and R.D. Lorenz, eds., Springer, New York.
Kostoglodov V., Husker A., Shapiro N.M., Payero J.S., Campillo M., Cotte N., Clayton R., 2010, The 2006 slow slip event and nonvolcanic tremor in the Mexican subduction zone. Geophys. Res. Lett., 37, doi: 10.1029/2010GL045424.
Kostoglodov V., Singh S.K., Santiago J.A., Larson K.M., Lowry A.R., Bilham R., 2003, A large silent earthquake in the Guerrero seismic gap, Mexico. Geophys. Res. Lett., 15, doi:10.1029/2003GL017219.
Lay T., Kanamori H., Ammon C.J., Koper K.D., Hutko A.R., Ye L., Yue H., Rushing T.M., 2012, Depth-varying rupture properties of subduction zone megathrust faults. J. Geophys. Res., 117, B4, doi:10.1029/2011JB009133.
Lienert B.R., Havskov J., 1995, A computer program for locating earthquakes both locally and globally. Seism. Res. Lett., 66, 26-36.
Nava E., 1984, Estudio de los temblores de Ometepec del 7 de junio de 1982, y sus replicas. Tesis Licenciatura (Ingeniero Geofísico), Facultad de Ingeniería, UNAM.
Nishenko S.P., Singh S.K., 1987, The Acapulco-Ometepec, Mexico, earthquakes of 1907-1982: Evidence for a variable recurrence history. Bull. Seismol. Soc. Am., 77, 1359-1367.
Noether E., 1918, Invariante Variationsprobleme, Nachr. König. Gesellsch.Wiss., Göttingen, Math-phys. Klasse, 235–257.
Núñez-Cornú F.J., Ortiz M., Sánchez Aguilar J.J., 2008, The great 1787 Mexican tsunami, Nat. Hazards, doi:10.1007/s11069-008-9239-1.
Núñez-Cornú F., Ponce L., 1989, Zonas sísmicas de Oaxaca, México: Sismos máximos y tiempos de recurrencia para el período 1542-1988. Geofísica lnternacional, 28, 587-641.
Pacheco J.F., Singh S.K., 2010, Seismicity and state of stress in Guerrero segment of the Mexican subduction zone. J. Geophys. Res., 115, B01303, doi:10.1029/2009JB006453.
Pacheco J.F., Singh S.K., Domínguez J., Hurtado A., Quintanar L., Jiménez Z., Yamamoto J., Gutiérrez C., Santoyo M., Bandy W., Guzmán M., Kostoglodov V., Reyes G., Ramírez C., 1997, The October 9, 1995 Colima-Jaslico,

Universidad Nacional Autónoma de México Seismology Group
196 VOLUME 52 NUMBER 2
Mexico earthquake (Mw 8): An aftershock study and a comparison of this earthquake with those of 1932. Geophys. Res. Lett., 24, 2223-2226.
Payero J.S., Kostoglodov V., Shapiro N., Mikumo T., Iglesias A., Pérez-Campos X., Clayton R.W., 2008, Nonvolcanic tremor observed in the Mexican subduction zone. Geophys. Res. Lett., 35, L07305, doi: 10.1029/2007GL032877.
Pérez-Campos X., 2002, A comprehensive study of the seismic energy. Ph. D. Thesis, Stanford University.
Pérez-Campos X., Beroza G.C., 2001, Mechanism dependent scaling of radiated seismic energy. J. Geophys. Res., 106, 11,127-11,136.
Pérez-Campos X., Singh S.K., Beroza G.C., 2003, Reconciling teleseismic and regional estimates of seismic energy, Bull. Seism. Soc. Am., 93, 2123-2130.
Quintanar L., 1985, Variaciones espacio–temporales de la sismicidad en la región costera de Oaxaca de 1950 a 1982 (mb 4.3). Master’s thesis, Facultad de Ciencias;; Universidad Nacional Autónoma de México, México D.F., México.
Reyes A., Brune J.N., Lomnitz C., 1979, Source mechanism and aftershock study of the Colima, Mexico earthquake of January 30, 1973. Bull. Seismol. Soc. Am., 69, 1819-1840.
Singh S.K., Havskov J., Astiz L., 1981, Seismic gaps and recurrence periods of large: A reexamination earthquakes along the Mexican subduction zone. Bull. Seismol. Soc. Am., 71, 827-843.
Singh S.K., Havskov J., McNally K., Ponce L., Hearn T., Vassiliou M., 1980, The Oaxaca, Mexico earthquake of 19 November, 1978: A preliminary report on aftershocks. Science, 207, 1211-1213.
Singh S.K., Lermo J., 1985, Mislocation of Mexican earthquakes as reported in international bulletins. Geofísica Internacional, 24, 333-351.
Singh S.K., Mortera F., 1991, Source-time functions of large Mexican subduction earthquakes, morphology of the Benioff age of the plate and their tectonic implication. J. Geophys. Res., 96, 21487-21502.
Singh S.K., Ordaz M., Rodríguez M., Quaas R., Mena E., Ottaviani M., Anderson J.G., Almora D., 1989, Analysis of near-source strong motion recordings along the Mexican subduction zone. Bull. Seismol. Soc. Am., 79, 1697-1717.
Singh S.K., Pacheco J.F., Alcántara L., Reyes G., Ordaz M., Iglesias A., Alcocer S.M., Gutierrez C., Valdés C., Kostoglodov V., Reyes C., Mikumo T., Quass R., Anderson J.G., 2003, A preliminary report on the Tecomán, Mexico earthquake of 22 January 2003 (Mw 7.4) and its effects. Seismol. Res. Lett., 74, 279-289.
Singh S.K., Rodríguez M., Esteva L., 1983, Statistics of small earthquakes and frequency of occurrence of large earthquakes along the Mexican subduction zone. Bull. Seismol. Soc. Am., 73, 1779-1796.
Singh S.K., Suárez G., 1988, Regional variation
7.0). Bull. Seismol. Soc. Am., 78, 230-242.
Suárez G., Albini P., 2009, Evidence for great tsunamigenic earthquakes (M 8.6) along the Mexican subduction zone. Bull. Seismol. Soc. Am., 99, 892–896.
UNAM Seismology Group, 1986, The September 19, 1985, Michoacan earthquake: Aftershock distribution and history of rupture. Geophys. Res. Lett., 13, 573-576.
Valdés-González C., Novelo-Casanova D.A., 1998, The Western Guerrero, Mexico, seismogenic zone from the microseismicity associated to the 1979 Petatlan and 1985 Zihuatanejo earthquakes. Tectonophysics, 287, 271-277.
Yamamoto J., Quintanar L., Jimenez Z., 2002, Why earthquake doublets in the Ometepec, Guerrero, Mexico subduction area? Phys. Earth Planet. Inter., 132, 131-139.
Yamamoto J., González-Moran T., Quintanar L., Zavaleta A.B., Zamora A., Espindola V.H., 2013, Seismic pattern of the Guerrero-Oaxaca, Mexico región, and its relationship to the continental margin structure. Geophys. J. Int., 192, 375-389, DOI:10.1093/gji/ggs025.