6 Million Lost Voters - sentencingproject.org Million Lost Voters: ... Alabama, Florida, Kentucky,...
20
6 Million Lost Voters: State-Level Estimates of Felony Disenfranchisement, 2016
Transcript of 6 Million Lost Voters - sentencingproject.org Million Lost Voters: ... Alabama, Florida, Kentucky,...

6 Million Lost Voters: State-Level Estimates of Felony
Disenfranchisement, 2016
This report was written by Christopher Uggen, Regents Professor of Sociology at the University of Minnesota; Ryan Larson, Ph.D. candidate at the University of Minnesota; and Sarah Shannon, Assistant Professor of Sociology at the University of Georgia.
The Sentencing Project is a national non-profit organization engaged in research and advocacy on criminal justice issues. Our work is supported by many individual donors and contributions from the following:
Atlantic Philanthropies
Morton K. and Jane Blaustein Foundation
craigslist Charitable Fund
Ford Foundation
Bernard F. and Alva B. Gimbel Foundation
Fidelity Charitable Gift Fund
General Board of Global Ministries of the United Methodist Church
Mott Philanthropy
Open Society Foundations
Petschek Foundation
Public Welfare Foundation
Rail Down Charitable Trust
David Rockefeller Fund
Elizabeth B. and Arthur E. Roswell Foundation
San Francisco Foundation
Tikva Grassroots Empowerment Fund of Tides Foundation
Elsie P. van Buren Foundation
Wallace Global Fund
Copyright © 2016 by The Sentencing Project. Reproduction of this document in full or in part, and in print or electronic format, only by permission of The Sentencing Project.
For more information, contact:
The Sentencing Project1705 DeSales Street NW8th FloorWashington, D.C. 20036
(202) 628-0871
sentencingproject.orgtwitter.com/sentencingprojfacebook.com/thesentencingproject

6 Million Lost Voters: State-Level Estimates of Felony Disenfranchisement, 2016 1
TabLE oF ConTEnTS
Overview 3
Disenfranchisement in 2016 6
Recent Changes 12
Disenfranchisement and Restoration of Civil Rights 13
Summary 14
References 17

2 The Sentencing Project

6 Million Lost Voters: State-Level Estimates of Felony Disenfranchisement, 2016 3
The United States remains one of the world’s strictest nations when it comes to denying the right to vote to citizens convicted of crimes. An estimated 6.1 million Americans are forbidden to vote because of “felony disenfranchisement,” or laws restricting voting rights for those convicted of felony-level crimes.
oVErViEw
• Ratesofdisenfranchisementvarydramaticallybystateduetobroadvariationsinvotingprohibitions.Insixstates–Alabama,Florida,Kentucky,Mississippi,Tennessee,andVirginia–morethan7percentoftheadultpopulationisdisenfranchised.
• ThestateofFloridaaloneaccountsformorethanaquarter(27percent)ofthedisenfranchisedpopulationnationally,and its nearly 1.5million individuals disenfranchisedpost-sentenceaccountfornearlyhalf(48percent)ofthenationaltotal.
• Onein13AfricanAmericansofvotingageisdisenfranchised,aratemorethanfourtimesgreaterthanthatofnon-AfricanAmericans.Over7.4percentoftheadultAfricanAmericanpopulationisdisenfranchisedcomparedto1.8percentofthenon-AfricanAmericanpopulation.
• AfricanAmericandisenfranchisementratesalsovarysignifi-cantlybystate.Infourstates–Florida(21percent),Kentucky(26percent),Tennessee(21percent),andVirginia(22percent)–morethanoneinfiveAfricanAmericansisdis-enfranchised.
Inthiselectionyear,thequestionofvotingrestrictionsisonceagainreceivinggreatpublicattention.ThisreportisintendedtoupdateandexpandourpreviousworkonthescopeanddistributionoffelonydisenfranchisementintheUnitedStates(seeUggen,Shannon,andManza2012;UggenandManza2002;ManzaandUggen2006).Thenumberspresentedhererepresentourbestassessmentofthestateoffelonydisenfran-chisementasoftheNovember2016election.
Ourkeyfindingsincludethefollowing:
• Asof2016,anestimated6.1millionpeoplearedisenfran-chisedduetoafelonyconviction,afigurethathasescalat-eddramaticallyinrecentdecadesasthepopulationundercriminaljusticesupervisionhasincreased.Therewereanestimated1.17millionpeopledisenfranchisedin1976,3.34millionin1996,and5.85millionin2010.
• Approximately2.5percentofthetotalU.S.votingagepopulation–1ofevery40adults–isdisenfranchisedduetoacurrentorpreviousfelonyconviction.
• Individualswhohavecompletedtheirsentencesinthetwelvestatesthatdisenfranchisepeoplepost-sentencemakeupover50percentoftheentiredisenfranchisedpopulation,totalingalmost3.1millionpeople.
4 The Sentencing Project
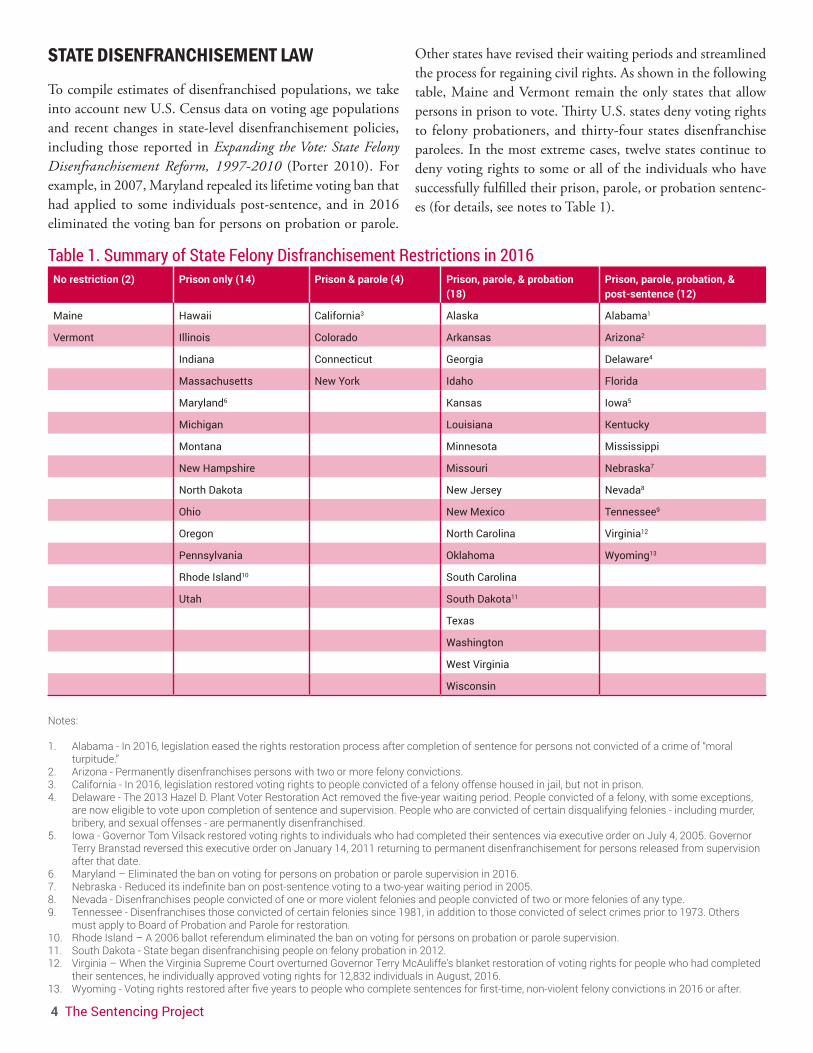
STaTE DiSEnFranChiSEMEnT LawTocompileestimatesofdisenfranchisedpopulations,wetakeintoaccountnewU.S.Censusdataonvotingagepopulationsandrecentchangesinstate-leveldisenfranchisementpolicies,includingthosereportedinExpanding the Vote: State Felony Disenfranchisement Reform, 1997-2010 (Porter2010).Forexample,in2007,Marylandrepealeditslifetimevotingbanthathadappliedtosomeindividualspost-sentence,andin2016eliminatedthevotingbanforpersonsonprobationorparole.
Table 1. Summary of State Felony Disfranchisement Restrictions in 2016No restriction (2) Prison only (14) Prison & parole (4) Prison, parole, & probation
(18)Prison, parole, probation, & post-sentence (12)
Maine Hawaii California3 Alaska Alabama1
Vermont Illinois Colorado Arkansas Arizona2
Indiana Connecticut Georgia Delaware4
Massachusetts New York Idaho Florida
Maryland6 Kansas Iowa5
Michigan Louisiana Kentucky
Montana Minnesota Mississippi
New Hampshire Missouri Nebraska7
North Dakota New Jersey Nevada8
Ohio New Mexico Tennessee9
Oregon North Carolina Virginia12
Pennsylvania Oklahoma Wyoming13
Rhode Island10 South Carolina
Utah South Dakota11
Texas
Washington
West Virginia
Wisconsin
Notes:
1. Alabama - In 2016, legislation eased the rights restoration process after completion of sentence for persons not convicted of a crime of “moral turpitude.”
2. Arizona - Permanently disenfranchises persons with two or more felony convictions.3. California - In 2016, legislation restored voting rights to people convicted of a felony offense housed in jail, but not in prison.4. Delaware - The 2013 Hazel D. Plant Voter Restoration Act removed the five-year waiting period. People convicted of a felony, with some exceptions,
are now eligible to vote upon completion of sentence and supervision. People who are convicted of certain disqualifying felonies - including murder, bribery, and sexual offenses - are permanently disenfranchised.
5. Iowa - Governor Tom Vilsack restored voting rights to individuals who had completed their sentences via executive order on July 4, 2005. Governor Terry Branstad reversed this executive order on January 14, 2011 returning to permanent disenfranchisement for persons released from supervision after that date.
6. Maryland – Eliminated the ban on voting for persons on probation or parole supervision in 2016.7. Nebraska - Reduced its indefinite ban on post-sentence voting to a two-year waiting period in 2005.8. Nevada - Disenfranchises people convicted of one or more violent felonies and people convicted of two or more felonies of any type.9. Tennessee - Disenfranchises those convicted of certain felonies since 1981, in addition to those convicted of select crimes prior to 1973. Others
must apply to Board of Probation and Parole for restoration. 10. Rhode Island – A 2006 ballot referendum eliminated the ban on voting for persons on probation or parole supervision.11. South Dakota - State began disenfranchising people on felony probation in 2012.12. Virginia – When the Virginia Supreme Court overturned Governor Terry McAuliffe’s blanket restoration of voting rights for people who had completed
their sentences, he individually approved voting rights for 12,832 individuals in August, 2016.13. Wyoming - Voting rights restored after five years to people who complete sentences for first-time, non-violent felony convictions in 2016 or after.
Otherstateshaverevisedtheirwaitingperiodsandstreamlinedtheprocessforregainingcivilrights.Asshowninthefollowingtable,MaineandVermontremaintheonlystatesthatallowpersonsinprisontovote.ThirtyU.S.statesdenyvotingrightstofelonyprobationers,andthirty-fourstatesdisenfranchiseparolees.Inthemostextremecases,twelvestatescontinuetodenyvotingrightstosomeoralloftheindividualswhohavesuccessfullyfulfilledtheirprison,parole,orprobationsentenc-es(fordetails,seenotestoTable1).

6 Million Lost Voters: State-Level Estimates of Felony Disenfranchisement, 2016 5
1 In Florida, some can avoid a formal felony conviction by successfully completing a period of probation. According to the Florida Department of Law Enforcement, as much as 40 percent of the total probation population holds this “adjudication withheld” status. According to reports by the Bureau of Justice Statistics, only about 50 percent of Florida probationers successfully complete probation. In light of this, we reduce the annual current disenfranchised felony probation numbers by 40 percent and individuals disenfranchised post-sentence by 20 percent (.4*.5=.20) in each year in the life tables.
2 Our data sources include numerous United States Department of Justice (DOJ) publications, including the annual Sourcebook of Criminal Justice Statistics, Probation and Parole in the United States, as well as the Prisoners and Jail Inmates at Midyear series. Where available, we used data from state departments of corrections rather than national sources, as in the case of Minnesota. For early years, we also referenced National Prisoner Statistics, and Race of Prisoners Admitted to State and Federal Institutions, 1926-1986. We determined the median age of released prisoners based on annual data from the National Corrections Reporting Program. The recidivism rate we use to decrease the releasee population each year is based upon the Bureau of Justice Statistics (1989) “Recidivism of Prisoners Released in 1983” study and “Recidivism of Felons on Probation 1986-1989.” For those in prison or on parole, we use a reincarceration rate of 18.6% at one year, 32.8% at two years, 41.4% at 3 years. Although rearrest rates have increased since 1983, the overall reconviction and reincarceration rates used for this study are much more stable (Langan and Levin 2002, p. 11). For those on pro-bation or in jail, the corresponding three-year failure rate is 36%, meaning that individuals are in prison or jail and therefore counted in a different population. To extend the analysis to subsequent years, we calculated a trend line using the ratio of increases provided by Hoffman and Stone-Mei-erhoefer (1980) on federal prisoners. By year 10, we estimate a 59.4% recidivism rate among released prisoners and parolees, which increases to 65.9% by year 62 (the longest observation period in this analysis). Because these estimates are higher than most long-term recidivism studies, they are likely to yield conservative estimates of the ex-felon population. We apply the same trend line to the 3-year probation and jail recidivism rate of 36%; by year 62, the recidivism rate is 57.3%. 1948 is the earliest year for which detailed data are available on releases from supervision.
METhoDoLogy Weestimatedthenumberofpeoplereleasedfromprisonandthosewhohavecompletedtheirtermsofparoleorprobationbasedondemographiclifetablesforeachstate,asdescribedinUggen,Manza,andThompson(2006)andShannonetal.(2011).Wemodeledeachstate’sdisenfranchisementrateinaccordancewithitsdistinctivefelonyvotingpolicies,asdescribedinTable1.Forexample,somestatesimposedisenfranchisementforfiveyearsafterreleasefromsupervision,somestatesonlydisenfran-chisethoseconvictedofmultiplefelonies,andsomeonlydis-enfranchisethoseconvictedofviolentoffenses.1
Inbrief,wecompileddemographiclifetablesfortheperiod1948-2016todeterminethenumberofreleasedindividualslosttorecidivism(andthereforealreadyincludedinourannualheadcounts)andtomortalityeachyear.Thisallowsustoestimatethenumberofindividualswhohavecompletedtheirsentencesinagivenstateandyearwhoarenolongerundercorrectionalsupervisionyetremaindisenfranchised.Becausedataoncorrec-tionalpopulationsarecurrentlyavailableonlythroughyear-end
2014,weextendedstate-specifictrendsfrom2013-2014toobtainestimatesfor2016.Ourduration-specificrecidivismrateestimatesarederivedfromlarge-scalenationalstudiesofrecid-ivismforprisonreleaseesandprobationers.Basedonthesestudies,ourmodelsassumethatmostreleasedindividualswillbere-incarcerated(66percent)andasmallerpercentageofthoseonprobationorinjail(57percent)willcyclebackthroughthecriminaljusticesystem.Wealsoassumeasubstantiallyhighermortalityrateforpeopleconvictedoffelonyoffensesrelativetotherestofthepopulation.Bothrecidivistsanddeathsareremovedfromthepost-sentencepooltoavoidoverestimatingthenumberof individuals inthepopulationwhohavecompletedtheirsentences.Eachreleasecohortisthusreducedeachsuccessiveyear–atalevelcommensuratewiththeage-adjustedhazardrateformortalityandduration-adjustedhazardrateforrecidivism–andaddedtoeachnewcohortofreleases.Overall,weproducedmorethan200spreadsheetscovering68yearsofdata.2Theseprovidethefiguresneededtocompiledisenfranchisementrateestimatesthatarekeyedtotheappropriatecorrectionalpopu-lationsforeachstateandyear.

6 The Sentencing Project
Figure1showsthedistributionofthe6.1milliondisen-franchisedindividualsacrosscorrectionalpopulations.Peoplecurrentlyinprisonandjailnowrepresentlessthanone-fourth(23percent)ofthosedisenfranchised.Themajority(77percent)are livingintheircommunities,havingfullycompletedtheirsentencesorremainingsu-pervisedwhileonprobationorparole.
VariaTion aCroSS STaTES Duetodifferencesinstate lawsandratesofcriminalpunishment,statesvarywidelyinthepracticeofdisen-
DiSEnFranChiSEMEnT in 2016
Post-sentence
Felony probation
Parole
Jail
Prison
3,092,471 51%
1,329,28822%
72,208 (1%)
504,1278%
1,116,585
18%
Figure 1. Disenfranchisement Distribution Across Correc-tional Populations, 2016
Figure 2. Total Felony Disenfranchisement Rates, 2016

6 Million Lost Voters: State-Level Estimates of Felony Disenfranchisement, 2016 7
franchisement.Thesemapsandtablesrepresentthedisenfran-chisedpopulationasapercentageoftheadultvotingagepop-ulationineachstate.Asnoted,weestimatethat6.1millionAmericansarecurrentlyineligibletovotebystatelaw.AsFigure2andthestatisticsinTable3show,state-leveldisenfranchisementratesin2016variedfromlessthan.5percentinMassachusetts,Maryland,NewHampshire,NorthDakota,Oregon,RhodeIsland,andUtah(andzeroinMaineandVermont)tomorethan7percentinAlabama,Florida,Kentucky,Mississippi,Tennessee,andVirginia.
Figure 3. Total Felony Disenfranchisement Rates, 1980
Thesefiguresshowsignificantgrowthinrecentdecades,evenasmanystatesbegantodismantlevotingrestrictionsforformerlydisenfranchisedpopulations.Figure3displaysdisenfranchisementratesin1980,retainingthesamescaleasinFigure2.Atthattime,farmoreofthenationhaddisenfranchisementratesbelow.5percentandnostatedisenfranchisedmorethan5percentofitsadultcitizens.

8 The Sentencing Project
Figure 4. Cartogram of Total Disenfranchisement Rates by State, 2016
ThecartograminFigure4providesanotherwaytovisualizethecurrentstateofAmericandisenfranchisement,highlightingthelargeregionaldifferencesinfelonydisenfranchisementlawsandcriminalpunishment.Cartogramsdistortthelandareaonthemapaccordingtoanalternativestatistic,inthiscasethetotalfelonydisenfranchisementrate.Southeasternstatesthatdisen-franchisehundredsofthousandsofpeoplewhohavecompletedtheirsentences,suchasFlorida,Kentucky,andVirginia,appearbloatedinthecartogram.Incontrast,themanyNortheasternandMidwesternstatesthatonlydisenfranchiseindividualscurrentlyinprisonshrivelinsize.Thisdistortedmapthusprovidesaclearvisualrepresentationofthegreatrangeofdifferencesinthescopeandimpactoffelonydisenfranchisementacrossthe50states.
< 0.5%
0.5 - 1.9%
2 - 4.9%
5 - 9.9%
10+
No restrictions

6 Million Lost Voters: State-Level Estimates of Felony Disenfranchisement, 2016 9
Figure 5. Number Disenfranchised for Selected Years, 1960-2016
0
1,000,000
2,000,000
3,000,000
4,000,000
5,000,000
6,000,000
7,000,000
20162008200019921984197619681960
1,762,582
1,176,234
3,342,586
4,686,539
5,358,282
5,852,1806,106,327
TrEnDS oVEr TiMEFigure5illustratesthehistoricaltrendinU.S.disenfranchise-ment,showinggrowthinthedisenfranchisedpopulationforselectedyearsfrom1960to2016.Thenumberdisenfranchiseddroppedfromapproximately1.8millionto1.2millionbetween1960and1976,asstatesexpandedvotingrights inthecivilrightsera.Manystateshavecontinuedtoparebacktheirdisen-franchisementprovisionssincethe1970s(seeBehrens,Uggen,andManza,2003;ManzaandUggen,2006).Nevertheless,thetotalnumberbannedfromvotingcontinuedtorisewiththeexpansioninU.S.correctionalpopulations.Thetotaldisenfran-chisedpopulationrosefrom3.3millionin1996to4.7millionin2000,to5.4millionin2004,to5.9millionin2010.Today,weestimatethat6.1millionAmericansaredisenfranchisedbyvirtueofafelonyconviction.

10 The Sentencing Project
VariaTion by raCEDisenfranchisementratesvarytremendouslyacrossracialandethnicgroups,suchthatfelonydisenfranchisementprovisionshaveanoutsizedimpactoncommunitiesofcolor.Raceandethnicityhavenotbeenconsistentlycollectedorreportedinthedatasourcesusedtocompileourestimates,soourabilitytoconstructrace-specificestimates is limited.ThisisespeciallyproblematicforLatinos,whonowconstituteasignificantportion
Figure 6. African American Felony Disenfranchisement Rates, 1980
ofcriminaljusticepopulations.Nevertheless,weusedthemostrecentdataavailablefromtheBureauofJusticeStatisticstodevelopacompletesetofstate-specificdisenfranchisementes-timatesfortheAfricanAmericanvotingagepopulation,asshowninFigures6and7.WefirstshowamapoftheAfricanAmericandisenfranchisementratefor1980,andthenshowhowthepicturelookstoday.By1980,theAfricanAmericandisenfranchisementratealreadyexceeded10percentoftheadultpopulationinstatessuchasArizonaandIowa,asshowninFigure6.Thefigurealso

6 Million Lost Voters: State-Level Estimates of Felony Disenfranchisement, 2016 11
indicatesthatseveralSoutheasternstatesdisenfranchisedmorethan5percentoftheiradultAfricanAmericanpopulationsatthattime.
Figure7showsthecorrespondingratesfor2016,againretainingacommonscaleandshadingtokeepthemapconsistentwiththe1980mapinFigure6.AfricanAmericandisenfranchisementratesinKentucky,Tennessee,andVirginianowexceed20percentoftheadultvotingagepopulation.Whereasonly9statesdis-enfranchisedatleast5percentoftheirAfricanAmericanadultcitizensin1980,23statesdosotoday.
Figure 7. African American Felony Disenfranchisement Rates, 2016

12 The Sentencing Project
Therateoftotal individualsdisenfranchisedin2016(2.47percent)isquitesimilartothe2010figuresreportedbyUggenetal.for2012(2.50percent)andManzaandUggenin2006(2.42percent),despitestatechangesindisenfranchisementpolicyandpopulationgrowth.OurestimatesforAfricanAmericandisenfranchisementin2016,however,areslightly lowerthanthosefor2010–7.44percentversus7.66percent,andfor2004,8.25percent.Fortheseestimates,weusedthemostinclusivedenominatorfortheAfricanAmericanvotingagepopulationavailablefromtheU.S.Censustoensurethatwedonotover-estimatethedisenfranchisementrateforthispopulation.WhilegrowthinthebaselinepopulationforAfricanAmericanscon-tributestothedeclineinthedisenfranchisementratefrompreviousestimates,thelion’sshareofthedifferenceisduetoanimportantrefinementinourestimationprocedures.For2016andfor2010,weusedrace-specificrecidivismrates(resultinginahigherrateforAfricanAmericans)thatmoreaccuratelyreflectcurrentscholarshiponrecidivism.Thisresultsinahigherrateofattritioninourlifetables,butproducesamoreconser-vativeand,webelieve,moreaccurateportraitofthenumberofdisenfranchisedAfricanAmericans.Thoughlowerthanin2004,the7.44percentrateofdisenfranchisementforAfricanAmer-icansremainsfourtimesgreaterthenon-AfricanAmericanrateof1.78percent.
GiventhesizeofFlorida’sdisenfranchisedpopulation,wealsonoteourestimationprocedureforthisstate.Basedonastate-spe-cificrecidivismreportin1999,our2004estimatesincludedmuchhigherrecidivismratesforAfricanAmericansinFlorida(upto88%lifetime).A2010reportfromtheFloridaDepart-mentofCorrectionsshowsthatratesofrecidivismforAfricanAmericansarenowmorecloselyinlinewiththenationalratesweapplytootherstates.Inlightofthismorerecentevidence,webeginapplyingournationalrateofrecidivismforAfricanAmericans(upto73%lifetime)toFlorida’sAfricanAmericanpopulationwithpriorfelonyconvictionsfrom2005onward.
rECEnT ChangESIn2016,morepeopleweredisenfranchisedinFloridathaninanyotherstateandFlorida’sdisenfranchisementrateremainshighestamongthe50states.
AsTable1noted,therehavebeenseveralsignificantchangesinstatedisenfranchisementpoliciesoverthepastdecade.Mostnotably,Delawareremoveditsfive-yearwaitingperiodformostoffenses in2013andSouthDakotabegandisenfranchisingfelonyprobationers in2012.GovernorTomVilsackofIoware-enfranchisedallstateresidentswhohadcompletedtheirsentencesbyexecutiveorderonJuly4,2005–thoughthatorderwasthenreversedbyhissuccessor,GovernorTerryBranstad,inJanuary2011.In2016theAlabamalegislatureeasedtherightsrestorationprocessaftercompletionofsentenceforpersonsnotconvictedofacrimeof“moralturpitude.”Otherstateshavealsoreduceddisenfranchisementthroughstreamliningrestorationofrightsorre-enfranchisingcertaingroupsofindividualswithfelonyconvictions.Forexample,bothRhodeIslandandMarylandnowrestrictvotingrightsonlyforthoseinprisonasopposedtoall individualscurrentlyservingafelonysentence, includingthoseonprobationandparole.Andin2016,Californiarestoredvotingrightstopeopleconvictedofafelonyoffensehousedinjail,butnotinprison.
Ourintenthereistoprovideaportraitofdisenfranchisementthatwouldbeaccurateasofthe2016Novemberelection,thoughwestressthatalldatareportedhereareestimatesratherthanheadcounts.

6 Million Lost Voters: State-Level Estimates of Felony Disenfranchisement, 2016 13
DiSEnFranChiSEMEnT anD rESToraTion oF CiViL righTSStatestypicallyprovidesomelimitedmechanismfordisenfran-chisedpersonstorestoretheirrighttovote.Thesevarygreatlyinscope,eligibilityrequirements,andreportingpractices.ItisthusdifficulttoobtainconsistentinformationabouttherateandnumberofdisenfranchisedAmericanswhoserightsarerestoredthroughtheseprocedures.Nevertheless,wecontactedeachoftheappropriatestateagenciesbyemailandphoneandcompiledtheinformationtheymadeavailabletousinTable2.Thisprovidessomebasicinformationaboutthefrequencyofstaterestorationofrightsinthose12statesthatdisenfranchisebeyondsentencecompletion.Thetableshowshowmanypeopleweredisenfranchisedandthenumberofrestorationsreportedbystateofficialsinagivenreportingperiod.
Whilewewereunabletoobtaincompletedatafromallstates,wesubtractedallknownrestorationsofcivilrights(includingfullpardons)fromeachstate’stotaldisenfranchisedpost-sentencefigure.Evenaccountingfortheserestorations,itisclearthatthevastmajorityofsuchindividualsinthesestatesremaindisen-franchised.Indeed,somestateshavesignificantlycurtailedres-torationeffortssince2010,includingIowaandFlorida.
Table 2. Restoration of Voting Rights in States that Disenfranchise Residents Post-Sentence
State Restorations Period of Restoration Estimates
Alabama 16,022 2004-2015
Arizona 31 2010-2015
Delaware 2,285 1988-2015
Florida 271,982 1990-2015
Iowa 115,325 2005-2015
Kentucky 10,479 2008-2015
Mississippi 335 2000-2015
Nebraska N/A -
Nevada 281 1990-2011
Tennessee 11,581 1990-2015
Virginia 21,664 2002-2016
Wyoming 107 2003-2015
14 The Sentencing Project
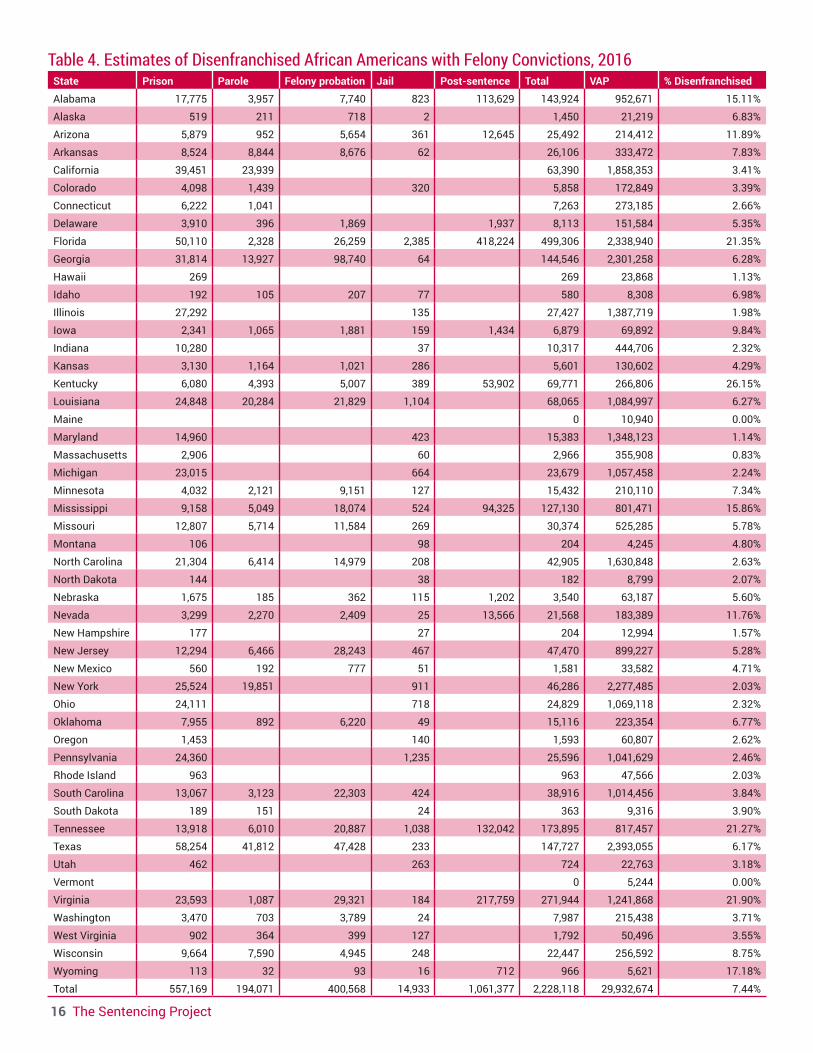
Thisreportprovidesnewstate-levelestimatesonfelonydisen-franchisementfor2016intheUnitedStatestoupdatethoseprovidedbyUggen,Shannon,andManza(2012)forpreviousyears.InTables3and4,weprovidestate-specificpointestimatesofthedisenfranchisedpopulationandAfricanAmericandisen-franchisedpopulation,subjecttothecaveatsdescribedbelow.
Despitesignificant legalchangesinrecentdecades,over6.1millionAmericansremaineddisenfranchisedin2016.Whenwebreakthesefiguresdownbyrace,itisclearthatdisparitiesinthecriminaljusticesystemarelinkedtodisparitiesinpoliticalrepresentation.ThedistributionofdisenfranchisedindividualsshowninFigure1alsobearsrepeating:lessthanone-fourthofthispopulationiscurrentlyincarcerated,meaningthatabout4.7millionadultswholive,work,andpaytaxesintheircom-munitiesarebannedfromvoting.Ofthistotal,overonemillionareAfricanAmericanswhohavecompletedtheirsentences.PublicopinionresearchshowsthatasignificantmajorityofAmericansfavorvotingrightsforpeopleonprobationorparolewhoarecurrentlysupervisedintheircommunities,aswellasforindividualswhohavecompletedtheirsentences(Manza,Brooks,andUggen2004).HowmuchdifferencewoulditmakeifstatelawswerechangedtoreflecttheprinciplesmostAmeri-cansendorse?Theanswerisstraightforward:Votingrightswouldberestoredto77percentofthe6.1millionpeoplecurrentlydisenfranchised.
SuMMaryCaVEaTSWehavetakencaretoproduceestimatesofcurrentpopulationsand“post-sentence”populationsthatarereliableandvalidbysocialsciencestandards.Nevertheless,readersshouldbearinmindthatourstate-specificfiguresforthe12statesthatbarindividualsfromvotingaftertheyhavecompletedtheirsentenc-esremainpointestimatesratherthanactualheadcounts.Inaddition,theprison,probation,parole,andjailpopulationswereportfor2016arealsoestimated,basedontherecentstate-spe-cifictrendsineachstate.Inotherwork,wehavepresentedfiguresthatadjustor“bound”theseestimatesbyassumingdifferentlevelsofrecidivism,inter-statemobility,andstate-specificvari-ation.Withthesecaveats inmind,theresultsreportedherepresentourbestaccountoftheprevalenceofU.S.disenfran-chisementin2016.Theseestimateswillbeadjustedifandwhenwediscovererrorsoromissionsinthedatacompiledfromin-dividualstates,U.S.CensusandBureauofJusticeStatisticssources,orinourownspreadsheetsandestimationprocedures.

6 Million Lost Voters: State-Level Estimates of Felony Disenfranchisement, 2016 15
Table 3. Estimates of Disenfranchised Individuals with Felony Convictions, 2016State Prison Parole Felony probation Jail Post-sentence Total VAP % Disenfranchised
Alabama 30,585 6,580 15,626 1,578 231,896 286,266 3,755,483 7.62%
Alaska 5,497 2,035 6,900 7 14,439 552,166 2.61%
Arizona 44,509 7,241 51,362 1,341 116,717 221,170 5,205,215 4.25%
Arkansas 19,224 21,811 24,695 975 66,705 2,272,904 2.93%
California 136,302 86,254 222,557 30,023,902 0.74%
Colorado 21,207 8,673 1,066 30,946 4,199,509 0.74%
Connecticut 14,926 2,419 17,345 2,826,827 0.61%
Delaware 6,858 716 4,074 4,067 15,716 741,548 2.12%
Florida 102,555 4,208 86,886 4,822 1,487,847 1,686,318 16,166,143 10.43%
Georgia 50,900 23,545 170,194 4,112 248,751 7,710,688 3.23%
Hawaii 6,364 6,364 1,120,770 0.57%
Idaho 7,873 5,057 9,863 314 23,106 1,222,093 1.89%
Illinois 47,537 2,089 49,625 9,901,322 0.50%
Iowa 9,127 6,133 12,365 410 23,976 52,012 2,395,103 2.17%
Indiana 28,028 1,630 29,658 5,040,224 0.59%
Kansas 9,466 4,023 3,426 679 17,594 2,192,084 0.80%
Kentucky 22,968 16,729 27,323 2,039 242,987 312,046 3,413,425 9.14%
Louisiana 35,614 31,450 37,761 3,211 108,035 3,555,911 3.04%
Maine 0 1,072,948 0.00%
Maryland 20,378 1,087 21,465 4,658,175 0.46%
Massachusetts 10,254 921 11,176 5,407,335 0.21%
Michigan 42,661 1,560 44,221 7,715,272 0.57%
Minnesota 11,369 8,148 43215 608 63,340 4,205,207 1.51%
Mississippi 13,752 8,051 28463 1,422 166,494 218,181 2,265,485 9.63%
Missouri 32,768 16,808 38,870 1,219 89,665 4,692,196 1.91%
Montana 3,816 330 4,146 806,529 0.51%
North Carolina 37,446 10,977 40,867 1,888 91,179 7,752,234 1.18%
North Dakota 2,042 136 2,178 583,001 0.37%
Nebraska 6,377 782 2,952 384 7,069 17,564 1,425,853 1.23%
Nevada 11,560 6,828 8,097 701 62,080 89,267 2,221,681 4.02%
New Hampshire 2,856 175 3,031 1,066,610 0.28%
New Jersey 19,964 14,831 58,123 1,396 94,315 6,959,192 1.36%
New Mexico 7,205 2,838 13,352 891 24,286 1,588,201 1.53%
New York 50,513 44,590 2,477 97,581 15,584,974 0.63%
Ohio 51,102 1,736 52,837 8,984,946 0.59%
Oklahoma 27,857 2,572 26,475 1,398 58,302 2,950,017 1.98%
Oregon 14,228 519 14,748 3,166,121 0.47%
Pennsylvania 49,269 3,705 52,974 10,112,229 0.52%
Rhode Island 3,355 3,355 845,254 0.40%
South Carolina 20,141 4,621 21,464 1,011 47,238 3,804,558 1.24%
South Dakota 3,464 2,643 4,114 170 10,392 647,145 1.61%
Tennessee 29,271 13,186 52,654 2,763 323,354 421,227 5,102,688 8.26%
Texas 161,658 111,632 216,033 6,605 495,928 20,257,343 2.45%
Utah 6,925 744 7,669 2,083,423 0.37%
Vermont 0 506,119 0.00%
Virginia 38,694 1,604 56,908 2,905 408,570 508,680 6,512,571 7.81%
Washington 18,395 3,811 25,164 1,182 48,552 5,558,509 0.87%
West Virginia 7,042 3,187 4,109 389 14,727 1,464,532 1.01%
Wisconsin 22,851 19,537 22,101 1,118 65,606 4,476,711 1.47%
Wyoming 2,536 607 3,148 141 17,414 23,847 447,212 5.33%
Total 1,329,288 504,127 1,116,585 63,855 3,092,471 6,106,327 247,219,588 2.47%
16 The Sentencing Project
Table 4. Estimates of Disenfranchised African Americans with Felony Convictions, 2016State Prison Parole Felony probation Jail Post-sentence Total VAP % Disenfranchised
Alabama 17,775 3,957 7,740 823 113,629 143,924 952,671 15.11%
Alaska 519 211 718 2 1,450 21,219 6.83%
Arizona 5,879 952 5,654 361 12,645 25,492 214,412 11.89%
Arkansas 8,524 8,844 8,676 62 26,106 333,472 7.83%
California 39,451 23,939 63,390 1,858,353 3.41%
Colorado 4,098 1,439 320 5,858 172,849 3.39%
Connecticut 6,222 1,041 7,263 273,185 2.66%
Delaware 3,910 396 1,869 1,937 8,113 151,584 5.35%
Florida 50,110 2,328 26,259 2,385 418,224 499,306 2,338,940 21.35%
Georgia 31,814 13,927 98,740 64 144,546 2,301,258 6.28%
Hawaii 269 269 23,868 1.13%
Idaho 192 105 207 77 580 8,308 6.98%
Illinois 27,292 135 27,427 1,387,719 1.98%
Iowa 2,341 1,065 1,881 159 1,434 6,879 69,892 9.84%
Indiana 10,280 37 10,317 444,706 2.32%
Kansas 3,130 1,164 1,021 286 5,601 130,602 4.29%
Kentucky 6,080 4,393 5,007 389 53,902 69,771 266,806 26.15%
Louisiana 24,848 20,284 21,829 1,104 68,065 1,084,997 6.27%
Maine 0 10,940 0.00%
Maryland 14,960 423 15,383 1,348,123 1.14%
Massachusetts 2,906 60 2,966 355,908 0.83%
Michigan 23,015 664 23,679 1,057,458 2.24%
Minnesota 4,032 2,121 9,151 127 15,432 210,110 7.34%
Mississippi 9,158 5,049 18,074 524 94,325 127,130 801,471 15.86%
Missouri 12,807 5,714 11,584 269 30,374 525,285 5.78%
Montana 106 98 204 4,245 4.80%
North Carolina 21,304 6,414 14,979 208 42,905 1,630,848 2.63%
North Dakota 144 38 182 8,799 2.07%
Nebraska 1,675 185 362 115 1,202 3,540 63,187 5.60%
Nevada 3,299 2,270 2,409 25 13,566 21,568 183,389 11.76%
New Hampshire 177 27 204 12,994 1.57%
New Jersey 12,294 6,466 28,243 467 47,470 899,227 5.28%
New Mexico 560 192 777 51 1,581 33,582 4.71%
New York 25,524 19,851 911 46,286 2,277,485 2.03%
Ohio 24,111 718 24,829 1,069,118 2.32%
Oklahoma 7,955 892 6,220 49 15,116 223,354 6.77%
Oregon 1,453 140 1,593 60,807 2.62%
Pennsylvania 24,360 1,235 25,596 1,041,629 2.46%
Rhode Island 963 963 47,566 2.03%
South Carolina 13,067 3,123 22,303 424 38,916 1,014,456 3.84%
South Dakota 189 151 24 363 9,316 3.90%
Tennessee 13,918 6,010 20,887 1,038 132,042 173,895 817,457 21.27%
Texas 58,254 41,812 47,428 233 147,727 2,393,055 6.17%
Utah 462 263 724 22,763 3.18%
Vermont 0 5,244 0.00%
Virginia 23,593 1,087 29,321 184 217,759 271,944 1,241,868 21.90%
Washington 3,470 703 3,789 24 7,987 215,438 3.71%
West Virginia 902 364 399 127 1,792 50,496 3.55%
Wisconsin 9,664 7,590 4,945 248 22,447 256,592 8.75%
Wyoming 113 32 93 16 712 966 5,621 17.18%
Total 557,169 194,071 400,568 14,933 1,061,377 2,228,118 29,932,674 7.44%

6 Million Lost Voters: State-Level Estimates of Felony Disenfranchisement, 2016 17
rEFErEnCESBehrens,Angela,ChristopherUggen,andJeffManza.2003.
“BallotManipulationandthe‘MenaceofNegroDomina-tion’:RacialThreatandFelonDisenfranchisementintheUnitedStates,1850-2002.”AmericanJournalofSociology109:559-605.
FloridaDepartmentofCorrections.2010.“2009FloridaPrisonRecidivismStudy:Releasesfrom2001to2008.”FloridaDepartmentofCorrections:BureauofResearchandDataAnalysis.
Manza,JeffandChristopherUggen.2006.LockedOut:FelonDisenfranchisementandAmericanDemocracy.NewYork:OxfordUniversityPress.
Manza,Jeff,ClemBrooks,andChristopherUggen.2004.“PublicAttitudestowardFelonDisenfranchisementintheUnitedStates.”PublicOpinionQuarterly68:275-86.
Porter,NicoleD.2010.“ExpandingtheVote:StateFelonyDisenfranchisementReform,2010.”TheSentencingProject,WashingtonDC.
Shannon,Sarah,ChristopherUggen,MelissaThompson,JasonSchnittker,andMichaelMassoglia.2011.“GrowthintheU.S.Ex-FelonAndEx-PrisonerPopulation,1948to2010.”Paperpresentedatthe2011AnnualMeetingsofthePopu-lationAssociationofAmerica.
Uggen,Christopher,JeffManza,andMelissaThompson.2006.“Citizenship,Democracy,andtheCivicReintegrationofCriminalOffenders.”AnnalsoftheAmericanAcademyofPoliticalandSocialScience605:281-310.
Uggen,ChristopherandJeffManza.2002.“DemocraticCon-traction?ThePoliticalConsequencesofFelonDisenfran-chisement intheUnitedStates.”AmericanSociologicalReview67:777-803.
Uggen,Christopher,SarahShannon,andJeffManza.2012.State-levelEstimatesofFelonDisenfranchisement intheUnitedStates,2010.Washington,DC:SentencingProject.
aCKnowLEDgEMEnTWethankLesleySchneiderandChelseaCarlsonforresearchassistance.

6 Million Lost Voters: State-Level Estimates of Felony Disenfranchisement, 2016
Christopher Uggen, Ryan Larson, and Sarah Shannon
October 2016
1705 DeSales Street NW, 8th FloorWashington, D.C. 20036Tel: 202.628.0871Fax: 202.628.1091sentencingproject.org
The Sentencing Project works for a fair and effective U.S. justice system by promoting reforms in sentencing policy, addressing unjust racial disparities and practices, and advocating for alternatives to incarceration.
Related publications by The Sentencing Project:
• State-Level Estimates of Felon Disenfranchisement in the United States, 2010
• Felony Disenfranchisement: A Primer• Felony Disenfranchisement Laws in the United States• Democracy Imprisoned: The Prevalence and Impact of Felony
Disenfranchisement Laws in the United States