6. DAFTAR PUSTAKArepository.unika.ac.id/9136/8/12.70.0096 shella Novia Wulandari... · 41 6. DAFTAR...
22
41 6. DAFTAR PUSTAKA Anderson, K. and Naujoks, B. (1994). The SSB Viscometer System: Starch Application, Cargill, Inc. Angka SL, Suhartono TS. 2000. Bioteknologi Hasil Laut. Bogor: Pusat Kajian Sumber Daya Pesisir dan Lautan. Institut Pertanian Bogor. hlm 49-56. Apriyantono, A., D. Fardiaz, N.L. Puspitasari, Sedarnawati , dan S. Budiyanto. (1989). Analisa Pangan. PAU Pangan dan Gizi. IPB. Bogor. Ashraf M. Sharoba. 2014. Nutritional value of spirulina and its use in the preparation of some complementary baby food formulas. Journal of Agroalimentary Processes and Technologies, 20 (4), 330-350. Carlsen, M. H., B. L. Halvorsen, K. Holte, S. K. Bohn, S. Dragland, L. Sampson, C. Willey, H. Senoo, Y. Umezono, C. Sanada, I. Barikmo, N. Berhe, W. C. Willet, K. M. Philips, D.R. Jacobs Jr, R. Blomhoff. (2010). The total antioxidant content of more than 3100 foods, beverages, spices, herbs and supplements used worldwide. Nutrition Journal, 9:3. Christianti, Yessy. (2013). Pemanfaatan Mikroalga Spirulina sp dalam Formulasi Butter Cookies: Studi Karateristik Fisikokimia dan sensori. Skripsi. Universitas Katolik Soegijapranata Semarang. Christwardana, M., dan Hadiyanto M.M.A. Nur. 2012. Spirulina platensis:potensinyasebagaibahanpanganfungsional.. Jurnal Aplikasi Teknologi Pangan. Vol 2. UNDIP: Semarang. Chueamchaitrakun, P., P. Chompreeda, V. Haruthaithanasan, T. Suwonsichon & S. Kasemsamran. (2011). Physical Properties of Butter Cake Made from Mixed Hom-Mali and Glutinous Rice Flours. Kasetsart J. (Nat. Sci.) 45 : 295 – 304. Codex Alimentarius Commission. (1995). Codex Standard For Rice. CODEX STAN 198-1995. Damodaran, S and A. Paraf. (1997). Food Proteins and Their Application New York. Marcel Dekker, Inc. Frei.M. and K. Becker. (2004). On Rice, Biodiversity & Nutrients. University of Hohenheim, Germany.
-
Upload
phungtuyen -
Category
Documents
-
view
213 -
download
0
Transcript of 6. DAFTAR PUSTAKArepository.unika.ac.id/9136/8/12.70.0096 shella Novia Wulandari... · 41 6. DAFTAR...

41
6. DAFTAR PUSTAKA
Anderson, K. and Naujoks, B. (1994). The SSB Viscometer System: Starch Application,
Cargill, Inc.
Angka SL, Suhartono TS. 2000. Bioteknologi Hasil Laut. Bogor: Pusat Kajian Sumber
Daya Pesisir dan Lautan. Institut Pertanian Bogor. hlm 49-56.
Apriyantono, A., D. Fardiaz, N.L. Puspitasari, Sedarnawati , dan S. Budiyanto. (1989).
Analisa Pangan. PAU Pangan dan Gizi. IPB. Bogor.
Ashraf M. Sharoba. 2014. Nutritional value of spirulina and its use in the preparation of
some complementary baby food formulas. Journal of Agroalimentary Processes
and Technologies, 20 (4), 330-350.
Carlsen, M. H., B. L. Halvorsen, K. Holte, S. K. Bohn, S. Dragland, L. Sampson, C.
Willey, H. Senoo, Y. Umezono, C. Sanada, I. Barikmo, N. Berhe, W. C. Willet,
K. M. Philips, D.R. Jacobs Jr, R. Blomhoff. (2010). The total antioxidant content
of more than 3100 foods, beverages, spices, herbs and supplements used
worldwide. Nutrition Journal, 9:3.
Christianti, Yessy. (2013). Pemanfaatan Mikroalga Spirulina sp dalam Formulasi Butter
Cookies: Studi Karateristik Fisikokimia dan sensori. Skripsi. Universitas Katolik
Soegijapranata Semarang.
Christwardana, M., dan Hadiyanto M.M.A. Nur. 2012. Spirulina
platensis:potensinyasebagaibahanpanganfungsional.. Jurnal Aplikasi Teknologi
Pangan. Vol 2. UNDIP: Semarang.
Chueamchaitrakun, P., P. Chompreeda, V. Haruthaithanasan, T. Suwonsichon & S.
Kasemsamran. (2011). Physical Properties of Butter Cake Made from Mixed
Hom-Mali and Glutinous Rice Flours. Kasetsart J. (Nat. Sci.) 45 : 295 – 304.
Codex Alimentarius Commission. (1995). Codex Standard For Rice. CODEX STAN
198-1995.
Damodaran, S and A. Paraf. (1997). Food Proteins and Their Application New York.
Marcel Dekker, Inc.
Frei.M. and K. Becker. (2004). On Rice, Biodiversity & Nutrients. University of
Hohenheim, Germany.
42
Haryadi. 2006. Teknologi Pengolahan Beras. Gadjah Mada University Press.
Yogyakarta.
Haryati R. 2008. Pertumbuhan dan biomassa Spirulina sp. dalam skala laboratoris.
Laboratorium Ekologi dan Biosistematik, Jurnal Jurusan Biologi FMIPA.
UndipBIOMA, ISSN: 1410-8801 Vol. 10, No. 1, Hal. 19-22.
Henrikson, R. (2009). Earth food Spirulina. How this remarkable blue-greenalgae can
transform your health and our planet. Ronore Enterprises, Inc. Hawaii USA. 175
p.
Henrikson, R. (2010). Sprulina Wold Food Updated and Revisied. Ronore Enterprises.
American.
Hoseney, R.C. 1994. Principles of Cereal Science and Technology, 2nd
edition. The
American Association of Cereal Chemistry, Inc. USA.
Hug C,von der Weid D. Spirulina in the Fight Against Malnutrition. Fondation Antenna
Technologies. 2011.
Kabinawa. 2006. Spirulina: Ganggang Penggempur Aneka Penyakit. PT AgroMedia
Pustaka. Jakarta.
Kusnandar, Ferri. (2010). Mengenal Sifat Fungsional Protein. Departemen Ilmu
Teknologi Pangan – IPB.
Liang, S. ; X. Liu ; F. Chen & Z. Chen. (2004). Current Microalgal Helath Food R & D
Activities in China. Hydrobiologia. Vol. 512:45-48.
Lebesi, Dimitra M. and Constantina Tzia. (2009). Effect of the Addition of Different
Dietary Fiber and Edible Cereal Bran Source on the Baking and Sensory
Characteristic of Cupcakes. Journal Food Bioprocess Technology.
Matz, S.A. (1992). Bakery Technology and Eginering. 3th edition. Van Nostrand
Reinhold. Texas.
Prasanna, R., A. Sood, A. Suresh, S. Nayak, & B.D. Kaushik. 2007. Potential and
aplications of algal pigment in biology. .Acta Botan. Hungaria 49 (1- 2): 131-
156.
Prasetyo, Budi dan Elizabeth Novi Kusumaningrum. 2010. Penentuan Jenis Spirulina
sp. di Situ Babakan, Jagakarsa, Jakarta Selatan. Laporan Penelitian. Tangerang

43
Selatan; Fakultas Matematika dan Ilmu Pengetahuan Alam. Lembaga Penelitian
Universitas Terbuka.
Rahman, R.S.; W.D.R. Putri, dan I. Purwantiningrum. (2015). Karakterisasi Beras
Tiruan Berbasis Tepung Ubi Jalar Oranye Termodifikasi Heat Moisture
Treatment (HMT). Jurnal Pangan dan Agroindustri Vol 3 No 2p. 713-722.
Ravi, M., S. Lata De, S. Azharudin and S. F. D. Paul. (2010). The Beneficial Effects of
Spirulina Focusing on its Immunomodulatory and antioxidant Properties
Nutrition and Dietary Supplements.
Ravichandran, K.; N. M. M. T. Saw; A. A.A. Mohdaly; A. M.M. Gabr; A. Kastell; H.
Riedel; Z. Cai; D. Knorr; & I. Smetanska. (2013). Impact of Processing of Red
Beet on Betalain Content and Antioxidant Activity. Food Research
International 50: 670–675.
Rimbawan dan A. Siagian. (2004). Indeks Glikemik Pangan. Jakarta: Penebar Swadaya.
Roy, P., Daisuke, N., Takahiro, O., Hiroshi, O., Mmanasikan, T., Nobutaka, N., and
Takeo, S. (2010). Cooking Properties of Different From of Rice Cooked With
an Automatic Induction Heating System Rice Cooker. As. Food Ag-Ind 3(04).
373-388.
Sanchez M, et al. Spirulina (Arthrospira): An Edible Microorganism. Universidad
Javeriana Bogota;2003.
Selmo, M. S. and Salas-Mellado, M. M. (2014). Technological quality of bread from
rice flour with Spirulina. International Food Research Journal 21(4): 1523-1528.
Setiari, N dan Y. Nurchayanti. (2009). Ekplorasi Kandungan Klorofil beberapa Sayuran
Hijau sebagai Alternatif Bahan Dasar Food Supplement. Bioma, 11 (1) : 6-10.
Sudarmadji, S.; B. Haryono & E. Suhardi. (1989). Analisa Bahan Makanan. Liberty.
Yogyakarta.
Swinkels, J.J.M. (1985). Source of Starch, its chemistry and physics. Di
dalam:G.M.A.V. Beynum dan J.A. Roels (eds). Starch Conversion Technology.
Marcel Dekker, Inc., New York.
Tabita A., (2012). Karakteristik Fungsional Protein Spirulina Platensis. (Skripsi).
Jurusan Teknologi Pangan. Fakultas Teknologi Pertanian. Unika Soegijapranata.
Semarang.
Tietze, H. W. (2004). Spirulina ed. 4th
. B. Jain Publisher. New Delhi.

44
Tongsiri, S. Mang-Amphan, K and Y. Peerapornpisal. (2010). Effect of Replacing
Fishmeal with Spirulina on Growth, Carcass, Composition and Pigment of the
Mekong Giant Catfish. Asian Journal of Agricultural Science 2(3):106-110.
Wang, L., B. Pan, J. Sheng, J. Xu, and Q. Hu. 2007. Antioxidant activity of Spirulina
platensis extract by supercritical carbon dioxide ex-traction. Food Chemistry,
105:36-41.
Winarno, F.G., 2002. Kimia Pangan dan Gizi. Gramedia Pustaka Utama, Jakarta.

45
7. LAMPIRAN
Lampiran 1. Diagram Warna
Konsentrasi Sel Kering Spirulina 0% Konsentrasi Sel Kering Spirulina 1%
Konsentrasi Sel Kering Spirulina 5% Konsentrasi Sel Kering Spirulina 10%
-60
-40
-20
0
20
40
60
-60 -40 -20 0 20 40 60
Adonan Tepung Ketan + 0% Spirulina
menit 0 menit 3 menit 6 menit 9 menit 12 menit 15
a*
b *
-60
-40
-20
0
20
40
60
-60 -40 -20 0 20 40 60
Adonan Tepung Ketan + 1 % Spirulina
menit 0 menit 3 menit 6 menit 9 menit 12 menit 15
a*
b *
-60
-40
-20
0
20
40
60
-60 -40 -20 0 20 40 60
Adonan Tepung Ketan + 5% Spirulina
menit 0 menit 3 menit 6 menit 9 menit 12 menit 15
a
b *
-60
-40
-20
0
20
40
60
-60 -40 -20 0 20 40 60
Adonan Tepung Ketan +10%Spirulina
menit 0 menit 3 menit 6 menit 9 menit 12 menit 15
a
b *

46
Lampiran 2. Kurva Standar Amilosa
y = 0.0185x - 0.0055 R² = 0.9987
0
0.05
0.1
0.15
0.2
0.25
0.3
0.35
0.4
0 4 8 12 16 20 24
Ab
sorb
ansi
ppm
Kurva Standar Amilosa
absorbansi
Linear (absorbansi)

47
Lampiran 3. Hasil Olah Data dengan SPSS versi 16.0
Uji Viskositas
Uji Normalitas
Post Hoc One Way Anova
48
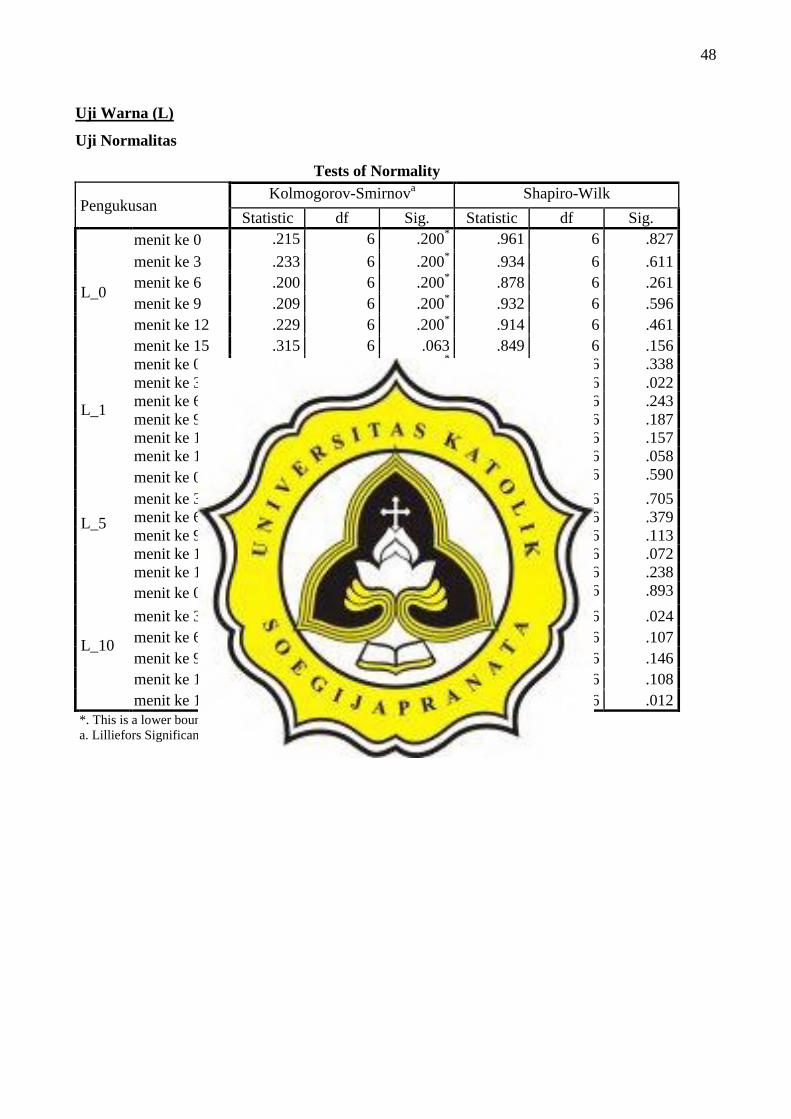
Uji Warna (L)
Uji Normalitas
Tests of Normality
Pengukusan Kolmogorov-Smirnov
a Shapiro-Wilk
Statistic df Sig. Statistic df Sig.
L_0
menit ke 0 .215 6 .200* .961 6 .827
menit ke 3 .233 6 .200* .934 6 .611
menit ke 6 .200 6 .200* .878 6 .261
menit ke 9 .209 6 .200* .932 6 .596
menit ke 12 .229 6 .200* .914 6 .461
menit ke 15 .315 6 .063 .849 6 .156
L_1
menit ke 0 .250 6 .200* .894 6 .338
menit ke 3 .300 6 .097 .755 6 .022
menit ke 6 .315 6 .064 .874 6 .243
menit ke 9 .254 6 .200* .859 6 .187
menit ke 12 .272 6 .187 .850 6 .157
menit ke 15 .293 6 .118 .799 6 .058
L_5
menit ke 0 .242 6 .200* .931 6 .590
menit ke 3 .197 6 .200* .946 6 .705
menit ke 6 .229 6 .200* .901 6 .379
menit ke 9 .268 6 .200* .833 6 .113
menit ke 12 .290 6 .124 .810 6 .072
menit ke 15 .276 6 .171 .873 6 .238
L_10
menit ke 0 .197 6 .200* .970 6 .893
menit ke 3 .358 6 .015 .758 6 .024
menit ke 6 .279 6 .159 .830 6 .107
menit ke 9 .265 6 .200* .846 6 .146
menit ke 12 .277 6 .165 .830 6 .108
menit ke 15 .306 6 .083 .726 6 .012
*. This is a lower bound of the true significance.
a. Lilliefors Significance Correction
49
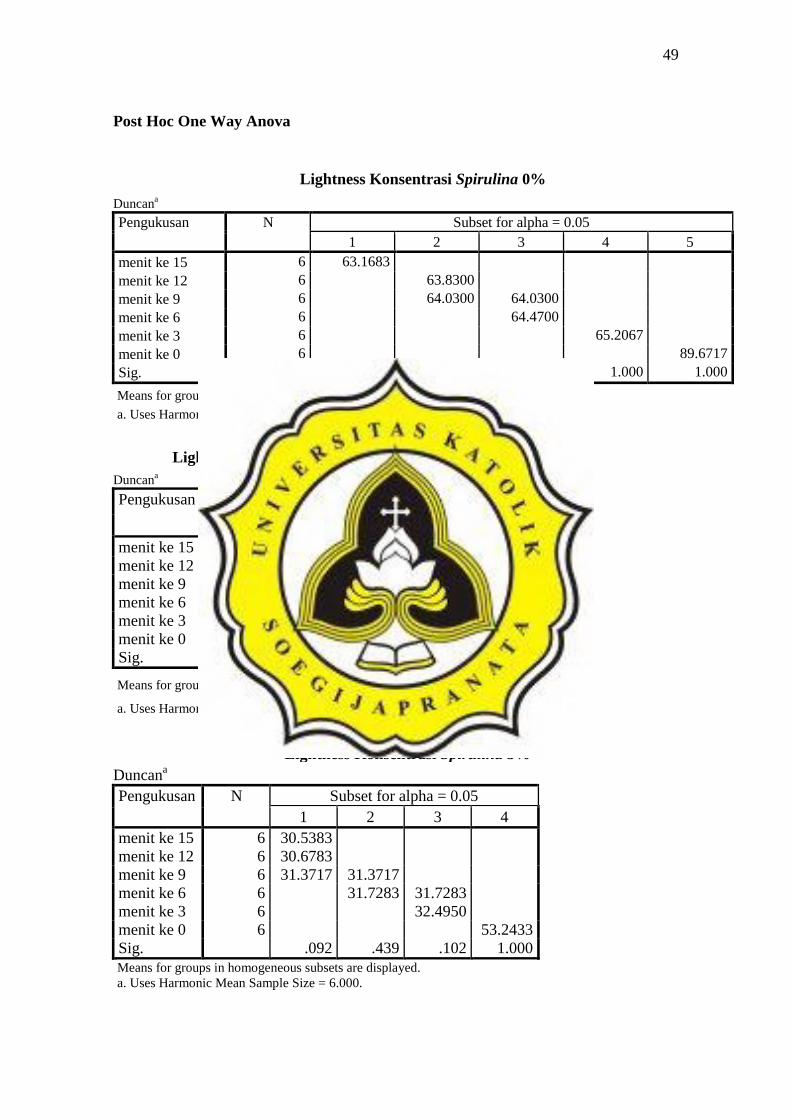
Post Hoc One Way Anova
Lightness Konsentrasi Spirulina 0%
Duncana
Pengukusan N Subset for alpha = 0.05
1 2 3 4 5
menit ke 15 6 63.1683 menit ke 12 6 63.8300 menit ke 9 6 64.0300 64.0300 menit ke 6 6 64.4700 menit ke 3 6 65.2067 menit ke 0 6 89.6717
Sig. 1.000 .489 .134 1.000 1.000
Means for groups in homogeneous subsets are displayed.
a. Uses Harmonic Mean Sample Size = 6.000.
Lighness Konsentrasi Spirulina 1%
Duncana
Pengukusan N Subset for alpha = 0.05
1 2
menit ke 15 6 44.8717
menit ke 12 6 45.5150
menit ke 9 6 45.7200
menit ke 6 6 46.2592
menit ke 3 6 47.5833
menit ke 0 6 72.5050
Sig. .070 1.000
Means for groups in homogeneous subsets are displayed.
a. Uses Harmonic Mean Sample Size = 6.000.
Lightness Konsentrasi Spirulina 5%
Duncana
Pengukusan N Subset for alpha = 0.05
1 2 3 4
menit ke 15 6 30.5383
menit ke 12 6 30.6783
menit ke 9 6 31.3717 31.3717
menit ke 6 6 31.7283 31.7283
menit ke 3 6 32.4950
menit ke 0 6 53.2433
Sig. .092 .439 .102 1.000
Means for groups in homogeneous subsets are displayed.
a. Uses Harmonic Mean Sample Size = 6.000.

50
Lightness Konsentrasi Spirulina 10%
Duncana
Pengukusan N Subset for alpha = 0.05
1 2 3
menit ke 15 6 27.3600
menit ke 12 6 27.5683
menit ke 9 6 28.0967
menit ke 6 6 28.8700 28.8700
menit ke 3 6 30.0050
menit ke 0 6 44.4317
Sig. .112 .190 1.000
Means for groups in homogeneous subsets are displayed.
a. Uses Harmonic Mean Sample Size = 6.000.
Uji Warna (a*)
Uji Normalitas
Tests of Normality
Pengukusan Kolmogorov-Smirnov
a Shapiro-Wilk
Statistic df Sig. Statistic df Sig.
a_0
menit ke 0 .262 6 .200* .895 6 .344
menit ke 3 .291 6 .122 .780 6 .038
menit ke 6 .181 6 .200* .936 6 .630
menit ke 9 .189 6 .200* .895 6 .346
menit ke 12 .352 6 .020 .829 6 .105
menit ke 15 .291 6 .121 .890 6 .318
a_1
menit ke 0 .214 6 .200* .936 6 .631
menit ke 3 .164 6 .200* .929 6 .570
menit ke 6 .252 6 .200* .920 6 .507
menit ke 9 .192 6 .200* .974 6 .919
menit ke 12 .376 6 .008 .666 6 .003
menit ke 15 .393 6 .004 .635 6 .001
a_5
menit ke 0 .301 6 .094 .830 6 .107
menit ke 3 .232 6 .200* .845 6 .143
menit ke 6 .223 6 .200* .943 6 .685
menit ke 9 .207 6 .200* .911 6 .444
menit ke 12 .177 6 .200* .946 6 .707
menit ke 15 .191 6 .200* .939 6 .654
a_10
menit ke 0 .236 6 .200* .950 6 .737
menit ke 3 .259 6 .200* .930 6 .578
menit ke 6 .252 6 .200* .931 6 .589
menit ke 9 .121 6 .200* .986 6 .976
menit ke 12 .180 6 .200* .942 6 .678
menit ke 15 .167 6 .200* .954 6 .773

51
*. This is a lower bound of the true significance.
a. Lilliefors Significance Correction
Post Hoc One Way Anova
a* Konsentrasi Spirulina 0%
Duncana
Pengukusan N Subset for alpha = 0.05
1 2 3 4
menit ke 15 6 -1.4867
menit ke 12 6 -1.4283
menit ke 9 6 -1.2733
menit ke 6 6 -1.2250
menit ke 3 6 -1.0850
menit ke 0 6 -.3133
Sig. .248 .337 1.000 1.000
Means for groups in homogeneous subsets are displayed.
a. Uses Harmonic Mean Sample Size = 6.000.
a* Konsentrasi Spirulina 1%
Duncana
Pengukusan N Subset for alpha = 0.05
1 2
menit ke 0 6 -5.8700
menit ke 3 6 -3.7050
menit ke 9 6 -3.4817
menit ke 6 6 -3.4733
menit ke 15 6 -3.3817
menit ke 12 6 -3.3233
Sig. 1.000 .093
Means for groups in homogeneous subsets are displayed.
a. Uses Harmonic Mean Sample Size = 6.000.
a* Konsentrasi Spirulina 5%
Duncana
Pengukusan N Subset for alpha = 0.05
1 2 3
menit ke 0 6 -8.1067
menit ke 3 6 -1.6183
menit ke 6 6 -1.3717 -1.3717
menit ke 9 6 -1.2900
menit ke 12 6 -1.2550
menit ke 15 6 -1.1633
Sig. 1.000 .094 .192
Means for groups in homogeneous subsets are displayed.
a. Uses Harmonic Mean Sample Size = 6.000.
52
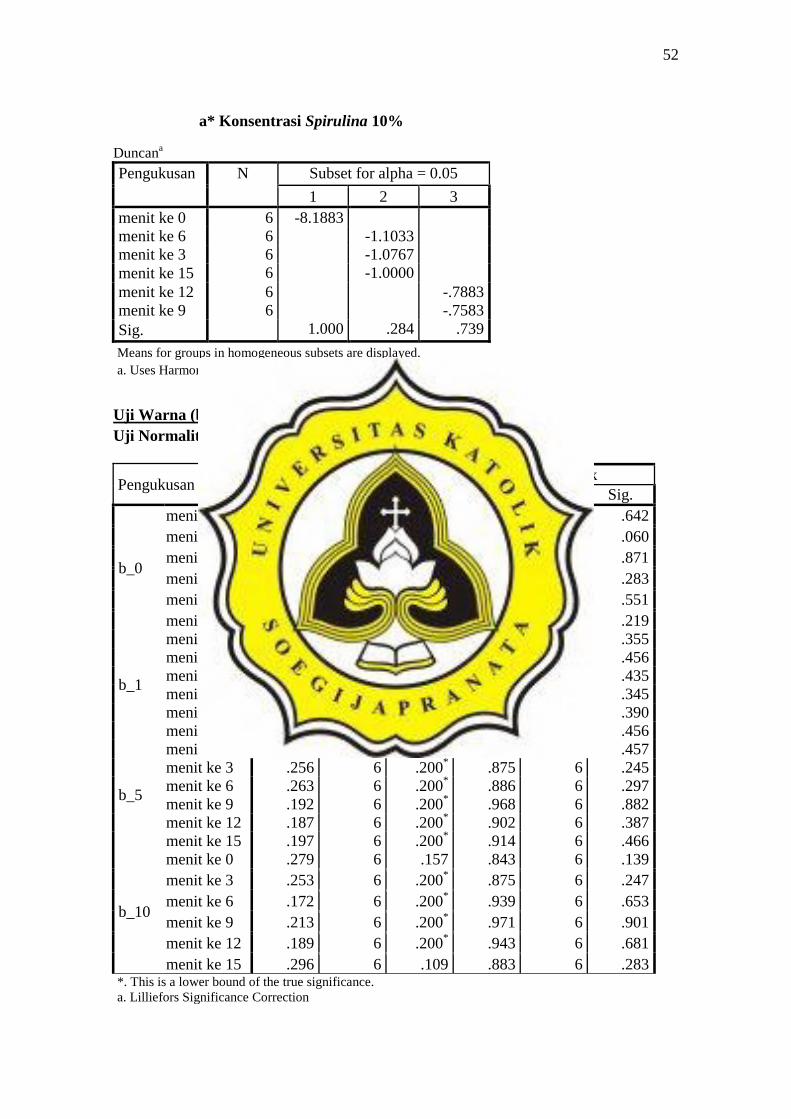
a* Konsentrasi Spirulina 10%
Duncana
Pengukusan N Subset for alpha = 0.05
1 2 3
menit ke 0 6 -8.1883
menit ke 6 6 -1.1033
menit ke 3 6 -1.0767
menit ke 15 6 -1.0000
menit ke 12 6 -.7883
menit ke 9 6 -.7583
Sig. 1.000 .284 .739
Means for groups in homogeneous subsets are displayed.
a. Uses Harmonic Mean Sample Size = 6.000.
Uji Warna (b*)
Uji Normalitas
Tests of Normality
Pengukusan Kolmogorov-Smirnov
a Shapiro-Wilk
Statistic df Sig. Statistic df Sig.
b_0
menit ke 0 .202 6 .200* .938 6 .642
menit ke 3 .265 6 .200* .801 6 .060
menit ke 6 .166 6 .200* .967 6 .871
menit ke 9 .294 6 .115 .883 6 .283
menit ke 12 .184 6 .200* .926 6 .551
menit ke 15 .307 6 .081 .868 6 .219
b_1
menit ke 0 .249 6 .200* .897 6 .355
menit ke 3 .236 6 .200* .913 6 .456
menit ke 6 .215 6 .200* .910 6 .435
menit ke 9 .251 6 .200* .895 6 .345
menit ke 12 .211 6 .200* .903 6 .390
menit ke 15 .182 6 .200* .913 6 .456
b_5
menit ke 0 .204 6 .200* .913 6 .457
menit ke 3 .256 6 .200* .875 6 .245
menit ke 6 .263 6 .200* .886 6 .297
menit ke 9 .192 6 .200* .968 6 .882
menit ke 12 .187 6 .200* .902 6 .387
menit ke 15 .197 6 .200* .914 6 .466
b_10
menit ke 0 .279 6 .157 .843 6 .139
menit ke 3 .253 6 .200* .875 6 .247
menit ke 6 .172 6 .200* .939 6 .653
menit ke 9 .213 6 .200* .971 6 .901
menit ke 12 .189 6 .200* .943 6 .681
menit ke 15 .296 6 .109 .883 6 .283 *. This is a lower bound of the true significance.
a. Lilliefors Significance Correction

53
Post Hoc One Way Anova
b* Konsentrasi Spirulina 0%
Duncana
Pengukusan N Subset for alpha = 0.05
1 2 3
menit ke 3 6 3.5150
menit ke 9 6 3.6133
menit ke 6 6 3.6683
menit ke 12 6 4.7550
menit ke 15 6 4.9900
menit ke 0 6 5.5700
Sig. .287 .088 1.000
Means for groups in homogeneous subsets are displayed.
a. Uses Harmonic Mean Sample Size = 6.000.
b* Konsentrasi Spirulina 1%
Duncana
Pengukusan N Subset for alpha = 0.05
1 2 3
menit ke 0 6 .3700
menit ke 6 6 3.4600
menit ke 3 6 3.4717
menit ke 12 6 3.5267
menit ke 9 6 3.6183
menit ke 15 6 4.3933
Sig. 1.000 .215 1.000
Means for groups in homogeneous subsets are displayed.
a. Uses Harmonic Mean Sample Size = 6.000.
b* Konsentrasi Spirulina 5%
Duncana
Pengukusan N Subset for alpha = 0.05
1 2 3 4
menit ke 0 6 -1.3300
menit ke 3 6 .5517
menit ke 9 6 .8617 .8617
menit ke 6 6 .8800 .8800
menit ke 15 6 .9683
menit ke 12 6 1.4000
Sig. 1.000 .068 .547 1.000
Means for groups in homogeneous subsets are displayed.
a. Uses Harmonic Mean Sample Size = 6.000.

54
b* Konsentrasi Spirulina 10%
Duncana
Pengukusan N Subset for alpha = 0.05
1 2
menit ke 0 6 -1.4783
menit ke 9 6 .3033
menit ke 3 6 .3283
menit ke 12 6 .3483
menit ke 6 6 .4467
menit ke 15 6 .4950
Sig. 1.000 .084
Means for groups in homogeneous subsets are displayed.
a. Uses Harmonic Mean Sample Size = 6.000.
Uji Tekstur
Uji Normalitas

55
Post Hoc One Way Anova
Kadar Air
Uji Normalitas

56
Post Hoc One Way Anova
57
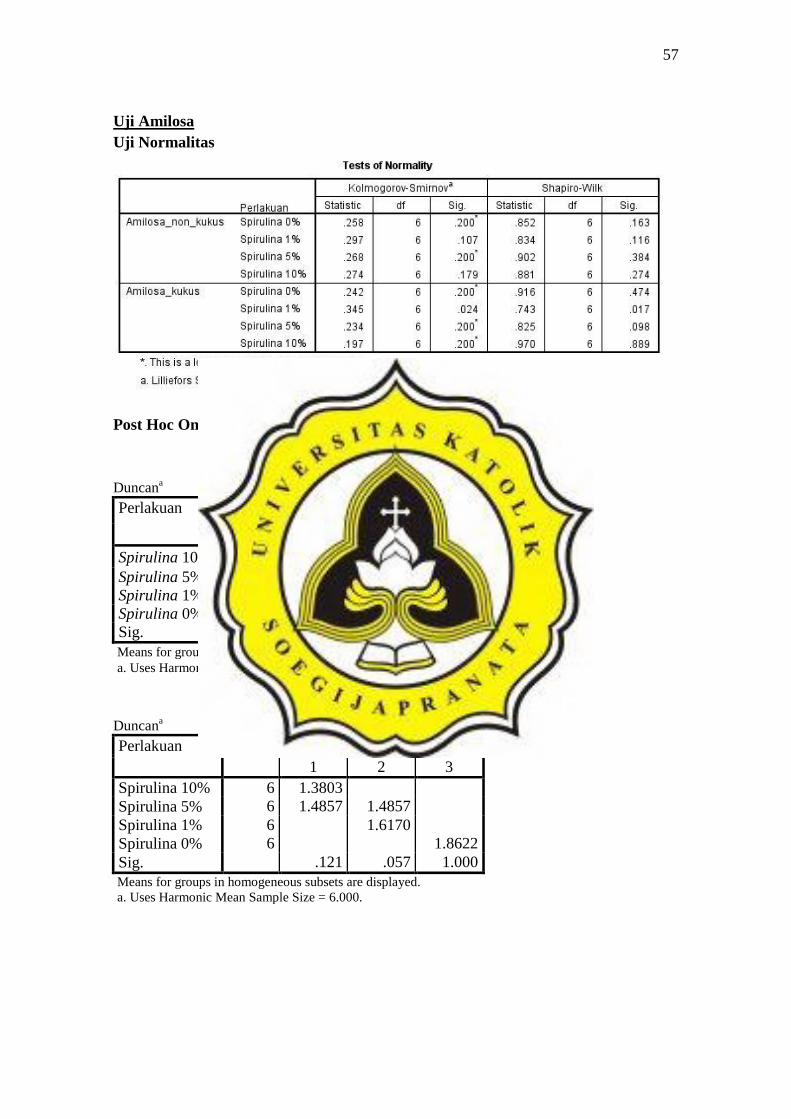
Uji Amilosa
Uji Normalitas
Post Hoc One Way Anova
Amilosa_non_kukus Duncan
a
Perlakuan N Subset for alpha = 0.05
1
Spirulina 10% 6 2.4740
Spirulina 5% 6 2.4810
Spirulina 1% 6 2.5227
Spirulina 0% 6 2.6910
Sig. .082
Means for groups in homogeneous subsets are displayed.
a. Uses Harmonic Mean Sample Size = 6.000.
Amilosa_kukus Duncan
a
Perlakuan N Subset for alpha = 0.05
1 2 3
Spirulina 10% 6 1.3803
Spirulina 5% 6 1.4857 1.4857
Spirulina 1% 6 1.6170
Spirulina 0% 6 1.8622
Sig. .121 .057 1.000
Means for groups in homogeneous subsets are displayed.
a. Uses Harmonic Mean Sample Size = 6.000.
58
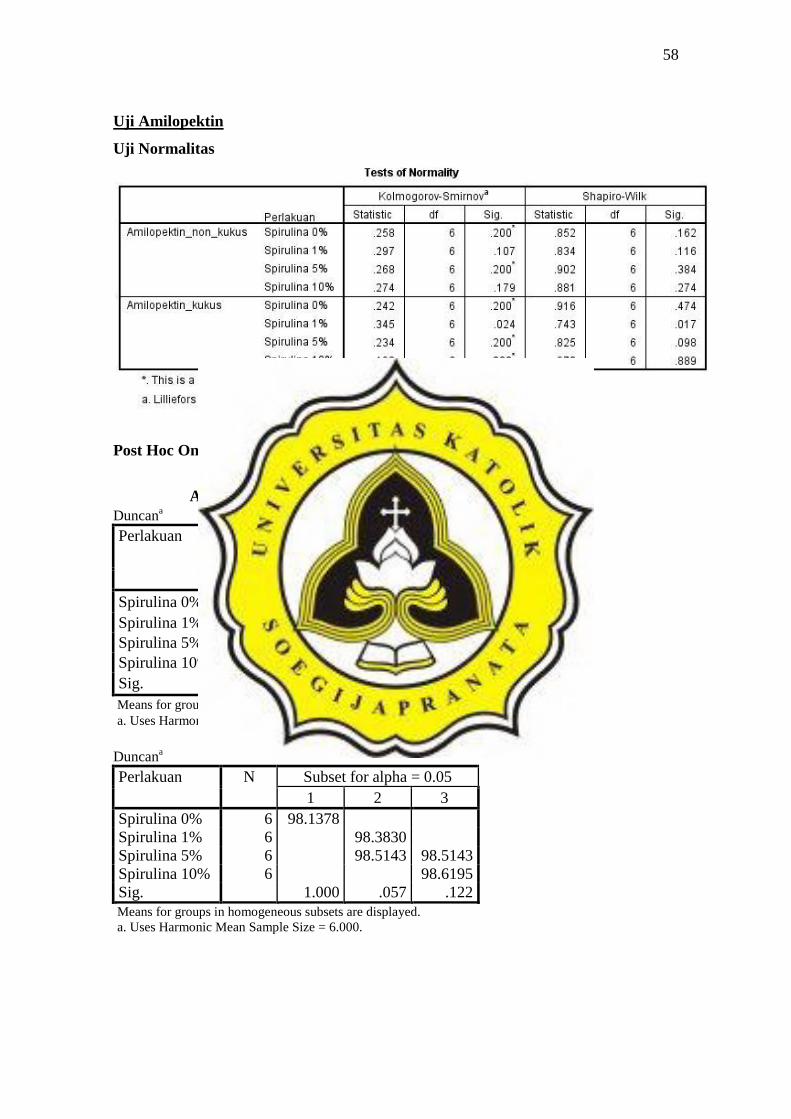
Uji Amilopektin
Uji Normalitas
Post Hoc One Way Anova
Amilopektin_non_kukus
Duncana
Perlakuan N Subset for alpha
= 0.05
1
Spirulina 0% 6 97.3090
Spirulina 1% 6 97.4773
Spirulina 5% 6 97.5190
Spirulina 10% 6 97.5260
Sig. .082
Means for groups in homogeneous subsets are displayed.
a. Uses Harmonic Mean Sample Size = 6.000.
Amilopektin_kukus Duncan
a
Perlakuan N Subset for alpha = 0.05
1 2 3
Spirulina 0% 6 98.1378
Spirulina 1% 6 98.3830
Spirulina 5% 6 98.5143 98.5143
Spirulina 10% 6 98.6195
Sig. 1.000 .057 .122
Means for groups in homogeneous subsets are displayed.
a. Uses Harmonic Mean Sample Size = 6.000.

59
Uji Aktifitas Antioksidan
Uji Normalitas
Post Hoc One Way Anova
Antioksidan_non_kukus Duncan
a
Perlakuan N Subset for alpha = 0.05
1 2 3 4
Spirulina 0% 6 2.4811
Spirulina 1% 6 3.6601
Spirulina 5% 6 5.3821
Spirulina 10% 6 6.9683
Sig. 1.000 1.000 1.000 1.000
Means for groups in homogeneous subsets are displayed.
a. Uses Harmonic Mean Sample Size = 6.000.
Antioksidan_kukus Duncan
a
Perlakuan N Subset for alpha = 0.05
1 2 3 4
Spirulina 0% 6 .9932
Spirulina 1% 6 2.4900
Spirulina 5% 6 4.1633
Spirulina 10% 6 5.8700
Sig. 1.000 1.000 1.000 1.000
Means for groups in homogeneous subsets are displayed.
a. Uses Harmonic Mean Sample Size = 6.000.

60
Uji Protein
Uji Normalitas
Post Hoc One Way Anova
Korelasi Kandungan Amilosa dan Amilopektin terhadap Viskositas Adonan
Sebelum Pengukusan

61
Korelasi Kandungan Amilosa dan Amilopektin dengan Tekstur Setelah
Pengukusan
Korelasi Kandungan Antioksidan dengan Warna L, a*, b* Adonan Sebelum
Pengukusan

62
Korelasi Kandungan Antioksidan dengan Warna L, a*, b* Adonan Setelah
Pengukusan
Korelasi Tekstur dengan Kandungan Protein