50nm 200nm Secondary ´ Tertiary ´ Matrix Atom probe studies of linear cooled samples (Rene 104)...
10
50nm 200nm Secondary ´ Tertiary ´ Matrix Atom probe studies of linear cooled samples (Rene 104) - some observations Motivation for work: •Understand effects of cooling rate on microstructure •Microstructural changes can induce changes in deformation mechanisms Typical 3D atom probe reconstruction Rene 104 Ni Co Cr Al Ti Ta B C Nb Mo W N ominal 49 20.08 14.34 7.27 4.37 0.73 0.13 0.24 0.55 2.23 0.64 ´ 63 9.90 2.09 11.66 8.72 1.58 0.00 0.00 1.05 0.83 0.50 36 29.97 26.37 2.18 0.61 0.13 0.00 0.00 0.13 3.80 0.80 30 o F/min 250 o F/min 400 o F/min
-
Upload
jordan-oneal -
Category
Documents
-
view
222 -
download
2
Transcript of 50nm 200nm Secondary ´ Tertiary ´ Matrix Atom probe studies of linear cooled samples (Rene 104)...

50nm
200nm
Qu
ickTim
e™
and
aTIF
F (U
nco
mpre
sse
d) d
eco
mp
resso
rare
need
ed to
see th
is pic
ture
.
Secondary ´
Tertiary ´ Matrix
Atom probe studies of linear cooled samples (Rene 104) - some observations
Motivation for work:
•Understand effects of cooling rate on microstructure
•Microstructural changes can induce changes in deformation mechanisms Typical 3D atom
probe reconstruction
Rene 104 Ni Co Cr Al Ti Ta B C Nb Mo W Nominal 49 20.08 14.34 7.27 4.37 0.73 0.13 0.24 0.55 2.23 0.64 ´ 63 9.90 2.09 11.66 8.72 1.58 0.00 0.00 1.05 0.83 0.50 36 29.97 26.37 2.18 0.61 0.13 0.00 0.00 0.13 3.80 0.80
30oF/min 250oF/min 400oF/min
0
10
20
30
40
50
60
70
-10 -8 -6 -4 -2 0 2 4Distance [nm]
0
0.5
1
1.5
2
2.5
3
3.5
-10 -8 -6 -4 -2 0 2 4Distance [nm]
0
10
20
30
40
50
60
70
-10 -8 -6 -4 -2 0 2 4Distance [nm]
0
0.5
1
1.5
2
2.5
3
3.5
-10 -8 -6 -4 -2 0 2 4Distance [nm]
0
0.5
1
1.5
2
2.5
3
3.5
-10 -8 -6 -4 -2 0 2 4
Element concentration (at. %)
Distance (nm)
(precipitate)
Ni
Co
Cr
Al
Ti
Ta
W
Mo
0
10
20
30
40
50
60
70
-10 -8 -6 -4 -2 0 2 4
Element concentration (at. %)
Distance (nm)
Proximity histograms (proxigrams)
0.1
1
10
Ni Co Cr Al Ti Ta Nb Mo
Partitioning ratio
250oF/min
mat
rix
p
has
e
Which elements in to which phase
•Partitioning of an element to an element can be different of different alloys (Sudbrak et al’s work)
Partitioning ratio
Used on non-planar interfaces
0
0.5
1
1.5
2
2.5
3
3.5
-10 -8 -6 -4 -2 0 2 4Distance [nm]
0
0.5
1
1.5
2
2.5
3
3.5
-10 -8 -6 -4 -2 0 2 4Distance [nm]
0
0.5
1
1.5
2
2.5
3
3.5
-10 -8 -6 -4 -2 0 2 4
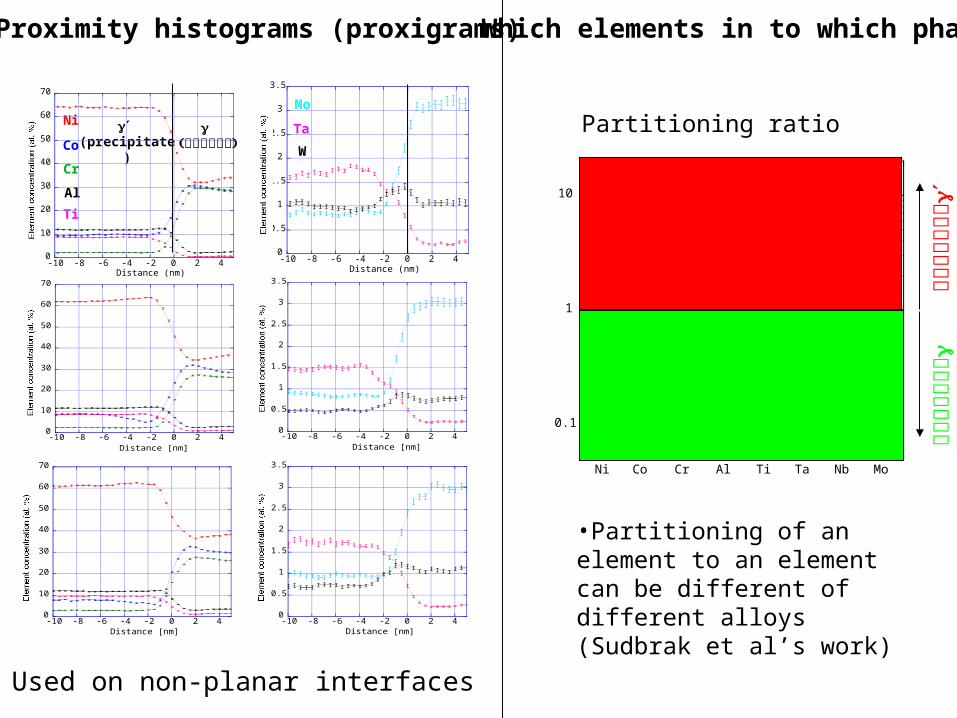
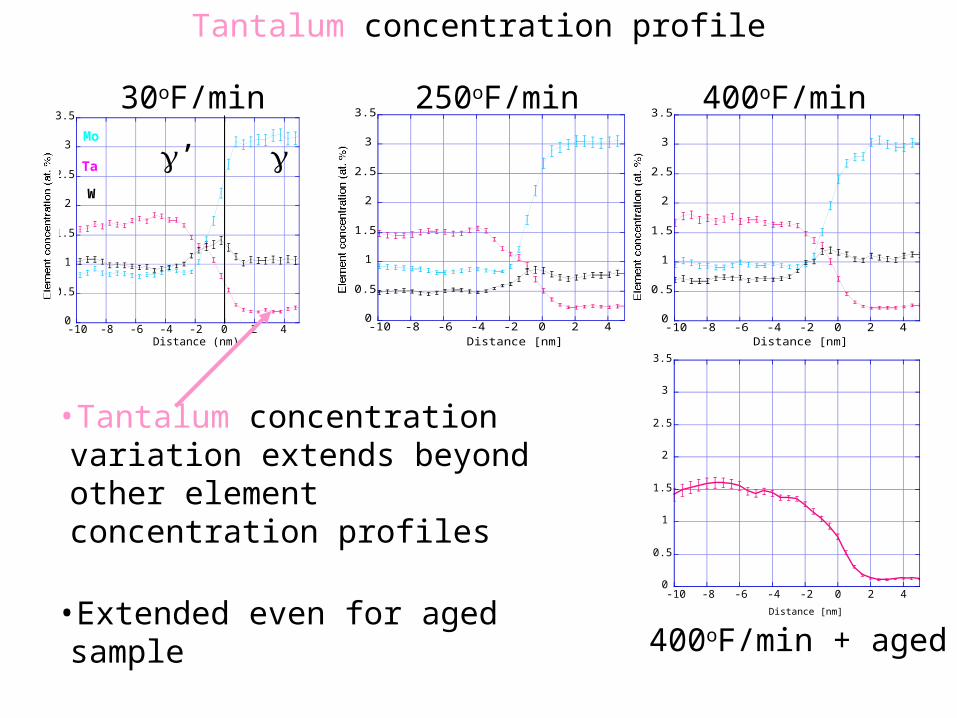
Element concentration (at. %)
Distance (nm)
Ta
W
Mo
Tantalum concentration profile
400oF/min250oF/min30oF/min
’
•Tantalum concentration variation extends beyond other element concentration profiles
•Extended even for aged sample
•Also seen by Sudbrack et al with Cr 400oF/min + aged
0
0.5
1
1.5
2
2.5
3
3.5
-10 -8 -6 -4 -2 0 2 4
Distance [nm]
0
0.5
1
1.5
2
2.5
3
3.5
-10 -8 -6 -4 -2 0 2 4Distance [nm]
0
0.5
1
1.5
2
2.5
3
3.5
-10 -8 -6 -4 -2 0 2 4Distance [nm]
0
0.5
1
1.5
2
2.5
3
3.5
-10 -8 -6 -4 -2 0 2 4
Element concentration (at. %)
Distance (nm)
Ta
W
Mo
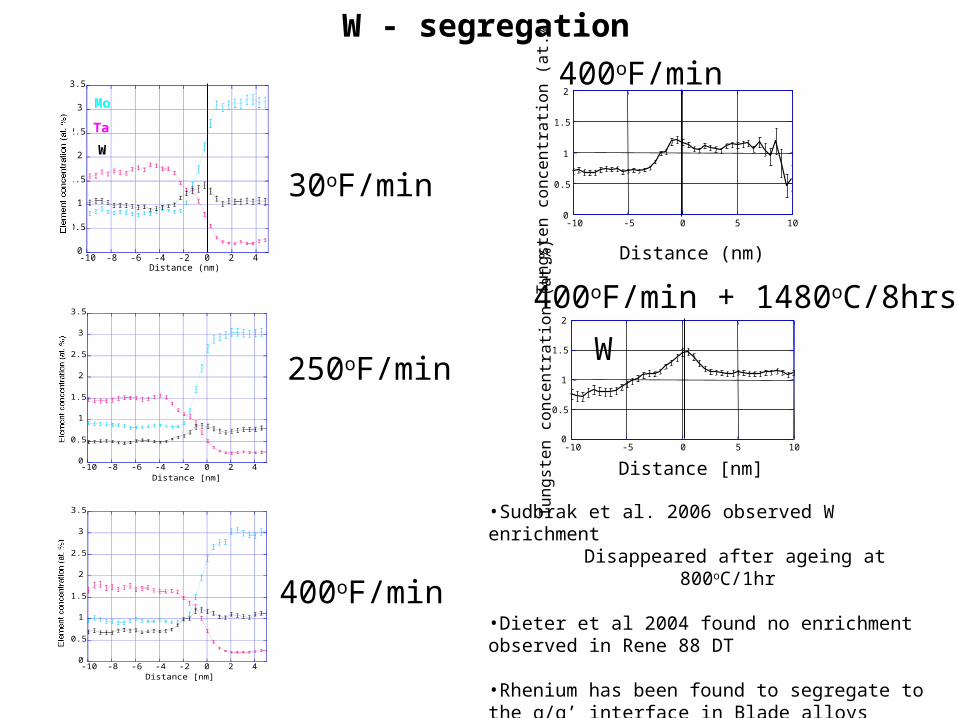
W - segregation
400oF/min
250oF/min
30oF/min
400oF/min + 1480oC/8hrs
0
0.5
1
1.5
2
-10 -5 0 5 10
Tu
ng
ste
n c
on
cen
tra
tion
(a
t.%
)
Distance (nm)
0
0.5
1
1.5
2
-10 -5 0 5 10
Tu
ng
ste
n c
on
cen
tra
tion
(a
t.%
)
Distance [nm]
W
400oF/min
•Sudbrak et al. 2006 observed W enrichmentDisappeared after ageing at 800oC/1hr
•Dieter et al 2004 found no enrichment observed in Rene 88 DT
•Rhenium has been found to segregate to the g/g’ interface in Blade alloys

0
10
20
30
40
50
60
70
80
-15 -10 -5 0 5
cNicCrcTi
Distance [nm]
0
10
20
30
40
50
60
70
80
-10 -5 0 5 10
cNicTicCr
Distance [nm]
Compositional profile of tertiary ’ (from 30 precipitates)
Compositional profile across a secondary ’ and matrix interface
Results indicate a wider /’ interface for the tertiary ’ than for the larger secondary ’
’
’
Interface width

Contour plot of ISF energy versus at.% concentration of Co and Cr
Total Co and Cr concentration ~50at.% in -matrix (a lot) more than NiMatrix contains 30 at. Cr and 25 at.% Co.
Based on old experimental results from Beeston et al, Smallman al and Harris et al
Significance of phase composition
ISF energy is around 25mJ/m2
Al
0
0.1
0.2
0.3
0.4
0.5
0.6
0.7
0.8
650 655 660 665 670 675 680
NiAlTi
Distance (Angstroms)
Ti
Ni
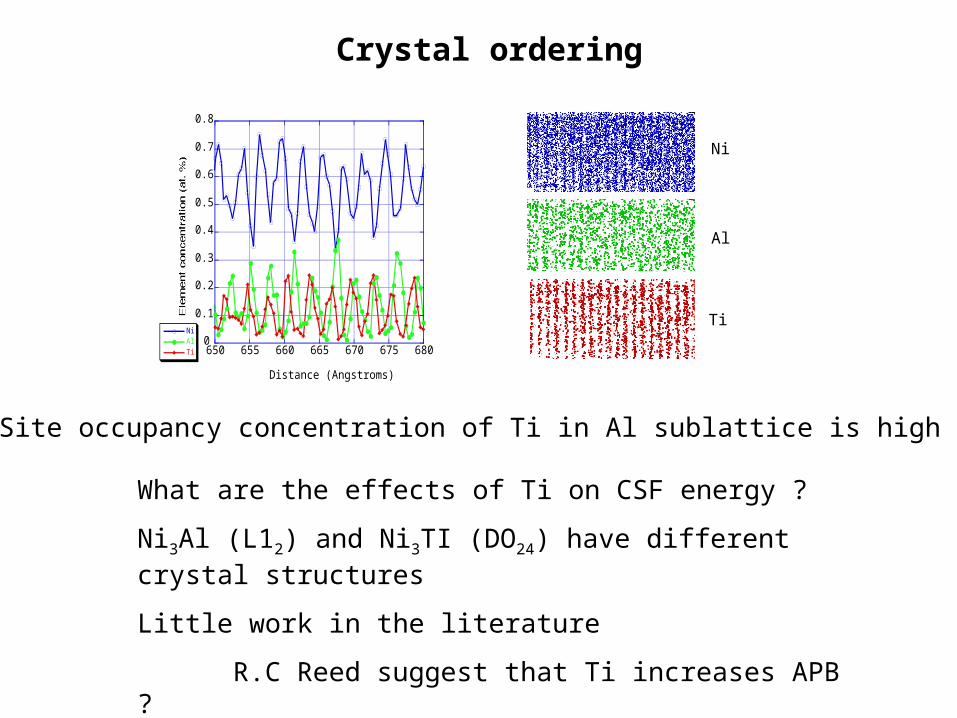
Crystal ordering
Site occupancy concentration of Ti in Al sublattice is high
What are the effects of Ti on CSF energy ?
Ni3Al (L12) and Ni3TI (DO24) have different crystal structures
Little work in the literature
R.C Reed suggest that Ti increases APB ?
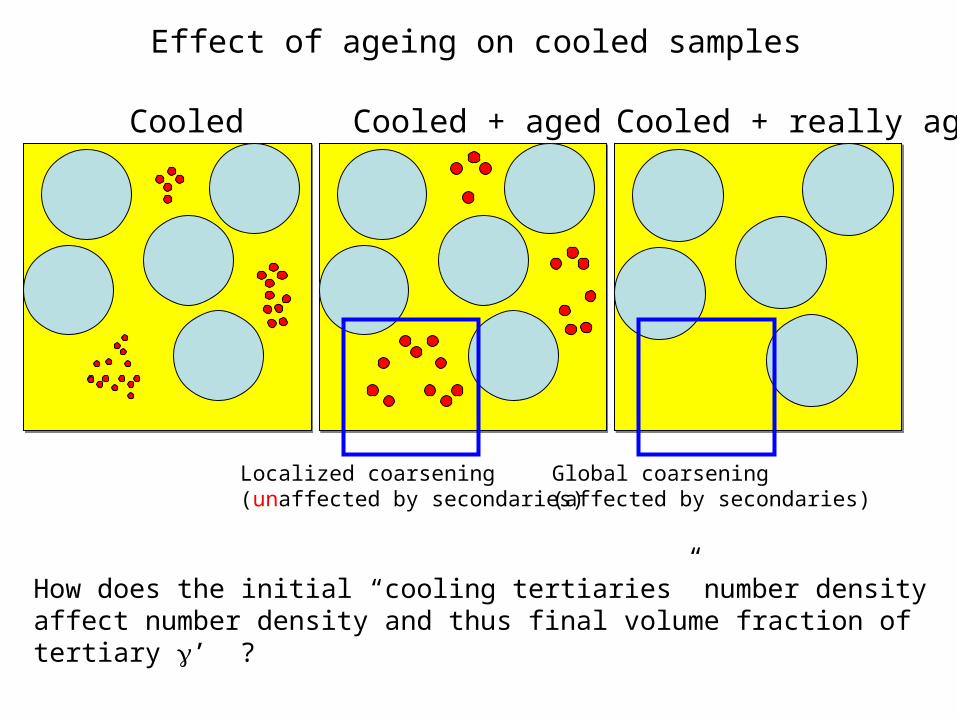
Cooled Cooled + aged Cooled + really aged
Localized coarsening(unaffected by secondaries)
Global coarsening(affected by secondaries)
Effect of ageing on cooled samples
How does the initial “cooling tertiaries” number density affect number density and thus final volume fraction of tertiary ’ ?

Questions and possible future work with atom probe tomography
• What are the implications of diffuse / ’ interfaces ?• How can this and other parameters be used in models
• How significant and prevalent are these ultra ultra fine (~1nm) ’ precipitates w.r.t. creep?
• How stable are these ’ precipitates ?• Are they sub or supercritical nuclei ?
• Can altering the cooling profile (linear. Non-linear) alter the Vf and number density of the tertiary ’ precipitates?
• What are the affects of Ti of CSF energy
•Apply atom probe analysis to stacking faultsIs there segregation at these faults?
•Isothermal ageing studies to understand:
growth kinetics (for phase-field group)
Critical nucleation size