502331 capital budgeting techniques pp13
65
13.1 Van Horne and Wachowicz, Fundamentals of Financial Management, 13th edition. © Pearson Education Limited 2009. Created by Gregory Kuhlemeyer. Chapter 13 Chapter 13 Capital Budgeting Capital Budgeting Techniques Techniques
-
Upload
naveed-hussain-shah -
Category
Documents
-
view
140 -
download
6
Transcript of 502331 capital budgeting techniques pp13

13.1 Van Horne and Wachowicz, Fundamentals of Financial Management, 13th edition. © Pearson Education Limited 2009. Created by Gregory Kuhlemeyer.
Chapter 13Chapter 13
Capital Budgeting Capital Budgeting TechniquesTechniques

13.2 Van Horne and Wachowicz, Fundamentals of Financial Management, 13th edition. © Pearson Education Limited 2009. Created by Gregory Kuhlemeyer.
After Studying Chapter 13, After Studying Chapter 13, you should be able to:you should be able to:
1. Understand the payback period (PBP) method of project evaluation and selection, including its: (a) calculation; (b) acceptance criterion; (c) advantages and disadvantages; and (d) focus on liquidity rather than profitability.
2. Understand the three major discounted cash flow (DCF) methods of project evaluation and selection – internal rate of return (IRR), net present value (NPV), and profitability index (PI).
3. Explain the calculation, acceptance criterion, and advantages (over the PBP method) for each of the three major DCF methods.
4. Define, construct, and interpret a graph called an “NPV profile.”
5. Understand why ranking project proposals on the basis of IRR, NPV, and PI methods “may” lead to conflicts in rankings.
6. Describe the situations where ranking projects may be necessary and justify when to use either IRR, NPV, or PI rankings.
7. Understand how “sensitivity analysis” allows us to challenge the single-point input estimates used in traditional capital budgeting analysis.
8. Explain the role and process of project monitoring, including “progress reviews” and “post-completion audits.”

13.3 Van Horne and Wachowicz, Fundamentals of Financial Management, 13th edition. © Pearson Education Limited 2009. Created by Gregory Kuhlemeyer.
Capital Budgeting Capital Budgeting TechniquesTechniques
• Project Evaluation and Selection
• Potential Difficulties
• Capital Rationing
• Project Monitoring
• Post-Completion Audit

13.4 Van Horne and Wachowicz, Fundamentals of Financial Management, 13th edition. © Pearson Education Limited 2009. Created by Gregory Kuhlemeyer.
Project Evaluation: Project Evaluation: Alternative MethodsAlternative Methods
• Payback Period (PBP)
• Internal Rate of Return (IRR)
• Net Present Value (NPV)
• Profitability Index (PI)
• Refer to the additional PowerPoint slides and the Excel spreadsheet “VW13E-13b.xlsx” for computer-based solutions.

13.5 Van Horne and Wachowicz, Fundamentals of Financial Management, 13th edition. © Pearson Education Limited 2009. Created by Gregory Kuhlemeyer.
Proposed Project DataProposed Project Data
Julie Miller is evaluating a new project for her firm, Basket Wonders (BW).
She has determined that the after-tax cash flows for the project will be
$10,000; $12,000; $15,000; $10,000; and $7,000, respectively, for each of
the Years 1 through 5. The initial cash outlay will be $40,000.

13.6 Van Horne and Wachowicz, Fundamentals of Financial Management, 13th edition. © Pearson Education Limited 2009. Created by Gregory Kuhlemeyer.
Independent ProjectIndependent Project
• IndependentIndependent – A project whose acceptance (or rejection) does not prevent the acceptance of other projects under consideration.
• For this project, assume that it is independent of any other potential projects that Basket Wonders may undertake.

13.7 Van Horne and Wachowicz, Fundamentals of Financial Management, 13th edition. © Pearson Education Limited 2009. Created by Gregory Kuhlemeyer.
Payback Period (PBP)Payback Period (PBP)
PBPPBP is the period of time required for the cumulative
expected cash flows from an investment project to equal the
initial cash outflow.
PBPPBP is the period of time required for the cumulative
expected cash flows from an investment project to equal the
initial cash outflow.
0 1 2 3 4 5
–40 K 10 K 12 K 15 K 10 K 7 K

13.8 Van Horne and Wachowicz, Fundamentals of Financial Management, 13th edition. © Pearson Education Limited 2009. Created by Gregory Kuhlemeyer.
(c)10 K 22 K 37 K 47 K 54 K
Payback Solution (#1)Payback Solution (#1)
PBPPBP = a + ( b – c ) / d= 3 + (40 – 37) / 10= 3 + (3) / 10= 3.3 Years3.3 Years
0 1 2 3 4 5
–40 K 10 K 12 K 15 K 10 K 7 K
CumulativeInflows
(a)
(-b) (d)

13.9 Van Horne and Wachowicz, Fundamentals of Financial Management, 13th edition. © Pearson Education Limited 2009. Created by Gregory Kuhlemeyer.
Payback Solution (#2)Payback Solution (#2)
PBPPBP = 3 + ( 3K ) / 10K= 3.3 Years3.3 Years
Note: Take absolute value of last negative cumulative cash flow value.
CumulativeCash Flows
–40 K 10 K 12 K 15 K 10 K 7 K
0 1 2 3 4 5
–40 K –30 K –18 K –3 K 7 K 14 K

13.10 Van Horne and Wachowicz, Fundamentals of Financial Management, 13th edition. © Pearson Education Limited 2009. Created by Gregory Kuhlemeyer.
PBP Acceptance CriterionPBP Acceptance Criterion
Yes! The firm will receive back the initial cash outlay in less than 3.5 years. [3.3 Years < 3.5 Year Max.]
The management of Basket Wonders has set a maximum PBP of 3.5 years for projects of this type.
Should this project be accepted?
13.11 Van Horne and Wachowicz, Fundamentals of Financial Management, 13th edition. © Pearson Education Limited 2009. Created by Gregory Kuhlemeyer.
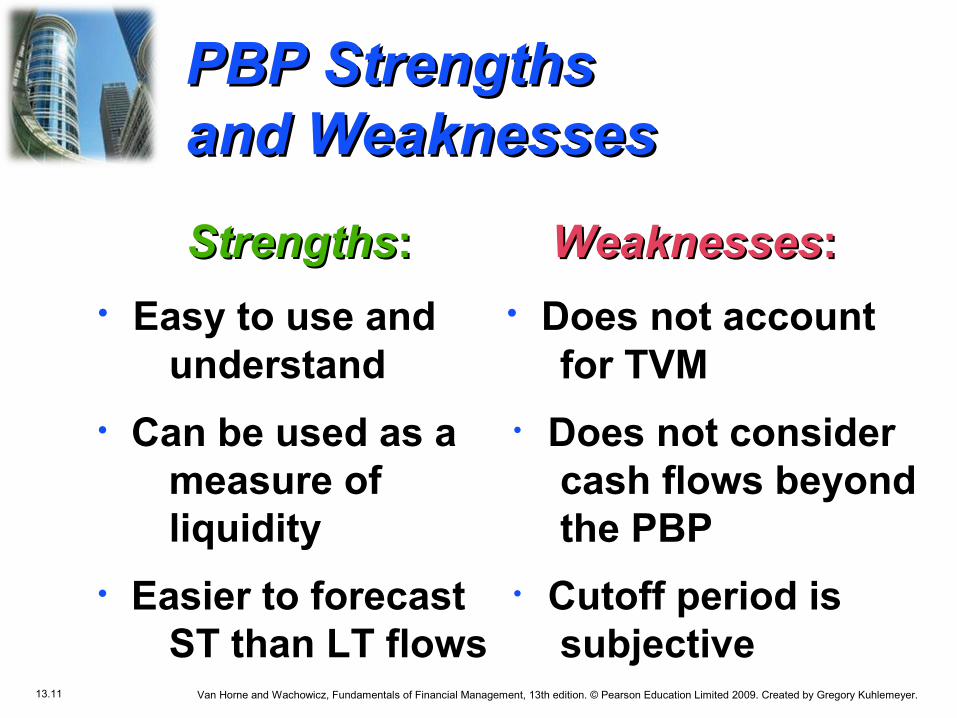
PBP Strengths PBP Strengths and Weaknessesand Weaknesses
StrengthsStrengths::
• Easy to use and understand
• Can be used as a measure of liquidity
• Easier to forecast ST than LT flows
WeaknessesWeaknesses::
• Does not accountfor TVM
• Does not consider cash flows beyond the PBP
• Cutoff period is subjective
13.12 Van Horne and Wachowicz, Fundamentals of Financial Management, 13th edition. © Pearson Education Limited 2009. Created by Gregory Kuhlemeyer.
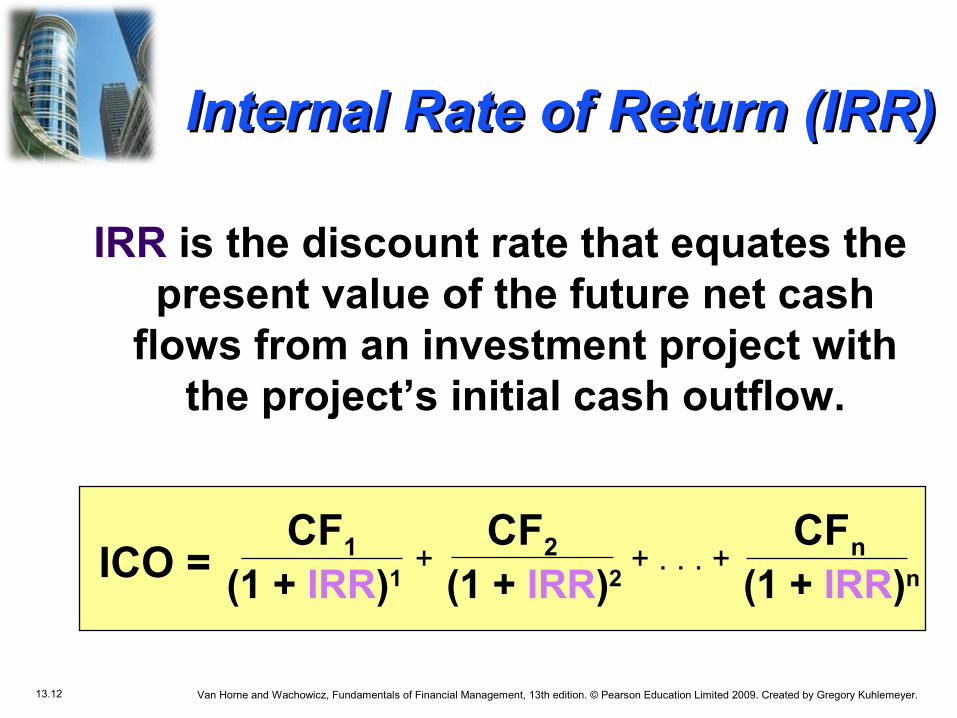
Internal Rate of Return (IRR)Internal Rate of Return (IRR)
IRR is the discount rate that equates the present value of the future net cash
flows from an investment project with the project’s initial cash outflow.
CF1 CF2 CFn (1 + IRR)1 (1 + IRR)2 (1 + IRR)n
+ . . . ++ICO =

13.13 Van Horne and Wachowicz, Fundamentals of Financial Management, 13th edition. © Pearson Education Limited 2009. Created by Gregory Kuhlemeyer.
$15,000 $10,000 $7,000
IRR SolutionIRR Solution
$10,000 $12,000
(1+IRR)1 (1+IRR)2
Find the interest rate (IRR) that causes the discounted cash flows to equal $40,000.
+ +
++$40,000 =
(1+IRR)3 (1+IRR)4 (1+IRR)5

13.14 Van Horne and Wachowicz, Fundamentals of Financial Management, 13th edition. © Pearson Education Limited 2009. Created by Gregory Kuhlemeyer.
IRR Solution (Try 10%)IRR Solution (Try 10%)
$40,000$40,000 = $10,000(PVIF10%,1) + $12,000(PVIF10%,2) +$15,000(PVIF10%,3) + $10,000(PVIF10%,4) + $
7,000(PVIF10%,5)
$40,000$40,000 = $10,000(0.909) + $12,000(0.826) + $15,000(0.751) + $10,000(0.683) + $ 7,000(0.621)
$40,000$40,000 = $9,090 + $9,912 + $11,265 + $6,830 + $4,347
= $41,444$41,444 [[Rate is too low!!Rate is too low!!]]
13.15 Van Horne and Wachowicz, Fundamentals of Financial Management, 13th edition. © Pearson Education Limited 2009. Created by Gregory Kuhlemeyer.
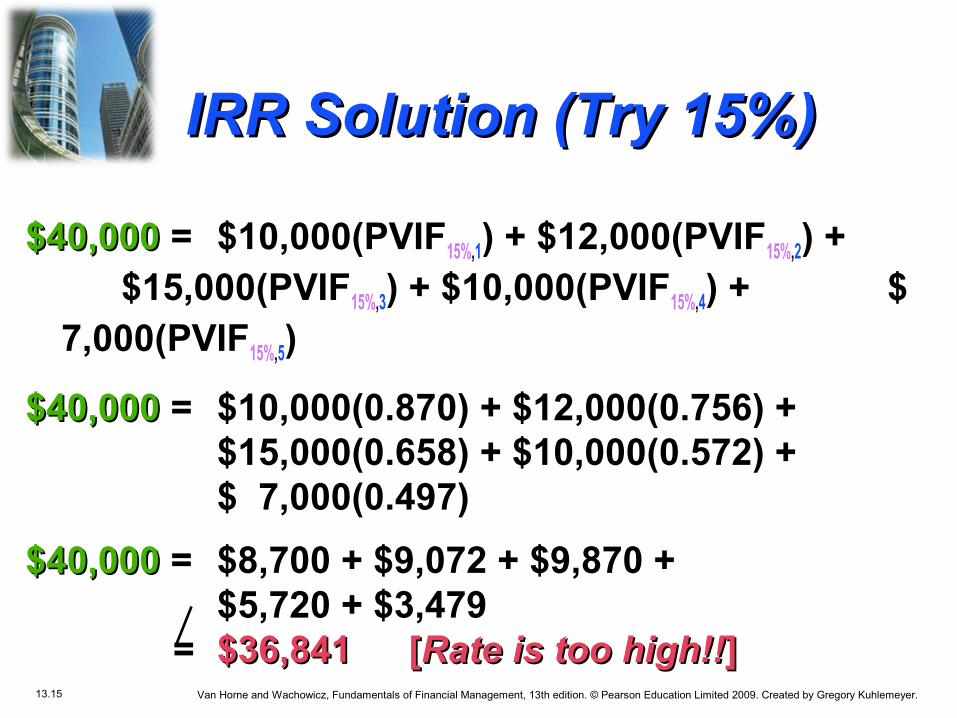
IRR Solution (Try 15%)IRR Solution (Try 15%)
$40,000$40,000 = $10,000(PVIF15%,1) + $12,000(PVIF15%,2) + $15,000(PVIF15%,3) + $10,000(PVIF15%,4) + $
7,000(PVIF15%,5)
$40,000$40,000 = $10,000(0.870) + $12,000(0.756) + $15,000(0.658) + $10,000(0.572) + $ 7,000(0.497)
$40,000$40,000 = $8,700 + $9,072 + $9,870 + $5,720 + $3,479
= $36,841$36,841 [[Rate is too high!!Rate is too high!!]]

13.16 Van Horne and Wachowicz, Fundamentals of Financial Management, 13th edition. © Pearson Education Limited 2009. Created by Gregory Kuhlemeyer.
0.10 $41,444
0.05 IRR $40,000 $4,603
0.15 $36,841
X $1,4440.05 $4,603
IRR Solution (Interpolate)IRR Solution (Interpolate)
$1,444X
=

13.17 Van Horne and Wachowicz, Fundamentals of Financial Management, 13th edition. © Pearson Education Limited 2009. Created by Gregory Kuhlemeyer.
0.10 $41,444
0.05 IRR $40,000 $4,603
0.15 $36,841
X $1,4440.05 $4,603
IRR Solution (Interpolate)IRR Solution (Interpolate)
$1,444X
=

13.18 Van Horne and Wachowicz, Fundamentals of Financial Management, 13th edition. © Pearson Education Limited 2009. Created by Gregory Kuhlemeyer.
0.10 $41,444
0.05 IRR $40,000 $4,603
0.15 $36,841
($1,444)(0.05) $4,603
IRR Solution (Interpolate)IRR Solution (Interpolate)
$1,444X
X = X = 0.0157
IRR = 0.10 + 0.0157 = 0.1157 or 11.57%
13.19 Van Horne and Wachowicz, Fundamentals of Financial Management, 13th edition. © Pearson Education Limited 2009. Created by Gregory Kuhlemeyer.
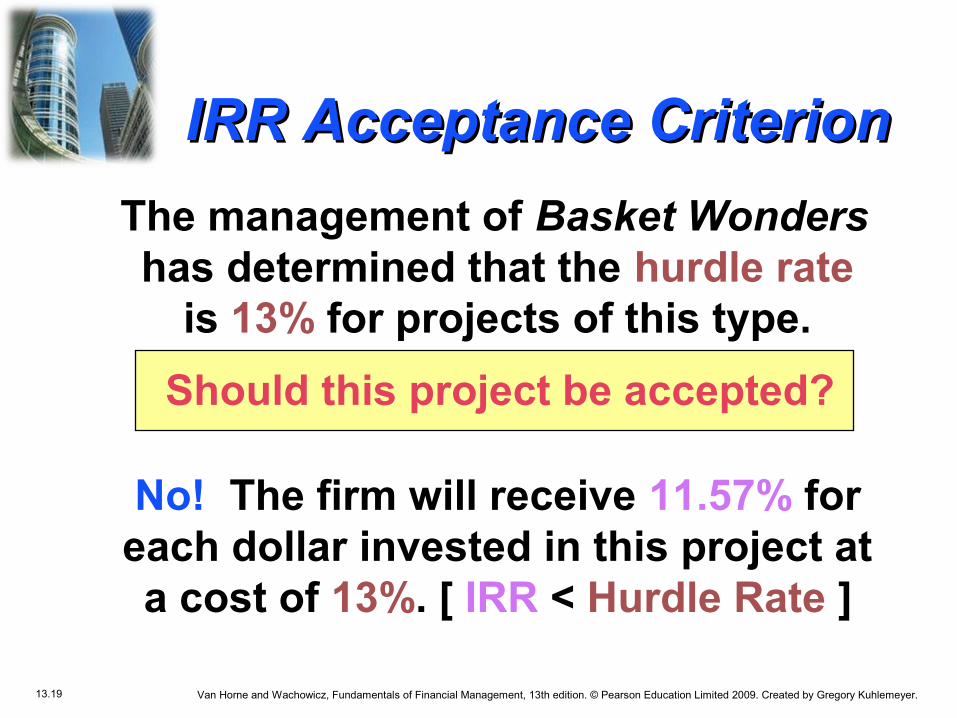
IRR Acceptance CriterionIRR Acceptance Criterion
No! The firm will receive 11.57% for each dollar invested in this project at a cost of 13%. [ IRR < Hurdle Rate ]
The management of Basket Wonders has determined that the hurdle rate
is 13% for projects of this type.
Should this project be accepted?
13.20 Van Horne and Wachowicz, Fundamentals of Financial Management, 13th edition. © Pearson Education Limited 2009. Created by Gregory Kuhlemeyer.
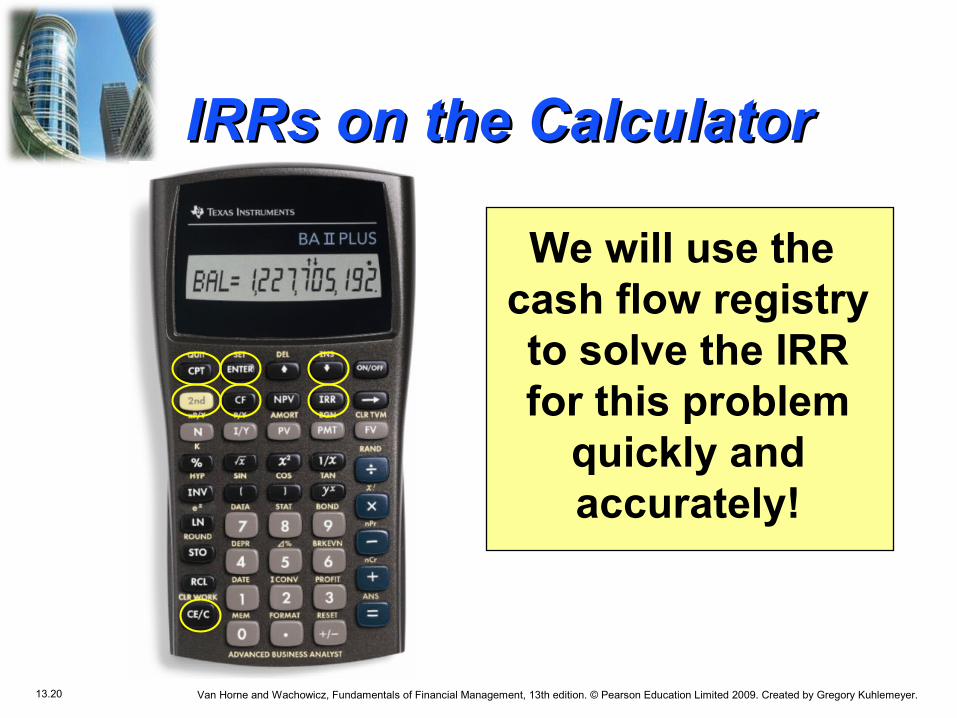
IRRs on the CalculatorIRRs on the Calculator
We will use the cash flow registry to solve the IRR for this problem
quickly and accurately!

13.21 Van Horne and Wachowicz, Fundamentals of Financial Management, 13th edition. © Pearson Education Limited 2009. Created by Gregory Kuhlemeyer.
Actual IRR Solution Using Actual IRR Solution Using Your Financial CalculatorYour Financial Calculator
Steps in the ProcessStep 1: Press CF key
Step 2: Press 2nd CLR Work keys
Step 3: For CF0 Press -40000 Enter ↓ keys
Step 4: For C01 Press 10000 Enter ↓ keys
Step 5: For F01 Press 1 Enter ↓ keys
Step 6: For C02 Press 12000 Enter ↓ keys
Step 7: For F02 Press 1 Enter ↓ keys
Step 8: For C03 Press 15000 Enter ↓ keys
Step 9: For F03 Press 1 Enter ↓ keys

13.22 Van Horne and Wachowicz, Fundamentals of Financial Management, 13th edition. © Pearson Education Limited 2009. Created by Gregory Kuhlemeyer.
Actual IRR Solution Using Actual IRR Solution Using Your Financial CalculatorYour Financial Calculator
Steps in the Process (Part II)Step 10:For C04 Press 10000 Enter ↓ keysStep 11:For F04 Press 1 Enter ↓ keysStep 12:For C05 Press 7000 Enter ↓ keysStep 13:For F05 Press 1 Enter ↓ keys
Step 14: Press ↓ ↓ keys
Step 15: Press IRR key
Step 16: Press CPT key
Result: Internal Rate of Return = 11.47%

13.23 Van Horne and Wachowicz, Fundamentals of Financial Management, 13th edition. © Pearson Education Limited 2009. Created by Gregory Kuhlemeyer.
IRR Strengths IRR Strengths and Weaknessesand Weaknesses
StrengthsStrengths::
• Accounts for TVM
• Considers all cash flows
• Less subjectivity
WeaknessesWeaknesses: :
• Assumes all cash flows reinvested at the IRR
• Difficulties with project rankings and Multiple IRRs
13.24 Van Horne and Wachowicz, Fundamentals of Financial Management, 13th edition. © Pearson Education Limited 2009. Created by Gregory Kuhlemeyer.
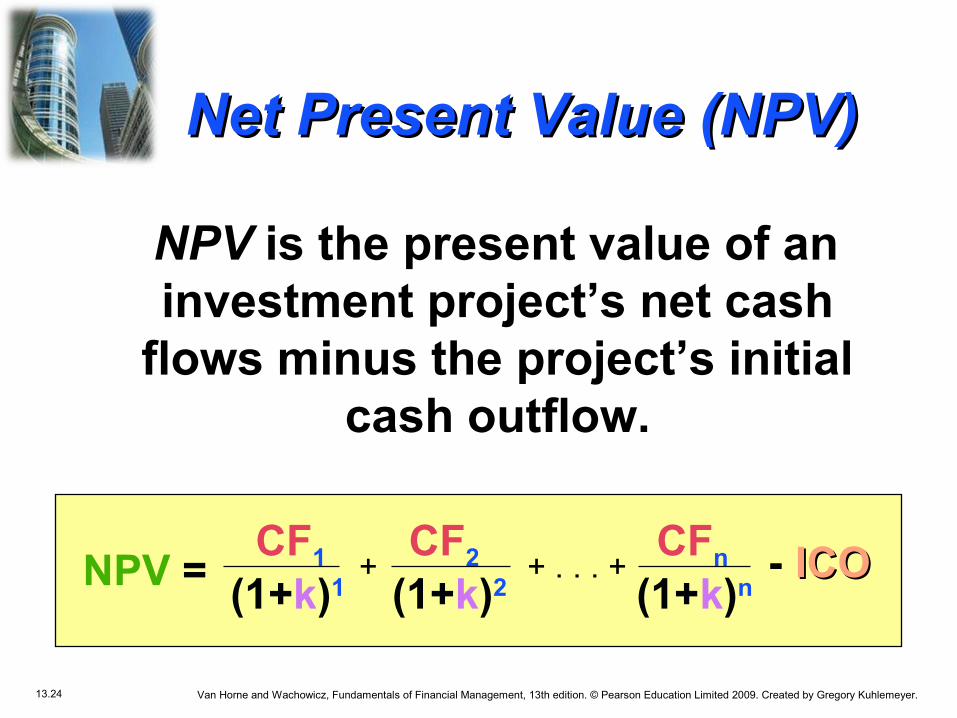
Net Present Value (NPV)Net Present Value (NPV)
NPV is the present value of an investment project’s net cash
flows minus the project’s initial cash outflow.
CF1 CF2 CFn (1+k)1 (1+k)2 (1+k)n
+ . . . ++ - ICOICONPV =

13.25 Van Horne and Wachowicz, Fundamentals of Financial Management, 13th edition. © Pearson Education Limited 2009. Created by Gregory Kuhlemeyer.
Basket Wonders has determined that the appropriate discount rate (k) for this
project is 13%.
$10,000 $7,000
NPV SolutionNPV Solution
$10,000 $12,000 $15,000 (1.13)1 (1.13)2 (1.13)3
+ +
+ - $40,000$40,000(1.13)4 (1.13)5
NPVNPV = +

13.26 Van Horne and Wachowicz, Fundamentals of Financial Management, 13th edition. © Pearson Education Limited 2009. Created by Gregory Kuhlemeyer.
NPV SolutionNPV Solution
NPVNPV = $10,000(PVIF13%,1) + $12,000(PVIF13%,2) + $15,000(PVIF13%,3) + $10,000(PVIF13%,4) + $ 7,000(PVIF13%,5) – $40,000$40,000
NPVNPV = $10,000(0.885) + $12,000(0.783) + $15,000(0.693) + $10,000(0.613) + $ 7,000(0.543) – $40,000$40,000
NPVNPV = $8,850 + $9,396 + $10,395 + $6,130 + $3,801 – $40,000$40,000
= - $1,428$1,428

13.27 Van Horne and Wachowicz, Fundamentals of Financial Management, 13th edition. © Pearson Education Limited 2009. Created by Gregory Kuhlemeyer.
NPV Acceptance CriterionNPV Acceptance Criterion
No! The NPV is negative. This means that the project is reducing shareholder
wealth. [Reject Reject as NPVNPV < 00 ]
The management of Basket Wonders has determined that the required
rate is 13% for projects of this type.
Should this project be accepted?

13.28 Van Horne and Wachowicz, Fundamentals of Financial Management, 13th edition. © Pearson Education Limited 2009. Created by Gregory Kuhlemeyer.
NPV on the CalculatorNPV on the Calculator
We will use the cash flow registry to solve
the NPV for this problem quickly and
accurately!
Hint: If you have not cleared the cash flows from your calculator, then you may skip to Step 15.

13.29 Van Horne and Wachowicz, Fundamentals of Financial Management, 13th edition. © Pearson Education Limited 2009. Created by Gregory Kuhlemeyer.
Actual NPV Solution Using Actual NPV Solution Using Your Financial CalculatorYour Financial Calculator
Steps in the ProcessStep 1: Press CF key
Step 2: Press 2nd CLR Work keys
Step 3: For CF0 Press -40000 Enter ↓ keys
Step 4: For C01 Press 10000 Enter ↓ keys
Step 5: For F01 Press 1 Enter ↓ keys
Step 6: For C02 Press 12000 Enter ↓ keys
Step 7: For F02 Press 1 Enter ↓ keys
Step 8: For C03 Press 15000 Enter ↓ keys
Step 9: For F03 Press 1 Enter ↓ keys
13.30 Van Horne and Wachowicz, Fundamentals of Financial Management, 13th edition. © Pearson Education Limited 2009. Created by Gregory Kuhlemeyer.
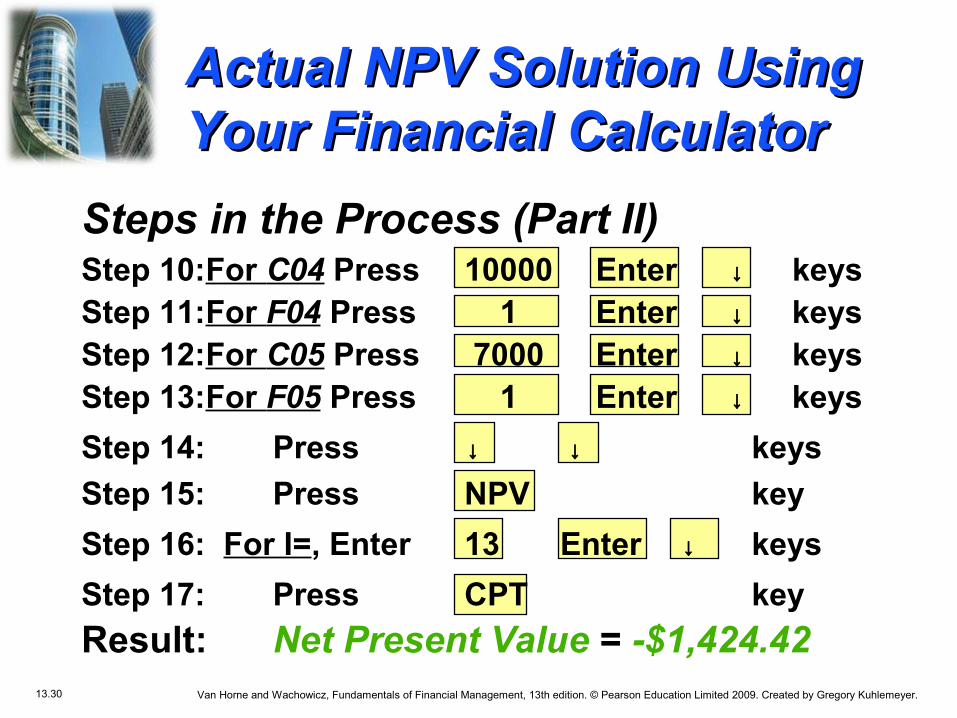
Steps in the Process (Part II)Step 10:For C04 Press 10000 Enter ↓ keysStep 11:For F04 Press 1 Enter ↓ keysStep 12:For C05 Press 7000 Enter ↓ keysStep 13:For F05 Press 1 Enter ↓ keys
Step 14: Press ↓ ↓ keys
Step 15: Press NPV key
Step 16: For I=, Enter 13 Enter ↓ keys
Step 17: Press CPT key
Result: Net Present Value = -$1,424.42
Actual NPV Solution Using Actual NPV Solution Using Your Financial CalculatorYour Financial Calculator

13.31 Van Horne and Wachowicz, Fundamentals of Financial Management, 13th edition. © Pearson Education Limited 2009. Created by Gregory Kuhlemeyer.
NPV Strengths NPV Strengths and Weaknessesand Weaknesses
StrengthsStrengths::
• Cash flows assumed to be reinvested at the hurdle rate.
• Accounts for TVM.
• Considers all cash flows.
WeaknessesWeaknesses::
• May not include managerial options embedded in the project. See Chapter 14.

13.32 Van Horne and Wachowicz, Fundamentals of Financial Management, 13th edition. © Pearson Education Limited 2009. Created by Gregory Kuhlemeyer.
Net Present Value ProfileNet Present Value Profile
Discount Rate (%)0 3 6 9 12 15
IRRNPV@13%
Sum of CF’s Plot NPV for eachdiscount rate.Three of these points are easy now!
Net
Pre
sen
t V
alu
e
$000s15
10
5
0
-4

13.33 Van Horne and Wachowicz, Fundamentals of Financial Management, 13th edition. © Pearson Education Limited 2009. Created by Gregory Kuhlemeyer.
Creating NPV Profiles Creating NPV Profiles Using the CalculatorUsing the Calculator
Hint: As long as you do not “clear” the
cash flows from the registry, simply start at Step 15 and enter a different discount rate. Each resulting NPV will provide a
“point” for your NPV Profile!

13.34 Van Horne and Wachowicz, Fundamentals of Financial Management, 13th edition. © Pearson Education Limited 2009. Created by Gregory Kuhlemeyer.
Profitability Index (PI)Profitability Index (PI)
PI is the ratio of the present value of a project’s future net cash flows to the project’s initial cash outflow.
CF1 CF2 CFn (1+k)1 (1+k)2 (1+k)n
+ . . . ++ ICOICOPI =
PI = 1 + [ NPVNPV / ICOICO ]
<< OR >>
Method #2:
Method #1:

13.35 Van Horne and Wachowicz, Fundamentals of Financial Management, 13th edition. © Pearson Education Limited 2009. Created by Gregory Kuhlemeyer.
PI Acceptance CriterionPI Acceptance Criterion
No! The PIPI is less than 1.00. This means that the project is not profitable.
[Reject Reject as PIPI < 1.001.00 ]
PIPI = $38,572 / $40,000
= .9643 (Method #1, previous slide)
Should this project be accepted?

13.36 Van Horne and Wachowicz, Fundamentals of Financial Management, 13th edition. © Pearson Education Limited 2009. Created by Gregory Kuhlemeyer.
PI Strengths PI Strengths and Weaknessesand Weaknesses
StrengthsStrengths::
• Same as NPV
• Allows comparison of different scale projects
WeaknessesWeaknesses::
• Same as NPV
• Provides only relative profitability
• Potential Ranking Problems

13.37 Van Horne and Wachowicz, Fundamentals of Financial Management, 13th edition. © Pearson Education Limited 2009. Created by Gregory Kuhlemeyer.
Evaluation SummaryEvaluation Summary
Method Project Comparison Decision
PBP 3.3 3.5 Accept
IRR 11.47% 13% Reject
NPV -$1,424 $0 Reject
PI .96 1.00 Reject
Basket Wonders Independent Project

13.38 Van Horne and Wachowicz, Fundamentals of Financial Management, 13th edition. © Pearson Education Limited 2009. Created by Gregory Kuhlemeyer.
Project Evaluation: Remember Project Evaluation: Remember Chapter 12 ‘New Asset’ project?Chapter 12 ‘New Asset’ project?
Discount rate: 16%PBP: 2.19IRR: 28.40%
NPV: 19,328.69$ PI: 1.26
Accept: Exceeds discount rate
Accept: Increase shareholder wealthAccept: Greater than 1.00
Accept: Assume want payback within 3 yrs
0 (75,000)$ (75,000)$
1 33,332$ (41,668)$ 2 36,446$ (5,222)$
3 28,147$ 22,925$ 4 37,075$ 60,000$
Cumulative CFYear Cash Flow We will start with the cash flows of the project and also
calculate the cumulative cash flow values.
We can use Excel functions / approaches to calculate each of the following methods from the above cash flows.

13.39 Van Horne and Wachowicz, Fundamentals of Financial Management, 13th edition. © Pearson Education Limited 2009. Created by Gregory Kuhlemeyer.
Other Project Other Project RelationshipsRelationships
• Mutually Exclusive Mutually Exclusive – A project whose acceptance precludes the acceptance of one or more alternative projects.
• DependentDependent – A project whose acceptance depends on the acceptance of one or more other projects.

13.40 Van Horne and Wachowicz, Fundamentals of Financial Management, 13th edition. © Pearson Education Limited 2009. Created by Gregory Kuhlemeyer.
Potential Problems Potential Problems Under Mutual ExclusivityUnder Mutual Exclusivity
A. Scale of InvestmentA. Scale of Investment
B. Cash-flow PatternB. Cash-flow Pattern
C. Project LifeC. Project Life
Ranking of project proposals may create contradictory results.

13.41 Van Horne and Wachowicz, Fundamentals of Financial Management, 13th edition. © Pearson Education Limited 2009. Created by Gregory Kuhlemeyer.
A. Scale DifferencesA. Scale Differences
Compare a small (S) and a large (L) project.
NET CASH FLOWSProject S Project LEND OF YEAR
0 -$100 -$100,000
1 0 0
2 $400 $156,250

13.42 Van Horne and Wachowicz, Fundamentals of Financial Management, 13th edition. © Pearson Education Limited 2009. Created by Gregory Kuhlemeyer.
A. Scale DifferencesA. Scale Differences
Calculate the PBP, IRR, NPV@10%, and PI@10%.
Which project is preferred? Why?
Project IRR NPV PI
S 100% $ 231 3.31
L 25% $29,132 1.29

13.43 Van Horne and Wachowicz, Fundamentals of Financial Management, 13th edition. © Pearson Education Limited 2009. Created by Gregory Kuhlemeyer.
A. Scale DifferencesA. Scale Differences
0 (100)$ (100,000)$ 1 -$ -$ 2 400$ 156,250$
Discount rate: 10%IRR: 100.00% 25.00%
NPV: 230.58$ 29,132.23$ PI: 3.31 1.29
BEST!!Greatest NPV
Rate NPV - Small NPV Large0% $300.00 $56,250.002% $284.47 $50,182.624% $269.82 $44,461.916% $256.00 $39,061.948% $242.94 $33,959.19
10% $230.58 $29,132.2312% $218.88 $24,561.5414% $207.79 $20,229.3016% $197.27 $16,119.2018% $187.27 $12,216.3220% $177.78 $8,506.9422% $168.74 $4,978.5024% $160.15 $1,619.41
Year CF - Small CF - Large
$0.00
$10,000.00
$20,000.00
$30,000.00
$40,000.00
$50,000.00
$60,000.00
$0.00
$50.00
$100.00
$150.00
$200.00
$250.00
$300.00
$350.00
0% 2% 4% 6% 8% 10% 12% 14% 16% 18% 20% 22% 24%
Axis Title
Graph the NPV Profiles for 'Small' and 'Large' projects
NPV - Small
NPV Large
Refer to VW13E-13b.xlsx on the ‘Scale’ tab.
Remember to refer to Excel spreadsheet ‘VW13E-13b.xlsx’ and the ‘Scale’ tab.

13.44 Van Horne and Wachowicz, Fundamentals of Financial Management, 13th edition. © Pearson Education Limited 2009. Created by Gregory Kuhlemeyer.
B. Cash Flow PatternB. Cash Flow Pattern
Let us compare a decreasing cash-flow (D) project and an increasing cash-flow (I) project.
NET CASH FLOWSProject D Project IEND OF YEAR
0 -$1,200 -$1,200 1 1,000 100
2 500 600
3 100 1,080
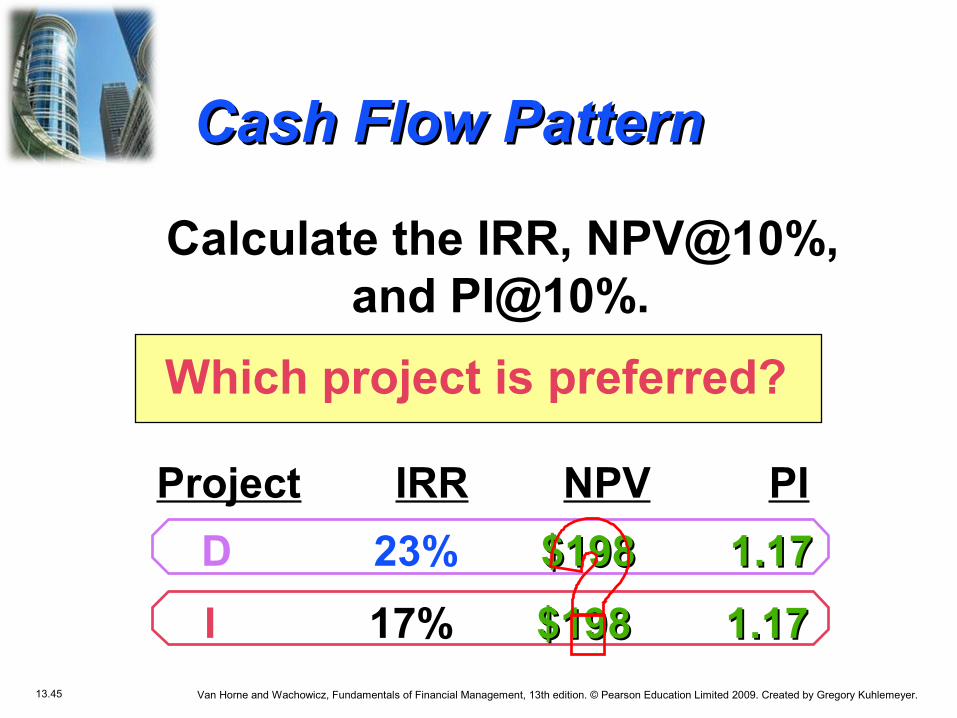
13.45 Van Horne and Wachowicz, Fundamentals of Financial Management, 13th edition. © Pearson Education Limited 2009. Created by Gregory Kuhlemeyer.
D 23% $198 1.17$198 1.17
I 17% $198 1.17$198 1.17
Cash Flow PatternCash Flow Pattern
Calculate the IRR, NPV@10%, and PI@10%.
Which project is preferred?
Project IRR NPV PI

13.46 Van Horne and Wachowicz, Fundamentals of Financial Management, 13th edition. © Pearson Education Limited 2009. Created by Gregory Kuhlemeyer.
Examine NPV ProfilesExamine NPV Profiles
Discount Rate (%)0 5 10 15 20 25-2
00
0
200
40
0
6
00
IRR
NPV@10%
Plot NPV for eachproject at various
discount rates.
Net
Pre
sen
t V
alu
e ($
)
Project IProject I
Project DProject D

13.47 Van Horne and Wachowicz, Fundamentals of Financial Management, 13th edition. © Pearson Education Limited 2009. Created by Gregory Kuhlemeyer.
Fisher’s Rate of IntersectionFisher’s Rate of Intersection
Discount Rate ($)0 5 10 15 20 25-2
00
0
200
400
60
0N
et P
rese
nt
Val
ue
($)
At k<10%, I is best!At k<10%, I is best! Fisher’s Fisher’s RateRate of ofIntersectionIntersection
At k>10%, D is best!At k>10%, D is best!

13.48 Van Horne and Wachowicz, Fundamentals of Financial Management, 13th edition. © Pearson Education Limited 2009. Created by Gregory Kuhlemeyer.
B. Cash Flow PatternB. Cash Flow Pattern
Refer to VW13E-13b.xlsx on the ‘Pattern’ tab.
0 (1,200)$ (1,200)$ 1 1,000$ 100$ 2 500$ 600$ 3 100$ 1,080$
Discount rate: 10%IRR: 22.79% 16.93%
NPV: 197.45$ 198.20$ PI: 1.16 1.17
BEST??Greatest NPV
Rate NPV - Decrease NPV Increase0% $400.00 $580.002% $355.21 $492.454% $312.72 $411.006% $272.36 $335.138% $233.98 $264.33
10% $197.45 $198.2012% $162.63 $136.3214% $129.42 $78.3716% $97.72 $24.0118% $67.41 ($27.02)20% $38.43 ($75.00)22% $10.67 ($120.15)24% ($15.92) ($162.69)
Year CF - Decrease CF - Increase
($200.00)
($100.00)
$0.00
$100.00
$200.00
$300.00
$400.00
$500.00
$600.00
$700.00
0% 2% 4% 6% 8% 10% 12% 14% 16% 18% 20% 22% 24%
NPV Profiles for two similar projects
NPV - Decrease
NPV Increase
Remember to refer to Excel spreadsheet ‘VW13E-13b.xlsx’ and the ‘Pattern’ tab.
13.49 Van Horne and Wachowicz, Fundamentals of Financial Management, 13th edition. © Pearson Education Limited 2009. Created by Gregory Kuhlemeyer.
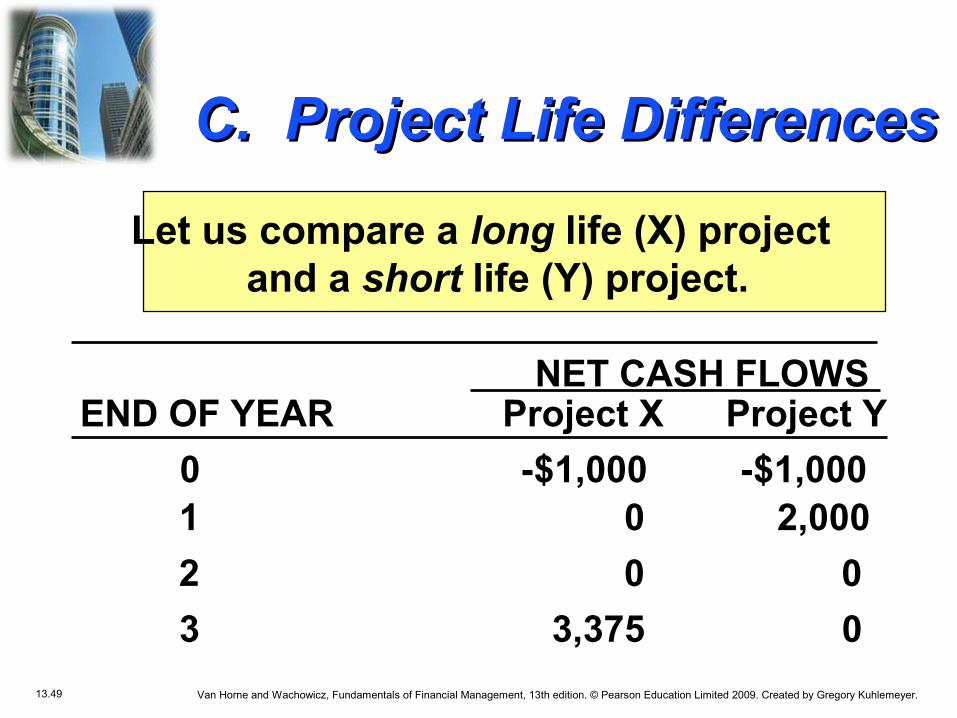
C. Project Life DifferencesC. Project Life Differences
Let us compare a long life (X) project and a short life (Y) project.
NET CASH FLOWSProject X Project YEND OF YEAR
0 -$1,000 -$1,000 1 0 2,000
2 0 0
3 3,375 0

13.50 Van Horne and Wachowicz, Fundamentals of Financial Management, 13th edition. © Pearson Education Limited 2009. Created by Gregory Kuhlemeyer.
X 50% $1,536 2.54
Y 100% $ 818 1.82
Project Life DifferencesProject Life Differences
Calculate the PBP, IRR, NPV@10%, and PI@10%.
Which project is preferred? Why?
Project IRR NPV PI

13.51 Van Horne and Wachowicz, Fundamentals of Financial Management, 13th edition. © Pearson Education Limited 2009. Created by Gregory Kuhlemeyer.
C. Project Life DifferencesC. Project Life Differences
Remember to refer to Excel spreadsheet ‘VW13E-13b.xlsx’ and the ‘Life’ tab.
0 (1,000)$ (1,000)$ 1 -$ 2,000$ 2 -$ -$ 3 3,375$ -$
Discount rate: 10%IRR: 50.00% 100.00%
NPV: 1,535.69$ 818.18$ PI: 2.54 1.82
BEST??Greatest NPV
Rate NPV - X NPV - Y0% $2,375.00 $1,000.002% $2,180.34 $960.784% $2,000.36 $923.086% $1,833.72 $886.798% $1,679.18 $851.85
10% $1,535.69 $818.1812% $1,402.26 $785.7114% $1,278.03 $754.3916% $1,162.22 $724.1418% $1,054.13 $694.9220% $953.13 $666.6722% $858.64 $639.3424% $770.14 $612.90
Year CF - X CF - Y
$0.00
$500.00
$1,000.00
$1,500.00
$2,000.00
$2,500.00
0% 2% 4% 6% 8% 10% 12% 14% 16% 18% 20% 22% 24%
NPV Profiles for X and Y - neither repeated
NPV - X
NPV - Y

13.52 Van Horne and Wachowicz, Fundamentals of Financial Management, 13th edition. © Pearson Education Limited 2009. Created by Gregory Kuhlemeyer.
Another Way to Another Way to Look at ThingsLook at Things
1. Adjust cash flows to a common terminal year if project “Y” will NOTNOT be replaced.
Compound Project Y, Year 1 @10% for 2 years.
Year 0 1 2 3
CF –$1,000 $0 $0 $2,420
Results: IRR* = 34.26% NPV = $818
*Lower IRR from adjusted cash-flow stream. X is still Best.

13.53 Van Horne and Wachowicz, Fundamentals of Financial Management, 13th edition. © Pearson Education Limited 2009. Created by Gregory Kuhlemeyer.
Replacing Projects Replacing Projects with Identical Projectswith Identical Projects
2. Use Replacement Chain Approach (Appendix B) when project “Y” will be replaced.
0 1 2 3
––$1,000 $2,000$1,000 $2,000 – –1,000 $2,0001,000 $2,000
– –1,000 $2,0001,000 $2,000
––$1,000 $1,000 $1,000 $2,000$1,000 $1,000 $1,000 $2,000
Results: IRR = 100% NPV*NPV* = $2,238.17$2,238.17
*Higher NPV, but the same IRR. Y is BestY is Best.

13.54 Van Horne and Wachowicz, Fundamentals of Financial Management, 13th edition. © Pearson Education Limited 2009. Created by Gregory Kuhlemeyer.
C. Project Life DifferencesC. Project Life Differences
Remember to refer to Excel spreadsheet ‘VW13E-13b.xlsx’ and the ‘Life2’ tab.
Year 0 Year 1 Year 2 Year 3-1000 2000
0 (1,000)$ (1,000)$ -1000 20001 -$ 1,000$ -1000 20002 -$ 1,000$ -1000 1000 1000 20003 3,375$ 2,000$
Discount rate: 10%IRR: 50.00% 100.00%
NPV: 1,535.69$ 2,238.17$ PI: 2.54 3.24
BEST??Greatest NPV
Rate NPV - X NPV - Y0% $2,375.00 $3,000.002% $2,180.34 $2,826.214% $2,000.36 $2,664.096% $1,833.72 $2,512.638% $1,679.18 $2,370.93
10% $1,535.69 $2,238.1712% $1,402.26 $2,113.6114% $1,278.03 $1,996.6016% $1,162.22 $1,886.5518% $1,054.13 $1,782.9020% $953.13 $1,685.1922% $858.64 $1,592.9524% $770.14 $1,505.79
Year CF - X CF - Y
$0.00
$500.00
$1,000.00
$1,500.00
$2,000.00
$2,500.00
$3,000.00
$3,500.00
0% 2% 4% 6% 8% 10% 12% 14% 16% 18% 20% 22% 24%
NPV Profiles for X and Y-repeated
NPV - X
NPV - Y
13.55 Van Horne and Wachowicz, Fundamentals of Financial Management, 13th edition. © Pearson Education Limited 2009. Created by Gregory Kuhlemeyer.
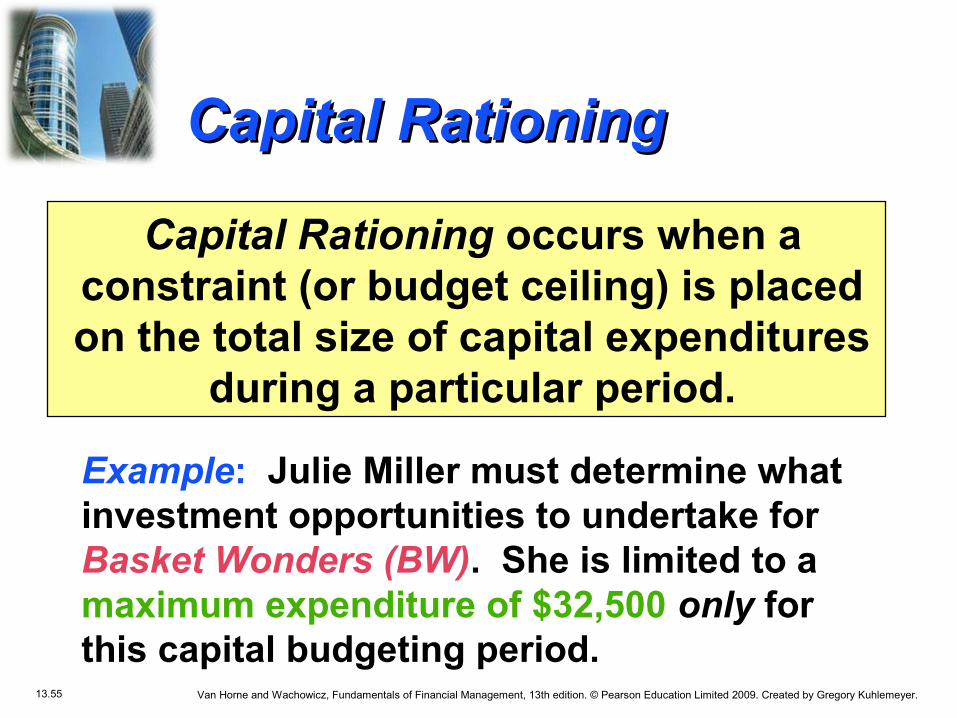
Capital RationingCapital Rationing
Capital Rationing occurs when a constraint (or budget ceiling) is placed on the total size of capital expenditures
during a particular period.
Example: Julie Miller must determine what investment opportunities to undertake for Basket Wonders (BW). She is limited to a maximum expenditure of $32,500 only for this capital budgeting period.
13.56 Van Horne and Wachowicz, Fundamentals of Financial Management, 13th edition. © Pearson Education Limited 2009. Created by Gregory Kuhlemeyer.
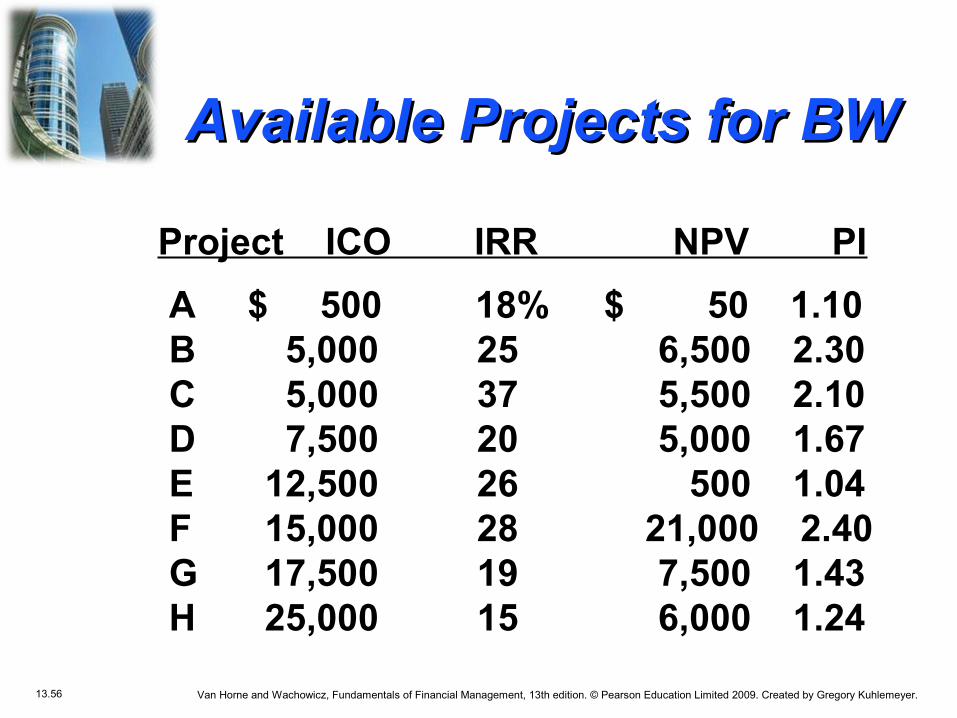
Available Projects for BWAvailable Projects for BW
Project ICO IRR NPV PI
A $ 500 18% $ 50 1.10 B 5,000 25 6,500 2.30 C 5,000 37 5,500 2.10 D 7,500 20 5,000 1.67 E 12,500 26 500 1.04 F 15,000 28 21,000 2.40 G 17,500 19 7,500 1.43 H 25,000 15 6,000 1.24

13.57 Van Horne and Wachowicz, Fundamentals of Financial Management, 13th edition. © Pearson Education Limited 2009. Created by Gregory Kuhlemeyer.
Choosing by IRRs for BWChoosing by IRRs for BW
Project ICO IRR NPV PI
C $ 5,000 37% $ 5,500 2.10 F 15,000 28 21,000 2.40 E 12,500 26 500 1.04 B 5,000 25 6,500 2.30
Projects C, F, and E have the three largest IRRs.
The resulting increase in shareholder wealth is $27,000 with a $32,500 outlay.

13.58 Van Horne and Wachowicz, Fundamentals of Financial Management, 13th edition. © Pearson Education Limited 2009. Created by Gregory Kuhlemeyer.
Choosing by NPVs for BWChoosing by NPVs for BW
Project ICO IRR NPV PI
F $15,000 28% $21,000 2.40 G 17,500 19 7,500 1.43 B 5,000 25 6,500 2.30
Projects F and G have the two largest NPVs.
The resulting increase in shareholder wealth is $28,500 with a $32,500 outlay.

13.59 Van Horne and Wachowicz, Fundamentals of Financial Management, 13th edition. © Pearson Education Limited 2009. Created by Gregory Kuhlemeyer.
Choosing by PIs for BWChoosing by PIs for BW
Project ICO IRR NPV PI
F $15,000 28% $21,000 2.40B 5,000 25 6,500 2.30 C 5,000 37 5,500 2.10 D 7,500 20 5,000 1.67 G 17,500 19 7,500 1.43
Projects F, B, C, and D have the four largest PIs.
The resulting increase in shareholder wealth is $38,000 with a $32,500 outlay.

13.60 Van Horne and Wachowicz, Fundamentals of Financial Management, 13th edition. © Pearson Education Limited 2009. Created by Gregory Kuhlemeyer.
Summary of ComparisonSummary of Comparison
Method Projects Accepted Value Added
PI F, B, C, and D $38,000
NPV F and G $28,500
IRR C, F, and E $27,000
PIPI generates the greatestgreatest increaseincrease in shareholder wealth shareholder wealth when a limited capital
budget exists for a single period.

13.61 Van Horne and Wachowicz, Fundamentals of Financial Management, 13th edition. © Pearson Education Limited 2009. Created by Gregory Kuhlemeyer.
Single-Point Estimate Single-Point Estimate and Sensitivity Analysisand Sensitivity Analysis
• Allows us to change from “single-point” (i.e., revenue, installation cost, salvage, etc.) estimates to a “what if” analysis
• Utilize a “base-case” to compare the impact of individual variable changes• E.g., Change forecasted sales units to see
impact on the project’s NPV
Sensitivity AnalysisSensitivity Analysis: A type of “what-if” uncertainty analysis in which variables or assumptions are changed from a base case in order to determine their impact on a project’s measured results (such as NPV or IRR).
13.62 Van Horne and Wachowicz, Fundamentals of Financial Management, 13th edition. © Pearson Education Limited 2009. Created by Gregory Kuhlemeyer.
Post-Completion AuditPost-Completion Audit
Post-completion Audit
A formal comparison of the actual costs and benefits of a project with original estimates.
• Identify any project weaknesses
• Develop a possible set of corrective actions
• Provide appropriate feedback
Result: Making better future decisions!

13.63 Van Horne and Wachowicz, Fundamentals of Financial Management, 13th edition. © Pearson Education Limited 2009. Created by Gregory Kuhlemeyer.
Multiple IRR Problem*Multiple IRR Problem*
Two!! Two!! There are as many potential IRRs as there are sign changes.
Let us assume the following cash flow pattern for a project for Years 0 to 4:
–$100 +$100 +$900 –$1,000
How many How many potentialpotential IRRs could this IRRs could this project have?project have?
* Refer to Appendix A

13.64 Van Horne and Wachowicz, Fundamentals of Financial Management, 13th edition. © Pearson Education Limited 2009. Created by Gregory Kuhlemeyer.
NPV Profile – Multiple IRRsNPV Profile – Multiple IRRs
Discount Rate (%)0 40 80 120 160 200
Ne
t P
res
ent
Va
lue
($00
0s)
Multiple IRRs atk k = 12.95%12.95% and 191.15%191.15%
75
50
25
0
–100

13.65 Van Horne and Wachowicz, Fundamentals of Financial Management, 13th edition. © Pearson Education Limited 2009. Created by Gregory Kuhlemeyer.
NPV Profile – Multiple IRRsNPV Profile – Multiple IRRs
Hint: Your calculator will only find ONE IRR – even if there
are multiple IRRs. It will give you the
lowest IRR. In this case, 12.95%.